
- 1 Research Group Systems Biology/Bioinformatics, Leibniz Institute for Natural Product Research and Infection Biology – Hans Knöll Institute, Jena, Germany
- 2 Institute of Immunology, Jena University Hospital – Friedrich Schiller University Jena, Jena, Germany
Characterization of the response of the host immune system is important in understanding the bidirectional interactions between the host and microbial pathogens. For research on the host site, flow cytometry has become one of the major tools in immunology. Advances in technology and reagents allow now the simultaneous assessment of multiple markers on a single cell level generating multidimensional data sets that require multivariate statistical analysis. We explored the explanatory power of the supervised machine learning method called “induction of decision trees” in flow cytometric data. In order to examine whether the production of a certain cytokine is depended on other cytokines, datasets from intracellular staining for six cytokines with complex patterns of co-expression were analyzed by induction of decision trees. After weighting the data according to their class probabilities, we created a total of 13,392 different decision trees for each given cytokine with different parameter settings. For a more realistic estimation of the decision trees’ quality, we used stratified fivefold cross validation and chose the “best” tree according to a combination of different quality criteria. While some of the decision trees reflected previously known co-expression patterns, we found that the expression of some cytokines was not only dependent on the co-expression of others per se, but was also dependent on the intensity of expression. Thus, for the first time we successfully used induction of decision trees for the analysis of high dimensional flow cytometric data and demonstrated the feasibility of this method to reveal structural patterns in such data sets.
1. Introduction
Flow cytometry is a fundamental technology in immunology. It allows the identification of cell populations as well as functional properties of immune cells with high speed and precision. Because of its ability to analyze thousands of cells per second, this technique is key for the study of immune cell population dynamics in the context of microbial infection or autoimmune disease. Recent advances in flow cytometry instrumentation and reagents provide researchers now with the capability to assess simultaneously multiple phenotypic and functional markers on a single cell level (Perfetto et al., 2004). Assessment of multiple phenotypic and functional markers gives the opportunity for a comprehensive single cell analysis, but the resulting data sets are quite complex. Therefore, the gap between generation of such data and our understanding of it is growing. Conventional analysis approaches are based on filtering of populations (subsets) of interest and subsequent analysis of the expression of certain markers within these populations. This, however, often neglects the multidimensionality of the data. If, for example, the expression of n markers is analyzed in a given subpopulation, the resulting dataset has n dimensions. Using color-coded representation of the third dimension, three different parameters can be displayed in a two-dimensional dot-plot (Roederer and Moody, 2008). However, analysis of data sets with more than three dimensions is heavily impaired by our limited capability to integrate information from more than three dimensions and biased by the experience of the researcher, leaving some information unexploited. By using machine learning methods commonly used in data mining, it should be possible to automate analysis, preclude the operator-introduced bias and reveal structural patterns of the data which would have been unrecognized with conventional approaches (Sachs et al., 2005). Machine learning methods learn decision rules from training data sets to classify new, unknown data sets and thereby can describe the structural patterns contained in the data. Machine learning methods are divided into supervised and unsupervised methods. For supervised learning methods a label (also referred to as a class) is known for the training data set, for instance the outcome of a medical treatment depending on clinical or laboratory parameters. For unsupervised methods a known outcome is not used. In flow cytometry a training data set can be considered as a collection of analyzed cells with its different expression values for a set of markers (attributes) and an outcome (class label). For instance, a class could be defined by the absence or the presence of a given marker which could be dependent on the expression of the other measured markers. Thus, by supervised machine learning methods the dependency of the expression of one marker on the expression of other markers can be analyzed. A supervised method with an easily understandable graphical representation is the induction of decision trees. Basically, decision trees represent the structural patterns of the data. Beginning at the root, the data set is split at each node according to a marker and a split value is assigned to this node. At each node, the marker and the split value is chosen to maximize a split criterion. In this way the cells are routed down the tree and reach a specific leaf, which gives a classification. The aim of our study was to test the feasibility of this approach for the identification of structural patterns in flow cytometric data. We used data sets from experiments where the expression of six cytokines in antigen-specific T helper (Th) cells from a murine arthritis model were analyzed (Schubert et al., 2004; Frey et al., 2010b). Our results show that the supervised machine learning method induction of decision trees is a versatile tool for identification of structural patterns in multidimensional data obtained by flow cytometry.
2. Materials and Methods
2.1. Data Generation and Acquisition
We used a data set from intracellular cytokine staining of activated Th cells (Frey et al., 2011b). The cells were stained and analyzed for the expression of six cytokines as described in the following. DBA/1 mice in the age of 6–12 weeks were subcutaneously immunized at the base of the tail with recombinant glucose-6-phosphate isomerase (G6PI) in an emulsion containing also Freunds complete adjuvant as described (Bruns et al., 2009; Frey et al., 2010a,b, 2011a,b). At day 21 after immunization, the draining lymph nodes (inguinal, axillary, paraaortic) were aseptically removed and prepared to a single cell suspension. In addition, beside the wild type DBA/1 mice (WT) also interferon-gamma (IFN-γ) receptor knock-out DBA/1 mice (KO) were analyzed (Frey et al., 2011b) and we performed the analyses also for other time points (day 9 and day 21 after immunization). Altogether, we studied four conditions: WT-day 21 (standard condition) as well as the additional conditions WT-day 9, KO-day 21, and KO-day 9. The additional conditions have only been applied for the results shown in Figures 10–12 for a comparative study and to investigate the robustness of the results against experimental variations. For detection of antigen-specific cells by their CD154 expression (Kirchhoff et al., 2007), cells (1 × 10⁷/ml in a 48 well plate) were restimulated with 20 μg/ml G6PI. Control samples were left unstimulated. The total restimulation time was 6 h and Brefeldin A (Sigma) at 5 μg/ml was added to all samples for the last 4 h to block cytokine secretion and to stabilize CD154 expression. These assay conditions have been determined to be optimal for a simultaneous detection of CD154 expression and cytokine production in antigen-specific CD4+ T helper cells. At the end of the restimulation period, cells were washed with ice-cold phosphate-buffered saline (PBS) and incubated with the fixable amine-reactive Aqua viability stain (Invitrogen) for 30 min on ice, fixed with 2% paraformaldehyde in PBS and permeabilized with 0.5% Saponin/0.5% BSA/0.02% NaN3 in PBS. Non-specific binding of antibodies was blocked by preincubation of the cells with anti-CD16/32 (2.4G2) and rat IgG (both at 5 μg/ml) for 8 min, followed by staining with fluorochrome-conjugated mAbs against CD4, CD154, GM-CSF, TNF-α, RANKL, IL-2, IL-17, and IFN-γ (all from BD, eBiosciences, Biolegend, or Miltenyi Biotech). For optimal staining results all antibodies were properly titrated and the binding of the anti-CD4 antibody to fixed and permeabilized cells was verified. After an additional washing step 0.5% Saponin/0.5% BSA/0.02% NaN3 in PBS, cells were resuspended in 0.5% BSA/0.02% NaN3 in PBS and measured within 3 h after staining. Cell analysis was performed on a BD LSR II flow cytometer equipped with 405, 488, and 633 nm laser lines and standard filter sets, except additional detectors for detection of Alexa-700 (red laser, 685 nm long-pass and 710/50 band-pass filters) and Qdot655 (violet laser, 635 nm long-pass and 670/14 band-pass filters, not used for this study). For fluorescence standardization and monitoring of the instrument performance, the cytometer setup, and tracking module of the BD FACSDiVa was used. Compensation for spectral overlap of the fluorochromes was done with the use of singly stained BD CompBeads and a compensation matrix was calculated using the BD FACSDiVa software. At least 1.5 million events were acquired.
2.2. Data Pre-Processing
For analysis, data were exported as FCS3.0 files. Further pre-processing was done using FlowJo 8.1.1 (Treestar Inc., Ashland, Oregon). For identification of antigen-specific cells the following progressive filtering (also referred to as gating) strategy was used: events were first filtered on a FSC-A vs. FSC-W plot (forward scatter pulse area vs. pulse width) for the exclusion of doublets. Thereafter, a filter was set on lymphocyte in FSC-A vs. SSC-A plot (side scatter pulse area), followed by the exclusion of aqua+ dead cells. Subsequently, cells were filtered for CD4-positive events. The small compartment of antigen-specific T cells was identified by their expression of CD154. The filter for CD154 expression was set using unstimulated control samples. Only the filtered CD154+ events were than exported into a new data file. These resulting data files containing the events from single animals were than concatenated into a single file containing data from four mice and were used for further analyses. This electronic pooling of the data was performed in order to have a sufficient number of cells for further analysis by machine learning methods. The distributions of MFI values for each cytokines were compared between the four biological replicates which were pooled for further analysis. By visual comparison the variance was assessed.
2.3. Data Analysis
The data analysis was performed using the programming language and statistical software R (R Development Core Team, 2009). To read in the pre-processed FACS data set the R/Bioconductor package flowCore was used (Data File Standards Committee of the Society for Analytical Cytology, 1990; Gentleman et al., 2004; Hahne et al., 2009). The intensity of the staining was measured as mean fluorescence intensity (MFI) value. To distinguish between specifically stained cells and background fluorescence we used appropriate controls, including unstimulated samples and fluorescence-minus-one controls (Hulspas et al., 2009). We defined this MFI value as a cut-off and considered a cell as positive for a given cytokine if their MFI exceeded this cut-off value and cells with a MFI values below this cut-off value are referred to as cytokine-negative cells.
For the induction of decision trees we used the WEKA java implementation J48 of the C4.5 algorithm of Quinlan in revision 8 (Quinlan, 1993; Witten and Frank, 2005) through an interface provided by the R package RWeka (Hornik et al., 2009). Since the outcome of the induction of a decision tree is highly dependent on the parameter setting and since it is not known which parameters are the best, our approach is to build decision trees for different parameter settings, to compare their quality and choose the best tree according to some quality criteria. We therefore varied the following parameters:
• pruning (reduced error pruning vs. heuristic or no pruning)
• minimum size of data in each leaf
• exclusion of one or more cytokines for the induction of decision trees (like a brute-force way of feature selection)
• exclusion of cytokine-negative cells
Cytokine-negative cells are cells which are not stained specifically for any cytokine. Their MFI values for each cytokine are under the experimentally determined threshold for cytokine production. Thus they produce none of the measured cytokines. We created decision trees with and without cytokine-negative cells to test if the presence of these cells has an effect on the quality of the decision trees.
Due to the fact that decision trees work best with balanced data (Weiss and Provost, 2003; Sun et al., 2007), the data was also weight according to the class probabilities (CostSensitiveClassifier Class of WEKA).
To choose one tree we applied different quality criteria on stratified fivefold cross validation results in a stepwise manner:
1. choose all trees whose G-mean (definition see below) is maximal 5% below the best G-mean
2. choose all trees of these with ROC AUC greater than 80%, if values greater than 80% exist
3. choose all trees of these whose F-mean (definition see below) is maximal 5% below the best F-mean of these
4. choose the smallest of these trees
G-mean is the geometric mean of the TP rate and the TN rate. TP (true positive) and TN (true negative) rate is the proportion of the positive cells which were correctly classified as positive (also called sensitivity and recall) or as negative (also called specificity), respectively. We used both values, since we assess both as equally important, and the geometric mean, since this mean gives the smaller value more weight than the arithmetic mean. This helps to filter out trees where only either the TP rate or TN rate is good. The name G-mean was introduced by Kubat et al. (1998). G-mean is the geometric mean of the TP rate and the TN rate. TP (true positive) and TN (true negative) rate is the proportion of the positive cells which were correctly classified as positive (also called sensitivity and recall) or as negative (also called specificity), respectively. We used both values, since we assess both as equally important, and the geometric mean, since this mean gives the smaller value more weight than the arithmetic mean. This helps to filter out trees where only either the TP rate or TN rate is good. The name G-mean was introduced by Kubat et al. (1998). For the same reason we used the geometric mean of the F-measures. The F-measure combines the precision and the recall, where precision is the fraction of cells correctly classified as positive. We calculate the F-measure for the class positives and also an F-measure for the class negatives and determined the geometric mean of both, called F-mean.
Decision trees route data (cells) down the tree, starting at the top (root), ending at the colored boxes (leaves). Leaves classify the cells either as positive (green) or negative (red). This classification can be correct or incorrect. To decide which route is taken by a cell, the attribute values (MFI values of the other cytokines) are compared to the split values at the branch. The names in the white boxes (inner nodes) state the attribute to which this split value has to be applied to. Additional each node contains the number of cells in the data set, which were routed to this inner node. To ease the analysis of the decision trees and to avoid many look ups at the raw data sets we included some additional information in the raw decision trees. First, we visualized the experimentally determined cut-off values of a cytokine as a further attribute at the corresponding node to allow for a simple assessment between the split value and the cut-off value. Cut-off values are colored in green if the split value is close to the cut-off value, and red or blue if the split value is below or above the cut-off value, respectively. Second, we visualized in each leaf the proportion of positive (or negative) cells in this leaf on all positive (or negative) cells. This allows for an easy assessment of the importance of a particular leave in the overall classification.
3. Results
Figure 1 shows the filtering of the raw data. The resulting data set of antigen-specific activated T helper (Th) cells contains measurements for the six cytokines TNF-α, RANKL, IL-17, IL-2, IFN-γ, and GM-CSF. The intensity of the staining for this cytokines was measured as mean fluorescence intensity (MFI) value. The variance of the MFI values for the same conditions was found to be low as assessed for four biological replicates (Figure 2). As shown in Figure 3A a huge proportion of antigen-specific activated Th cells (71%) produced TNF-α, followed by expression of RANKL, IL-17, IL-2, IFN-γ, and GM-CSF. Of note, the sum of these cells exceeds 100% because of the co-expression of two or more cytokines which is shown in Figure 3B. We found a strong co-expression of TNF-α together with GM-CSF, IFN-γ, and IL-17 (first row in Figure 3B), whereas for IL-2 and RANKL this association was lower. There was also a huge proportion of cells (58.65%) which produced only TNF-α and no other cytokines. A strong association was also seen between GM-CSF, IFN-γ, and RANKL (58.25 and 49.51%, respectively, column GM-CSF in Figure 3B). In other cases the co-expression was surprisingly low, for instance only 2.58% of the IL-2 positive cells also co-produced GM-CSF. However, such pair-wise comparisons are limited because they neglect the possibility that the expression of a certain cytokine could be dependent of the co-expression of two or more cytokines simultaneously. To study the dependencies of the co-expression patterns of cytokines we formed a data set for each cytokine, with the expression of this cytokine as the class and with the measurements of the five remaining cytokines as attributes. We considered cells as positive for a given cytokine according to the cut-off value defined by our biological and staining control samples. Since the data sets were highly imbalanced (for instance only 1.4% of all cells produce GM-CSF, see Figure 3A) we weighted the data according to the class probabilities (extitCostSensitiveClassifier Class of WEKA). The resulting data sets were used to build decision trees to test if the graphical representation of the decision trees can reveal structural patterns in the data. This approach yielded 13,392 different decision trees for each given cytokine. We assumed that if a decision tree gives a good classification, the structure of the decision tree reflect reasonable patterns of co-expression. We therefore aimed at the identification of the best decision tree out of the 13,392 generated for each cytokine.
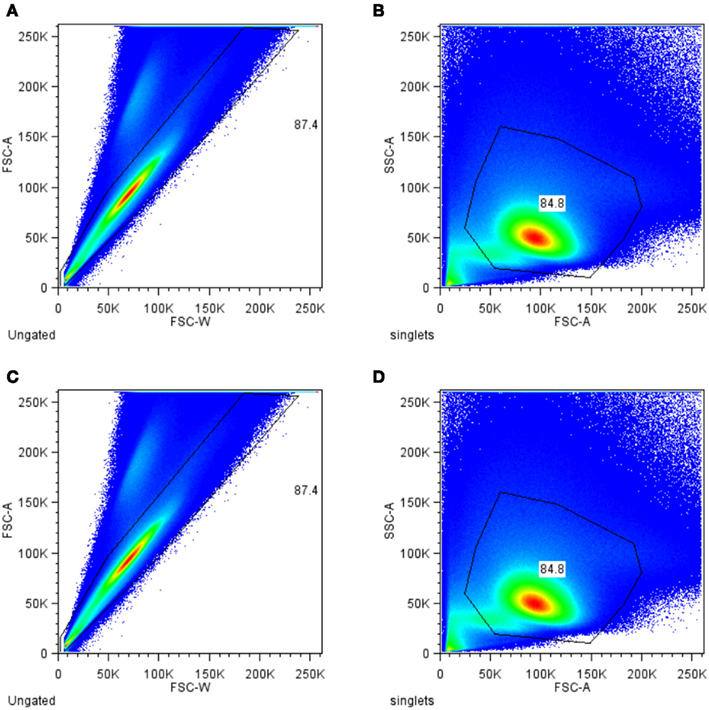
Figure 1. Progressive filtering (gating) strategy for identification of antigen-specific T helper cells. Total events measured were filtered (gated) for single cell (A) and for lymphocytes (B). To exclude dead cells aqua dye positive cells were excluded from further analysis (C). The remaining cells were further selected for CD4 (D).
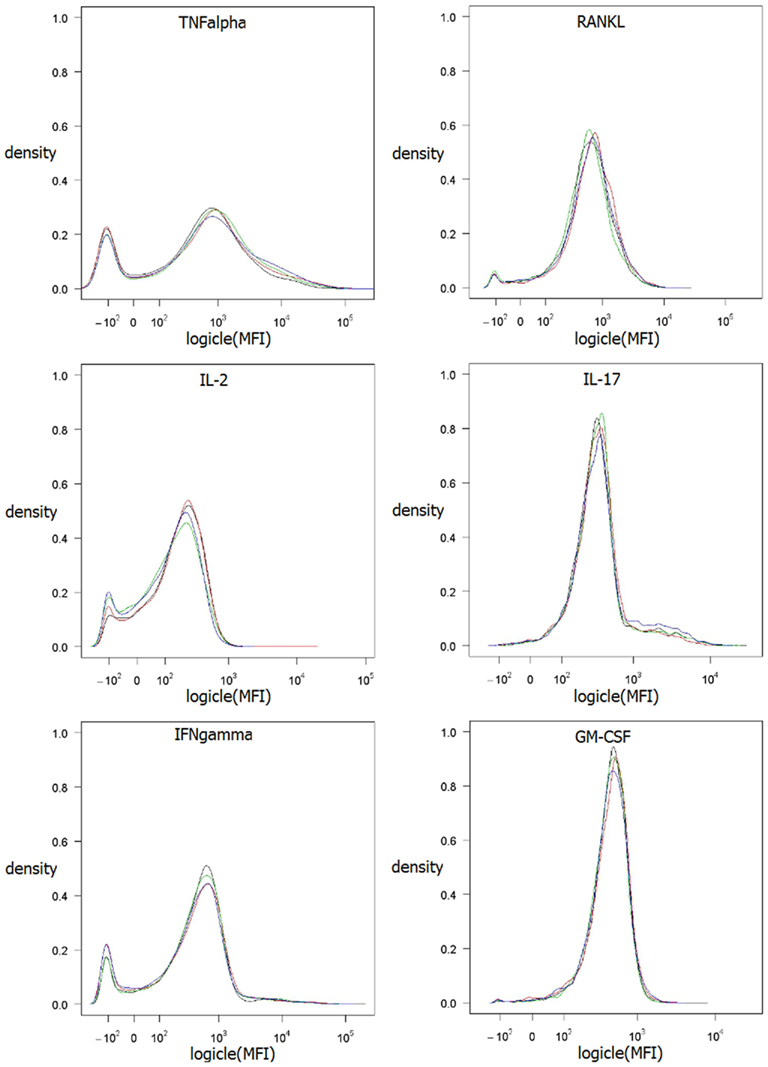
Figure 2. Kernel density estimation of MFI values of the four biological replicates. Method density from R (R Development Core Team, 2009) was used with default parameter settings. Data values are logicle transformed according to Parks et al. (2006) using flowCore (Hahne et al., 2009).
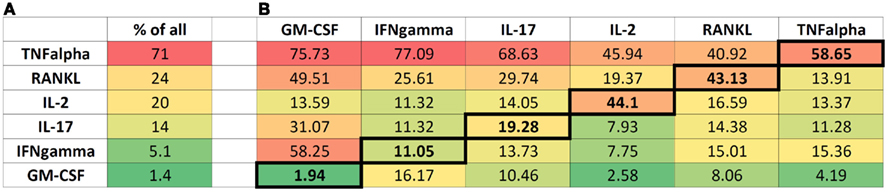
Figure 3. Cytokine expression by antigen-activated T helper cells. Expression of the cytokines TNF-α, RANKL, IL-2, IL-17 IFN-γ, and GM-CSF was measured in lymph node cells as described in section 2. Data depict the proportion of activated cells (identified by expression of the marker CD154) that produce the indicated cytokine (A). As the cells can express multiple cytokines simultaneously, pair-wise co-expression patterns of cytokines are shown in (B). The primary cytokines are listed from left to right as the column names. For each primary cytokine the percentage of cells co-expressing one of the other cytokines (listed as row names) are shown. As an example GM-CSF expressing cells often co-express TNF-α (75.73% of all GM-CSF expressing cells) but only rarely IL-2 (13.59%). (Green background = low co-expression, red background = high co-expression).
With the approach explained in the section 3 we chose the “best” tree for every cytokine out of the many trees which were build with different parameter settings.
For instance, the tree of IL-2 (Figure 4) is to be read as followed:
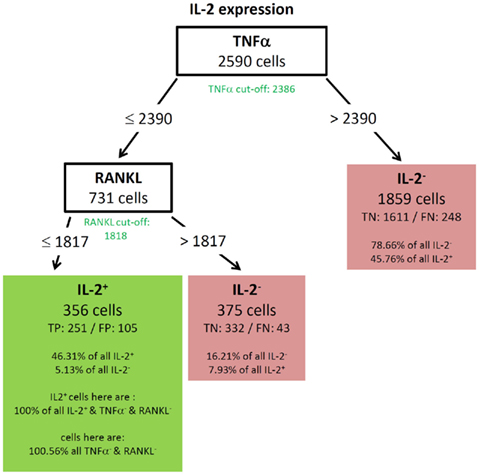
Figure 4. Best decision tree for the classification of cells as positive or negative for IL-2 expression. Cells are classified based on the MFI values of first TNF-α and second RANKL. The green colored cut-off values below the inner nodes, indicate that the split values are near the cut-off values. Therefore, these nodes dived the cells in TNF-α (respectively RANKL) negative and positive cells. The cells are routed to the right leaf if they do not express TNF-α. This leaf captures 78.66% of all IL-2 negative cells, but also 45.76% of the IL-2 positive cells. The leaf in the middle classifies cells as IL-2 negative, which do not express TNF-α but RANKL. The left node classifies cells as IL-2 positive and captures 46.31% of the IL-2 positive cells. It is stated that this node contains 100.56% of the TNF-α and RANKL negative cells. Thus, also cells which are positive for TNF-α and/or RANKL are in this leaf. This is due to the split values of TNF-α. The split value is slightly above the real cut-off, therefore a few TNF-α positive cells have been routed to the left and are therefore contained in the leftmost leaf. Since the split value of RANKL is below the cut-off value, no RANKL positive cells can be contained in the leftmost leaf.
For this decision only cells with expression of at least one cytokine were used. The tree thus begins with 2590 cells at the root. Based on the MFI value of the root attribute TNF-α the 2590 cells are routed down the tree. If the TNF-α MFI value of a cell is equal or below the split value 2390, the cells are routed to the inner left node. Otherwise the cells are routed down to the right leaf which classifies 1859 cells as IL-2 negative. This classification is correct for 1611 cells, they are true negative (TN). For 248 cells this classification is wrong, they are false negative (FN). Further information in this leave show that the leaf captures 78.66% of the IL-2 negative cells and 45.76% of the IL-2 positive cells. Due to the imbalance of the data set there is a high percentage of the IL-2 positive cells in this leaf, but only a small number of false negative cells. 20% of all measured cells produce IL-2 (see Figure 3A). The inner node splits the cells based on the MFI value of RANKL and routes them to the right leaf if the RANKL MFI value is above the split value of 1817. This leaf classifies the cells again as IL-2 negative. If the RANKL MFI value is equal or below the split value, they are routed to the left leaf, which classifies these cells as IL-2 positive. This leaf contains 356 cells, of which 251 are classified correctly as positive (true positive – TP) and 105 are wrongly classified as positive (false positive – FN). This leaf than contains 46.31% of the IL-2 positive cells and 5.13% of the IL-2 negative cells. Furthermore, the split values of TNF-α and RANKL capture all cells which are negative for TNF-α and RANKL but positive for IL-2. Therefore, the split values have to be so low that they do not route cells down to this leaf which express RANKL or TNF-α. This is indeed true since the split values are very close to the experimentally determined cut-off values of these cytokines. The experimentally determined cut-off values are shown below the root and inner nodes, the green color indicates that the split values are close to the cut-off value. Finally, the proportion of RANKL and TNF-α negative cells in this leaf exceeds 100%. Thus, it is clear that there are few cells in this leave which are positive for TNF-α, RANKL, or both. A closer comparison of the split values and cut-off values reveal that these cells can only be TNF-α and not RANKL positive, since the split value of TNF-α is slightly above the cut-off value, but the split value of RANKL is slightly below the cut-off value.
All resulting decision trees (besides the tree of IL-17) were of sufficient quality to reveal meaningful structural patterns. This implies that there are associations between the expressions of different cytokines. An interesting common finding for the decision trees for TNF-α (Figure 5) and IL-2 (Figure 4) was the fact that the chosen split thresholds of all used cytokines (RANKL, IL-2 respectively TNF-α, RANKL) were close to the experimentally determined cut-off value of these cytokines. These finding suggests that the expression (or non-expression) of TNF-α and IL-2 depends on if the other cytokines are expressed or not. Interestingly, there was an inverse relationship between the cytokines: no expression of RANKL and IL-2 classified cells as positive for TNF-α (Figure 5). Similarly, no expression of TNF-α and RANKL classified cells as positive for IL-2 (Figure 4). One obvious reason for this classification is that TNF-α and IL-2-expressing cells have a high proportion of cells producing only a single cytokine (see Figure 3B). While the IL-2-expressing Th cells contain 44.1% single producers (Figure 3B) by bivariate analysis, our multidimensional analysis classified 46.31% of all IL-2 positive cells into the left leave of the decision tree (Figure 4). These cells do neither produce TNF-α nor RANKL and can therefore be considered as IL-2 single producers. We therefore can conclude that only the IL-2 single producers are classified correctly. However the decision tree can not reveal patterns in the IL-2 positive cells which are co-expressed with other cytokines. The TNF-α tree (Figure 5) has a similar structure as the IL-2 tree (Figure 4). Cells are classified as TNF-α positive if they neither produce RANKL nor IL-2. Unlike in the IL-2 tree, the TNF-α positive leave does not contain only TNF-α single producers (74.87% TNF-α positive cells, Figure 5 vs. 58.65% TNF-α single producers in Figure 3B). We therefore conclude from the two trees for cytokine expression with a high percentage of single producers that the decision trees could reveal this pattern. Furthermore, other subsets with a high percentage of single producers were used to filter out cells negative for the cytokine of interest. Therefore, the decision trees detect nearly exactly the experimentally determined cut-off values of these cytokines. RANKL (tree not shown) also had a high percentage of single producers. We thus expected a tree with the same structure like for TNF-α and IL-2. Compared to these easy and compact trees, the RANKL decision tree was quite complex, however it could be pruned to the same structure like the IL-2 and TNF-α tree (not shown). This pruning only slightly impaired the classification and resulted in a tree with TNF-α as root and IL-2 as next split attribute. As for RANKL and TNF-α the split values were very close to the experimentally determined cut-off values. Cells were classified as RANKL positive if TNF-α and IL-2 were not expressed and classified as RANKL negative if one of them was expressed. Other decision trees (Figures 6 and 8) had split values highly above the experimentally determined cut-off values. These high split values also revealed some biologically relevant information. As an example, the tree for IFN-ma (Figure 6) was splitted into IFN-γ positive and negative cells by the expression of TNF-α with an MFI of about 6621. Due to this high split value, the node to the right (MFI for TNF-α > 6621) only contained 37.43% of all TNF-α positive cells. However, this node contained 81.47% of all TNF-α and IFN-γ positive cells. Given that the expression of TNF-α started above an MFI of 2368 (as measured by controls), it can be concluded that especially a high expression of TNF-α is associated with the expression of IFN-γ. Routing down the tree of IFN-γ further, the next node contained GM-CSF expression as split attribute for cells with a TNF-α expression below 6621 (Figure 6). However, the split value of 863 for GM-CSF expression was far below the threshold for GM-CSF positive cells as estimated by biological controls (MFI > 1192). This lead to the classification IFN-γ negative for cells below this threshold (TN rate is 92.11%, FN 26.42%) and a classification as IFN-γ positive for cells above this threshold (TP rate 10.78%). Since the TP rate was only around 11% and the split value did not correspond with the true cut-off of GM-CSF, it can be concluded that IFN-γ expression is probably only loosely associated with the expression of GM-CSF. Most of the IFN-γ negative cells do not express GM-CSF since the true negative (TN) rate is high.
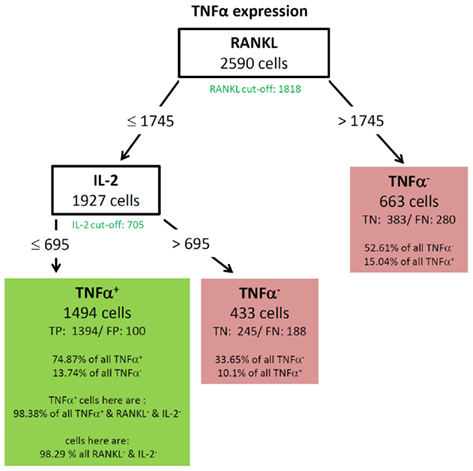
Figure 5. Best decision tree for the classification of cells as positive or negative for TNF-α expression. Cells are classified based on the MFI values of first RANKL and second IL-2. The green colored cut-off values below the inner nodes, indicate that the split values are close to the cut-off values. Therefore, these nodes dived the cells in RANKL (respectively IL-2) negative and positive cells. The cells are routed to the right leaf if they do not express RANKL. Cells of this leaf are classified as negative and this leaf capture 52.61% of all TNF-α negative cells, and only classifies 15.04% of the TNF-α positive cells incorrectly. The leaf in the middle classifies cells as TNF-α negative which do not express RANKL, but do express IL-2. The left node classifies cells as TNF-α positive and captures 74.87% of the TNF-α positive cells. This node contains not all RANKL and IL-2 negative cells, but 98.38% of them. Since the split values of RANKL and IL-2 are slightly below the real cut-off a few RANKL and IL-2 positive cells have been routed to the right and are therefore not contained in the leftmost leaf.
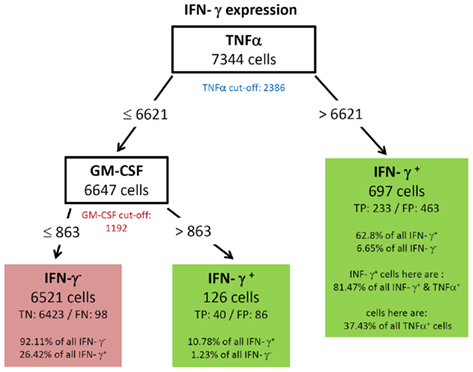
Figure 6. Best decision tree for the classification of cells as positive or negative for IFN-γ expression. Cells are classified based on the MFI values of first TNF-α and second GM-CSF. The blue colored TNF-α (red colored GM-CSF) cut-off value indicates that the split value is high above (below) the cut-off value. Therefore, these nodes dived the cells not just in TNF-α (respectively GM-CSF) negative and positive cells. Only a proportion of the cells which express TNF-α are routed to the right leaf. Contained in this leafs are only 37.43% of all TNF-α positive cells due to this high split value compared to the cut-off value. This leaf captures 62.8% of the IFN-γ positive cells, these are 233 cells (TP – true positive). The leaf also contains the information that this leave captures 81.47% of all IFN-γ and TNF-α positive cells. The leaf in the middle classifies cells as IFN-γ positive and captures 10.78% of all IFN-γ positive cells. The left node classifies cells as IFN-γ negative, thus this leaf wrongly classifies 26.42% of the IFN-γ positive, but captures 92.11% of all IFN-γ negative cells.
To further confirm the relationship between the production of IFN-γ and TNF-α, we filtered the data on TNF-α high (MFI > 6621) and TNF-α low (MFI < 6621) cells. As shown in Figure 7, TNF-α-high cells were highly enriched for IFN-γ producing cells (5.52 vs. 29.7%; left vs. right plot in Figure 7), while TNF-α-low cells are depleted of IFN-γ producing cells (5.52 vs. 1.95%; left vs. middle plot in Figure 7). Strikingly, although segregation into TNF-α high and low populations did also enrich GM-CSF producers, the proportion between GM-CSF single positive cells and GM-CSF, IFN-γ double positive cells was similar for unfiltered TNF-α low and TNF-α high cells (Figure 7). Thus, the co-production of GM-CSF and TNF-α seems to be independent of IFN-γ production.
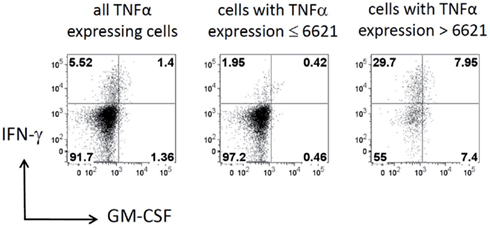
Figure 7. Cells with high TNF-α expression are enriched for IFN-γ expressing cells. Dot plots show the expression of IFN-γ vs. GM-CSF in the same data set for all cells with expression of TNF-α (left), for cells with expression of TNF-α below the split value 6621 given by the decision tree shown in Figure 6 (middle) and for cells with high TNF-α expression (right). Horizontal and vertical lines represent the experimentally determined cut-off values that define the expression for these cytokines as estimated by controls. The cells in the lower left quadrant produce neither IFN-γ nor GM-CSF and the cells in the upper right quadrant produce both. Numbers in quadrants give the percentage of the cells in the respective quadrant.
GM-CSF showed a complex decision tree with many leaves (Figure 8). Comparable to IFN-γ (Figure 6), the first split was at a high level of TNF-α production, but captured most of the GM-CSF and TNF-α positive cells (80.77%). Further splits were at IFN-γ and RANKL expression again with split values above the cut-off value of these cytokines. Cells with expression of TNF-α below 7213, IFN-γ below 2458, and RANKL below 2729 were classified as GM-CSF negative cells (TN = 88.84% in Figure 8). The decision tree of IL-17 (Figure 9) did not provide useful patterns, because the split values were always below the real cut-off values of these cytokines. Nevertheless the classification is quite good.
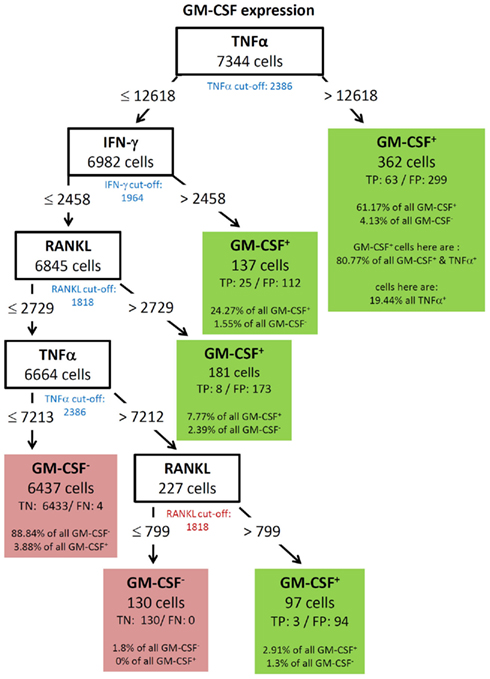
Figure 8. Best decision tree for the classification of cells as positive or negative for GM-CSF expression. Cells are first classified based on the MFI values of TNF-α. The blue colored TNF-α cut-off value indicates that the split value is high above the cut-off value. Therefore, only a proportion of the cells which express TNF-α are routed to the right leaf. A closer look at this leafs shows that due to the split value high above the cut-off value only 19.44% of all TNF-α positive cells are contained in this leaf. But this leaf captures 61.17% of the GM-CSF positive cells. The leaf also contains the information that this leave captures 80.77% of all GM-CSF and TNF-α positive cells. Form the root (top) cells with a TNF-α MFI value equal or below 12618 are routed down to the next inner node. This node splits the cells on the MFI value of IFN-γ. Again, the blue colored cut-off values indicates that not all IFN-γ positive cells in this node are routed to the leaf at the right. This leaf also classifies cells as GM-CSF positive. This leaf captures less of the GM-CSF positive cells – around one out of four. The other two leafs which give a positive classification captures even less of the GM-CSF positive cells, but summed up the four leaves which give a positive classification captures 96.12% of all GM-CSF positive cells.
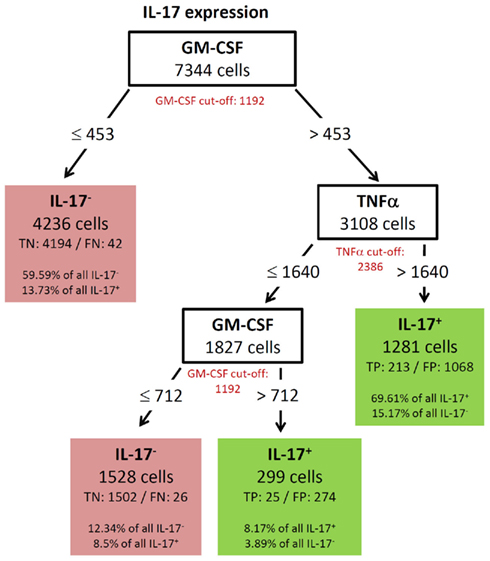
Figure 9. Best decision tree for the classification of cells as positive or negative for IL-17 expression. Cells are first classified based on the MFI values of GM-CSF. The red colored GM-CSF cut-off value indicates that the split value is high below the cut-off value. The cells routed to the left node do not express GM-CSF and this value split captures 59.59% of all IL-17 negative cells and only wrongly classifies 13.73% of the IL-17 positive cells. The next split on the right is on TNF-α, but again the split value is below the cut-off value. The split values of GM-CSF and TNF-α are below the cut-off value and thus not all cells, which are routed down the path to the rightmost leaf express this two cytokines. Nevertheless this leaf correctly classifies 69.61% of the IL-17 positive cells as positive. Only 15.17% of the IL-17 negative cells are wrongly classified in this leaf. Also the last split value again on GM-CSF is below the cut-off value.
To validate the robustness of identified patterns we generated decision trees not only for the standard condition (WT-day 21) as presented up to this point, but also for three additional experimental conditions (WT-day 9, KO-day 21, and KO-day 9). The trees for IFN-γ are almost identical as shown in Figures 10A–C and 6. The four trees demonstrate that high TNF-α production is required for IFN-γ expression. Quite similar, the expression of GM-CSF is the most important split criterion for the expression of IL-17 as shown in Figure 9 for the standard condition and the three trees shown in Figures 11A–C for the additional conditions. In addition, also the pattern found for the standard condition WT-day 21 (Figure 9) is very similar to that found for KO-day 21 shown in Figure 11C. These two trees show that IL-17 is expressed if both GM-CSF and TNF-α are expressed. The importance of TNF-α as the second important criterion for IL-17 production is only evident at the day 21 after immunization (Figures 9 and 11C), not at the day 9 (Figures 11A,B). Further comparisons of the induced trees demonstrate that the expression of TNF-α is the most important split criterion also for the GM-CSF as well as IL-2 production not only for the standard condition (Figures 4 and 8 for IL-2 and GM-CSF, respectively) but also for the knock-out mutant when observed at 21 days after immunization (KO-day 21, Figures 12A,B for IL-2 and GM-CSF, respectively). These rules have not been confirmed when measured 9 days after immunization.
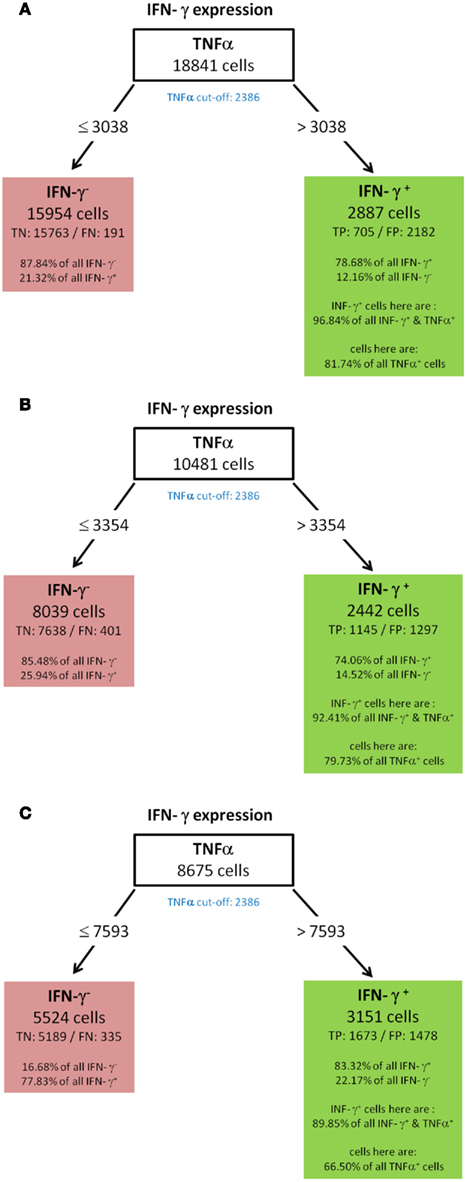
Figure 10. IFN-γ (A) WT-day 9, (B) KO-day 9, (C) KO-day 21.
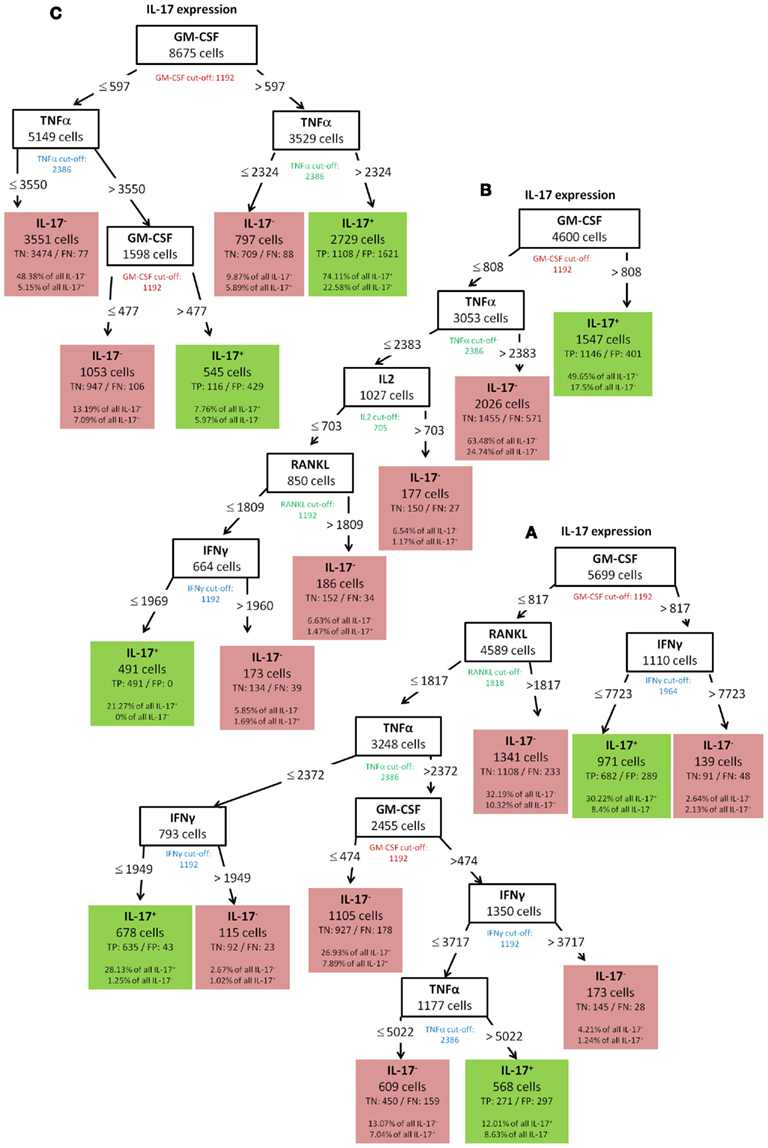
Figure 11. IL-17 (A) WT-day 9, (B) KO-day 9, (C) KO-day 21.
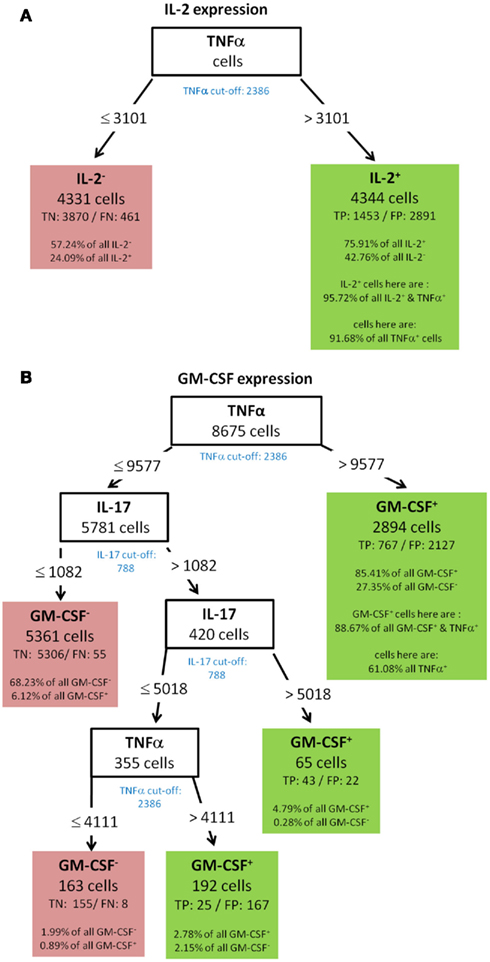
Figure 12. (A) IL-2 KO-day 21, (B) GM-CSF KO-day 21.
As stated in the section 3 we use different parameter settings and chose the best tree according to specific quality criteria. The question is whether our quality criteria always choose a tree created with the same parameter settings. The answer is no. The parameter settings for the induction of the decision trees clearly vary for each cytokine to meet our quality criteria. For instance, the induction of the “best” decision trees for GM-CSF, IFN-γ, and IL-17 required the inclusion of all cells (cytokine-positive and negative) while for IL-2, RANKL, and TNF-α, a better classification could be reached when cytokine-negative cells were omitted. This is due to the fact that IL-2, RANKL, and TNF-α have a high percentage of cells which only produce this cytokine (see Figure 3). The corresponding decision trees have the characteristic that positive cells are routed to the left most node (see Figures 4 and 5), thus these cells are correctly classified as positive if they do not produce the cytokines used for this trees. If also the cytokine-negative cells have been used to induce decision trees for IL-2, RANKL, and TNF-α, then also all cytokine-negative cells would have been routed to this leaf and that would have worsen the classification. Consequently, although the induction of decision trees seems to be a promising approach for the analysis of multidimensional data, standard parameter settings that are suitable for all data sets cannot be proposed. Our approach to choose a decision tree will be discussed in the next section.
4. Discussion
Commonly used sequential filtering strategies have several disadvantages in the analysis of multi-parametric flow cytometry data. They are time-consuming and subjective and therefore information which is contained in the dataset might be lost. Perhaps more importantly, this approach is mainly descriptive and not quantitative. The establishment of an improved workflow for the analysis of flow cytometric data is a demanding need since further increases in data complexity can be expected by the current technical advance in flow cytometry technology (Perfetto et al., 2004; Lugli et al., 2010; Bendall et al., 2011; Mittag and Tarnok, 2011). We tested the feasibility of the induction of decision trees to identify structural patterns in multidimensional flow cytometric data. Data sets from intracellular cytokine staining of antigen-specific T helper cells were analyzed in our proof-of-concept study. T helper cell cytokine production is critical for their capacity to regulate different aspects of the immune response. Cytokine secretion must occur in a coordinated way for maximum efficiency of an immune response. In several independent studies, it has been demonstrated that the protective or pathogenic potential of a T cell response is not determined by the production of a single cytokine. It is rather correlated to their capacity for a coordinated expression of cytokines. For instance, protection against infection with the intracellular parasite Leishmania major is related to a high number of Th cells producing TNF-α, IFN-γ, and IL-2 simultaneously (Darrah et al., 2007; Seder et al., 2008). The identification of patterns of cytokine expression by machine learning might be a useful tool for a better understanding of both T cell immunology and system biology of microbial infection, which critically depends on bidirectional interactions between the pathogen and the host. This prompted us to test the feasibility of the induction of decision trees for the analysis of highly complex flow cytometric data. We hypothesized that good retrieval of information requires good classification by the decision tree. Unfortunately, universally applicable criteria that assess the quality of a decision tree do not exist; these criteria depend on both the data and on the intention of the researcher. Furthermore, there are no general applicable parameter settings in machine learning. Thus, we used different parameter settings and ended up with a large set of decision trees from which we had to choose. Our approach was to select the one tree we considered to be the “best” tree. For the selection of the best, we chose a combination of different criteria, including the geometric mean of the TP rate and the TN rate, the area under the ROC curve (AUC) and geometric mean of the F-measures (see section 3). Since decision trees works best with balanced data, we also weighted our highly imbalanced data sets regarding positive and negative cells (see Figure 3A). Although, we were able to identify a tree of sufficient for each cytokine, the parameter settings for the induction of the decision trees clearly varied to meet our quality criteria. For instance, the induction of the “best” decision trees for GM-CSF, IFN-γ, and IL-17 required the inclusion of all cells (cytokine-positive and negative). In contrast for IL-2, RANKL, and TNF-α, a better classification could be reached when cytokine-negative cells were omitted. This shows that although the induction of decision trees seems to be a promising approach for the analysis of multidimensional data, standard parameter settings, which are suitable for all data sets, cannot be proposed. The choice and combination of the quality measure was adjusted for our task. We consequently used primarily the geometric mean of the TP and TN rate since we considered both as equally important and chose the smallest tree, since we aimed at a visual expert inspection of the trees. Other tasks may require other criteria. An extension to our approach to chose only the “best” tree could be to provide the expert user with a set of good trees. A comparison of these set could reveal more insight and will be the scope of future work. Another discussable point is the weighting of the data sets according to their imbalance. Due to the weighting of the data, a node is also classified as positive if the number of cells negative for this cytokine is much higher than the number of cells positive for this cytokine. Thus, the precision of classification becomes lower. Such low precision heavily impairs the ability to predict the expression of a given marker depending on the known expression of other markers, in order to avoid its direct measurement. Since we used decision trees to find structural patterns in the data and to generate hypothesis from these patterns, precision does not play a critical role.
The work was focused on standard condition (WT-day 21). However, for comparative reasons and to check the robustness of identified rules, additional conditions were investigated using knock-out mice (KO) and measurement already 9 days after immunization. The importance of high TNF-α expression for IFN-γ was confirmed for all conditions while for GM-CSF and IL-2 production only when measured 21 days after immunization. Furthermore, TNF-α was identified as the second important criterion also for IL-17 production but again only when measured 21 days after immunization. Summarizing, some rules of co-expression have been confirmed with different experimental conditions. Thus, the method of induction of decision trees is able to extract robust rules. Interestingly, the strong dependency of the expression of one cytokine on the expression of others which we found reproducibly between different time points and despite differing genotypes implies some biological significance of these findings. We have previously shown in a kinetic study that TNF-α is one of the earliest cytokines produced after activation of antigen-specific T cells (Frey et al., 2010b). Given that expression of the other cytokines starts later, the strong relationship between TNF-α and the expression of the other cytokines could argue for a hard-wired connection between the expression of these mediators. High TNF-α expression has been described as a marker of polyfunctional T cells in another study (Darrah et al., 2007; Seder et al., 2008), supporting our hypothesis that TNF-α expression is highly correlated with the expression of other effector cytokines.
In conclusion, the presented results show that data analysis with decision trees can easily reveal structural patterns in flow cytometric data that would have been missed by conventional analysis. Such patterns can be used for the generation of hypothesis on the complex biology of certain subsets of cells.
Conflict of Interest Statement
The authors declare that the research was conducted in the absence of any commercial or financial relationships that could be construed as a potential conflict of interest.
Acknowledgments
Funding: Svenja Simon and Reinhard Guthke were supported by the Deutsche Forschungsgemeinschaft (DFG) Priority Program 1160 “Colonisation and infection by human-pathogenic fungi.” Thomas Kamradt and Oliver Frey were supported by the Deutsche Forschungsgemeinschaft (DFG) Priority Program 1468 “Immunobone” (KA 755-6/1).
References
Bendall, S. C., Simonds, E. F., Qiu, P., Amir, E.-A. D., Krutzik, P. O., Finck, R., Bruggner, R. V., Melamed, R., Trejo, A., Ornatsky, O. I., Balderas, R. S., Plevritis, S. K., Sachs, K., Pe’er, D., Tanner, S. D., and Nolan, G. P. (2011). Single-cell mass cytometry of differential immune and drug responses across a human hematopoietic continuum. Science 332, 687–696.
Bruns, L., Frey, O., Morawietz, L., Landgraf, C., Volkmer, R., and Kamradt, T. (2009). Immunization with an immunodominant self-peptide derived from glucose-6-phosphate isomerase induces arthritis in DBA/1 mice. Arthritis Res. Ther. 11, R117.
Darrah, P. A., Patel, D. T., De Luca, P. M., Lindsay, R. W. B., Davey, D. F., Flynn, B. J., Hoff, S. T., Andersen, P., Reed, S. G., Morris, S. L., Roederer, M., and Seder, R. A. (2007). Multifunctional T(H)1 cells define a correlate of vaccine-mediated protection against Leishmania major. Nat. Med. 13, 843–850.
Data File Standards Committee of the Society for Analytical Cytology. (1990). Data file standard for flow cytometry. Cytometry 11, 323–332.
Frey, O., Bruns, L., Morawietz, L., Dunussi-Joannopoulos, K., and Kamradt, T. (2011a). B cell depletion reduces the number of autoreactive T helper cells and prevents glucose-6-phosphate isomerase-induced arthritis. PLoS ONE 6, e24718. doi:10.1371/journal.pone.0024718
Frey, O., Tania, M., Kelchtermans, H., Schurgers, E., Kamradt, T., and Matthys, P. (2011b). Ameliorated course of glucose-6-phosphate isomerase (G6PI)-induced arthritis in IFN-γ receptor knockout mice exposes an arthritis-promoting role of IFN-γ. J. Autoimmun. 36, 161–169.
Frey, O., Meisel, J., Hutloff, A., Bonhagen, K., Bruns, L., Kroczek, R. A., Morawietz, L., and Kamradt, T. (2010a). Inducible costimulator (ICOS) blockade inhibits accumulation of polyfunctional T helper 1/T helper 17 cells and mitigates autoimmune arthritis. Ann. Rheum. Dis. 69, 1495–1501.
Frey, O., Reichel, A., Bonhagen, K., Morawietz, L., Rauchhaus, U., and Kamradt, T. (2010b). Regulatory T cells control the transition from acute into chronic inflammation in glucose-6-phosphate isomerase-induced arthritis. Ann. Rheum. Dis. 69, 1511–1518.
Gentleman, R., Carey, V., Bates, D., Bolstad, B., Dettling, M., Dudoit, S., Ellis, B., Gautier, L., Ge, Y., Gentry, J., Hornik, K., Hothorn, T., Huber, W., Iacus, S., Irizarry, R., Leisch, F., Li, C., Maechler, M., Rossini, A., Sawitzki, G., Smith, C., Smyth, G., Tierney, L., Yang, J., and Zhang, J. (2004). Bioconductor: open software development for computational biology and bioinformatics. Genome Biol. 5, 1–16.
Hahne, F., LeMeur, N., Brinkman, R. R., Ellis, B., Haaland, P., Sarkar, D., Spidlen, J., Strain, E., and Gentleman, R. (2009). flowCore: a Bioconductor package for high throughput flow cytometry. BMC Bioinformatics 10, 106.
Hornik, K., Buchta, C., and Zeileis, A. (2009). Machine learning: R meets Weka. Comput. Stat. 24, 225–232.
Hulspas, R., O’Gorman, M. R. G., Wood, B. L., Gratama, J. W., and Sutherland, D. R. (2009). Considerations for the control of background fluorescence in clinical flow cytometry. Cytometry B Clin. Cytom. 76B, 355–364.
Kirchhoff, D., Frentsch, M., Leclerk, P., Bumann, D., Rausch, S., Hartmann, S., Thiel, A., and Scheffold, A. (2007). Identification and isolation of murine antigen-reactive T cells according to CD154 expression. Eur. J. Immunol. 37, 2370–2377.
Kubat, M., Holte, R., and Matwin, S. (1998). Machine learning for the detection of oil spills in satellite radar images. Mach. Learn. 30, 195–215.
Lugli, E., Roederer, M., and Cossarizza, A. (2010). Data analysis in flow cytometry: the future just started. Cytometry A 77A, 705–713.
Mittag, A., and Tarnok, A. (2011). “Recent advances in cytometry applications: preclinical, clinical, and cell biology,” in Recent Advances in Cytometry, Part B: Advances in Applications, Vol. 103 of Methods in Cell Biology, 5th Edn, eds Z. Darzynkiewicz, E. Holden, A. Orfao, W. Telford, and D. Wlodkowic, (Waltham: Elsevier Academic Press Inc.), 3–20.
Parks, D., Roederer, M., and Moore, W. (2006). A new “logicle” display method avoids deceptive effects of logarithmic scaling for low signals and compensated data. Cytometry A 69A, 541–551.
Perfetto, S., Chattopadhyay, P., and Roederer, M. (2004). Innovation – seventeen-colour flow cytometry: unravelling the immune system. Nat. Rev. Immunol. 4, 648–655.
Quinlan, J. R. (1993). C4.5: Programs for Machine Learning. San Francisco: Morgan Kaufmann Publishers.
R Development Core Team. (2009). R: A Language and Environment for Statistical Computing. Vienna: R Foundation for Statistical Computing.
Roederer, M., and Moody, M. A. (2008). PolyChromatic plots: graphical display of multidimensional data. Cytometry A 73A, 868–874.
Sachs, K., Perez, O., Pe’er, D., Lauffenburger, D., and Nolan, G. (2005). Causal protein-signaling networks derived from multiparameter single-cell data. Science 308, 523–529.
Schubert, D., Maier, B., Morawietz, L., Krenn, V., and Kamradt, T. (2004). Immunization with glucose-6-phosphate isomerase induces T cell-dependent peripheral polyarthritis in genetically unaltered mice. J. Immunol. 172, 4503–4509.
Seder, R. A., Darrah, P. A., and Roederer, M. (2008). T-cell quality in memory and protection: implications for vaccine design. Nat. Rev. Immunol. 8, 247–258.
Sun, Y., Kamel, M., Wong, A., and Wang, Y. (2007). Cost-sensitive boosting for classification of imbalanced data. Pattern Recognit. 40, 3358–3378.
Keywords: flow cytometry, cytokines, machine learning, induction of decision trees, imbalanced data, multidimensionality
Citation: Simon S, Guthke R, Kamradt T and Frey O (2012) Multivariate analysis of flow cytometric data using decision trees. Front. Microbio. 3:114. doi: 10.3389/fmicb.2012.00114
Received: 12 December 2011; Accepted: 12 March 2012;
Published online: 02 April 2012.
Edited by:
Franziska Mech, Leibniz-Institute for Natural Product Research and Infection Biology – Hans-Knoell-Institute, GermanyReviewed by:
Enrico Lugli, National Institutes of Health, USAThomas Bley, Technische Universitaet Dresden, Germany
Copyright: © 2012 Simon, Guthke, Kamradt and Frey. This is an open-access article distributed under the terms of the Creative Commons Attribution Non Commercial License, which permits non-commercial use, distribution, and reproduction in other forums, provided the original authors and source are credited.
*Correspondence: Svenja Simon, Department of Computer and Information Science, University of Konstanz, Universitätsstraße 10, Box 78, 78457 Konstanz, Germany. e-mail: simon@dbvis.inf.uni-konstanz.de
†Present address: Svenja Simon, Data Analysis and Visualization Group, Department of Computer and Information Science, University of Konstanz, Konstanz, Germany; Oliver Frey, Institute of Clinical Chemistry and Laboratory Medicine, Jena University Hospital – Friedrich Schiller University Jena, Jena, Germany.