
- 1 Department of Evolutionary Studies of Biosystems, The Graduate University for Advanced Studies, Hayama, Kanagawa, Japan
- 2 Evolution and Ecology Program, International Institute for Applied Systems Analysis, Laxenburg, Austria
- 3 Department of Biology, Faculty of Science, Kyushu University Graduate Schools, Fukuoka, Japan
- 4 Department of Virology 2, National Institute of Infectious Diseases, Musashimurayama, Tokyo, Japan
Live vaccination against polio has effectively prevented outbreaks in most developed countries for more than 40 years, and there remain only a few countries where outbreaks of poliomyelitis by the wild strain still threaten the community. It is expected that worldwide eradication will be eventually achieved through careful surveillance and a well-managed immunization program. The present paper argues, however, that based on a simple stochastic model the risk of outbreak by a vaccine-derived strain after the cessation of vaccination is quite high, even if many years have passed since the last confirmed case. As vaccinated hosts are natural reservoirs for virulent poliovirus, the source of the risk is the vaccination itself, employed to prevent the outbreaks. The crisis after stopping vaccination will emerge when the following two conditions are met: the susceptible host density exceeds the threshold for epidemics and the vaccinated host density remains large enough to ensure the occurrence of virulent mutants in the population. Our estimates for transmission, recovery, and mutation rates, show that the probability of an outbreak of vaccine-derived virulent viruses easily exceeds 90%. Moreover, if a small fraction of hosts have a longer infectious period, as observed in individuals with innate immunodeficiency, the risk of an outbreak rises significantly. Under such conditions, successful global eradication of polio is restricted to a certain range of parameters even if inactivated polio vaccine (IPV) is extensively used after the termination of live vaccination.
Introduction
The World Health Organization (WHO) has a target to interrupt wild poliovirus transmission throughout the world by 2013 (World Health Organization, 2010). The number of patients with poliomyelitis by wild-type poliovirus infection has decreased drastically due to a program using live oral polio vaccine (OPV). Immunity by OPV is defensible against excreted viruses because the major antigenic sites on the viral genome are relatively conserved between serotypes during replication (Minor, 1992). However, nucleotide substitutions responsible for increased neurovirulence frequently occur during replication in the human gut (Poyry et al., 1988; Dunn et al., 1990; Abraham et al., 1993; Kew et al., 1998; Matsuura et al., 2000; Shulman et al., 2000). It has been reported since the 1960s that the vaccine-derived strain excreted from humans can exhibit pathogenicity (Benyesh-Melnick et al., 1967; Marker Test Subcommittee. The Japan Live Poliovaccine Research Commission, 1967). This suggests the possibility that vaccine-derived viruses could cause a poliomyelitis outbreak in a susceptible population after the cessation of an OPV program (Wood et al., 2000). The objective of this study was to estimate the risk of outbreak of vaccine-derived strains after stopping OPV. While the number of attenuated virus carriers, the source of neurovirulent viruses, would decline after the discontinuation of OPV, the number of susceptible hosts would increase and may finally exceed the threshold for an outbreak. Therefore, successful eradication depends on which of these processes is faster. We calculated the probability of successful global eradication, that is, the probability that the last carrier will be recovered before the population could experience an outbreak.
It will be shown below that the mean excretion period from an infected individual is one of the key factors that determine whether or not eradication fails. Except for immunodeficient individuals, virus is excreted from humans for ∼1–3 months after OPV administration to a susceptible host (Alexander et al., 1997). Excreted viruses are often virulent. For example, Yoshida et al. (2000) showed that type 3 vaccine-derived polioviruses isolated from an environment in Japan had high neurovirulence. These strains were isolated from river or sewage waters ∼3 months after routine OPV administration, showing that vaccine-derived strains could circulate in the human community. Other studies showed silent circulation of vaccine-derived strains occurred in the human community (Zdrazilek et al., 1982; Miyamura et al., 1992).
To avoid risks such as contact infection or vaccine-associated paralysis (VAP), inactivated polio vaccine (IPV) has been used in several countries (Murdin et al., 1996). The USA switched its immunization strategy from OPV to IPV in 2000 (American Academy of Pediatrics Committee on Infectious Diseases, 1999). As IPV-immunized hosts can be infected by polioviruses and excrete infectious virus, IPV is less effective than OPV in preventing infection, though numbers of excreted viruses are greatly reduced (Fine and Carneiro, 1999). Our study also investigated whether switching to IPV after the cessation of OPV effectively reduced outbreak risk.
The Pan American Health Organization (PAHO) reported a poliomyelitis outbreak by a type 1 vaccine-derived strain in Haiti and the Dominican Republic in July 2000 (Centers for Disease Control and Prevention, 2000). In the Latin American region, poliomyelitis caused by a wild strain was last reported in Peru in 1991, and eradication of poliomyelitis was declared in 1994. The recent outbreak in Haiti and the Dominican Republic could be ascribed to the decreased rate of OPV coverage and the spread of a neurovirulent vaccine-derived strain.
The polio eradication program plans to stop administering OPV after disappearance of the wild strain. If vaccine-derived strains remain when herd immunity falls below the epidemic threshold, outbreak by these strains could occur. In this paper, we study the probability of disease re-emergence caused by a vaccine-derived strain using a simple mathematical model. Epidemiological and genetic parameters, such as transmission rate, mean excretion period, mutation rate from attenuated to neurovirulent strains, are varied around estimated values (Gelfand et al., 1959; Benyesh-Melnick et al., 1967; Dunn et al., 1990; Fine and Carneiro, 1999), and dependence on the probability of eradication detailed. In assessing the risk we assumed the following:
1. That the excretion period of vaccine-derived neurovirulent viruses can be longer than that of the attenuated viruses used in live immunization. Likewise, the transmission rates of vaccine-derived strain can be greater than that of the attenuated strain. When hosts recover from infection by either viral strain, the degree of immunity is as effective as that raised by OPV immunization.
2. That infection by either the vaccine-derived or attenuated poliovirus can occur in IPV-immunized hosts. However, the number of secondary transmissions from a previously IPV-immunized host is smaller than that from a susceptible host, and the mean excretion period is shorter in an IPV-immunized host than in a susceptible host.
3. That when re-infection occurs in an individual immunized by OPV, excretion from the re-infection is ignored because the amount of virus excretion is negligibly small (Abraham et al., 1993).
4. That antigenic drift does not occur. The focus of the study is on the risk of outbreak by a neurovirulent vaccine-derived strain with unchanged antigenic properties.
5. That a constant fraction (e.g., 70%) of hosts is efficiently immunized (seroconverted) before OPV is stopped, and that the population at that time is in endemic equilibrium under constant OPV coverage.
We first examine the risk of outbreak after OPV cessation (in the absence of an alternate program); second, we evaluate the effect of host heterogeneity on excretion duration; and third, we examine outbreak risk where extensive IPV immunization follows OPV cessation.
Mathematical modeling is a powerful tool in the understanding of epidemiological dynamics (Anderson and May, 1991). Previous models of polio eradication have considered neither the re-infection by vaccine-derived strains of IPV-immunized hosts nor mutation giving rise to neurovirulent strains (Eichner and Hadeler, 1995; Eichner and Dietz, 1996). Our model allows for the mutation of attenuated strains to virulent strains while replicating in the human gut (Poyry et al., 1988; Dunn et al., 1990; Abraham et al., 1993; Kew et al., 1998; Matsuura et al., 2000; Shulman et al., 2000), and also allows both strains to infect IPV-immunized hosts. The probability for the success of global eradication is then calculated based on the stochastic model of epidemiological dynamics.
Material and Methods
We attempted to determine the risk of virulent poliovirus outbreaks after stopping live vaccination. Time t = 0 represents the point at which immunization by live-poliovirus vaccine (OPV) is stopped. With a sufficiently high rate of immunization, the great majority of the population at time would be OPV-immunized hosts, which neither the attenuated (Sabin) nor virulent strain could infect. We first examined the risk where no alternative program followed OPV cessation. The effect of extensive administration of inactivated vaccine (IPV) following OPV discontinuation will be discussed later.
Deterministic Epidemiological Dynamics
The number of carriers of attenuated virus would decline after the end of a live vaccination program. Poliovirus is considered to have been eradicated when the last carrier had recovered. However, while the number of carriers declines, the number of hosts immunized by the live vaccine declines also. When the number of susceptible hosts exceeds a certain threshold, the way is opened for the spread of a virulent poliovirus. Thus, the risk of outbreak critically depends on the speed at which carrier numbers, as the source of virulent mutant virus, decrease, and the speed at which susceptible hosts increase. Therefore, we need to keep track of the changes over time of the following demographic variables: the fraction of susceptible hosts (x), hosts infected with or carrying attenuated virus (y), virulent virus infected hosts (v), and recovered and immune hosts (z), with x + y + v + z = 1. The population size K is kept constant over time. A virulent virus strain can emerge through mutation in attenuated virus carriers. The probability of successful eradication, or conversely, the probability of an outbreak by a virulent virus, can be evaluated by constructing a stochastic process for the change in the number of infected hosts. To construct the stochastic process, we first derive the corresponding deterministic dynamics.
Deterministic dynamics before the cessation of OPV
Under the immunization of OPV to newborns the dynamics for x, y, v, and z are
where t denotes the time variable in units of weeks, p is the immunization fraction to newborns (the fraction to be immunized times the seroconversion rate), u denotes both the natural mortality and the birth rate of the host where we assume that host population is at demographic equilibrium so that the numbers of births and deaths are balanced, βa and βv are the transmission rates of attenuated and virulent virus, respectively, 1/γa and 1/γv are the mean durations of attenuated and virulent virus infection, respectively, and μ is the mutation rate from attenuated to virulent virus (Figure 1). As the numbers of births and deaths are balanced [d(x + y + v + z)/dt = 0 follows from Eq. (1)], the total population is kept constant (K), and we can focus on the changes in the fraction of each class. As z(t) = 1 − x(t) − y(t) − v(t), we omit Eq. 1d from the analysis. If μ = 0, the condition for virulent or wild polio virus being wiped out from the population is that the immunization fraction p is smaller than the threshold pc:
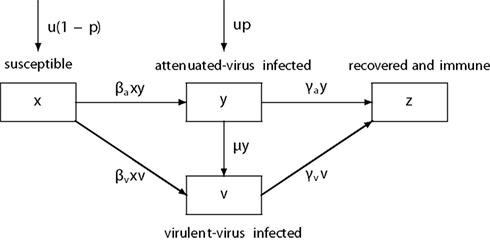
Figure 1. The schematic diagram of the epidemiological dynamics. βa and βv: the transmission rate of attenuated and virulent virus, γa and γv: the recovery rate of attenuated and virulent virus, μ: the mutation rate from attenuated to virulent virus, u: the host birth rate (=death rate), p: the fraction of newborns immunized by OPV. The flows by natural host mortality are omitted.
where Rv = βv/(u + γv) and Ra = βa/(u + γa) are the basic reproductive ratios of virulent and attenuated viruses (see, for example, Nowak and May, 2000). The threshold immunization fraction pc necessary for the eradication of virulent viruses is lower than that without circulation of attenuated viruses . Thus silent circulation of attenuated virus can significantly increase the efficiency of vaccination. With non-zero mutation rate μ > 0, both the attenuated and the virulent virus can be maintained in the population. The fractions of susceptible host , attenuated virus infected hosts , virulent virus infected hosts (and recovered and immune hosts ) at endemic equilibrium of dynamics (1) are defined as
where and being defined as a positive root of
Figure 2 shows how the equilibrium numbers defined above depend on the immunization fraction p and the mutation rate μ, together with the mean number of virulent virus infections per week, , under immunization.
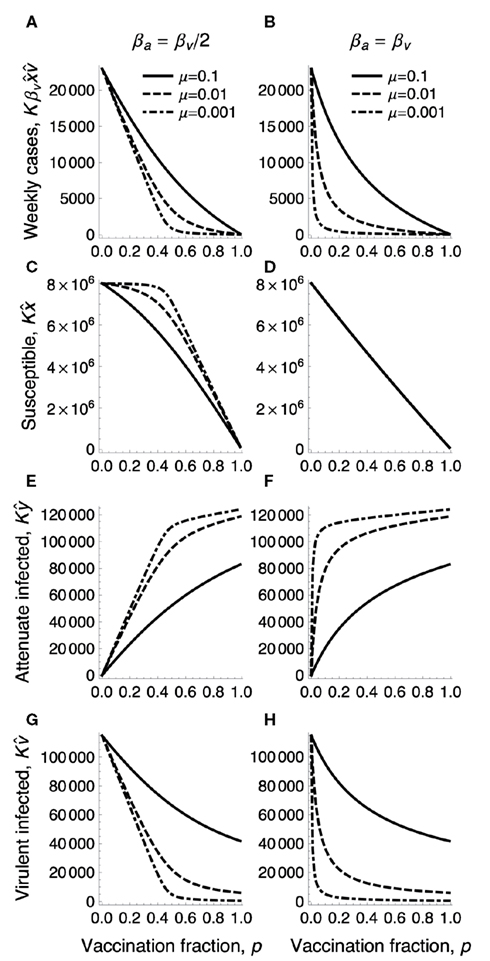
Figure 2. The densities in endemic equilibrium under the immunization fraction p. The number, of hosts newly infected by virulent virus in a week (top row), the equilibrium number of susceptible hosts (second row), that of attenuated virus infected hosts (third row), and that of virulent virus infected hosts (bottom row) are plotted as a function of immunization fraction p for varying mutation rates μ for the emergence of virulent virus from an attenuated virus (sold: μ = 0.1, dashed: μ = 0.01, dot dashed: μ = 0.001). The population size K is 100 million, βv = 2.5 is the transmission rate of virulent virus. (A,C,E,G) The transmission rate of attenuated virus is half of that of virulent virus: βa = 1.25. (B,D,F,H) βa is the same as βv. Other parameters are γa = γv = 0.25, u = 0.00025.
As we will see later, the success or failure of global eradication after the cessation of OPV critically depends on the equilibrium densities of susceptible, attenuated virus infected, and virulent virus infected hosts at the time of stopping OPV illustrated above. Their parameter dependences are best described if there was no significant difference in transmission rates and recovery rates between attenuated and virulent polio strains, such that we can assume β = βa = βv, and γ = γa = γv. This is an important special case that is also partly supported from the data (see later). Substituting βa = βv = β and γa = γv = γ into Eqs 3a–3c then yields the equilibrium factions under OPV immunization in symmetric case:
and
where R0 = β/(u + γ) is the basic reproductive ratio of both strains. If R0 is sufficiently large (R0 >> 1), the equilibrium fractions are approximated as
which describe well how the equilibrium densities change with the immunization fraction p and mutation rate in the right panels of Figure 2 (for βa = βv).
Deterministic dynamics after the cessation of OPV
The epidemiological dynamics for x, y and v after stopping OPV are
where t is now the number of weeks after OPV is stopped (Figure 3). We assume that the population was in endemic equilibrium at time t = 0 under a constant fraction p of newborns immunized by OPV. As before, if we can assume that the transmission rates and recovery rates of attenuated and virulent polio strains are the same: β = βa = βv and γ = γa = γv, the dynamics can be described by only two variables: x (the fraction of susceptible hosts) and w = y + v (the fraction of hosts infected by either attenuated or virulent virus),
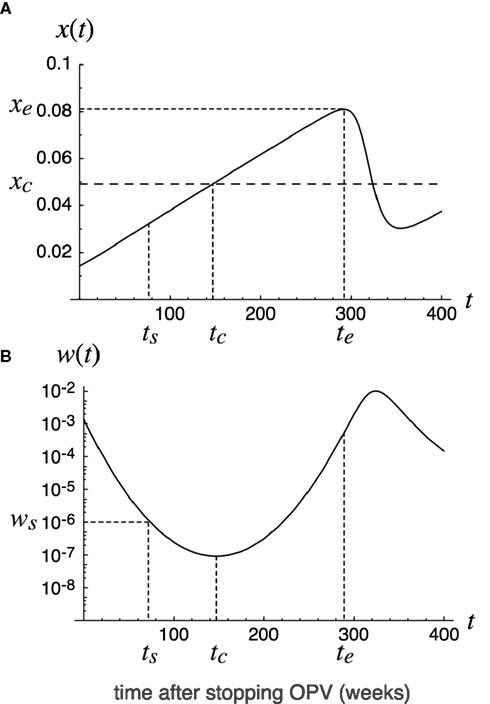
Figure 3. Deterministic trajectory after stopping OPV. Deterministic trajectory of epidemiological dynamics (8) in the text. The fraction x(t) of susceptibles (A) and the fraction w(t) of infecteds (B) are plotted as functions of the time t = 0 since the cessation of OPV. The dotted line indicates the threshold host density for outbreak: xc = (u + γ)/β. The initial fractions x0 and w0 at time t = 0 are assumed to be in endemic equilibrium under OPV immunization to a constant fraction, p, of newborns. The time t = tc at which the fraction of infecteds is minimized in deterministic trajectory is indicated, together with time t = ts and t = te defined for the calculation of the global eradication probability (Eq. 11). Parameters are: p = 0.7, β = 3.7, γ = 0.18, u = 0.00025.
The susceptible density increases with time, while the densities of attenuated or virulent virus infected hosts decrease with time as long as t > tc, where tc is the time at which the susceptible density hits the epidemiological threshold: x(tc) = (u + γ)/β (see Figure 3). The poliovirus infected density then starts increasing again. The question we ask in the following is whether the poliovirus goes to extinction around the time t = tc where its density approaches the minimum. In the following we derive the global eradication probability of poliovirus by analyzing the stochastic analog of dynamics (7) for βa < βv or γa > γv, and that of the dynamics (8) for the special case of βa = βv and γa = γv.
Probability of Successful Eradication
We then examine the probability of poliovirus eventually being lost from a population without causing an outbreak. To calculate extinction probabilities, we consider discrete time dynamics corresponding to (8) with weeks as time units. We assume that the number of secondary infections from a virulent virus infected host per week follows the Poisson distribution with mean βKx(t), where K is the total population size and x(t) is the fraction of susceptible hosts defined as the solution to (8). The probability that the progeny of a virulent virus strain found in an infected host at time t eventually goes to extinction by chance before causing an outbreak is defined as q(t). We also define 1 − q(t) as the marginal risk of outbreak at time t, which is the probability that an infected host present at time t harbors the viruses whose progeny will cause outbreaks in the future. If βa = βv = β and γa = γv γ, the extinction probability q(t) then satisfies the recursive equation
where δ = u + γ (see Appendix for the derivation). The extinction probability q(t) for arbitrary time t can be determined by solving (9), with x(t) obtained from (5) and (8). The boundary condition for the recursion (9) is chosen at the time at which the fraction x of susceptibles first approaches a local maximum xe at t = te (such xe and te exist because susceptible hosts as unvaccinated newborns should first be boosted after stopping live vaccination until x exceeds the epidemic threshold xc – see Figure 3):
where qe = q(te) is the extinction probability at t = te. In deriving (10), we used the approximation q(te) ≈ q(te + 1), as the change in x(t) is negligibly small around its maximum xe.
The probability of eventual eradication can then be calculated as follows. We choose a reference time point t = ts before the deterministic trajectory for w reaches its minimum (see Figure 3), at which the number of infected hosts Kws = Kw(ts) was large enough so that eradication before that time point could be ignored, but small enough so that competition between different viral lines could be ignored. According to extensive Monte Carlo simulations we found that the stochastic loss of the infecteds may occur only after their expected number falls below 100 or less. Noting this and the fact that the competition between viral strains can be ignored when Kws/K<<1, we chose Kws = 100. The probability of eventual extinction is then
i.e., poliovirus eventually goes to extinction without causing outbreaks if and only if all progenies of the viruses present at t = ts go to extinction. Note that if the total population is subdivided into mutually isolated communities (e.g., 100 cities each with one million population), then the probability that none of the cities experiences the outbreak is given by (11) with K = 100× one million.
We conducted extensive Monte Carlo simulations of the fully stochastic process to check the accuracy of formula (11). For the Monte Carlo simulations, week by week changes in numbers of susceptibles, attenuated virus infecteds, and virulent virus infecteds in population of size K were followed. The changes between weeks caused by infection, recovery, mutation, and host mortality were generated by binomial pseudo-random numbers with the rates given by the dynamics (7). As shown below, the formula (11) for the probability of eventual eradication agreed quite well with that observed in the Monte Carlo simulations for 1000 independent runs.
Epidemiological Parameters
The probability of global eradication depends on epidemiological, host demographic, and genetic parameters. Thus, estimates of the recovery rate γ, the transmission rate β, and the mutation rate μ are critical. All parameters used in the model were scaled in units of weeks.
Recovery rate γ, or the reciprocal of the mean excretion period.
The mean excretion duration after challenge with 6 logs of Sabin type 1 virus has been estimated to be 20.4 days for hosts not previously immunized, 12.3 days for previously IPV-immunized hosts, and 4.6 days for previously OPV-immunized hosts (Fine and Carneiro, 1999). Thus, the mean infectious period of a type 1 primary infection is about 3 weeks. While type 2 poliovirus showed a similar excretion period to type 1, type 3 has a significantly longer excretion period (Vaccine Administration Subcommittee. The Japan Live Poliovaccine Research Commission, 1966). Mean excretion periods are estimated as 20.5, 20.6, and 38.6 days for types 1, 2, and 3, respectively, for TOPV (trivalent oral polio vaccination; Gelfand et al., 1959). Regarding the risk of re-emergence, type 3 poliovirus would be the most likely agent to persist and circulate longest after stopping OPV, and hence cause outbreaks. Therefore we adopted the excretion period for type 3 in assessing outbreak risk. Thus, we varied the recovery rate around γa = 0.18/week, corresponding to 5.5 weeks as the mean excretion period. We assume that the recovery rates are similar between attenuated (γa) and virulent (γv) polio infections, and set as γv = 0.18. Indeed, durations of excretion of attenuated type 1 polioviruses showed no significant difference from that of wild polioviruses (compare Figures 2 and 3 of Alexander et al., 1997). A constant recovery rate assumed here implies that the infectious period has the long tail in an exponential distribution. The effect of tail in the infectious period will be examined later.
Transmission rate β, or the mean number of secondary infections.
While the probability of within-family infection was estimated to be 0.5 per case (Benyesh-Melnick et al., 1967), we also needed to evaluate the mean transmission rate to other members of the community. The mean transmission rate was estimated from the basic reproductive rate: R0 = β/(u + γ) ≈ β/γ. The basic reproductive ratio of wild polioviruses in England and Wales during the pre-vaccination period has been estimated to be R0 = 10–12 (Anderson and May, 1991). More recent estimates have been R0 = 10–15 in countries with poor sanitation and hygiene, and R0 less than 10 in countries with good sanitation and hygiene (Fine and Carneiro, 1999). If we assume γ = 0.18, this gives estimates of β = 1.8–2.7/week in developing countries. Much higher R0’s of more than 20 have been reported by studies of poliomyelitis outbreaks over the past 20 years (Patriarca et al., 1997). Because of this large variance in the estimated β, we varied the value rather widely, from 2 to 6, to evaluate eradication probability.
Mutation rate μ from the attenuated to the virulent virus
Oral polio vaccine produced from Sabin 1 to 3 strains is a highly attenuated vaccine. It is known that virulent mutants appear after replication in the human gut after OPV given. Such virulent strains have caused outbreaks in populations with low OPV coverage in Haiti, the Dominican Republic, and Egypt, accumulating mutations through human to human transmission (Centers for Disease Control and Prevention, 2000, 2001). Several nucleotide mutations responsible for attenuation have ever been reported (Plotkin et al., 2008). Of them, the critical and unstable attenuating mutations in 5′-UTR (A480G in Sabin 1, G481A in Sabin 2, and C472U in Sabin 3) appear initially during viral replication. Dunn et al. (1990) reported that at least one viral serotype excreted from a susceptible individual immunized by OPV had mutated completely in 5′-UTR within 28 days. The average contents of revertants (virulent forms) from OPV recipients were 28–40% in type 1, 97% in type 2, and 67% in type 3 at 3 weeks after the most recent dose (Laassri et al., 2006). Similar estimates were reported by Minor et al. (2005) and Martinez et al. (2004). Thus, the mutation rate from attenuated to virulent viruses appeared to be high, in the order no smaller than μ = 0.1/week.
Results
Before proceeding to specific parameter dependences, it should be noted that the time at which the fraction of susceptible hosts exceeds the threshold for epidemics is crucial in understanding the problem. The number of virulent virus infected hosts increases if the fraction of susceptible hosts is larger than the threshold xc = (u + γ)/β, which is the reciprocal of the basic reproductive rate R0 = β/(u + γ), and decreases when x is smaller than xc. During the initial period, when the fraction of OPV-vaccinated individuals is large, the fraction of susceptibles is less than the threshold xc, so that the risk of an outbreak is negligible, even though considerable numbers of virulent mutants are being generated at each time step. The number of virus carriers decreases during the period from the cessation of OPV to time tc at which the susceptible density exceeds the threshold xc. If the number of carriers becomes zero around tc, polio will be globally eradicated. However, if virus survives this “endangered” period around tc, the infected density increases again and a future outbreak becomes certain. The following formula (derived in Appendix) provides an approximate time tc and minimum infected fraction wc as a function of epidemiological parameters:
where D = 1/γ is the mean duration of infection, L = 1/u the life expectancy of the host, and R0 = β/(u + γ) the basic reproductive ratio. There is a high probability of global eradication if Kwc is sufficiently smaller than 1; whereas, there is a high-risk of re-emergence if Kwc is greater than 10. Although assessment of outbreak risk should be based on the probability of global viral extinction as discussed below, the above approximate formula gives insights into the likelihood of re-emergence and parameter dependence on eradication probability. It also gives an accurate estimate of the critical time tc at which either global eradication occurs or an outbreak starts.
Paths to Extinction and Paths to Outbreak
Figure 3 shows deterministic changes in fraction x of susceptibles and fraction w = y + v of poliovirus carrying hosts after cessation of live vaccination. The fraction of susceptibles exceeded the epidemiological threshold xc around time t = tc(=150) weeks after live vaccination discontinuation. When the fraction of susceptibles exceeds the epidemiological threshold, the fraction of infecteds is at its minimum. The public health objective is to make the number of infecteds zero around time t = tc. Figure 4 illustrates sample paths for the stochastic process corresponding to the deterministic trajectory in Figure 3. In this example, 61 out of 100 independent runs led to the global eradication of poliovirus (i.e., the number of infected hosts hit the absorbing boundary at zero). However, in the remaining runs, poliovirus escaped extinction around t = tc, increased again, leading to an outbreak by a virulent strain. The probability of successful eradication is thus 61% by the parameter set used in Figure 4.
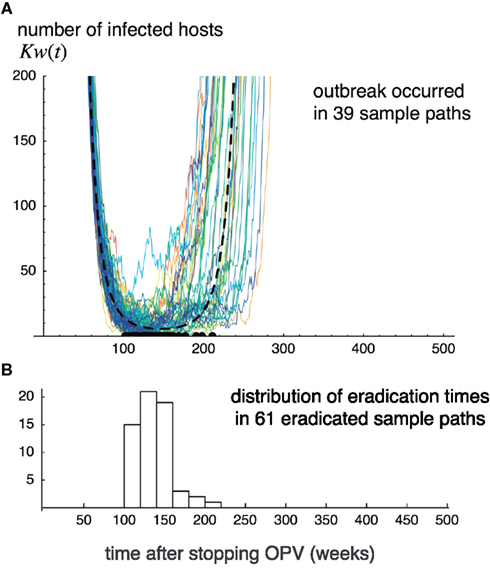
Figure 4. Sample paths for the number of infecteds observed in Monte Carlo simulations. Sample paths for the number of infecteds observed in Monte Carlo simulations of the stochastic process corresponding to dynamics (7). One hundred independent runs are illustrated by thin lines. Thick broken lines indicate the deterministic trajectory (A). The histogram shows the distribution for the times at which viruses went to extinction (B). 38 out of 100 runs never go to extinction, and cause outbreaks. The parameters are the same as in Figure 3, and K = 108.
Parameter Dependence
Figure 5 illustrates how the probability of the failure of global eradication Pfail = 1 − Pext depends on each parameter, which we discuss in turn below. We set the following values as “standards,” and varied each of the parameters to see its effect. The fraction of immunized newborns before t = 0: p = 0.7; transmission rate of virulent virus: βv = 3.7, that of attenuated virus: either βa = βv or βa = βv/2; recovery rate: γ = 0.18 (in both viruses); mutation rate from attenuated to virulent viruses: μ = 0.1; natural host mortality: u = 0.00025 (all measured in units of weeks), and total population: K = 100 million. With the chosen values of β, u, and γ, the basic reproductive rate of polioviruses was R0 = 20. In Figure 5, lines indicate the eradication probability calculated from Eqs 8–11 for βa = βv, the dots indicate the observed eradication probability for 1000 independent runs of the stochastic process corresponding to the deterministic model (7) for βa = βv, and the crosses indicate that for βa = βv/2. We first discuss the results for βa = βv in Section “The Immunization Fraction p Before Stopping OPV, The Recovery Rate γ, The Transmission Rate β, The Mutation Rate μ From the Attenuated to Virulent Viruses, and The Total Population Size K” below, and discuss the effect of a lower transmission rate of attenuated virus in 3.2.6.
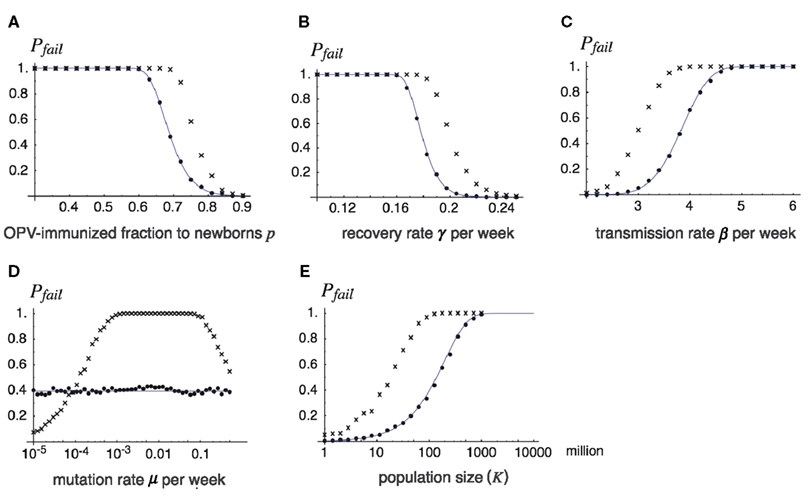
Figure 5. The probability of the failure of global eradication as a function of epidemiological and genetic parameters. Each panel shows how the probability of failing the global eradication Pfail = 1 − Pext depends on a chosen parameter, where lines show analytical results drawn from Pext defined in Eq. 11, and dots show Monte Carlo simulation results. Except for the varying parameter in each panel, the parameters are fixed as p = 0.7, β = 3.7 (βv = βa = β for dots and lines, and βv = β, βa = β/2 for cross-hatched), γ = γv = γa = 0.18, m = 0.1, K = 108, and u = 0.00025. Varying parameters are: (A) fraction p of OPV immunization before its cessation, (B) recovery rate γ, (C) transmission rate β, (D) mutation rate μ, (E) total population size K. Lines: the probability of failure obtained from formula (11) in the text (for βv = βa = β), dots: the proportion of failing eradications in 1000 independent runs of the Monte Carlo simulation for βv = βa = β, and cross-hatched: that for βv = β, βa = β/2.
The immunization fraction p before stopping OPV
The effect of fraction p of OPV-immunized newborns before stopping the live vaccination is illustrated in Figure 5A. While the probability of failing eradication is low when p is sufficiently high, it rises drastically around p = 0.7 when p is decreased. For example, if the immunization fraction is 60% or less before OPV is stopped, future outbreak by virulent poliovirus is almost certain. There are two reasons why a lower p before stopping OPV enhances the risk of future outbreaks: first, it shortens the time for the susceptible host density to reach the epidemiological threshold, and second, it increases the initial infected density w0, thereby keeping the minimum density from extinction.
The recovery rate γ
The success of global eradication greatly depends on the recovery rate, or its reciprocal, the mean infectious period (Figure 5B). The higher the recovery rate, the more rapidly the number of poliovirus carriers decreases after supply by OPV is stopped. It is then possible to make the expected number of infecteds negligibly small when the susceptible fraction exceeds the epidemiological threshold. Conversely, by having a longer infectious period (a lower recovery rate), viruses safely persist over the endangered period around t = tc. In examples shown in Figure 5B, infectious periods of 7 weeks or longer are disastrous for eradication. In reality, the infectious period varies between hosts, such that in hosts with innate immunodeficiency the infectious period can be typically longer than 1 year (Hara et al., 1981; Kew et al., 1998). Even a tiny fraction of such hosts significantly increases the risk of virulent virus outbreaks, as we show later.
The transmission rate β
The effect of increasing the transmission rate (Figure 5C) is parallel to decreasing the recovery rate described above, and both can be regarded as having the effect of increasing R0. However, decreasing the recovery rate affects eradication probability more sensitively than increasing the transmission rate, as the former contributes to slowing the decay rate for the number of virus carriers as well as increasing R0 (see also Eq. 12).
The mutation rate μ from the attenuated to virulent viruses
The eradication probability is insensitive to the mutation rate from attenuated to virulent viruses for the case of βv = βa (Figure 5D). If viruses persist during the period around t = tc, it does not matter which type survived as eventually the virulent virus increases its relative frequency in the viral population (if βv = βa). Quite different results follow when the attenuated virus has a lower transmission rate than the virulent virus (the crosses), where the probability of failing eradication is maximized for an intermediate mutation rate.
The total population size K
This has an obvious dependence on the risk of outbreaks. The larger the population size, the larger the probability that viruses are not lost during the endangered period, and hence, the larger the risk of outbreaks. In the example shown in Figure 5E, a population of 10 million individuals has a more than 90% of chance for successful eradication, but communities of 100 and 1000 million have only 50% and less than 5% chances, respectively, using the same epidemiological parameters.
The transmission rate βa of attenuated virus smaller than that βv of virulent virus
In each panel of Figure 5, the probability of failing global eradication when the transmission rate βa of attenuated virus is half of that of virulent virus βv is plotted as the cross-hatches. In all cases except for the dependence of mutation rate, a lower transmission rate of attenuated viruses increases the risk of virulent virus outbreak after the cessation of OPV. This rather counter-intuitive results follow from the fact that silent circulation of attenuated viruses under live vaccination helps increasing the efficiency of immunization, as we have seen in the comparison between the threshold immunization fractions with and without silent circulation [see (2)], and the equilibrium densities for βa < βv (left panels of Figure 2) and for βa = βv (right panels). Decreasing the transmission rate of attenuated virus increases the density of susceptibles in the equilibrium population under vaccination, thus shortening the time until the susceptible density hits the epidemiological threshold after the cessation of OPV (compare Figure 2C with Figure 2D).
Tail of Infectious Period
A constant recovery rate assumed in the previous sections implies that the infectious period is exponentially distributed. One may suspect that an outbreak of vaccine-derived viruses a few years after the cessation of OPV might be the artifact caused by this long tail in the infectious period. We found, however, that the long tail in the infectious period is not necessary for this to happen – it is the silent circulation of avirulent polio viruses in the population, commonly observed in nature and occurring in our model as well, that is responsible for the outbreak that occurs long after the cessation of OPV. To show this, we conducted numerical simulations in which we assume that the host recovers exactly 4 weeks after the infection, i.e., the distribution of infectious period has no tail at all. The infected hosts nevertheless persist in the population far longer than 4 weeks (the infectious period of an individual) after stopping OPV, which allows the outbreak of vaccine-derived strain to occur a few years after the cessation (Figure 6).
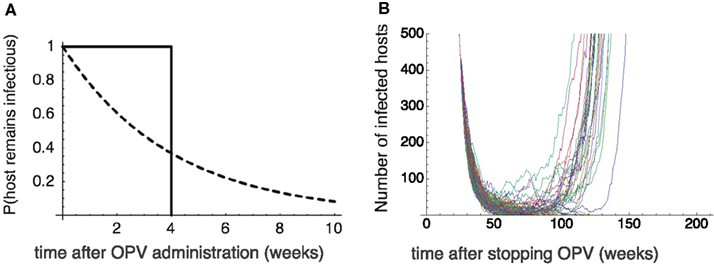
Figure 6. The effect of tail in the infectious period. (A) The probability that the host remains infectious after it is infected at time 0. Dotted curve: the exponential distribution assumed in the previous sections with a constant recovery rate γ = 0.25/week. Solid curve: the truncated distribution in which all the hosts recovers exactly 4 weeks after the infection. (B) The Monte Carlo simulation results assuming the truncated distribution of the infectious period. The time change in the number of virus infected hosts since OPV is stopped. Twenty-six out of 100 runs never go to extinction, and cause outbreaks. The emergence of virulent virus occurs after 50–60 weeks after the secession of OPV. The parameters are βa = 2.5, βv = 5, u = 0.00025, p = 0.6, μ = 0.1, and K = 108. The “mean” infectious period is 4 weeks.
Marginal Risk of Outbreak
Figure 7 illustrates change over time in the marginal risk of viruses found at time t. Marginal risk is defined as 1 − q(t) – the probability that an infected host present at time t harbors viruses whose progeny will cause a future outbreak. Marginal risk is negligibly small just after t = 0, and rapidly increases with t near t = tc. In the parameters used in Figure 7, the rate of increase in probability is the highest around t = 150 when the susceptible host density exceeds the threshold (see Figure 3). However, the marginal risk of viruses before this point is by no means negligible as there is notable probability that progenies of viruses found during t = 100–150 would later cause an outbreak.
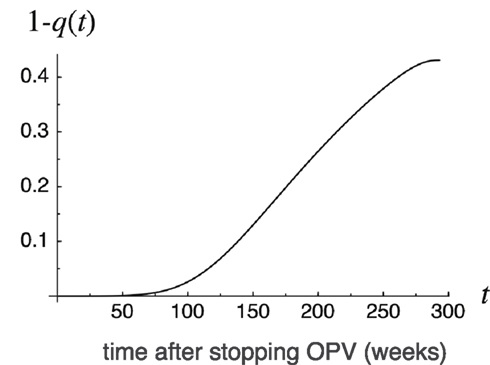
Figure 7. Marginal risk 1 − q(t) of outbreaks as a function of time t since OPV cessation. The marginal risk 1 − q(t) is defined as the probability that an infected host present at time t harbors viruses whose progeny will cause outbreaks in the future. p = 0.7, β = 3.7, γ = 0.18, u = 0.00025, K = 108.
Effect of a High-Risk Group
We here examine the case where a small fraction r of hosts has a recovery rate, γ′, much lower than γ for other hosts. In the simulation shown in Figure 8, the recovery rate of most individuals was γ = 0.2. Using this value, successful eradication is certain (other parameters: transmission rate, β = 2.5; natural mortality, u = 0.00025; immunization fraction before stopping OPV, p = 0.7; total population, K = 100 million). When we assume only 0.01% of newborns have a 10-times longer infectious period than other members, i.e., γ′ = 0.1γ, due to innate (World Health Organization, 1989; Fine and Carneiro, 1999), or acquired immunodeficiency, the probability of failure in global eradication rises to 79% (Figure 8). Thus even a tiny fraction of high-risk group drastically makes the global eradication difficult.
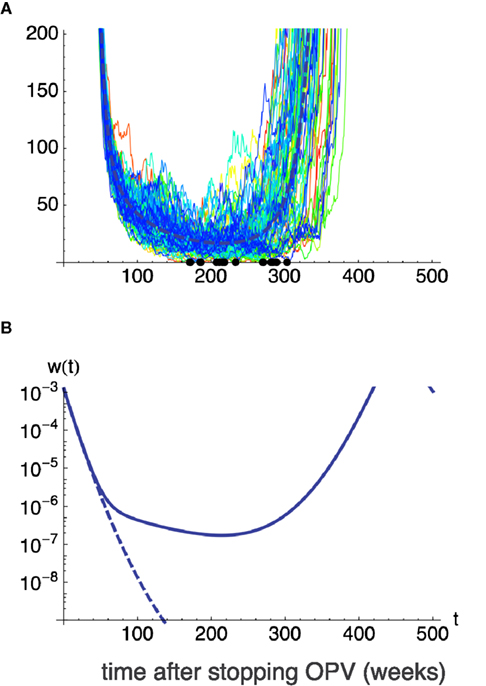
Figure 8. The effect of a high-risk group on global eradication. One in 10,000 (0.01%) of hosts are assumed to be born having a longer excretion period (lower recovery rate γ′) when infected by virus. Remaining hosts have the recovery rate γ. γ′ = 0.1γ and γ = 0.2 is assumed and values p = 0.7, β = 2.5, μ = 0.1, u = 0.00025, K = 108 are used for other parameters. Without the high-risk group, i.e., when all hosts have the recovery rate γ = 0.2, global eradication is certain. However, with the addition of a fraction 0.01% of high-risk group in the population, eradication fails in 79 out of 100 independent runs, allowing the outbreak of virulent virus. (A) Sample paths for the number of infecteds for 100 independent runs. Thick broken lines show the deterministic trajectory. (B) Deterministic trajectories for the fraction of infected w(t) when all hosts have the recovery rate γ (broken line), and when 0.01% of hosts have lower recovery rate γ′ (solid line).
Effectiveness of IPV
What if extensive IPV immunization follows the cessation of OPV? We assume in this case that all newborns are immunized by inactive vaccine before eventual eradication. The probability of global eradication is then evaluated in the light of the results obtained so far by replacing the transmission rates and recovery rates with values for previously IPV-immunized hosts instead of the values for susceptible hosts. IPV cannot prevent infection by either attenuated or virulent viruses, although it can reduce disease severity, and fewer viruses are excreted from IPV-immunized hosts than from unvaccinated hosts (Henry et al., 1966). IPV vaccination would therefore reduce the transmission rate and increase the global eradication probability (see Figure 5C). Also, IPV immunization reduces the infectious period, again increasing the probability of successful eradication (Figure 5B). However, these considerations assume that all hosts are IPV-immunized after the cessation of OPV. The actual amount of risk reduction by IPV depends on coverage, vaccine efficiency, and host heterogeneity in the excretion period.
Discussion
The PAHO and WPRO (Regional Office for the Western Pacific) declared the eradication of poliomyelitis in 1994 and 2000, respectively. Nevertheless, an outbreak of poliomyelitis caused by a type 1 vaccine-derived strain was reported in Haiti and the Dominican Republic in 2000 (Centers for Disease Control and Prevention, 2000), and an outbreak by a type 2 vaccine-derived strain has been reported in Egypt (Centers for Disease Control and Prevention, 2001), in Nigeria (Wassilak et al., 2011). It is assumed that both cases were due to the low rate of vaccine coverage. Although OPV or IPV immunization have been effective in controlling the transmission of wild-type strains, cases of re-emergence by wild-type strains have been reported in several countries (Patriarca et al., 1997) in which inadequate vaccine potency or a high rate of unimmunized individuals led to low herd immunity in the population.
According to a review by Patriarca et al. (1991) rates of seroconversion by OPV approached 100% for each serotype in industrialized countries, but were ∼70% for types 1 and 3 in developing countries. Many studies have demonstrated that interference by enteroviruses in human gut and other factors in OPV administration affect the seroconversion rate (Triki et al., 1997). Thus, even if OPV coverage is as high as 90%, the immunized fraction p in our model becomes 62%, under the 70% seroconversion rate observed in developing countries. This should invoke serious concern if we recall that the reduction in immunization fraction p before cessation of OPV drastically increases the risk of outbreak, as shown in Figure 5A).
Our results have specifically shown that a herd immunity level of less than 60% before the cessation of OPV led to the failure of poliovirus eradication under typical epidemiological parameters adopted in this paper. This suggests that maintaining more than 90% OPV coverage is not enough to ensure successful eradication, and that every effort should be made to increase the seroconversion rate in developing countries. Another important parameter affecting the probability of eradication is the recovery rate γ estimated from the mean infectious period. Most data concerning virus excretion rates available from field studies were for the type 1 vaccine strain (Alexander et al., 1997), while much less information is available for types 2 and 3. As type 2 and particularly type 3 have longer excretion periods than type 1, these strains are more likely to persist after cessation of OPV and be the causative agents of outbreaks. In assessing risk, we varied the recovery rate in the range γ = 0.1 − 0.25, based on estimates for the excretion period of type 3 poliovirus, which appears to have the longest excretion period. Whether this overestimates the risk will eventually be settled by more accurate estimations of excretion periods. However, there may not be enough time to allow the necessary studies, and action may need to taken now assuming the worst possible scenario.
We have shown that even when the mean infectious period is far below the fatal level for eradication failure (e.g., less than 7 weeks in the example shown in Figure 5B), the presence of a tiny fraction of immunodeficient individuals greatly increases the risk of disease re-emergence. This was because the primary immunodeficient group acts as a long-term viral reservoir, allowing the virus to persist through the endangered period around tc (which comes typically 150–200 weeks after the cessation of OPV). At present, no evidence exists whether secondary immunodeficient groups, such as HIV infected patients, could act as a long-term reservoir of poliovirus, but it is possible. Monitoring virus excretion from such high-risk groups would become critically important.
Another factor that drastically increases the risk of polio outbreak after the cessation of OPV is lower transmission rate βa of attenuated viruses than that βv of vaccine-derived virulent viruses, as we have shown in Figure 5 where the results for βa = βv/2 is compared with the case βa = βv. If we further reduces the transmission rate of attenuated viruses to βa = βv/4, the risk of outbreak rises up still more (not shown). This rather unexpected and hazardous dependency comes from the fact that silent circulation of attenuated viruses under vaccination is beneficial in increasing the efficiency of herd immunity. The more is the transmission rate of attenuated viruses, the less is the fraction of hosts that remain susceptible under a fixed vaccination rate. Reducing the transmission rate of attenuated viruses thus increases the susceptible density under vaccination, and hence shortens the time until the susceptible density hits the epidemiological threshold after the cessation of OPV.
Transmission rates (β) can be estimated from R0, which in turn have been estimated from the mean host age at infection (Anderson and May, 1982; Patriarca et al., 1997; Fine and Carneiro, 1999). Such surveys indicate that R0 of vaccine-derived poliovirus lies in the range 5–25, depending on the hygiene levels of the region. This is well above the threshold R0 = 1 that allows circulation in susceptible hosts. Eradication probability can be increased by reducing the transmission rate, i.e., by preventing vaccine-derived viruses from circulating in the population as much as possible. Public health attempts to reduce contact with infectious individuals becomes important in reducing the transmission rate β. At the same time, monitoring the circulation of shed virus in the healthy human population and environment becomes even more important after the last round of OPV.
Many studies have shown that immunity by IPV cannot prevent re-infection by poliovirus (Murdin et al., 1996). However, IPV immunization reduces mean excretion duration by 40% compared to unimmunized cases, thus increasing the recovery rate γ by 67% (Henry et al., 1966). IPV also reduces the transmission rate because the number of excreted viruses per unit time also declines. As a result of the increased γ and decreased β, the probability of eradication is higher if IPV immunization follows the cessation of OPV than if no program follows it. Although eradication cannot be achieved without OPV, IPV should be considered, together with its high seroconversion rate, as the primary follow-up strategy after OPV cessation to prevent the secondary transmission of vaccine-derived virus (Ghendon and Robertson, 1994; Sutter et al., 2000).
Neither escape-mutation by antigenic drift (Nowak and May, 1991; Nowak et al., 1991; Sasaki, 1994; Haraguchi and Sasaki, 1997; Sasaki and Haraguchi, 2000) nor the emergence of vaccine-resistant strains (Anderson and May, 1991; McLean, 1995) is considered in this paper, though, in our analysis of IPV immunization, both attenuated and virulent viruses can be regarded as IPV-resistant strains. The presence of multiple serotypes in the viral population complicates the eradication strategy (Lipsitch, 1997). The reason we have ignored such factors in this model of polio eradication is the observation that nucleotide divergence within the VP1 region, which includes the antigenic site, is less than 1.4% in vaccine strains, enabling the protection by OPV or IPV immunization (Matsuura et al., 2000). In a study using a monoclonal antibody toward a vaccine strain, substitutions in the VP1 region did affect neutralization (Wiegers et al., 1989). However, these vaccine-derived strains could still be neutralized by polyclonal antiserum (Matsuura et al., 2000), or be prevented under well-maintained herd immunity (Iwai et al., 2008).
Our model suggests that susceptible host density exceeds the threshold around the time tc ≈ Lp/R0 after the cessation of OPV (e.g., tc = 140 weeks when life expectancy L = 1/u = 4000 weeks, immunization fraction p = 0.7 and basic reproductive ratio R0 = 20). During the dangerous period around tc, additional surveillance systems other than normal AFP (acute flaccid paralysis) surveillance should be organized to reduce the risk of re-emergence:
1. Seroepidemiological surveillance of the seroconversion rate within a population. For communities with low seroconversion rates, additional immunization by IPV should be offered. Herd immunity should be maintained at a level over 80% seroconversion.
2. Surveillance of the environment and of shed virus from the source of infection. Upon poliovirus isolation, immunization by IPV is to be administrated to the risk area.
3. Public health administration. A hygiene control program (hand washing practice, use of disposal diapers, etc.) would contribute to the reduction in transmission rate β, preventing the virus from circulating.
4. Monitoring of high-risk groups such as immunodeficient individuals. It is very difficult to use IPV globally due to economic reasons and other administrative difficulties. IPV immunization in restricted regions and in at-risk communities, together with good surveillance systems and hygiene control programs, would be more practical tactics to globally extinguish vaccine-derived viruses.
Conflict of Interest Statement
The authors declare that the research was conducted in the absence of any commercial or financial relationships that could be construed as a potential conflict of interest.
Acknowledgments
This work was supported in part by The Graduate University for Advanced Studies (Sokendai).
References
Abraham, R., Minor, P., Dunn, G., Modlin, J., and Ogra, P. (1993). Shedding of virulent poliovirus revertants during immunization with oral poliovirus vaccine after prior immunization with inactivated polio vaccine. J. Infect. Dis. 168, 1105–1109.
Alexander, J. P. Jr., Gary, H. E. Jr., and Pallansch, M. A. (1997). Duration of poliovirus excretion and its implications for acute flaccid paralysis surveillance: a review of the literature. J. Infect. Dis. 175(Suppl. 1), S176–S182.
American Academy of Pediatrics Committee on Infectious Diseases. (1999). Poliomyelitis prevention: revised recommendations for use of inactivated and live oral poliovirus vaccines. Pediatrics 103, 171–172.
Anderson, R. M., and May, R. M. (1982). Directly transmitted infections diseases: control by vaccination. Science 215, 1053–1060.
Anderson, R. M., and May, R. M. (1991). Infectious Diseases of Humans: Dynamics and Control. Oxford: Oxford University Press.
Benyesh-Melnick, M., Melnick, J. L., Rawls, W. E., Wimberly, I., Oro, J. B., Ben-Porath, E., and Rennick, V. (1967). Studies of the immunogenicity, communicability and genetic stability of oral poliovaccine administered during the winter. Am. J. Epidemiol. 86, 12–136.
Centers for Disease Control and Prevention. (2000). Public health dispatch: Outbreak of poliomyelitis – dominican Republic and Haiti, 2000. JAMA 49, 1094–1103.
Centers for Disease Control and Prevention. (2001). Circulation of a type 2 vaccine- derived poliovirus – Egypt, 1982-1993. MMWR Morb. Mortal. Wkly. Rep. 50, 41–42, 51.
Dunn, G., Begg, N. T., Cammack, N., and Minor, P. D. (1990). Virus excretion and mutation by infants following primary vaccination with live oral poliovaccine from two sources. J. Med. Virol. 32, 92–95.
Eichner, M., and Dietz, K. (1996). Eradication of poliomyelitis: when can one be sure that polio virus transmission has been terminated? Am. J. Epidemiol. 143, 816–822.
Eichner, M., and Hadeler, K. P. (1995). Deterministic models for the eradication of poliomyelitis: vaccination with the inactivated (IPV) and attenuated (OPV) polio virus vaccine. Math. Biosci. 127, 149–166.
Fine, P. E. M., and Carneiro, I. A. M. (1999). Transmissibility and persistence of oral polio vaccine virus: Implications for the global poliomyelitis eradication initiative. Am. J. Epidemiol. 150, 1001–1021.
Gelfand, H. M., Potash, L., LeBlanc, D. R., and Fox, J. P. (1959). “Revised preliminary report on the Louisiana observation of the natural spread within families of living vaccine strains of poliovirus,” in Live Poliovirus Vaccines, Volume Scientific Publication No. 44, ed. C. H. Stuart-Harris (Washington, DC: Pan American Sanitary Bereau), 203–217.
Ghendon, Y., and Robertson, S. E. (1994). Interrupting the transmission of wild polioviruses with vaccines: immunological considerations. Bull. World Health Organ. 72, 973–983.
Hara, M., Saito, Y., Komatsu, T., Kodama, H., Abo, W., Chiba, S., and Nakao, T. (1981). Antigenic analysis of polioviruses isolated from a child with a gammaglobulinemia and paralytic poliomyelitis after Sabin vaccine administration. Microbiol. Immunol. 25, 905–913.
Haraguchi, Y., and Sasaki, A. (1997). Evolutionary pattern of intra-host pathogen anti- genic drift: Effect of cross-reactivity in immune response. Philos. Trans. R. Soc. Lond. B Boil. Sci. 352, 11–20.
Henry, J. L., Jaikaran, E. S., Davies, J. R., Tomlinson, A. J., Mason, P. J., Barnes, J. M., and Beale, A. J. (1966). A study of poliovaccination in infancy: excretion following challenge with live virus by children given killed or living poliovaccine. J. Hyg. (Lond.) 64, 105–120.
Iwai, M., Takizawa, T., Nakayama, T., Matsuura, K., Yoshida, H., Hasegawa, S., Obara, M., Horimoto, E., Kurata, T., and Horie, H. (2008). Evaluation of a two-dose administration of live oral poliovirus vaccine for wild and virulent vaccine-derived poliovirus type 1, 2, 3 strains in Japan. Scand. J. Infect. Dis. 40, 247–253.
Kew, O. M., Sutter, R. W., Nottay, B. K., McDonough, M. J., Prevots, D. R., Quick, L., and Pallansch, M. A. (1998). Prolonged replication of a type 1 vaccine-derived poliovirus in an immunodeficient patient. J. Clin. Microbiol. 36, 2893–2899.
Laassri, M., Lottenbach, K., Belshe, R., Rennels, M., Plotkin, S., and Chumakov, K. (2006). Analysis of reversions in the 5’-untranslated region of attenuated poliovirus after sequential administration of inactivated and oral poliovirus vaccines. J. Infect. Dis. 193, 1344–1349.
Lipsitch, M. (1997). Vaccination against colonizing bacteria with multiple serotypes. Proc. Natl. Acad. Sci. U.S.A. 94, 6571–6576.
Marker Test Subcommittee. The Japan Live Poliovaccine Research Commission. (1967). Evaluation of Sabin live poliovirus vaccine in Japan. IV. Maker tests on poliovirus strains recovered from vaccinees and their contacts. Jpn. J. Med. Sci. Biol. 20, 167–173.
Martinez, C., Old, M. O., Kwock, D. K., Khan, S. S., Garcia, J. J., Chan, C. S., Webster, R., Falkovitz-Halpern, M. S., and Maldonado, Y. A. (2004). Shedding of Sabin poliovirus type 3 containing the nucleotide 472 uracil-to-cytosine point mutation after administration of oral poliovirus vaccine. J. Infect. Dis. 190, 409–416.
Matsuura, K., Ishikura, M., Yoshida, H., Nakayama, T., Hasegawa, S., Ando, S., Horie, H., Miyamura, T., and Kitamura, T. (2000). Assessment of poliovirus eradication in Japan: Genomic analysis of the polioviruses isolated from the river water and the sewage in Toyama prefecture. Appl. Environ. Microbiol. 66, 5087–5091.
McLean, A. R. (1995). Vaccination, evolution and changes in the efficacy of vaccines - a theoretical framework. Proc. Biol. Sci. 261, 389–393.
Minor, P. D., Dunn, G., Ramsay, M. E., and Brown, D. (2005). Effect of different immunisation schedules on the excretion and reversion of oral poliovaccine strains. J. Med. Virol. 75, 153–160.
Miyamura, K., Yamashita, K., Yamadera, S., Kato, N., Akatsuka, M., Hara, M., Inouye, S., and Yamazaki, S. (1992). Poliovirus surveillance: isolation of polioviruses in Japan, 1980-1991. A report of the National Epidemiological Surveillance of Infectious Agents in Japan. Jpn. J. Med. Sci. Biol. 45, 203–214.
Murdin, A. D., Barreto, L., and Plotkin, S. (1996). Inactivated poliovirus vaccine: past and present experience. Vaccine 14, 735–746.
Nowak, M. A., Anderson, R. M., McLean, A. R., Wolfs, T. F. W., Goudsmit, J., and May, R. M. (1991). Antigenic diversity thresholds and the development of AIDS. Science 254, 963–969.
Nowak, M. A., and May, R. M. (1991). Mathematical biology of HIV infection: antigenic variation and diversity threshold. Math. Biosci. 106, 1–21.
Patriarca, P. A., Sutter, R. W., and Oostvogel, P. M. (1997). Outbreaks of paralytic poliomyelitis, 1976-1995. J. Infect. Dis. 175(Suppl. 1), S165–172.
Patriarca, P. A., Wright, P. F., and John, T. J. (1991). Factors affecting the immunogenicity of oral poliovirus vaccine in developing countries: review. Rev. Infect. Dis. 13, 926–939.
Poyry, T., Stenvik, M., and Hovi, T. (1988). Viruses in sewage waters during and after a poliomyelitis outbreak and subsequent nationwide oral poliovirus vaccination campaign in Finland. Appl. Environ. Microbiol. 54, 371–374.
Sasaki, A. (1994). Evolution of antigen drift/switching - continuously evading pathogens. J. Theor. Biol. 168, 291–308.
Sasaki, A., and Haraguchi, Y. (2000). Antigenic drift of viruses within a host: a finite site model with demographic stochasticity. J. Mol. Evol. 51, 245–255.
Shulman, L. M., Manor, Y., Handsher, R., Delpeyroux, F., McDonough, M. J., Halmut, T., Silberstein, I., Alfandari, J., Quay, J., Fisher, T., Robinov, J., Kew, O. M., Crainic, R., and Mendelson, E. (2000). Molecular and antigenic characterization of a highly evolved derivative of the type 2 oral poliovaccine strain isolated from sewage in Israel. J. Clin. Microbiol. 38, 3729–3734.
Sutter, R. W., Suleiman, A., Malankar, P., Al-Khusaiby, S., Mehta, F., Clements, G. B., Pallansch, M. A., and Robertson, S. E. (2000). Trial of a supplemental dose of four poliovirus vaccines. New Engl. J. Med. 343, 767–773.
Triki, H., Abdallah, M. V., Ben Aissa, R., Bouratbine, A., Ben Ali Kacem, M., Bouraoui, S., Koubaa, C., Zouari, S., Mohsni, E., Crainic, R., and Dellagi, K. (1997). Influence of host related factors on the antibody response to trivalent oral polio vaccine in Tunisian infants. Vaccine 15, 1123–1129.
Vaccine Administration Subcommittee. The Japan Live Poliovaccine Research Commission. (1966). Evaluation of Sabin live poliovirus vaccine in Japan. II. Clinical, virologic and immunologic effects of vaccine in children. Jpn. J. Med. Sci. Biol. 19, 277–291.
Wassilak, S., Pate, M. A., Wannemuehler, K., Jenks, J., Burns, C., Chenoweth, P., Abanida, E. A., Adu, F., Baba, M., Gasasira, A., Iber, J., Mkanda, P., Williams, A. J., Shaw, J., Pallansch, M., and Kew, O. (2011). Outbreak of type 2 vaccine-derived poliovirus in Nigeria: emergence and widespread circulation in an underimmunized population. J. Infect. Dis. 203, 898–909.
Wiegers, K., Uhlig, H., and Dernick, R. (1989). N-AgIB of poliovirus type 1: a discontinuous epitope formed by two loops of VP1 comprising residues 96-104 and 141-152. Virology 170, 583–586.
Wood, D. J., Sutter, R. W., and Dowdle, W. R. (2000). Stopping poliovirus vaccination after eradication: issues and challenges. Bull. World Health Orang. 78, 347–357.
World Health Organization. (1989). Report of a WHO sponsored meeting. Primary immunodeficiency diseases. Immunodefic. Rev. 1, 173–205.
World Health Organization. (2010). Global Polio Eradication Initiative Strategic Plan 2010–2012. Available at: http://www.polioeradication.org/Portals/0/Document/StrategicPlan/StratPlan2010_2012_ENG.pdf
Yoshida, H., Horie, H., Matsuura, K., and Miyamura, T. (2000). Characterisation of vaccine-derived polioviruses isolated from sewage and river water in Japan. Lancet 356, 1461–1463.
Zdrazilek, J., Drasnar, M., Hlavova, H., Jadrnickova, E., Jandasek, L., Kasova, V., Koza, J., Matyasova, I., Uvizl, M., Valihrach, J., and Weigen-dova, J. (1982). Presence of polioviruses and other enteral viruses in sewage: a survey in the Czech Socialistic Republic 1969-1976. J. Hyg. Epidemiol. Microbiol. Immunol. 26, 1–14.
Appendix
Derivation of Eq. 9
Here we derive Eq. 9 in the text. This is derived by noting that there may be i infected hosts in the next time step either if an infected host gives rise to i − 1 secondary infections and itself remains infected, or if it gives rise to i secondary infections and itself dies or recovers. Thus
with λ(t) = βKx(t), which then leads to (9) in the text.
Approximate Time and Number of Infecteds at the Minimum Point
It is useful to obtain an explicit formula for the minimum number of infecteds and the time at which this number reaches its minimum in the deterministic trajectory. This clarifies the parameter dependence on the risk of re-emergence. We found the following approximation useful. We ignore the first term in the right hand of (8a), because it remains very small during the time interval from t = 0 to t = tc, to give
(see, for example, Anderson and May, 1991). Integrating (8b) we have
Clearly w(t) attains the local minimum when t = tc where βx(t) = u + γ. Letting
with k = (u + γ)/u and R0 = β/(u + γ), we therefore have
where L = 1/u is the life expectancy, and R0 = β/(u + γ) the basic reproductive rate. We expect a high probability of eradication if Kwc is sufficiently smaller than 1, and show significant risk of re-emergence if it is 10 or more. The deviation of wc from the true minimum is small in logarithmic scale, though it is as large as 50% in normal scale. However, for the purpose of quickly checking the likelihood of successful eradication, this formula is useful. If we assume that x0 and w0 take the values at the endemic equilibrium with the vaccination rate p (Eq. 5 in the text), we obtain the asymptotic formula for large R0:
where D = 1/γ is the mean duration of infection.
Keywords: vaccine-derived strain, live vaccination, risk of re-emergence, silent circulation, poliovirus, branching process, demographic stochasticity, epidemiological dynamics
Citation: Sasaki A, Haraguchi Y and Yoshida H (2012) Estimating the risk of re-emergence after stopping polio vaccination. Front. Microbio. 3:178. doi: 10.3389/fmicb.2012.00178
Received: 25 January 2012; Paper pending published: 20 February 2012;
Accepted: 23 April 2012; Published online: 21 May 2012.
Edited by:
Hiroyuki Toh, National Institute of Advanced Industrial Science and Technology, JapanReviewed by:
Hironori Sato, National Institute of Infectious Diseases, JapanAlun Lloyd, North Carolina State University, USA
Copyright: © 2012 Sasaki, Haraguchi and Yoshida. This is an open-access article distributed under the terms of the Creative Commons Attribution Non Commercial License, which permits non-commercial use, distribution, and reproduction in other forums, provided the original authors and source are credited.
*Correspondence: Akira Sasaki, Department of Evolutionary Studies of Biosystems, The Graduate Universityu for Advanced Studies, Hayama, Kanagawa 240-0193, Japan. e-mail: sasaki_akira@soken.ac.jp