
- School of Oceanography, Center for Environmental Genomics, University of Washington, Seattle, WA, USA
Marine Synechococcus is a globally significant genus of cyanobacteria that is comprised of multiple genetic lineages or clades. These clades are thought to represent ecologically distinct units, or ecotypes. Because multiple clades often co-occur together in the oceans, Synechococcus are ideal microbes to explore how closely related bacterial taxa within the same functional guild of organisms co-exist and partition marine habitats. Here we sequenced multiple gene loci from cultured strains to confirm the congruency of clade classifications between the 16S–23S rDNA internally transcribed spacer (ITS), 16S rDNA, narB, ntcA, and rpoC1 loci commonly used in Synechococcus diversity studies. We designed quantitative PCR (qPCR) assays that target the ITS for 10 Synechococcus clades, including four clades, XV, XVI, CRD1, and CRD2, not covered by previous assays employing other loci. Our new qPCR assays are very sensitive and specific, detecting down to tens of cells per ml. Application of these qPCR assays to field samples from the northwest Atlantic showed clear shifts in Synechococcus community composition across a coastal to open-ocean transect. Consistent with previous studies, clades I and IV dominated cold, coastal Synechococcus communities. Clades II and X were abundant at the two warmer, off-shore stations, and at all stations multiple Synechococcus clades co-occurred. qPCR assays developed here provide valuable tools to further explore the dynamics of microbial community structure and the mechanisms of co-existence.
Introduction
Marine Synechococcus is an abundant and environmentally significant group of unicellular cyanobacteria that provides an ideal system to explore the ecology and evolution of closely related bacterial taxa and their niche partitioning of the global oceans (Scanlan and West, 2002). These small cyanobacteria (0.6–1.7 μm) belong to the functional class of picophytoplankton, the smallest (<2 μm) guild of photoautotrophs and contribute significantly to primary production (Waterbury et al., 1986; Li, 1994; Liu et al., 1997; Partensky et al., 1999; Jardillier et al., 2010). Molecular phylogeny has revealed a large genetic diversity amongst Synechococcus found in marine and estuarine waters. Based on 16S rDNA phylogeny, these strains have been classified into three major groups, labeled subclusters 5.1, 5.2, and 5.3 (Herdman et al., 2001; Dufresne et al., 2008; Scanlan et al., 2009). Phylogenies based on several additional loci reveal that these subclusters contain more than 20 distinct genetic clades. Genes used to study the diversity of marine Synechococcus include the 16S–23S internally transcribed spacer (ITS; Rocap et al., 2002; Ahlgren and Rocap, 2006; Chen et al., 2006; Choi and Noh, 2009; Cai et al., 2010; Huang et al., 2012), narB (nitrate reductase; Jenkins et al., 2006; Paerl et al., 2008, 2011), ntcA (a nitrogen regulatory gene; Penno et al., 2006; Post et al., 2011), rpoC1 (subunit of RNA polymerase; Palenik, 1994; Toledo and Palenik, 1997; Ferris and Palenik, 1998; Muhling et al., 2005), rbcL (Rubisco large subunit; Chen et al., 2006; Paerl et al., 2012), psbA (photosystem I gene; Zeidner et al., 2003), cpeB (phycoerythrin gene; Steglich et al., 2003), and petB (encoding the cytochrome b6 subunit of the cytochrome b6f complex; Mazard et al., 2012).
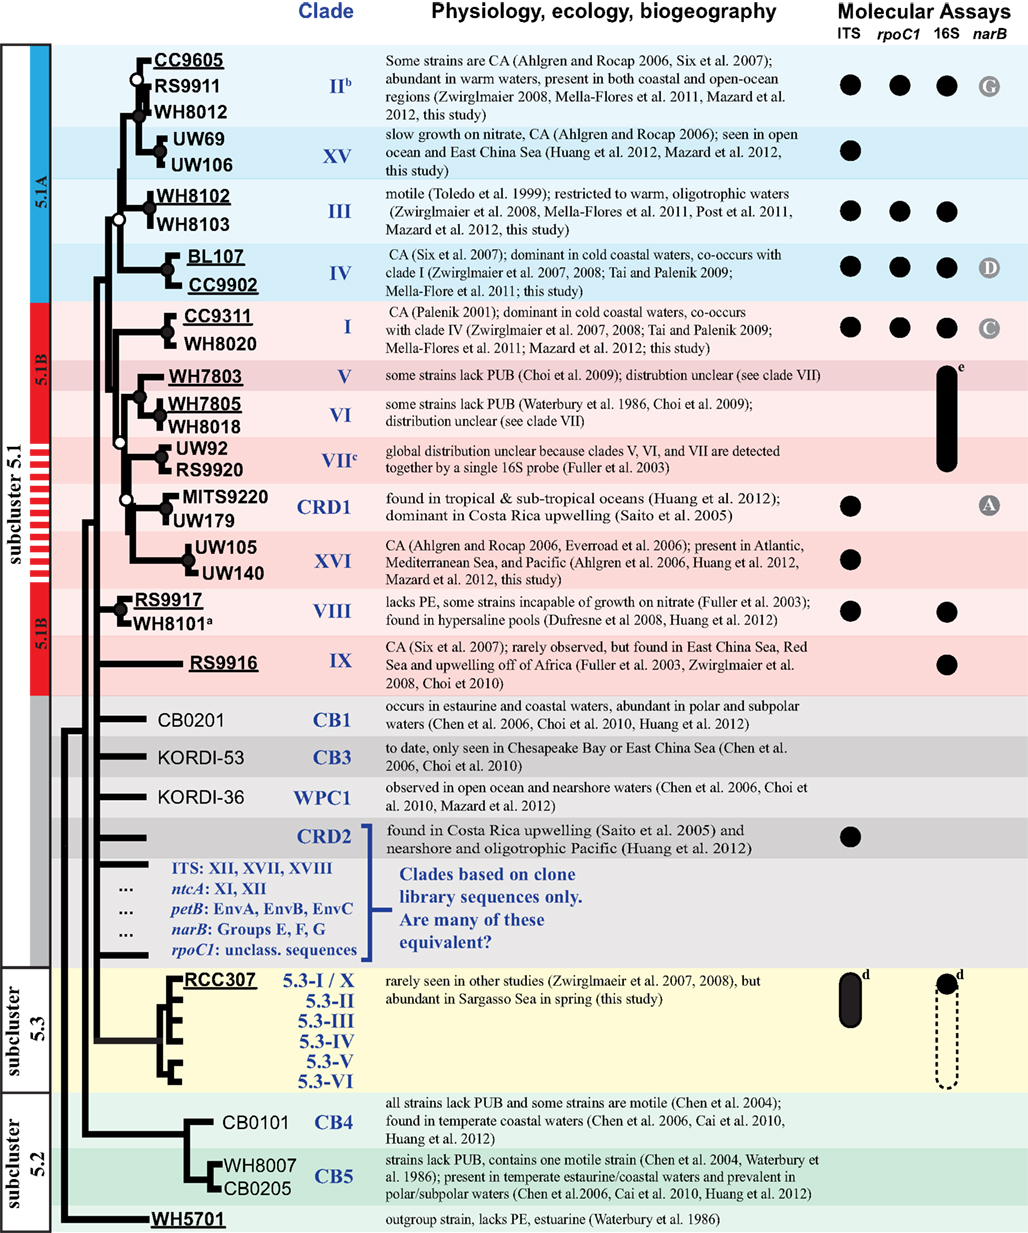
Figure 1. Schematic phylogenetic tree summarizing the genetic and ecological diversity of marine Synechococcus and molecular assays that have been developed to measure particular clades in the oceans. The depicted tree is approximately based on a four loci concatenated tree (Figure A6 in Appendix). Examples of commonly studied strains (“type” strains) in each clade are shown. Strains in bold were selected for multiple gene loci analysis, and strains with sequenced genomes are underlined. Branch tips without taxa names indicate clades that are only represented by environmental sequences (e.g., clade CRD2). Nodes with bootstrap support of ≥55% are denoted with circles (closed circles indicate >75% support and open circles indicate 55–75% support). Polytomies indicate cases where the placement of clades is uncertain because of low bootstrap support or the absence of sequences available for multiple loci. Marine Synechococcus are classified into three subclusters 5.1, 5.2, and 5.3 (black vertical boxes on left), and phylogeny based on 1,129 core genes from 11 strains with sequenced genomes supports the division of strains in subcluster 5.1 into two groups 5.1A (blue bar) and 5.1B (solid red bar) (Dufresne et al., 2008). The four loci concatenated phylogeny in Figure A6 in Appendix also supports the grouping of 5.1A strains, including clade XV. Strains in clades VII, CRD1, and XVI cluster with 5.1B strains in clades V and VI with high bootstrap support, however it is still unknown if these additional new strains without sequenced genomes form a single monophyletic cluster with all 5.1B strains (dashed red line). Information about specific physiologies, ecology, or biogeography of clades is summarized with relevant references. Chromatic adaptation (CA) is the ability to shift the ratio of accessory pigments phycourobilin (PUB) and phycoerythrobilin (PEB) according to the spectral quality of light (Palenik, 2001; Six et al., 2007). Circles (or ovals, see footnotes) indicate clades for which quantitative molecular assays have been designed to measure their abundance in the environment. [ITS, this study; rpoC1 (Tai and Palenik, 2009; Tai et al., 2011); 16S rDNA (Fuller et al., 2003); narB (Paerl et al., 2011)]. narB sequences have been classified to groups “A” to “G” rather than the convention of clades used by other loci (Paerl et al., 2011; see Figure A3 in Appendix). Circles with letters indicate the clade(s) for which narB qPCR primers designed for that narB group have perfect matches to at least one of the sequences in the clade (see Figure A3 in Appendix for more info on primer coverage). aWH8101 was formerly classified as belonging to cluster 5.2 (Herdman et al., 2001), but this and other phylogenies suggest it belongs in cluster 5.1. bClade II includes clade WPC2 following the convention of Huang et al. (2012). cClade XIII is congruent with and has been subsumed into clade VII (see Figure A4 in Appendix). dITS qPCR primers were designed to perfectly match clade X strains, now classified as clade 5.3-I. These primers have perfect matches to sequences from 5.3-I through 5.3-III (but not 5.3-IV through 5.3-VI; see Figure A2 in Appendix). Similarly, the clade X 16S rDNA probe was designed before the discovery of clades 5.3-II–5.3-VI. Because there are no corresponding 16S rDNA sequences for clades 5.3-II–5.3-VI, it is unknown if the clade X probe detects these other subcluster 5.3 clades as indicated by the dashed oval. eThis 16S rDNA probe detects clades V, VI, VII together.
These distinct clades are thought to represent physiologically and ecologically distinct lineages, or ecotypes, as has been seen in Prochlorococcus, the sister genus to marine Synechococcus. Genetically distinct clades of Prochlorococcus contain strains with ecologically relevant differences in light adaptation and nutrient utilization (Moore et al., 1998, 2002; Moore and Chisholm, 1999; Rocap et al., 2002), and these clades occupy distinct oceanic habitats that reflect their specific adaptations (West and Scanlan, 1999; Ahlgren et al., 2006; Johnson et al., 2006). Several Synechococcus clades similarly possess distinguishing physiologies that potentially impact their ecology (Figure 1). For example clade III strains possess a unique form of motility that is absent in most other clades and may allow them to find and scavenge nutrients in oligotrophic waters (Waterbury et al., 1985; Toledo et al., 1999; Chen et al., 2004). Other clades differ in their accessory light harvesting pigments (Waterbury et al., 1986; Rocap et al., 2002; Six et al., 2007; Choi and Noh, 2009) or the ability to change their light harvesting apparatus in response to the spectral quality of light they experience (chromatic adaptation; Palenik, 2001; Ahlgren and Rocap, 2006; Six et al., 2007). While Synechococcus clades are hypothesized to represent ecotypes, physiological characterization of isolates from many clades unfortunately still remains sparse, making it difficult to predict what distinct niches they may occupy (Figure 1).
Quantitative molecular assays measuring the abundance of specific Synechococcus clades have been used to characterize their biogeography and confirm that these clades occupy different niches and thus represent ecotypes. Assays include a suite of eight oligonucleotide probes that target 10 16S rDNA clades (clades I–X), three of which are detected together by a single probe (V, VI, and VII; Fuller et al., 2003); quantitative PCR (qPCR) assays that target four clades (I–IV) using the rpoC1 gene (Tai and Palenik, 2009); and qPCR assays that target seven groups of narB sequences that each contain one or more clades (Paerl et al., 2011; Figure 1). The use of coding genes for quantitative assays can be problematic because the third codon position often necessitates the use of degenerate primers, as is the case for the rpoC1 and narB assays. Furthermore, strains in some clades lack the narB gene and cannot utilize nitrate, such as RR9917 in clade IX (Scanlan et al., 2009) and MITS9220 in clade CRD1 (Moore et al., 2002). More recently, deep pyrosequencing of the 16S rDNA has been used to track clade abundances over time in the Red Sea (Post et al., 2011), non-degenerate petB primers have been developed for construction of Synechococcus specific clone libraries (Mazard et al., 2012), and DNA probes attached to fluorescent beads have been used to follow the abundances of subpopulations within clades I–IV (Tai et al., 2011). While each of the above methods targets a different locus, they reveal some cohesive patterns in the distribution of some of the major clades in the oceans. Clades I and IV are most abundant in colder, nutrient rich coastal waters while clade II and the combined group of clades V/VI/VII are widely distributed in tropical and sub-tropical waters (Zwirglmaier et al., 2007, 2008; Figure 1). Clade III is most prevalent in warm, oligotrophic waters, and appears to be specialized to these habitats (Fuller et al., 2003; Zwirglmaier et al., 2007, 2008; Mella-Flores et al., 2011; Post et al., 2011). Clade VIII may be specifically adapted to hypersaline waters (Dufresne et al., 2008; Huang et al., 2012) while other clades such as IX and X have been rarely seen and only at low abundance (Zwirglmaier et al., 2007, 2008).
The growing number of Synechococcus diversity studies and molecular assays to study their biogeography are valuable in describing the ecology of putative Synechococcus ecotypes, but the use of several different loci has made classification confusing and comparison of results from the different assays difficult. The various loci differ in their relative level of divergence, thus some clades may be defined too broadly or too narrowly. For example, the highly conserved 16S rDNA is less divergent than other loci and does not allow the development of specific oligonucleotides that can resolve clades V, VI, and VII unlike the ITS and other coding genes (Fuller et al., 2003; Ahlgren and Rocap, 2006; Huang et al., 2012). The use of different loci also makes it difficult to determine if clades defined by independent loci correspond to one another. This is especially the case for clades that contain only sequences obtained from environmental clone libraries (e.g., see Saito et al., 2005; Penno et al., 2006). Sequencing multiple loci in cultured isolates is necessary to verify potential overlap of clades identified by different loci. Recently, Mazard et al. (2012) conducted a classical multiple-locus sequence analysis (MLSA) study that established congruence among clades by using core genes including the rpoC1 and petB genes. They also examined the 16S rDNA and ITS, although these genes could not be included in MLSA as most Synechococcus genomes contain two identical copies of the 16S rDNA and ITS. Their analysis however did not include the commonly used ntcA or narB sequences (Ahlgren and Rocap, 2006; Jenkins et al., 2006; Penno et al., 2006; Paerl et al., 2008; Post et al., 2011), and the portion of the rpoC1 gene they sequenced did not overlap with the portion used in the large dataset of available rpoC1 sequences (Toledo and Palenik, 1997; Ferris and Palenik, 1998).
In order to further the consensus in the classification of Synechococcus clades, we sequenced five loci commonly used in field studies, 16S rDNA, ITS, narB, ntcA, and rpoC1, in cultured isolates distributed across 14 clades and compared the phylogenies of the different loci. After confirming that strains formed congruent clades across the loci examined, we developed an expanded set of qPCR assays that target ITS sequences for 10 genetic clades of marine Synechococcus, including newly described clades not detected by previous assays. The ITS was chosen because it is divergent enough to allow clear resolution of clades but still contains conserved regions for design of non-degenerate primers. Furthermore, because the ITS has been widely used it is the locus with the largest number of sequences available for primer design. These qPCR assays represent the most comprehensive set of quantitative assays for this genus and provide a valuable tool to further characterize the ecology of Synechococcus clades. Application of qPCR assays to a transect in the North Atlantic off of the eastern United States shows co-existence of multiple clades and large shifts in Synechococcus community composition between open-ocean and coastal environments.
Materials and Methods
Isolation of Synechococcus Strains and Environmental Sequences
Three new Synechococcus isolates were obtained following the procedures outlined in (Ahlgren and Rocap, 2006). UW1 was isolated from surface waters of Hood Canal (47° 36.4′ N 122° 56.4′ W) within Puget Sound (Washington state) on March 27, 2002. Strains UW179 and UW180 were isolated from the Equatorial Pacific south of Hawaii (12° 42.7′ N 157° 59.8′ W) from 125 m on February 2, 2004. A single colony was picked for each strain from pour plates made from cells grown in enrichment cultures. The ITS sequence CHA22 was obtained from a clone library constructed from surface water sampled off of San Juan Channel (48° 32.5′ N, 122° 59.4′ W) off of San Juan Island, Washington on April 30, 2004. The clone library was constructed following the methods outlined in Ahlgren and Rocap (2006).
Sequencing of Isolates
Between 1 and 5 ml of exponential phase culture was centrifuged at 18,000 × g for 10 min and the DNA was extracted from the cell pellet using either a DNeasy extraction kit (Qiagen, Valencia, CA, USA) or by quick heat lysis extraction: 95°C for 10 min in 50–100 μl of 10 mM Tris, 1 mM EDTA pH 8.0. PCR primers and reaction conditions used to amplify genes are listed in Table A1 in Appendix. PCR reaction volumes were 20 or 25 μl and contained 0.2 mM each dNTPs and 1–2 μl of template DNA. All PCR reactions started with an initial step of 95°C for 5–10 to denature the template DNA or activate the polymerase, and all reactions ended with a 6- to 10-min extension step at 72°C. 16S rDNA and 16S–23S rDNA ITS sequences were obtained by sequencing purified PCR products obtained with Taq polymerase (Promega, Madison, WI, USA). Quadruplicate 20 μl reactions were pooled and purified using a Qiaquick PCR Purification Kit (Qiagen) before sequencing reactions with DYEnamic ET dye terminator kit (Amersham Biosciences Corp., Piscataway, NJ, USA) and sequencing on a MegaBACE 1000 automated sequencer (Amersham Biosciences). For narB, ntcA, and rpoC1, PCR products were generated using Accuzyme (high fidelity polymerase PCR mix (Bioline USA Inc., Taunton, MA, USA). Products were gel purified (Qiagen gel extraction kit), cloned into sequencing vectors (TOPO TA Kit, Invitrogen Corp., Carlsbad, CA, USA), and sequenced with M13 vector primers. Raw sequences were aligned and visually inspected using Sequencher (Gene Codes Inc., Ann Arbor, MI, USA). Sequences have been deposited in GenBank under the following accession numbers: 16S rDNA, JQ421027–JQ421036; ITS, JQ421037–JQ421042, narB, JQ421043–JQ421045, ntcA, JQ421046–JQ421052; rpoC1, JQ421053–JQ421055. Additional details are listed in Table A2 in Appendix.
Phylogenetic Analyses
Phylogenetic trees were constructed using sequences obtained in this study, from previous studies and complete genome sequences (Dufresne et al., 2008). ITS sequences from previous studies (Beja et al., 2000; Suzuki et al., 2001; Ahlgren and Rocap, 2006; Chen et al., 2006; Choi and Noh, 2009; Cai et al., 2010; Choi et al., 2011; Mella-Flores et al., 2011; Huang et al., 2012; Mazard et al., 2012) were aligned to our existing database of sequences using automatic alignment (PT_server alignment tool) in ARB (Ludwig et al., 2004) and manual adjustment. For phylogenetic analyses, the two tRNAs in the ITS and the loop portions of stem-loop structures (predicted by MFOLD; Zuker, 2003) were excluded from alignments. Other 16S rDNA, narB, ntcA, and rpoC1 sequences were taken from previous studies (Giovannoni et al., 1990; Beja et al., 2000; Suzuki et al., 2001; Fuller et al., 2003; Muhling et al., 2005; Everroad et al., 2006; Jenkins et al., 2006; Penno et al., 2006; Dufresne et al., 2008; Kan et al., 2008; Choi and Noh, 2009; Mella-Flores et al., 2011; Mazard et al., 2012) These sequences were aligned either in ARB (16S rDNA) or using clustal (narB, ntcA, and rpoC1) with amino acid sequences.
Trees were constructed in PAUP* (Swofford, 1999) or RAxML (Stamatakis, 2006). The concatenated gene tree employed four loci, the 16S rDNA gene, the ITS, ntcA, and rpoC1. For the 16S rDNA, narB, ntcA, rpoC1 genes and the four concatenated loci, trees were constructed using minimum evolution as the criterion and the HKY85 model in PAUP* with gamma distributed rates of substitution and a proportion of invariable sites (HKY + i + g) estimated by maximum likelihood. Trees found with the HKY + i + g model were very similar to trees constructed using substitutions models suggested by MODELTEST (Posada and Crandall, 1998; data not shown). Bootstrap analysis was performed using neighbor joining. For the ITS, best tree analysis was done in PAUP* using neighbor joining and the HKY + i + g substitution model and bootstrap analyses were performed in PAUP* (neighbor joining trees) and RAxML with the GTRGAMMA model. Additional bootstrap analysis was done for the concatenated loci using minimum evolution and the Jukes–Cantor model in PAUP* and maximum likelihood in RAxML with the GTRGAMMA model.
qPCR Assay Design
Primers specific for 10 clades of marine Synechococcus were designed for use with qPCR assays (Table 1). Design of primers was guided by use of the probe design option in ARB (Ludwig et al., 2004), which searches for regions that are identical within a specified group of sequences and have several mismatches to other sequences. Primers targeted the 16S–23S rDNA ITS region and were designed to be identical to all sequences within each specified clade when possible but with significant mismatches to all other Synechococcus ITS sequences. Primers were designed so that mismatches to non-specific sequences were concentrated at the 3′ end. Because at the time of primer design only a few sequences were available for clades V, VI, VII, and IX, reliable primer sets could not be designed for these clades.
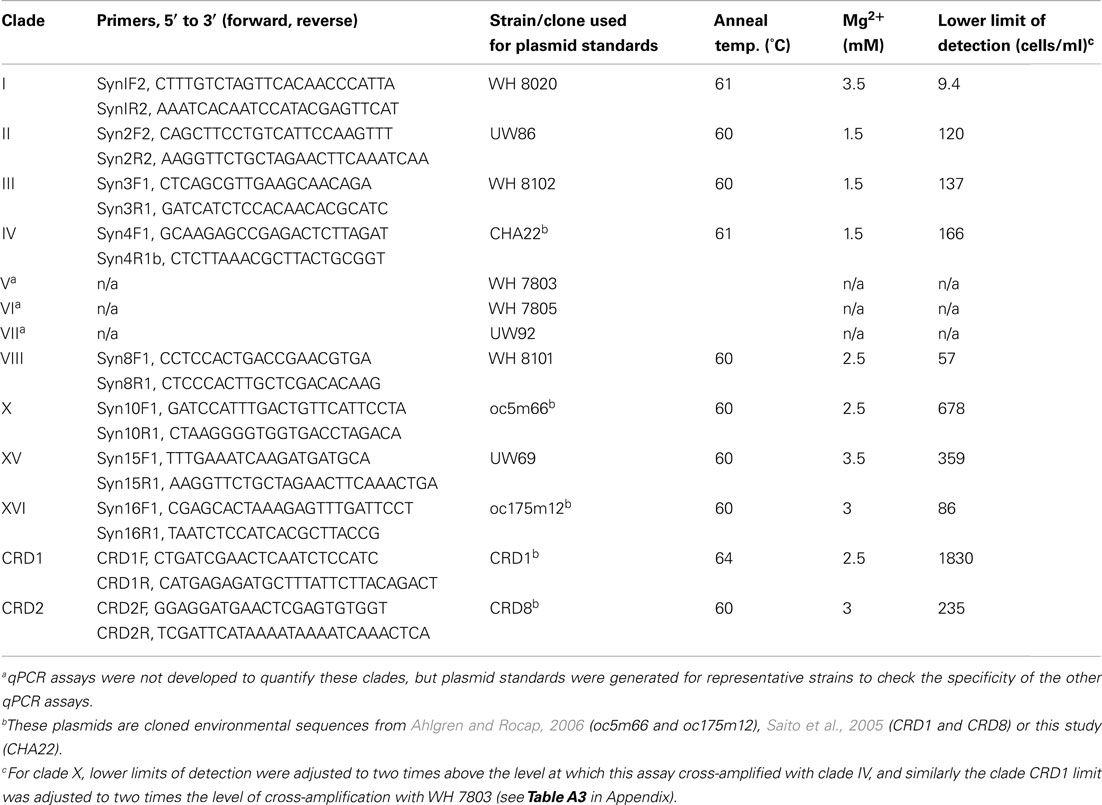
Table 1. Primers, plasmid standards, and optimized reaction and cycling conditions used for qPCR assays.
Quantitative PCR assays were optimized on an ICycler thermocycler (BioRad Inc., Hercules, CA, USA). For all reactions, 5 μl of template DNA was added to a reaction cocktail of 20 μl. Reactions contained Immomix PCR mix (Bioline USA Inc., Taunton, MA, USA), 10 nM fluorescein (for normalization of well-to-well variability), 0.4× Sybr Green I (Molecular Probes, Eugene, OR, USA), and 0.1% dimethyl sulfoxide. Primers were used at a final concentration of 500 nM. Magnesium chloride concentrations and thermocycling conditions (Table 1) were optimized to maximize amplification efficiency, reduce amplification of no template negative controls, and reduce cross-amplification with non-specific ITS sequences (see below). Cycling programs consisted of an initial 10 min step at 95°C to activate the polymerase followed by 45 cycles of 30 s at 95°C, 30 s at an optimized annealing temperature (given in Table 1), and 30 s at 72°C. A melting curve was done at the end of each assay to verify the specificity of amplicons.
Plasmid standards were created by cloning ITS PCR products into Escherichia coli using a TOPO TA cloning kit (Invitrogen Corp., Carlsbad, CA, USA). ITS PCR products were generated using the cyanobacterial specific PCR primers 16S-1247f and 23S-241r using reaction conditions in Rocap et al. (2002). Purified plasmids were linearized with restriction enzyme PstI or SphI using conditions recommended by the manufacturer (New England Biolabs, Ipswich, MA, USA). Linear plasmids were run on a 1.5% agarose electrophoresis gel and bands of correct length were excised and purified from the gel using a Qiagen Gel Extraction Kit. Plasmids were diluted serially in 10 mM Tris, 0.1 mM EDTA, pH 8.0, and quantified with Picogreen DNA stain (Molecular Bioprobes, Eugene, OR, USA). Strains used for generating standards for each primer set are listed in Table 1. For some clades we used plasmids from previously generated ITS environmental clone libraries. Plasmid standards were also constructed for strains from clades V, VI, VII for use in testing the specificity of qPCR assays (Table 1). Plasmid standards generated from cultured strains were sequenced to verify that the regions to which the qPCR primers anneal were identical to the sequence originally determined for the strain.
Calibration of qPCR Plasmid Standards
To report results from qPCR assays in terms of cells/ml for quantification of field samples, plasmid standards were calibrated to cell concentrations by making DNA filters with known amounts of cultured cells. Cultures were grown in artificial sea water with 800 μM ammonium, 50 μM phosphate, and trace metal mix (Moore et al., 2002) under a 12-h dark: 12 h light cycle at a light level of approximately 50 μmol Q m−2 s−1. Cells were harvested in exponential phase. For DNA extraction 20 or 25 ml of culture was collected on filters with gentle filtration (<15 mm Hg of vacuum). DNA was extracted from the filters with a simple heat lysis protocol (Zinser et al., 2006). Six-hundred fifty microliters of 10 mM Tris 0.1 mM EDTA pH 8.0 was added to filters, and filters were vigorously vortexed using a bead beater (BioSpec Products, Bartlesville, OK, USA) for 2 min at maximum speed to shred the filter and resuspend cells. Five-hundred microliters of the cell mixture was removed from the shredded filter, added to 1.5 ml centrifuge tubes, and incubated at 95°C for 15 min. To determine cell concentrations diluted cell cultures were preserved with 0.125% glutaraldehyde and frozen and stored in liquid N2 for later analysis using a Cytopeia InFlux flow cytometer (Cytopeia Inc., Seattle, WA, USA) following standard procedures (Marie et al., 2004). Calibration was done for clades for which we had cultured strains: clades I, II, III, VIII, XV, and XVI.
Field Sampling
Water samples were collected aboard the R/V Oceanus (cruise OC375) along a transect between Massachusetts and the northwest Atlantic in March 2002. Latitudes and longitudes for sample stations were as follows: Station 8 (Sargasso Sea), 34° 59.88′ N, 70° 13.92′ W; station 16 (Gulf Stream), 37° 36.36′ N, 70° 44.09′ W; station 17 (coastal), 38° 35.79′ N, 70° 45.69′ W; and station 19 (coastal), 40° 38.06′ N, 70° 50.59′ W. Water was sampled at discrete depths with 20 l Niskin bottles attached to a Sea-Bird conductivity, temperature, depth (CTD) package (Sea-Bird Electronics Inc., Bellevue, WA, USA). One-hundred ml of 20 μm pre-filtered sea water was filtered onto 25 mm 0.2 μm polycarbonate filters to collect DNA for analysis with qPCR. Cells were collected on filters with gentle filtration (<15 mm Hg of vacuum) and chased with Preservation Solution [0.5 M NaCl, 10 mM Tris (pH 8.0), 100 mM EDTA (pH 8.0)] following the protocols described in Ahlgren et al. (2006). Filters were flash frozen in liquid N2 and stored at −80°C until extraction and processing.
For flow cytometric analyses whole seawater samples were preserved with 0.125% glutaraldehyde, flash frozen in liquid N2, and stored at −80°C for later analysis. For stations 16, 17, and 19 cyanobacterial concentrations were determined using a Cytopeia InFlux flow cytometer (Cytopeia Inc., Seattle, WA, USA) following standard procedures (Marie et al., 2004). Synechococcus and Prochlorococcus concentrations were previously reported for station 8 on this cruise using a different flow cytometer (Ahlgren and Rocap, 2006). A partial depth profile from station 8 was rerun on the InFlux cytometer with slightly different results, likely due to inaccuracy in the flow rate assumed by the facility where samples were initially run. Thus the Prochlorococcus and Synechococcus abundances we report for station 8 were adjusted by a correction factor to account for discrepancies between the two measurements.
For measurement of clade abundances DNA filters were extracted with the heat lysis protocol described above. Triplicate PCR reactions were performed for each clade-specific primer set using 5 μl of template DNA in a reaction cocktail of 20 μl and other conditions described above and in Table 1. Synechococcus clades were quantified on an ICycler thermocycler (BioRad Inc., Hercules, CA, USA) using a five place plasmid standard curve (also amplified in triplicate) and cell concentrations were calculated using the calibration curves of cells versus plasmids standards.
Results
Phylogenies of Multiple Gene Loci
Because multiple loci (ITS, 16S rDNA, narB, ntcA, and rpoC1) have been used to describe the diversity of marine Synechococcus, we compared phylogenies of 24 strains inferred using these five loci to establish congruency in clades defined with individual loci. Where possible at least two strains from each clade were sequenced at all loci (Table A2 in Appendix). Comparison of the different trees reveals that the same monophyletic clades supported by high bootstrap values were seen across all loci (Figures A1–A5 in Appendix). We therefore created a phylogenetic tree using concatenated sequences of four of these loci (Figure A6 in Appendix; Figure 1) to create consensus assignments of strains to clades (Table A2 in Appendix). The narB gene was excluded from the concatenated analysis because it is absent in some strains (MITS9220 and RS9917).
Sequencing of multiple loci in key strains allowed us to resolve several issues in Synechococcus classification. Our phylogenies confirm that strains previously classified to clade VII based on 16S rDNA (Fuller et al., 2003) actually comprise two distinct clades, VII and CRD1 (Ahlgren and Rocap, 2006; Mazard et al., 2012; Figures A2–A5 in Appendix). Strains UW92 and RS9920 accordingly retain their classification to clade VII while strains CC9305, CC9317, CC9318, Eum14, MITS9220 are assigned to clade CRD1 (Table A2 in Appendix). Second, the framework established here allows placement of newly isolated or previously unclassified strains into clades. We isolated two new strains, UW179 and UW180, from the Equatorial Pacific which fall into clade CRD1. Strain CC9803 (obtained from B. Palenik) is a member of clade XV. Strain M16.17 (Everroad et al., 2006) clearly belongs to clade XVI along with strains UW140 and UW105 (Figure A1 in Appendix). On the other hand, strain M11.1 (Everroad et al., 2006) is more divergent from other strains than the typical divergence between established clades (Figure A1 in Appendix), and may represent a novel clade.
Finally, our phylogenies also resolve the identity of a few groups of sequences previously represented only by environmental clones. For example, by sequencing multiple loci in strains UW140 and UW105, we found that a previously obtained environmental sequence from the Red Sea was closely related to clade XVI (Figure A5 in Appendix) suggesting that this clade may be found in waters other than the Atlantic (Muhling et al., 2006). Similarly, clade XIII, previously defined only by environmental ntcA sequences, forms a well supported monophyletic group with clade VII strain UW92 (Figure A4 in Appendix). We conclude that clades VII and XIII are one and the same and we propose that the label XIII no longer be used. Despite this consolidation of sequences into previously defined clades, several clades represented only by environmental sequences still remain (e.g., clades CRD2, XVII, and XVIII for the ITS; XI and XII for ntcA; see Figure 1; Figures A2, A4, and A5 in Appendix).
Although single gene trees provide strong bootstrap support for individual clades, they did not always give strong support for the branching order of clades relative to one another (Figures A1–A5 in Appendix). However, a few clades do consistently branch together, often with high bootstrap support. For example clades V and VI appear as sister clades in all trees, and clades II and XV also frequently branch together. Our concatenated phylogeny of 24 strains using four loci also supports the existence of two larger subclusters of clades (5.1A and 5.1B) inferred using 11 strains and a phylogeny of >1,000 concatenated core genes (Dufresne et al., 2008). That study assigns clades II, III, IV to subcluster 5.1A and clades I, V, VI, VIII, and IX to subcluster 5.1B. Our four loci concatenated phylogeny supports the 5.1A clustering of clades II, III, and IV and adds clade XV (Figure 1; Figure A6 in Appendix). This phylogeny also suggests that clades I, V, VI, VII, XVI, and CRD1 form a second cluster, but without high bootstrap support (Figure A6 in Appendix). One difference between these phylogenies is that the core gene phylogeny places clade VIII strain RS9917 within subcluster 5.1B, but in our tree clade VIII strains appear to form a separate lineage, although there is not strong bootstrap support for this placement (Figure A6 in Appendix).
Design, Specificity and Calibration of qPCR Assays
Quantitative PCR primer sets targeting the 16S–23S rDNA ITS region were designed to quantify 10 clades of Synechococcus (Figure A2 in Appendix; Table 1). Primers were designed to be identical to all sequences within each specified clade when possible and have significant mismatches to all other Synechococcus ITS sequences.
After the design of these primers, additional Synechococcus ITS sequences have been published, and we reevaluated specificity of our primers to all publically available sequences. The degree to which primers match sequences (with 0, 1–2, or >2 mismatches) in each clade are shown in Figure A2 in Appendix. In most cases, our primers perfectly match the majority of sequences within each clade, and of the 758 total ITS sequences publically available for the 10 clades that our qPCR primers target, 598 or 79% of ITS sequences perfectly match our primers across the respective clades.
It is also important to note that Huang et al. (2012) identified several new sequences similar to clade X and reclassified this group of sequences into clades 5.3-I through 5.3-VI within subcluster 5.3 (see Figure 1), such that clade X sequences (e.g., strain RCC307) fall within clade 5.3-I. Our clade X qPCR primers are identical to most sequences within clades 5.3-I through 5.3-III but have two or three mismatches to sequences belonging to subclades 5.3-IV, 5.3-V, and 5.3-VI (Figure A2 in Appendix; Huang et al., 2012).
After optimizing qPCR reactions for maximal PCR efficiency by adjusting MgCl2 concentration and annealing temperature (Table 1), initial lower limits of detection for each assay were set by determining the lowest concentration of plasmid standard at which the CT values of triplicate reactions still had an error of ≤3%. The specificity of each assay was tested by challenging clade-specific qPCR assays with plasmid standards of other clades and the lower limits of detection were adjusted as necessary. Non-specific plasmids were tested at concentrations of 1.5 × 10⁵ copies/μl, equivalent to cell densities of approximately 3 × 10⁵ cells/ml. Except for primer sets for clade X, XVI, and CRD1, there was no non-specific amplification above the lowest set of plasmid standards. For clade X, the clade IV standard plasmid amplified nominally and the lower limit of detection was adjusted to two times that value (678 cells/ml, Table 1; Table A3 in Appendix). The CRD1 primer set amplified plasmids for strains UW92 (clade VII), WH 7803 (clade V), and clone CRD8 (clade CRD2) to starting concentrations <239 copies/μl and the lower limit of detection was adjusted to two times 239 μl/copies or the equivalent of 1830 cells/ml (Table 1; Table A3 in Appendix). Cross-amplification of the CRD1 set with plasmid oc175m12 (clade XVI) was significant, so a range of oc175m12 plasmid concentrations were quantified (from 1.54 × 10⁵ to 3.42 × 10² copies/μl). The clade XVI plasmid cross-amplified at a ratio of 1:25 (concentration of non-specific plasmid to concentration quantified, Table A3 in Appendix). Melt curves of clade XVI plasmids were very similar to those of the clade CRD1 standards (data not shown). The detection limit reported for clade CRD1 is two times the amplification of the WH 7803 plasmid standard (Table 1; Table A3 in Appendix), but because of the high cross-amplification of clade XVI plasmid, clade CRD1 qPCR concentrations must be evaluated judiciously if clade XVI sequences are present at high levels in the same sample.
Plasmid standards used for real-time PCR were calibrated to DNA extractions of known quantities of cell cultures in order to calculate and report concentrations of Synechococcus clades in environmental samples in terms of cells per ml. DNA was extracted from filters that were generated with cultures over a range of concentrations from strains presenting six different clades (I, II, III, VIII, and XV, and XVI). ITS concentrations determined by qPCR were plotted against the number of cells in extractions (Figure 2). Log–log regressions all had strong correlation coefficients, and the slopes of regressions were all very close to one (Table 2). There was some variability between the y-intercepts of the regressions for the different strains tested. Excluding clade XV strains, the calibration curves for the different Synechococcus strains had similar y-intercepts (Table 2), and calibration points grouped closely together (Figure 2). This degree of variability in y-intercepts was similar to the variability seen in previous calibrations of Prochlorococcus assays (range of 0.38 versus 0.46 in Zinser et al., 2006). The variability in y-intercepts translates to roughly twofold differences (100.38 = 2.4) between calibration curves and likely represents the limitations of qPCR to reliably detect at least twofold changes in copy number (Bar et al., 2003). Clade XV strains had noticeably higher y-intercepts than all other Synechococcus strains (Table 2; Figure 2), perhaps because these strains are more resilient to lysis than other clades resulting in lower yields of extracted genomic DNA.
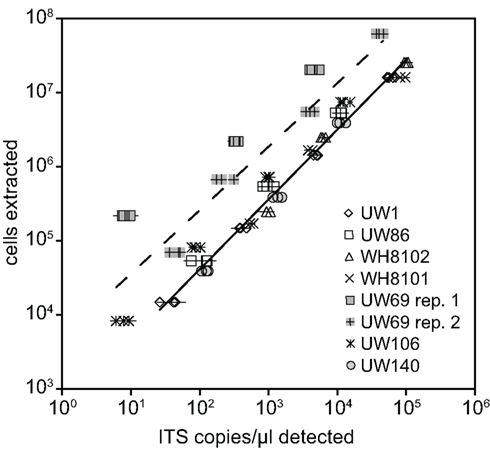
Figure 2. Calibration of qPCR assays. Known amounts of cells from cultures were filtered and extracted for various strains. Extracted cells were plotted against the concentration of ITS copies/μl detected with qPCR using plasmid standards. Triplicate filters were made and extracted for each concentration of cells tested. Points represent averages of quadruplicate qPCR reactions performed on each extraction, and error bars represent the standard deviation. Log–log regression lines are shown for all clade XV strains tested (dashed line, UW69 both replicate filter sets and UW106) and all remaining strains together (solid line).
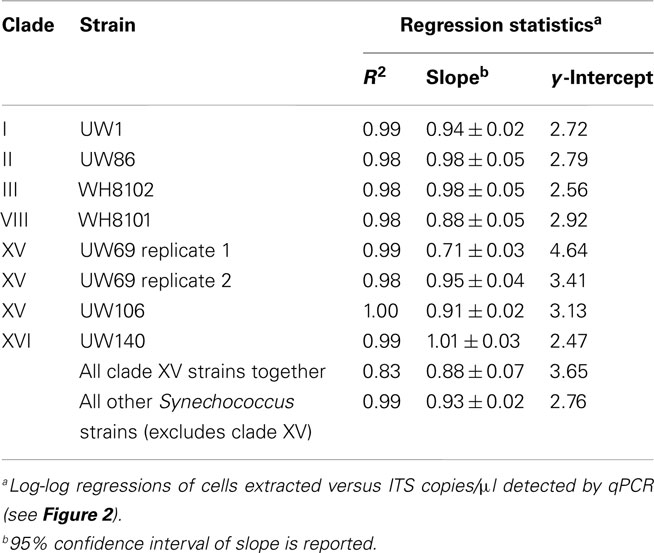
Table 2. qPCR assay calibration curve statistics (see Figure 2).
Regressions were used to convert ITS copies quantified in field samples to cells per ml. For the clade XV assay, the regression of all three calibrations (two replicate calibrations for strain UW69 and one for strain UW106) was used (Table 2). For clades I, II, III, VIII, and XVI, the regression values of each individual clade were used in back-calculating cell concentrations. For clades for which calibrations were not done (clades IV, X, CRD1, and CRD2), it was assumed that these clades have similar calibration curves to the other Synechococcus clades (excluding clade XV), and the slope and y-intercept from the regression of clades I, II, III, VIII, and XVI together were used.
Application of qPCR Assays in the Sargasso Sea
Samples were collected on a transect off of the eastern United States in March of 2002 which traversed from the Sargasso Sea (station 8) through the Gulf Stream (station 16) and into coastal waters south of Massachusetts (stations 17, 19; Figure 3). The water column in the Sargasso Sea was well mixed to at least 175 m (Figure 4), as is typical for spring (DuRand et al., 2001). The Gulf Stream exhibited a warm surface layer (24°C) and a small chlorophyll maximum just below the surface mixed layer at 40 m. Station 17 was fairly uniform in temperature, but showed a subsurface peak in chlorophyll fluorescence twice as large as the maximum seen at other stations. Station 19 was located over the continental shelf and the water column was well mixed with chlorophyll fluorescence levels slightly higher than the Gulf Stream and Sargasso Sea. Water temperature at station 17 (14°C) was significantly colder than at the off-shore stations, and the drop in temperature from station 17 to station 19 (6°C) was just as large as the shift from off-shore to near-shore stations.
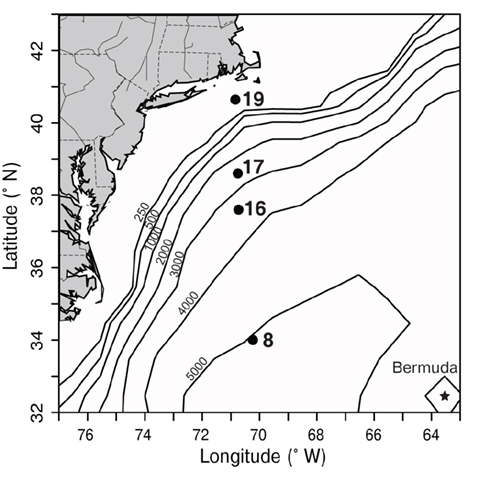
Figure 3. Map depicting sampling locations (black dots) along a transect in the northwest Atlantic, south of Massachusetts in March 2002. Bathymetric contours (black lines, depth in m) are shown, and the location of Bermuda is marked with a star. Station 8 was located in the Sargasso Sea and station 16 was located in the Gulf Stream (based on satellite sea surface temperature, data not shown). Stations 17 and 19 represent coastal stations.
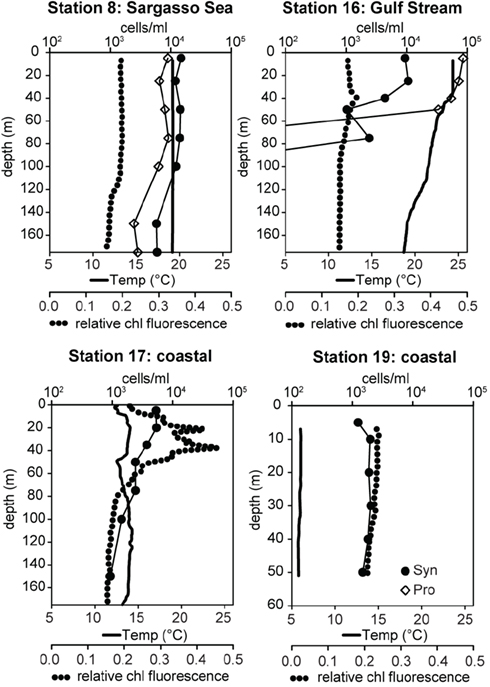
Figure 4. Water column properties of field samples and total Synechococcus (Syn, filled circles) and Prochlorococcus (Pro, open diamonds) concentrations determined by flow cytometry. Water temperature is depicted with solid lines and relative chlorophyll (chl) fluorescence with dotted lines.
Synechococcus and Prochlorococcus Population Structure
Total Synechococcus concentrations measured by flow cytometry decreased along the transect from the Sargasso Sea to the coast (Figure 4). Typical for this time of year, Synechococcus concentrations in the Sargasso Sea (14,000–36,000 cells/ml) outnumbered Prochlorococcus by 1.5- to 2-fold (DuRand et al., 2001). In contrast, Prochlorococcus concentrations in the Gulf Stream were >3 × 10⁴ cells/ml, 5- to 10-fold more abundant than Synechococcus. Neither genus was seen below 75 m in the Gulf Stream. Synechococcus concentrations at station 17 decreased slightly with depth ranging from 5,400 cells/ml at the surface to 934 cells/ml at 150 m. Synechococcus concentrations were fairly uniform (1,200–2,000 cells/ml) at the coastal station 19. No Prochlorococcus were observed at stations 17 and 19.
Synechococcus qPCR assays were applied to samples from these water columns. Amplicons of environmental samples had melt curves very similar to those of the plasmid standards for all clades detected (data not shown), further supporting the specificity of these assays. The abundance of the various clades reveal drastic shifts in community structure across the transect (Figures 5 and 6). Most significant was the shift in dominance of clades II and X in the warmer Sargasso Sea and Gulf Stream stations to clades I and IV at the colder coastal stations (stations 17 and 19). Only clades I and IV were detected at the coldest coastal station 19, but at station 17 several other clades (II, X, XV, and XVI) were detected at low abundance. Clades II, X, XV, and XVI were also present in the Sargasso Sea station. The Gulf Stream station was unique in that clade III was detected there and nowhere else. Clade II, X, and XVI were also detected in the Gulf Stream.
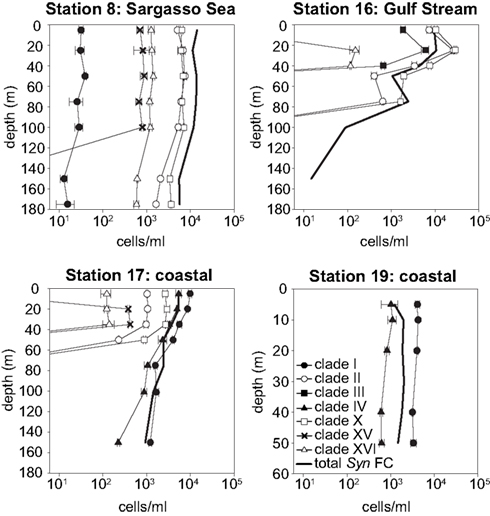
Figure 5. Clade abundances determined by qPCR, and total Synechococcus concentrations determined by flow cytometry (FC). Error bars represent the standard deviation of triplicate qPCR reactions.
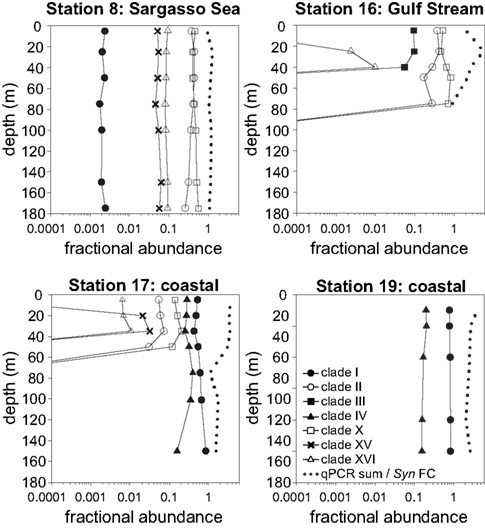
Figure 6. Relative abundances of Synechococcus clades and the ratio of summed abundances to total Synechococcus abundance determined by flow cytometry. Relative abundances of clades were calculated by dividing the abundance of each clade by the sum of all clades detected by qPCR. Dotted lines depict the ratios of summed qPCR abundances to total Synechococcus abundances determined by flow cytometry (qPCR sum/Syn FC).
Total Synechococcus cell abundances determined by flow cytometry were compared to the sum of clade concentrations determined by qPCR (Figure 6). In the Sargasso Sea, the sum of qPCR results were very similar to total Synechococcus densities determined by flow cytometry at all depths (ratio of 0.95–1.3), but the sum of qPCR abundances were greater than flow cytometry numbers for the remaining three stations (ratio of 1.1–5.7).
Discussion
A variety of loci (e.g., 16S, ITS, cpeA, narB, ntcA, petB, rbcL, rpoC1) have been used to assess and classify the diversity of marine Synechococcus. A MLSA using seven core genes found phylogenetic congruence between loci, reflecting relatively infrequent recombination between clades and general clonality in Synechococcus populations (Mazard et al., 2012). Consistent with this, the individual phylogenies determined here show congruence among five loci commonly used in diversity studies. Because our phylogenies included ntcA and the 5′ portion of rpoC1 not covered in the prior MLSA study (Mazard et al., 2012), we were able to show that previously unassigned rpoC1 sequences belong to clade XVI and that clade XIII defined by ntcA is synonymous with clade VII. We also assigned previously unclassified strains to appropriate clades (e.g., strain M16.17). However, there are still many clades across the various loci that are defined only by environmental sequences [e.g., clade XI and XII from ntcA (Figure A4 in Appendix) or clade CRD2 in the ITS (Figure A2 in Appendix)], and it is possible that some of these clades correspond to one another. Obtaining new isolates and determining relevant sequences is necessary to further resolve if any of the clades defined by different loci are in fact synonymous.
Establishing that commonly used loci define congruent clades enables comparison of clade abundances measured by molecular assays that use different target loci such as the ITS, as here, rpoC1 (Tai and Palenik, 2009) and 16S rDNA (Fuller et al., 2003) providing a better global picture of the biogeography of Synechococcus. One small caveat in these comparisons is that clade VII as defined by 16S rDNA sequences actually comprises two distinct clades (Ahlgren and Rocap, 2006; Mazard et al., 2012). Here we clarify the assignment of strains to clades VII and CRD1 and establish an independent assay for clade CRD1. However, it is not possible to compare quantitative data from assays currently designed for narB (Paerl et al., 2011) with the 16S rDNA, rpoC1, and ITS based assays. The narB qPCR primers detect sequences assigned to phylogenetic groups, named “A” through “G,” that do not follow the conventional classification of clades established by previous studies (Paerl et al., 2008, 2011) and in many cases these groups include multiple clades as defined here and elsewhere. The narB primers also have mismatches to the majority of sequences within their putative target groups (Figure A3 in Appendix). We suggest that these assays probably do not measure biologically relevant groups of sequences.
Phylogenomic analyses have divided marine Synechococcus clades into two larger phylogenetic groups (subclusters 5.1A and 5.1B; Dufresne et al., 2008). These subclusters were generally supported in our four gene concatenated tree, but individual gene phylogenies could not resolve the deeper evolutionary history of clades, consistent with other analyses of individual core genes (Mazard et al., 2012). The apparent rapid diversification of Synechococcus (Urbach et al., 1998) combined with low phylogenetic signal from the relatively short sequences used in single locus trees makes it difficult to resolve the higher branching order of the clades. Thus, although most individual loci are not adequate for resolving evolutionary relationships between clades, they contain enough variation to resolve fine-scale classification of Synechococcus diversity (placement of strains into clades), and can direct the selection of particular strains for genome sequencing to further resolve deeper evolutionary histories.
It has been suggested that subclusters 5.1A and 5.1B may reflect ecologically coherent groups that share common lifestyle strategies (Dufresne et al., 2008; Scanlan et al., 2009). Specifically 5.1A has been labeled as “open-ocean/specialists” and 5.1B as “coastal/opportunists”. However, the idea of ecological coherence within groups 5.1A and 5.1B is in conflict with the fact that clade I and IV have nearly identical habitat ranges and appear to be specialized for cold, coastal, and mesotrophic habitats (Zwirglmaier et al., 2007, 2008; Tai and Palenik, 2009; and this study) yet belong two different subclusters, 5.1B and 5.1A respectively. Similarly, clade II appears to be more like an “opportunist” or “generalist” type, but it belongs to subcluster 5.1A that is claimed to contain specialist types. Clade II is found in a variety of habitats, in both oligotrophic and upwelling regions as well as coastal and open-ocean habitats (Zwirglmaier et al., 2008; Huang et al., 2012; this study). We suggest an alternative hypothesis wherein clades with similar lifestyle strategies have arisen independently via parallel evolution since the divergence of the 5.1A and 5.1B lineages. Additional data on clade biogeography and phylogenomics are needed to corroborate this hypothesis and elucidate the mechanism by which disparate lineages may arrive at common adaptive solutions to life in the oceans.
Having established congruency in clade phylogeny among multiple loci, we developed a new comprehensive set of ITS qPCR assays that detect 10 clades of marine Synechococcus and tested them in the Western Atlantic. We chose the ITS as a sequence target because it is much more variable than the 16S rDNA, allowing better resolution of closely related clades. Because the ITS has been widely used in diversity studies in the past 10 years, it is the locus with the largest number of sequences available for primer design. Despite its overall sequence variability, the ITS retains conserved regions, likely with structural function (Rocap et al., 2002), that enable robust clade-specific primer design. This is in contrast to protein coding genes where third codon position variability requires either the use of degenerate primers (Tai and Palenik, 2009) or acceptance of a high percentage of mismatches to the target sequences (Paerl et al., 2011). The ITS assays quantify most of the clades detected by previous 16S rDNA based probe methods (I–IV, VIII, X; Fuller et al., 2003) and all clades detected by rpoC1 qPCR assays (I–IV; Tai and Palenik, 2009). Our new qPCR assays also detect newly characterized clades not covered by previous methods (XV, XVI, CRD1, and CRD2; Saito et al., 2005; Ahlgren and Rocap, 2006). Overall, the assays are extremely sensitive, able to detect, in some cases, concentrations as little as tens of cells per ml (Table 1). In all but one case, these assays are highly specific with little or no cross-amplification of other clades. The one exception is the clade CRD1 primer set which exhibits significant cross-amplification with clade XVI (at a ratio of 1:25), but clade CRD1 can still be reliably quantified when clade XVI is present at low concentrations.
High-throughput sequence analysis methods provide new approaches to quantifying genetic types from field samples. Mazard et al. (2012) have recently utilized sequencing and RFLP analysis of many sequences from petB clone libraries to characterize communities, and Post et al. (2011) have used high depth pyrosequencing of the 16S rDNA to track the abundance of Synechococcus clades over time. qPCR assays can still provide an advantage over sequence analysis methods in their ability to quantitatively measure abundance over several orders of magnitude and in particular to sensitively measure minority clades (e.g., see Figure 6). Less abundant types (i.e., those less than 0.1% of the population, as we have detected here, see Figure 6) may be missed or misrepresented by PCR or clone library based methods that require enormous depths of sampling to quantitatively measure rare taxa. There is growing interest in the significance of rare types as potential reservoirs of genomic diversity (Sogin et al., 2006), and indeed rare bacteria can contribute significantly to the metabolic function of ecosystems (Musat et al., 2008).
The new Synechococcus qPCR assays successfully detected seven clades in Atlantic water samples, including recently described clades XV and XVI. Clades XV and XVI were detected in the same waters from which we previously discovered these two new clades using both culture isolation and cyanobacterial clone libraries (Ahlgren and Rocap, 2006), as were most of the other clades observed in that previous study. Clade VIII was not detected by qPCR in any samples. This is not surprising since clade VIII appears to be most prevalent in hypersaline habitats (Zwirglmaier et al., 2008; Huang et al., 2012). Clades CRD1 and CRD2 also were not seen in the Atlantic, but the ITS qPCR assays can successfully detect these clades in the Pacific (Ahlgren and Rocap, unpub. data), consistent with their detection using clone libraries in Pacific waters (Saito et al., 2005; Huang et al., 2012).
Summed Synechococcus concentrations of clades determined by qPCR were often greater than those determined by flow cytometry. Application of the rpoC1 qPCR assays to field samples has also produced a similar overestimation of total Synechococcus populations (Tai and Palenik, 2009). Those authors speculate that this discrepancy is due to the presence of dividing cells that possess multiple genome copies but that are counted as only one cell by flow cytometry. Although most Synechococcus genomes contain two identical copies of the ITS, normalization of plasmid standards to cell cultures takes into account this fact. Some Synechococcus strains are known to possess multiple genome copies, and in some cases cells in culture maintain multiple genome equivalents at all times over the light:dark cycle even though field populations typically exhibit cyclical changes in ploidy level due to synchronization of cell cycle to the diel cycle (Binder and Chisholm, 1995; Vaulot et al., 1996; Liu et al., 1998; Jacquet et al., 2001; Holtzendorff et al., 2008; Griese et al., 2011). Natural Synechococcus populations can contain cells that contain >2 genome equivalents per cell, and the proportion of the population that has multiple genome copies varies between samples (Liu et al., 1998). Thus variability in ploidy level in natural populations across habitats and possible differences between laboratory cultures and natural populations could potentially explain overestimation of total cell number. Because overestimation by qPCR is typically threefold or less, we contend that significant ecological conclusions can still be drawn from the order of magnitude differences in clade abundances seen across the different sites sampled here.
The significant shift in Synechococcus community structure that we see in our Atlantic samples (Figures 5 and 6) is consistent with major patterns of clade biogeography inferred by previous studies. We find clade II highly abundant in warmer, off-shore stations, as seen in quantitative assays (Zwirglmaier et al., 2007, 2008) and diversity studies (Huang et al., 2012; Mazard et al., 2012). We found clade III only in surface waters in the Gulf Stream, the warmest station sampled (Figure 5). Clade III is typically found in warm oligotrophic water masses, such as the Mediterranean and the Red Sea only during summer (Fuller et al., 2005; Zwirglmaier et al., 2008; Post et al., 2011). Clade III has therefore been classified as an “oligotroph” (Zwirglmaier et al., 2008).
Our qPCR assays also confirm that clades I and IV dominate Synechococcus populations in cold, coastal waters (Zwirglmaier et al., 2007, 2008; Tai and Palenik, 2009; Tai et al., 2011; Huang et al., 2012; Mazard et al., 2012). The relative ratio of these clades shifts over seasonal cycles in California coastal waters and between different high latitude locales. In our samples, clade I was always more abundant than clade IV (1.7- to 6.5-fold), similar to observations in the spring off of California (Tai and Palenik, 2009). However in the Arctic, South Pacific, and Eastern Atlantic, clade IV is consistently more abundant than or on par with clade I concentrations (Zwirglmaier et al., 2008). These differences probably point to distinct adaptations between these two cold-adapted clades. Further application of qPCR assays to field samples or in lab competition experiments could provide insight into what controls the co-existence and relative abundance of clades I and IV in colder, coastal habitats.
Results from this Atlantic transect also provide insights into Synechococcus community structure that contrast from previous work. Here, clade X together with clade II dominated the warmer off-shore stations, but in previous 16S rDNA surveys, clade X was only rarely detected and never exceeded 10% of total cyanobacterial DNA amplified (Zwirglmaier et al., 2007, 2008). The prevalence of sequences from clades 5.3-I/X, 5.3-II, and 5.3-III in clone libraries constructed from open-ocean locations (e.g., sites UTK211, UTK262 from Huang et al., 2012) together with our data strongly suggests that these clades are adapted to open-ocean habitats.
We detected as many as six clades in a single sample (at coastal station 17, Figures 5 and 6) confirming the oft observed pattern that multiple clades of Synechococcus co-exist. For example, both here and in other studies, although clade I and IV are dominant in colder coastal waters, they are also present in warmer off-shore waters, albeit at low densities (Figures 5 and 6; Zwirglmaier et al., 2008). In addition, several clades such as IX, XV, and XVI have still only been seen to comprise minor portions of total Synechococcus populations. These clades may occur at higher concentrations only under particular conditions. For example in the Red Sea, clade III remains at low concentrations at most times of the year but peaks in abundance during summer, stratified conditions (Fuller et al., 2005; Post et al., 2011).
The qPCR assays developed in this study provide valuable tools to further identify the specific adaptations and niches of Synechococcus clades. Statistical analysis of clade abundance and concurrently measured environmental parameters suggests factors such as temperature, depth, light level, and macronutrient concentrations only explain a portion of the variance in clade abundance (Johnson et al., 2006; Zwirglmaier et al., 2008). Other factors not measured, such as trace metal availability and top-down pressure from grazers or phage are likely to be important in the adaptation and ecology of cyanobacterial ecotypes (Mann et al., 2002; Sullivan et al., 2003; Zwirglmaier et al., 2009; Apple et al., 2011; Strom et al., 2011). Only one study has simultaneously followed the diversity of Synechococcus and their infecting phage, and although clade abundances were not measured, significant covariation of host and phage diversity was observed, strongly suggesting that phage impact community structure (Muhling et al., 2005). Coupling qPCR assays with measurement of these other factors will help illuminate the ecology of Synechococcus clades. A mechanistic understanding of clade dynamics within this one group of marine cyanobacteria will enrich our broader understanding of the important drivers that control microbial community structure in the oceans and the mechanisms of co-existence for bacteria in general. Relatively small differences in nutrient utilization or adaptation to temperature between Prochlorococcus ecotypes can impact ocean basin-scale distributions (Johnson et al., 2006). Therefore understanding the structure of microbial populations at the ecotype scale of diversity is critical to assessing metabolic functioning of the oceans on a global scale (Follows et al., 2007).
Conflict of Interest Statement
The authors declare that the research was conducted in the absence of any commercial or financial relationships that could be construed as a potential conflict of interest.
Acknowledgments
We thank the captain and crew of the R/V Oceanus as well as E. V. Armbrust and R. Olson (chief scientists). We also thank D. Scanlan for cell pellets for strains RS9911 and RS9920 and B. Palenik for cell pellets from strain CC9803 and K. Peterson and C. Williams for assistance with sequencing. This work was supported by NSF grants OCE-0220826 and OCE-0352190 to G. Rocap and a NDSEG fellowship to N. Ahlgren.
References
Ahlgren, N. A., and Rocap, G. (2006). Culture isolation and culture-independent clone libraries reveal new marine Synechococcus ecotypes with distinctive light and N physiologies. Appl. Environ. Microbiol. 72, 7193–7204.
Ahlgren, N. A., Rocap, G., and Chisholm, S. W. (2006). Measurement of Prochlorococcus ecotypes using real-time polymerase chain reaction reveals different abundances of genotypes with similar light physiologies. Environ. Microbiol. 8, 441–454.
Apple, J., Strom, S., Palenik, B., and Brahamsha, B. (2011). Variability in protist grazing and growth on different marine Synechococcus isolates. Appl. Environ. Microbiol. 77, 3074–3084.
Bar, T., Stahlberg, A., Muszta, A., and Kubista, M. (2003). Kinetic outlier detection (KOD) in real-time PCR. Nucleic Acids Res. 31, e105.
Beja, O., Suzuki, M. T., Koonin, E. V., Aravind, L., Hadd, A., Nguyen, L. P., Villacorta, R., Amjadi, M., Garrigues, C., Jovanovich, S. B., Feldman, R. A., and DeLong, E. F. (2000). Construction and analysis of bacterial artificial chromosome libraries from a marine microbial assemblage. Environ. Microbiol. 2, 516–529.
Binder, B. J., and Chisholm, S. W. (1995). Cell cycle regulation in marine Synechococcus sp. strains. Appl. Environ. Microbiol. 61, 708–717.
Cai, H., Wang, K., Huang, S., Jiao, N., and Chen, F. (2010). Distinct patterns of picocyanobacterial communities in winter and summer in the Chesapeake Bay. Appl. Environ. Microbiol. 76, 2955–2960.
Chen, F., Wang, K., Kan, J., Bachoon, D., Lu, J., Lau, S., and Campbell, L. (2004). Phylogenetic diversity of Synechococcus in the Chesapeake Bay revealed by ribulose-1,5-bisphosphate carboxylase-oxygenase (RuBisCO) large subunit gene (rbcL) sequences. Aquat. Microb. Ecol. 36, 153–164.
Chen, F., Wang, K., Kan, J., Suzuki, M., and Wommack, K. (2006). Diverse and unique picocyanobacteria in Chesapeake Bay, revealed by 16S-23S rRNA internal transcribed spacer sequences. Appl. Environ. Microbiol. 72, 2239–2243.
Choi, D., and Noh, J. (2009). Phylogenetic diversity of Synechococcus strains isolated from the East China Sea and the East Sea. FEMS Microbiol. Ecol. 69, 439–448.
Choi, D., Noh, J., Hahn, M., and Lee, C. (2011). Picocyanobacterial abundances and diversity in surface water of the northwestern Pacific Ocean. Ocean Sci. J. 46, 265–271.
Dufresne, A., Ostrowski, M., Scanlan, D., Garczarek, L., Mazard, S., Palenik, B., Paulsen, I., de Marsac, N., Wincker, P., Dossat, C., Ferriera, S., Johnson, J., Post, A., Hess, W., and Partensky, F. (2008). Unraveling the genomic mosaic of a ubiquitous genus of marine cyanobacteria. Genome Biol. 9, R90.
DuRand, M. D., Olson, R. J., and Chisholm, S. W. (2001). Phytoplankton population dynamics at the Bermuda Atlantic Time-series station in the Sargasso Sea. Deep Sea Res. Part II Top. Stud. Oceanogr. 48, 1983–2003.
Everroad, C., Six, C., Partensky, F., Thomas, J., Holtzendorff, J., and Wood, A. (2006). Biochemical bases of type IV chromatic adaptation in marine Synechococcus spp. J. Bacteriol. 188, 3345–3356.
Ferris, M. J., and Palenik, B. (1998). Niche adaptation in ocean cyanobacteria. Nature 396, 226–228.
Follows, M., Dutkiewicz, S., Grant, S., and Chisholm, S. (2007). Emergent biogeography of microbial communities in a model ocean. Science 315, 1843–1846.
Fuller, N. J., Marie, D., Partensky, F., Vaulot, D., Post, A. F., and Scanlan, D. J. (2003). Clade-specific 16S ribosomal DNA oligonucleotides reveal the predominance of a single marine Synechococcus clade throughout a stratified water column in the Red Sea. Appl. Environ. Microbiol. 69, 2430–2443.
Fuller, N. J., West, N. J., Marie, D., Yallop, M., Rivlin, T., Post, A. F., and Scanlan, D. J. (2005). Dynamics of community structure and phosphate status of picocyanobacterial populations in the Gulf of Aqaba, Red Sea. Limnol. Oceanogr. 50, 363–375.
Giovannoni, S., Britschgi, T., Moyer, C., and Field, K. (1990). Genetic diversity in Sargasso Sea bacterioplankton. Nature 345, 60–63.
Griese, M., Lange, C., and Soppa, J. (2011). Ploidy in cyanobacteria. FEMS Microbiol. Lett. 323, 124–131.
Herdman, M., Castenholz, R. W., Waterbury, J. B., and Rippka, R. (2001). “Form-genus XIII. Synechococcus,” in Bergey’s Manual of Systematic Bacteriology, eds D. R. Boone and R. W. Castenholz (New York, NY: Springer-Verlag), 508–512.
Holtzendorff, J., Partensky, F., Mella, D., Lennon, J. F., Hess, W. R., and Garczarek, L. (2008). Genome streamlining results in loss of robustness of the circadian clock in the marine cyanobacterium Prochlorococcus marinus PCC 9511. J. Biol. Rhythms 23, 187–199.
Huang, S., Wilhelm, S. W., Harvey, H. R., Taylor, K., Jiao, N., and Chen, F. (2012). Novel lineages of Prochlorococcus and Synechococcus in the global oceans. ISME J. 6, 285–297.
Jacquet, S., Partensky, F., Lennon, J. F., and Vaulot, D. (2001). Diel patterns of growth and division in marine picoplankton in culture. J. Phycol. 37, 357–369.
Jardillier, L., Zubkov, M. V., Pearman, J., and Scanlan, D. J. (2010). Significant CO(2) fixation by small prymnesiophytes in the subtropical and tropical northeast Atlantic Ocean. ISME J. 4, 1180–1192.
Jenkins, B., Zehr, J., Gibson, A., and Campbell, L. (2006). Cyanobacterial assimilatory nitrate reductase gene diversity in coastal and oligotrophic marine environments. Environ. Microbiol. 8, 2083–2095.
Johnson, Z. I., Zinser, E. R., Coe, A., McNulty, N. P., Woodward, E. M. S., and Chisholm, S. W. (2006). Niche partitioning among Prochlorococcus ecotypes along ocean-scale environmental gradients. Science 311, 1737–1740.
Kan, J., Evans, S., Chen, F., and Suzuki, M. (2008). Novel estuarine bacterioplankton in rRNA operon libraries from the Chesapeake Bay. Aquat. Microb. Ecol. 51, 55–66.
Li, W. K. W. (1994). Primary production of prochlorophytes, cyanobacteria, and eukaryotic ultraphytoplankton – measurements from flow cytometric sorting. Limnol. Oceanogr. 39, 169–175.
Lindell, D., and Post, A. F. (2001). Ecological aspects of ntcA gene expression and its use as an indicator of the nitrogen status of marine Synechococcus spp. Appl. Environ. Microbiol. 67, 3340–3349.
Liu, H., Campbell, L., Landry, M. R., Nolla, H. A., Brown, S. L., and Constantinou, J. (1998). Prochlorococcus and Synechococcus growth rates and contributions to production in the Arabian Sea during the 1995 Southwest and Northeast Monsoons. Deep Sea Res. Part II Top. Stud. Oceanogr. 45, 2327–2352.
Liu, H. B., Nolla, H. A., and Campbell, L. (1997). Prochlorococcus growth rate and contribution to primary production in the equatorial and subtropical North Pacific Ocean. Aquat. Microb. Ecol. 12, 39–47.
Ludwig, W., Strunk, O., Westram, R., Richter, L., Meier, H., Yadhukumar, L., Buchner, A., Lai, T., Steppi, S., Jobb, G., Forster, W., Brettske, I., Gerber, S., Ginhart, A. W., Gross, O., Grumann, S., Hermann, S., Jost, R., Konig, A., Liss, T., Lussmann, R., May, M., Nonhoff, B., Reichel, B., Strehlow, R., Stamatakis, A., Stuckmann, N., Vilbig, A., Lenke, M., Ludwig, T., Bode, A., and Schleifer, K. H. (2004). ARB: a software environment for sequence data. Nucleic Acids Res. 32, 1363–1371.
Mann, E. L., Ahlgren, N., Moffett, J. W., and Chisholm, S. W. (2002). Copper toxicity and cyanobacteria ecology in the Sargasso Sea. Limnol. Oceanogr. 47, 976–988.
Marie, D., Simon, N., and Vaulot, D. (2004). “Phytoplankton cell counting by flow cytometry,” in Algal Culturing Techniques, ed. R. A. Anderson (London: Academic Press), 253–267.
Mazard, S., Ostrowski, M., Partensky, F., and Scanlan, D. J. (2012). Multi-locus sequence analysis, taxonomic resolution and biogeography of marine Synechococcus. Environ. Microbiol. 14, 372–386.
Mella-Flores, D., Mazard, S., Humily, F., Partensky, F., Mahe, F., Bariat, L., Courties, C., Marie, D., Ras, J., Mauriac, R., Jeanthon, C., Bendif, E. M., Ostrowski, M., Scanlan, D. J., and Garczarek, L. (2011). Is the distribution of Prochlorococcus and Synechococcus ecotypes in the Mediterranean Sea affected by global warming? Biogeosciences 8, 2785–2804.
Moore, L. R., and Chisholm, S. W. (1999). Photophysiology of the marine cyanobacterium Prochlorococcus: ecotypic differences among cultured isolates. Limnol. Oceanogr. 44, 628–638.
Moore, L. R., Post, A. F., Rocap, G., and Chisholm, S. W. (2002). Utilization of different nitrogen sources by the marine cyanobacteria Prochlorococcus and Synechococcus. Limnol. Oceanogr. 47, 989–996.
Moore, L. R., Rocap, G., and Chisholm, S. W. (1998). Physiology and molecular phylogeny of coexisting Prochlorococcus ecotypes. Nature 393, 464–467.
Muhling, M., Fuller, N. J., Millard, A., Somerfield, P. J., Marie, D., Wilson, W. H., Scanlan, D. J., Post, A. F., Joint, I., and Mann, N. H. (2005). Genetic diversity of marine Synechococcus and co-occurring cyanophage communities: evidence for viral control of phytoplankton. Environ. Microbiol. 7, 499–508.
Muhling, M., Fuller, N. J., Somerfield, P. J., Post, A. F., Wilson, W. H., Scanlan, D. J., Joint, I., and Mann, N. H. (2006). High resolution genetic diversity studies of marine Synechococcus isolates using rpoC1-based restriction fragment length polymorphism. Aquat. Microb. Ecol. 45, 263–275.
Musat, N., Halm, H., Winterholler, B., Hoppe, P., Peduzzi, S., Hillion, F., Horreard, F., Amann, R., Jorgensen, B. B., and Kuypers, M. M. M. (2008). A single-cell view on the ecophysiology of anaerobic phototrophic bacteria. Proc. Natl. Acad. Sci. U.S.A. 105, 17861–17866.
Paerl, R., Foster, R., Jenkins, B., Montoya, J., and Zehr, J. (2008). Phylogenetic diversity of cyanobacterial narB genes from various marine habitats. Environ. Microbiol. 10, 3377–3387.
Paerl, R. W., Johnson, K. S., Welsh, R. M., Worden, A. Z., Chavez, F. P., and Zehr, J. P. (2011). Differential distributions of Synechococcus subgroups across the California current system. Front. Microbiol. 2:59. doi:10.3389/fmicb.2011.00059
Paerl, R. W., Turk, K. A., Beinart, R. A., Chavez, F. P., and Zehr, J. P. (2012). Seasonal change in the abundance of Synechococcus and multiple distinct phylotypes in Monterey Bay determined by rbcL and narB quantitative PCR. Environ. Microbiol. 14, 580–593.
Palenik, B. (1994). Cyanobacterial community structure as seen from RNA-polymerase gene sequence-analysis. Appl. Environ. Microbiol. 60, 3212–3219.
Palenik, B. (2001). Chromatic adaptation in marine Synechococcus strains. Appl. Environ. Microbiol. 67, 991–994.
Partensky, F., Hess, W. R., and Vaulot, D. (1999). Prochlorococcus, a marine photosynthetic prokaryote of global significance. Microbiol. Mol. Biol. Rev. 63, 106–127.
Penno, S., Lindell, D., and Post, A. (2006). Diversity of Synechococcus and Prochlorococcus populations determined from DNA sequences of the N-regulatory gene ntcA. Environ. Microbiol. 8, 1200–1211.
Posada, D., and Crandall, K. A. (1998). MODELTEST: testing the model of DNA substitution. Bioinformatics 14, 817–818.
Post, A. F., Penno, S., Zandbank, K., Paytan, A., Huse, S. M., and Welch, D. M. (2011). Long term seasonal dynamics of Synechococcus population structure in the Gulf of Aqaba, Northern Red Sea. Front. Microbiol. 2:131. doi:10.3389/fmicb.2011.00131
Rocap, G., Distel, D. L., Waterbury, J. B., and Chisholm, S. W. (2002). Resolution of Prochlorococcus and Synechococcus ecotypes by using 16S-23S ribosomal DNA internal transcribed spacer sequences. Appl. Environ. Microbiol. 68, 1180–1191.
Saito, M. A., Rocap, G., and Moffett, J. W. (2005). Production of cobalt binding ligands in a Synechococcus feature at the Costa Rica upwelling dome. Limnol. Oceanogr. 50, 279–290.
Scanlan, D., Ostrowski, M., Mazard, S., Dufresne, A., Garczarek, L., Hess, W., Post, A., Hagemann, M., Paulsen, I., and Partensky, F. (2009). Ecological genomics of marine picocyanobacteria. Microbiol. Mol. Biol. Rev. 73, 249–299.
Scanlan, D. J., and West, N. J. (2002). Molecular ecology of the marine cyanobacterial genera Prochlorococcus and Synechococcus. FEMS Microbiol. Ecol. 40, 1–12.
Six, C., Thomas, J., Garczarek, L., Ostrowski, M., Dufresne, A., Blot, N., Scanlan, D., and Partensky, F. (2007). Diversity and evolution of phycobilisomes in marine Synechococcus spp.: a comparative genomics study. Genome Biol. 8, R259.
Sogin, M. L., Morrison, H. G., Huber, J. A., Mark Welch, D., Huse, S. M., Neal, P. R., Arrieta, J. M., and Herndl, G. J. (2006). Microbial diversity in the deep sea and the underexplored “rare biosphere.” Proc. Natl. Acad. Sci. U.S.A. 103, 12115–12120.
Stamatakis, A. (2006). RAxML-VI-HPC: maximum likelihood-based phylogenetic analyses with thousands of taxa and mixed models. Bioinformatics 22, 2688–2690.
Steglich, C., Post, A. F., and Hess, W. R. (2003). Analysis of natural populations of Prochlorococcus spp. in the northern Red Sea using phycoerythrin gene sequences. Environ. Microbiol. 5, 681–690.
Strom, S., Brahamsha, B., Fredrickson, K., Apple, J., and Gutierrez-Rodriguez, A. (2011). Constitutive defense in the microbial plankton: a giant cell surface protein in Synechococcus WH8102 inhibits feeding by a model dinoflagellate predator. J. Phycol. 47, S49.
Sullivan, M. B., Waterbury, J. B., and Chisholm, S. W. (2003). Cyanophages infecting the oceanic cyanobacterium Prochlorococcus. Nature 424, 1047–1051.
Suzuki, M. T., Beja, O., Taylor, L. T., and DeLong, E. F. (2001). Phylogenetic analysis of ribosomal RNA operons from uncultivated coastal marine bacterioplankton. Environ. Microbiol. 3, 323–331.
Swofford, D. L. (1999). PAUP*: Phylogenetic Analysis Using Parsimony (* and Other Methods). Sunderland, MA: Sinauer Associates.
Tai, V., Burton, R., and Palenik, B. (2011). Temporal and spatial distributions of marine Synechococcus in the Southern California Bight assessed by hybridization to bead-arrays. Mar. Ecol. Prog. Ser. 426, 133–147.
Tai, V., and Palenik, B. (2009). Temporal variation of Synechococcus clades at a coastal Pacific Ocean monitoring site. ISME J. 3, 903–915.
Toledo, G., and Palenik, B. (1997). Synechococcus diversity in the California current as seen by RNA polymerase (rpoC1) gene sequences of isolated strains. Appl. Environ. Microbiol.63, 4298–4303.
Toledo, G., Palenik, B., and Brahamsha, B. (1999). Swimming marine Synechococcus strains with widely different photosynthetic pigment ratios form a monophyletic group. Appl. Environ. Microbiol. 65, 5247–5251.
Urbach, E., Scanlan, D. J., Distel, D. L., Waterbury, J. B., and Chisholm, S. W. (1998). Rapid diversification of marine picophytoplankton with dissimilar light-harvesting structures inferred from sequences of Prochlorococcus and Synechococcus (Cyanobacteria). J. Mol. Evol. 46, 188–201.
Vaulot, D., LeBot, N., Marie, D., and Fukai, E. (1996). Effect of phosphorus on the Synechococcus cell cycle in surface Mediterranean waters during summer. Appl. Environ. Microbiol. 62, 2527–2533.
Waterbury, J. B., Watson, S. W., Valois, F. W., and Franks, D. G. (1986). Biological and ecological characterization of the marine unicellular cyanobacteria Synechococcus. Can. J. Fish. Aquat. Sci. 214, 71–120.
Waterbury, J. B., Willey, J. M., Franks, D. G., Valois, F. W., and Watson, S. W. (1985). A Cyanobacterium capable of swimming motility. Science 230, 74–76.
West, N. J., and Scanlan, D. J. (1999). Niche-partitioning of Prochlorococcus populations in a stratified water column in the eastern North Atlantic Ocean. Appl. Environ. Microbiol. 65, 2585–2591.
West, N. J., Schonhuber, W. A., Fuller, N. J., Amann, R. I., Rippka, R., Post, A. F., and Scanlan, D. J. (2001). Closely related Prochlorococcus genotypes show remarkably different depth distributions in two oceanic regions as revealed by in situ hybridization using 16S rRNA-targeted oligonucleotides. Microbiology 147, 1731–1744.
Zeidner, G., Preston, C. M., Delong, E. F., Massana, R., Post, A. F., Scanlan, D. J., and Beja, O. (2003). Molecular diversity among marine picophytoplankton as revealed by psbA analyses. Environ. Microbiol. 5, 212–216.
Zinser, E. R., Coe, A., Johnson, Z. I., Martiny, A. C., Fuller, N. J., Scanlan, D. J., and Chisholm, S. W. (2006). Prochlorococcus ecotype abundances in the North Atlantic Ocean as revealed by an improved quantitative PCR method. Appl. Environ. Microbiol. 72, 723–732.
Zuker, M. (2003). MFOLD web server for nucleic acid folding and hybridization prediction. Nucleic Acids Res. 31, 3406–3415.
Zwirglmaier, K., Heywood, J. L., Chamberlain, K., Woodward, E. M., Zubkov, M. V., and Scanlan, D. J. (2007). Basin-scale distribution patterns of picocyanobacterial lineages in the Atlantic Ocean. Environ. Microbiol. 9, 1278–1290.
Zwirglmaier, K., Jardillier, L., Ostrowski, M., Mazard, S., Garczarek, L., Vaulot, D., Not, F., Massana, R., Ulloa, O., and Scanlan, D. J. (2008). Global phylogeography of marine Synechococcus and Prochlorococcus reveals a distinct partitioning of lineages among oceanic biomes. Environ. Microbiol. 10, 147–161.
Zwirglmaier, K., Spence, E., Zubkov, M. V., Scanlan, D. J., and Mann, N. H. (2009). Differential grazing of two heterotrophic nanoflagellates on marine Synechococcus strains. Environ. Microbiol. 11, 1767–1776.
Appendix
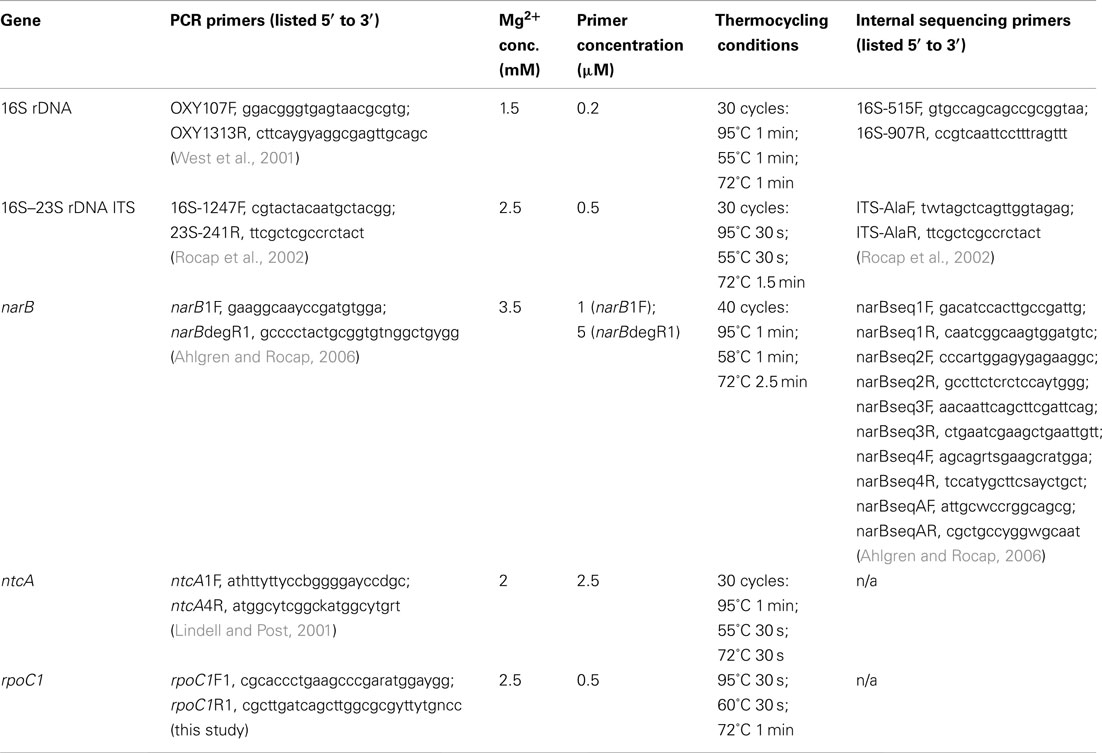
Table A1. Primers and PCR conditions used to amplify and sequence five loci from Synechococcus strains.
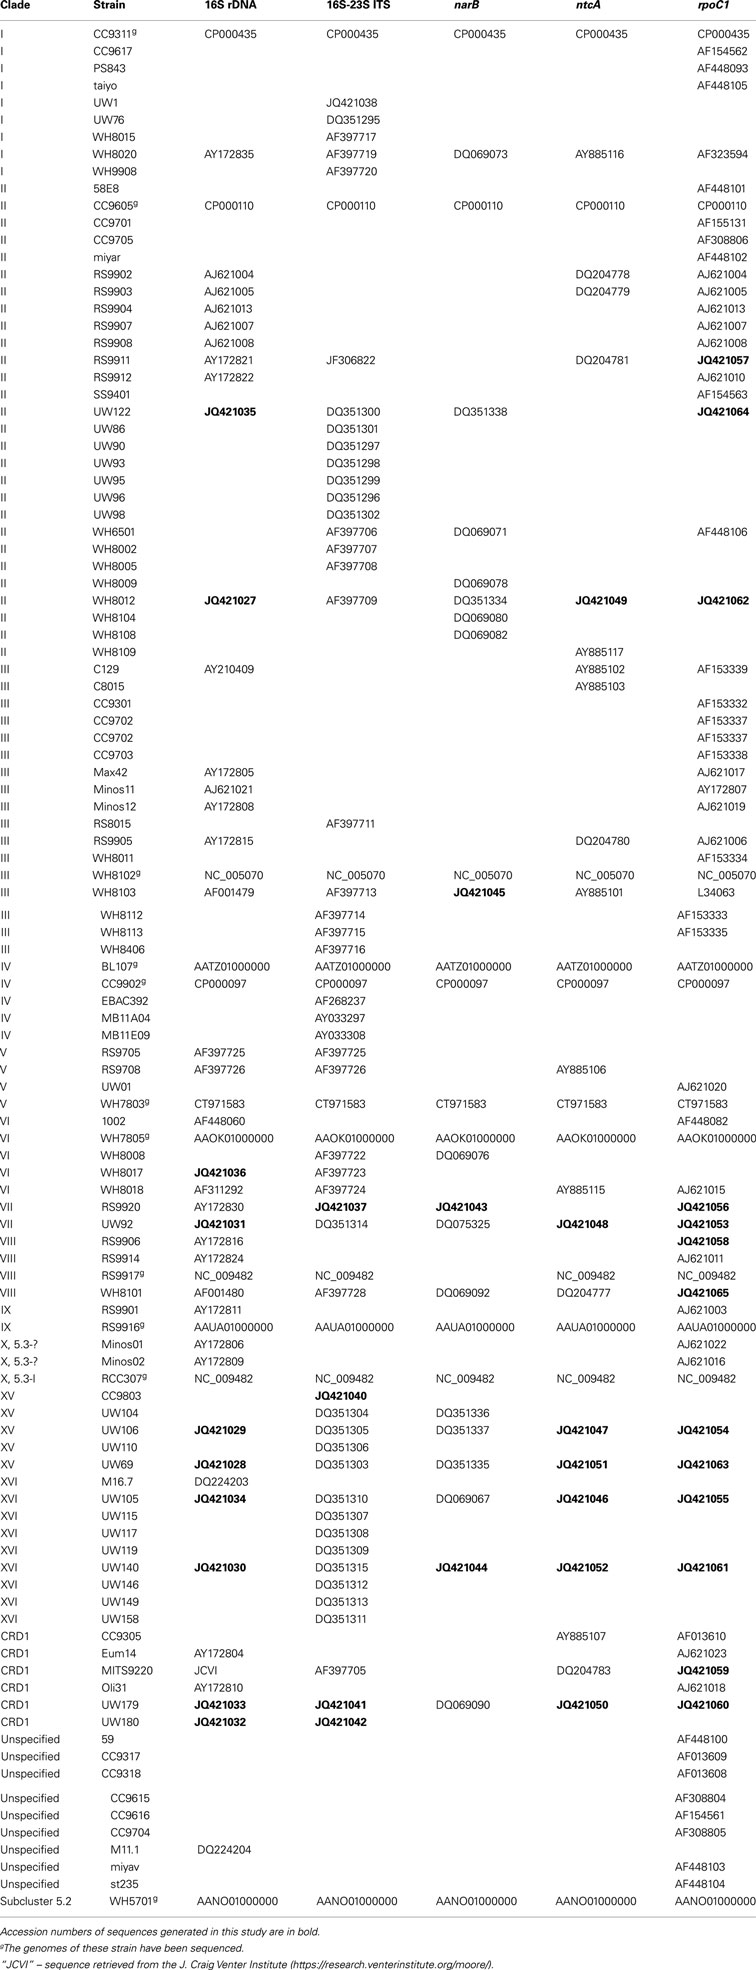
Table A2. Classification of cultured strains and GenBank accession numbers of sequences used for multiple gene phylogenies.
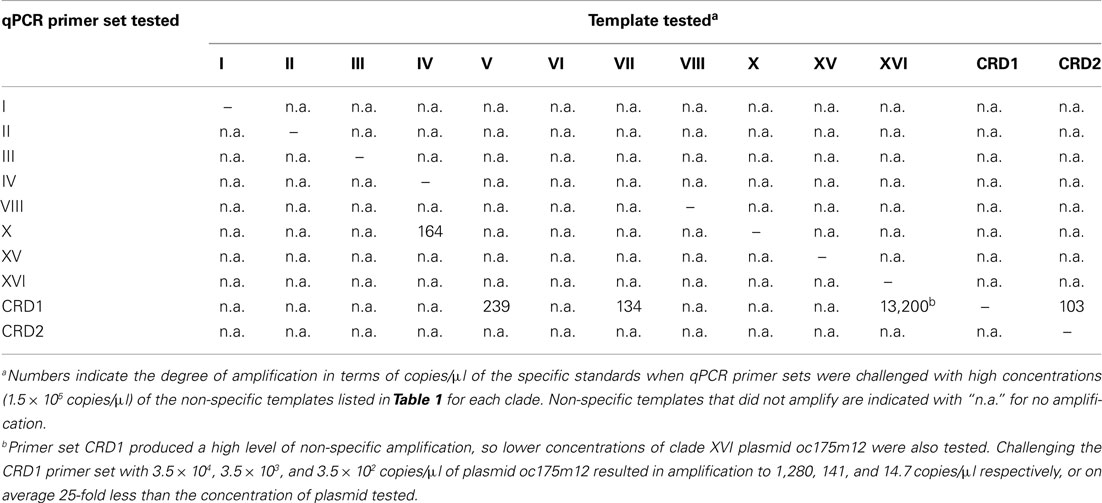
Table A3. Level of amplification when qPCR primer sets were challenged with non-specific template.
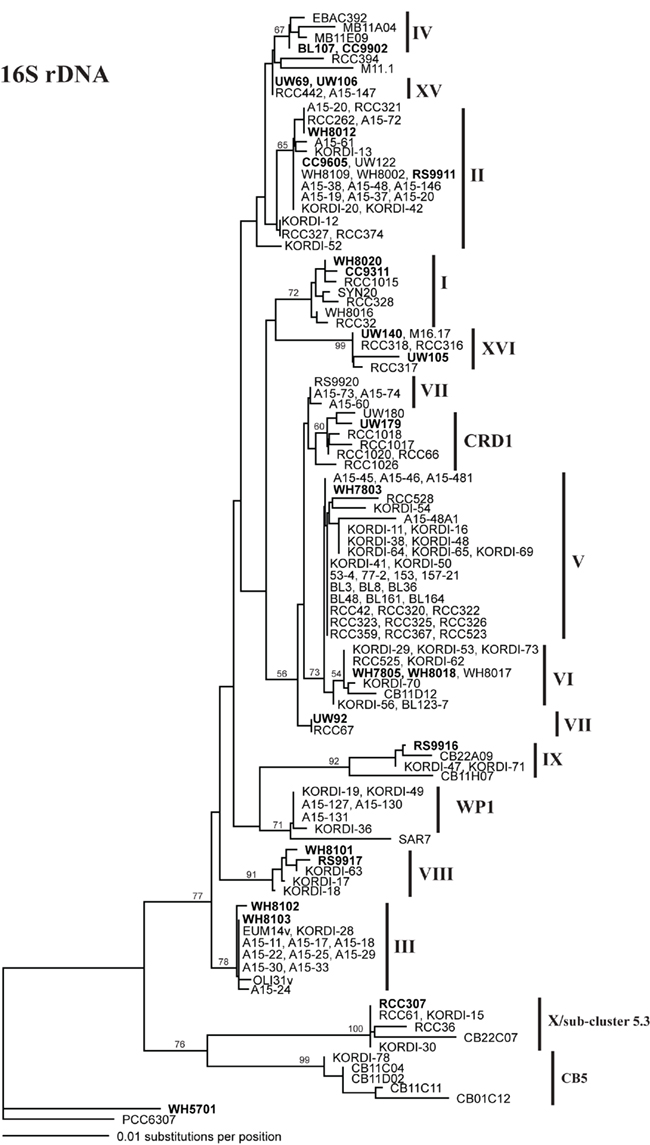
Figure A1. Phylogenetic tree based on 1009 positions of the 16S rDNA gene. The trees were constructed in PAUP using the HKY + i + g model. Values at the nodes indicate the bootstrap support from 1000 trees found by neighbor joining and the HKY + i + g substitution model. The names of strains used in the four loci concatenated tree in Figure A6 are in bold. Clade designations are indicated with solid vertical lines.
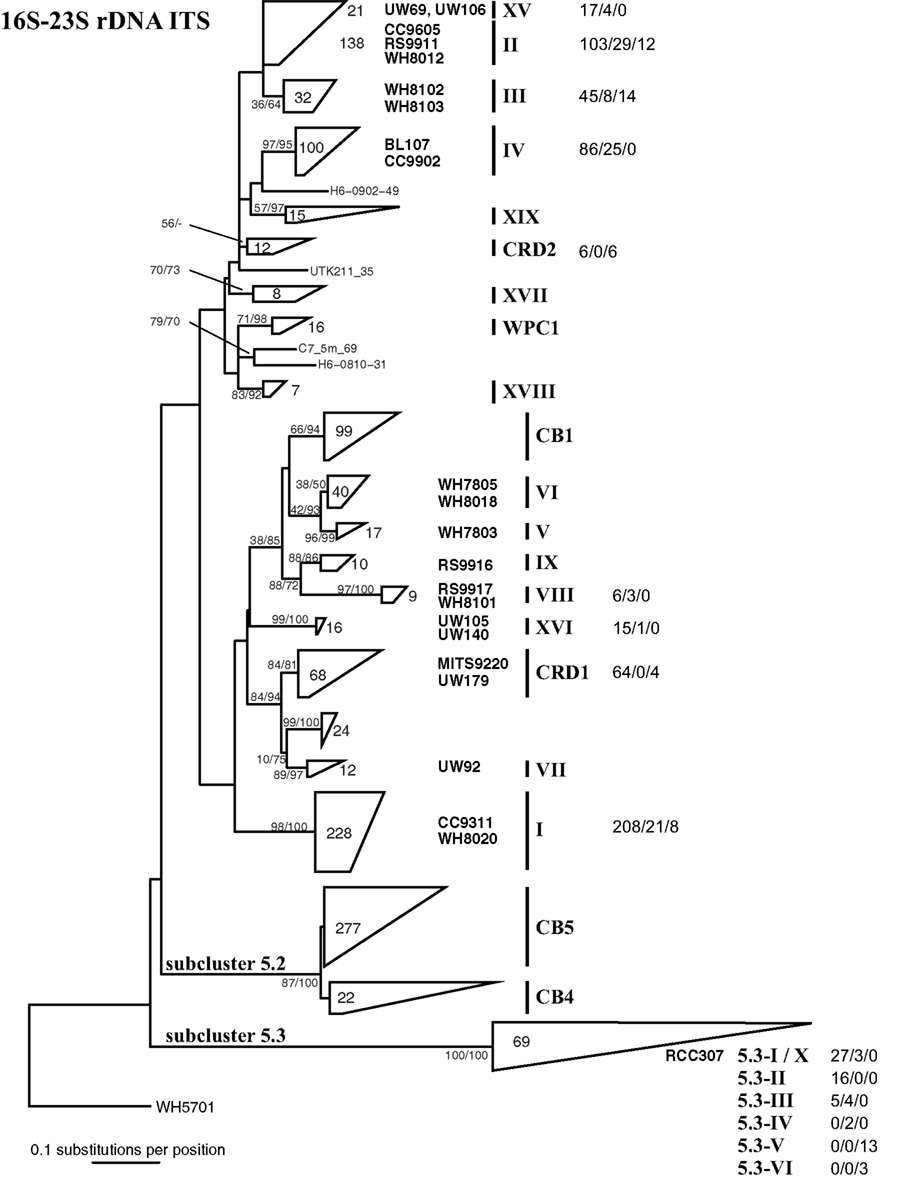
Figure A2. Phylogenetic tree based on 322 positions of the 16S–23S rDNA ITS. The tree shown is the best scoring tree, as determined by maximum likelihood score, amongst 1000 neighbor joining trees constructed using the HKY + i + g substitution model and with randomized addition of taxa. Clade groupings shown in this neighbor joining tree are also supported by bootstrap analysis using maximum likelihood with the GTRGAMMA model in RAxML (1000 replicates) and neighbor joining and the HKY + i + g substitution model (1000 replicates). Nodes display bootstrap values (ML/NJ) where bootstrap support is >50% in at least one method. Clades were collapsed into groups represented by trapezoids. The number inside or to the right of the trapezoid indicates the number of sequences in that clade or subcluster. Clade designations are indicated with solid vertical lines, and representative strains within the clades are shown to the left of clade labels. Clade XV forms a monophyletic clade highly supported by bootstrap analysis (80/86, not shown on tree) and groups together with clade II strains. For clades for which qPCR assays were designed, numbers to the right of clade names show the number of sequences that have zero, one to two, or greater than two mismatches to both the forward and reverse qPCR primers combined (0 mismatches/1–2 mismatches/>2 mismatches).
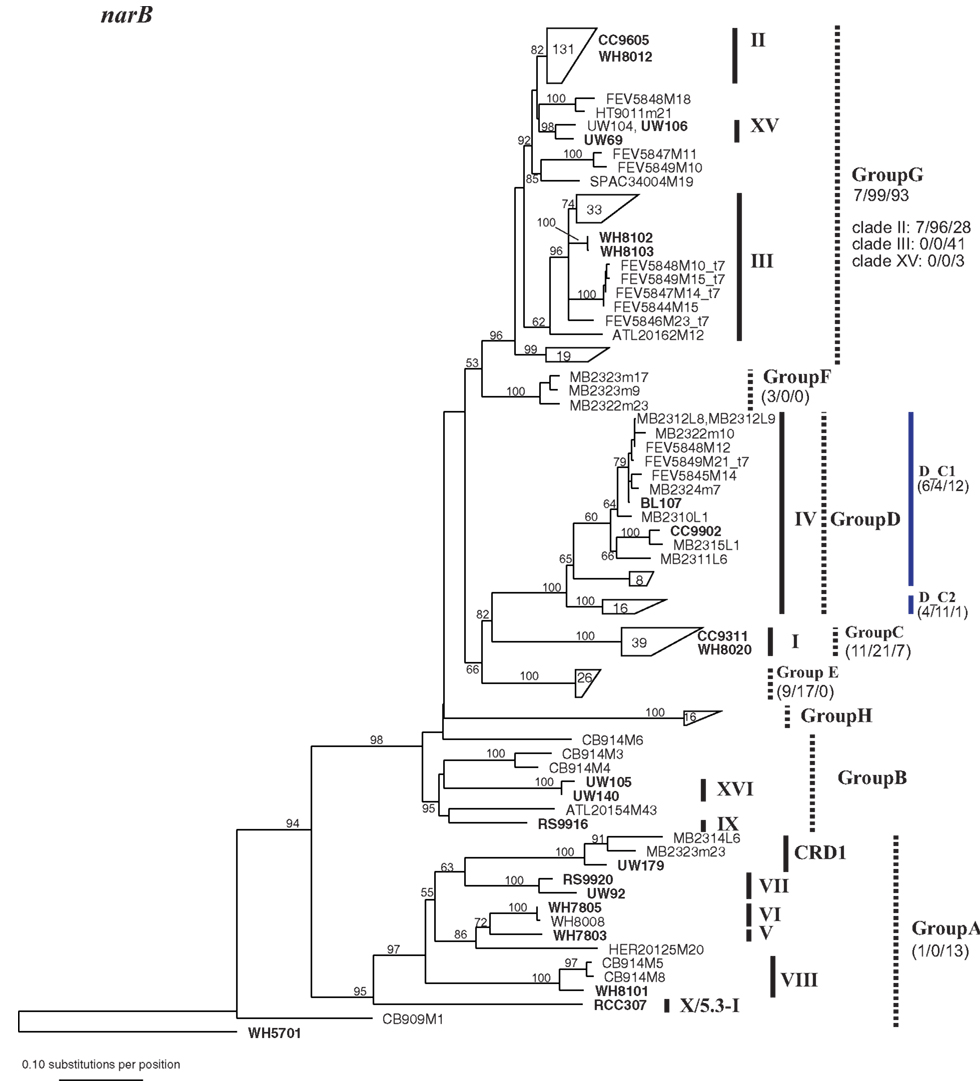
Figure A3. Phylogenetic tree based on 648 nucleotide positions of the narB gene. Tree construction, bootstrap analysis, and taxa and clade labels as the same as described in Figure A1. Because of the large number of sequences, selected sequences are grouped together and represented by trapezoids. The number inside the trapezoid indicates the number of sequences in that group. Strains within those groups that have been used in the concatenated tree (Figure A6) are shown to the right of the trapezoids. The assignment of narB sequences to groups according to Paerl et al. (2011) is indicated with dashed lines. Group A, Group B, and Group G encompass multiple well-established clades as defined by phylogenies of other loci. Numbers below group names indicate the number of total mismatches that sequences within the group have to the primers and probe sets described in Paerl et al. (2011) (0 mismatches/1 or 2 total mismatches/>2 mismatches). For Group G which contains multiple clades as defined by other loci, the number of mismatches is also given for sequences belonging to clades II, III, and XV. Two primer and probe sets were designed to detect subgroups of Group D, D_C1, and D_C2 (designated with blue lines), and the number of mismatches that sequences have to their respective primer probe sets are given.
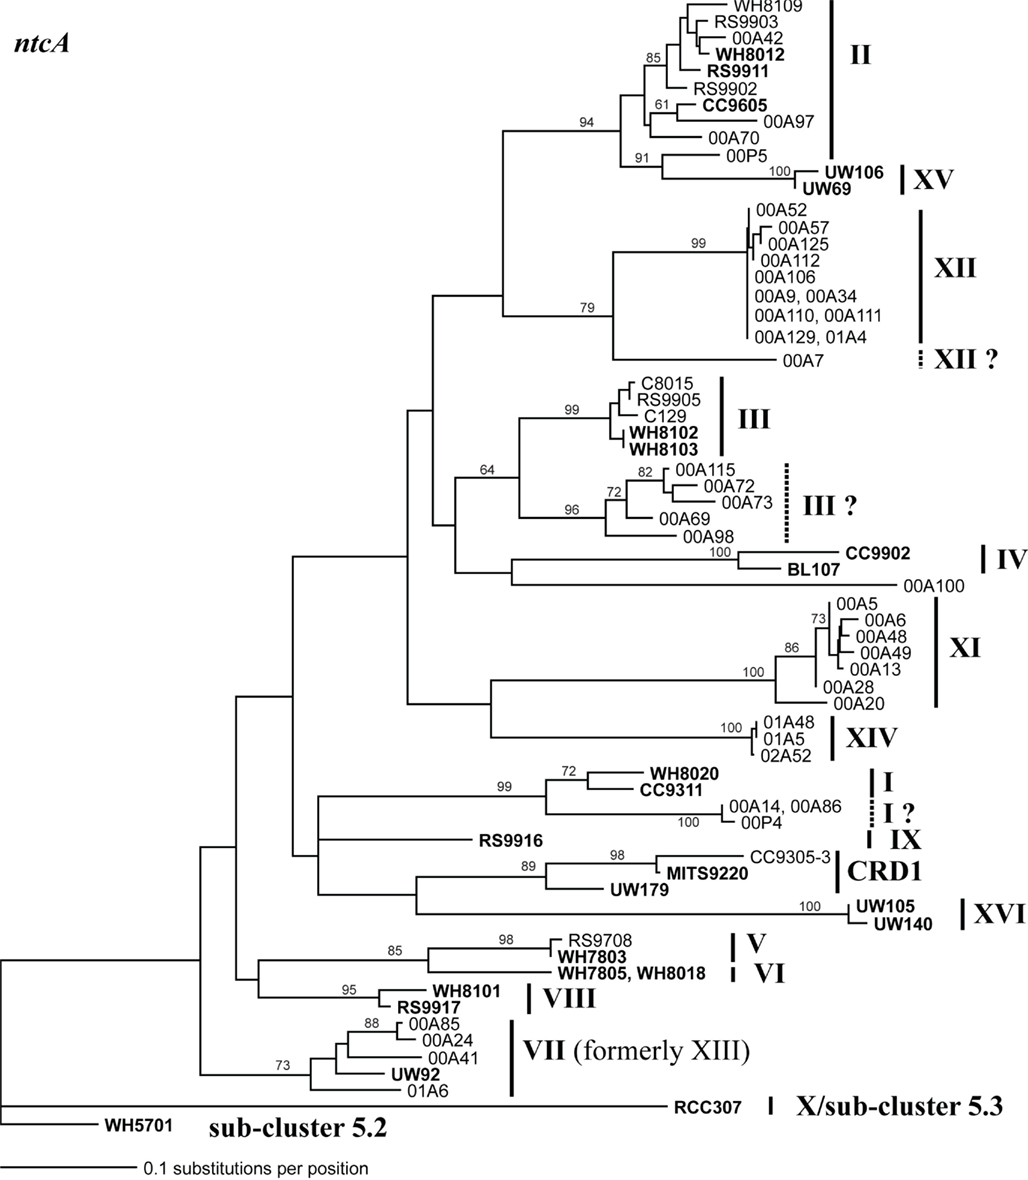
Figure A4. Phylogenetic tree based on 297 nucleotide positions of the ntcA gene. Tree construction, bootstrap analysis, and taxa and clade labels are the same as described in Figure A1. Clade designations are listed as described in Penno et al. (2006) except that sequences formerly classified as clade XIII cluster with clade VII strain UW92 and these sequences have been reclassified to clade VII. Clades I, III, and XII contain groups of sequences that may warrant classification into new clades because they are as divergent from other sequences in their own clade as they are to other clades. These groups of sequences are labeled with a dashed line and a “?” following the clade name assigned by Penno et al.
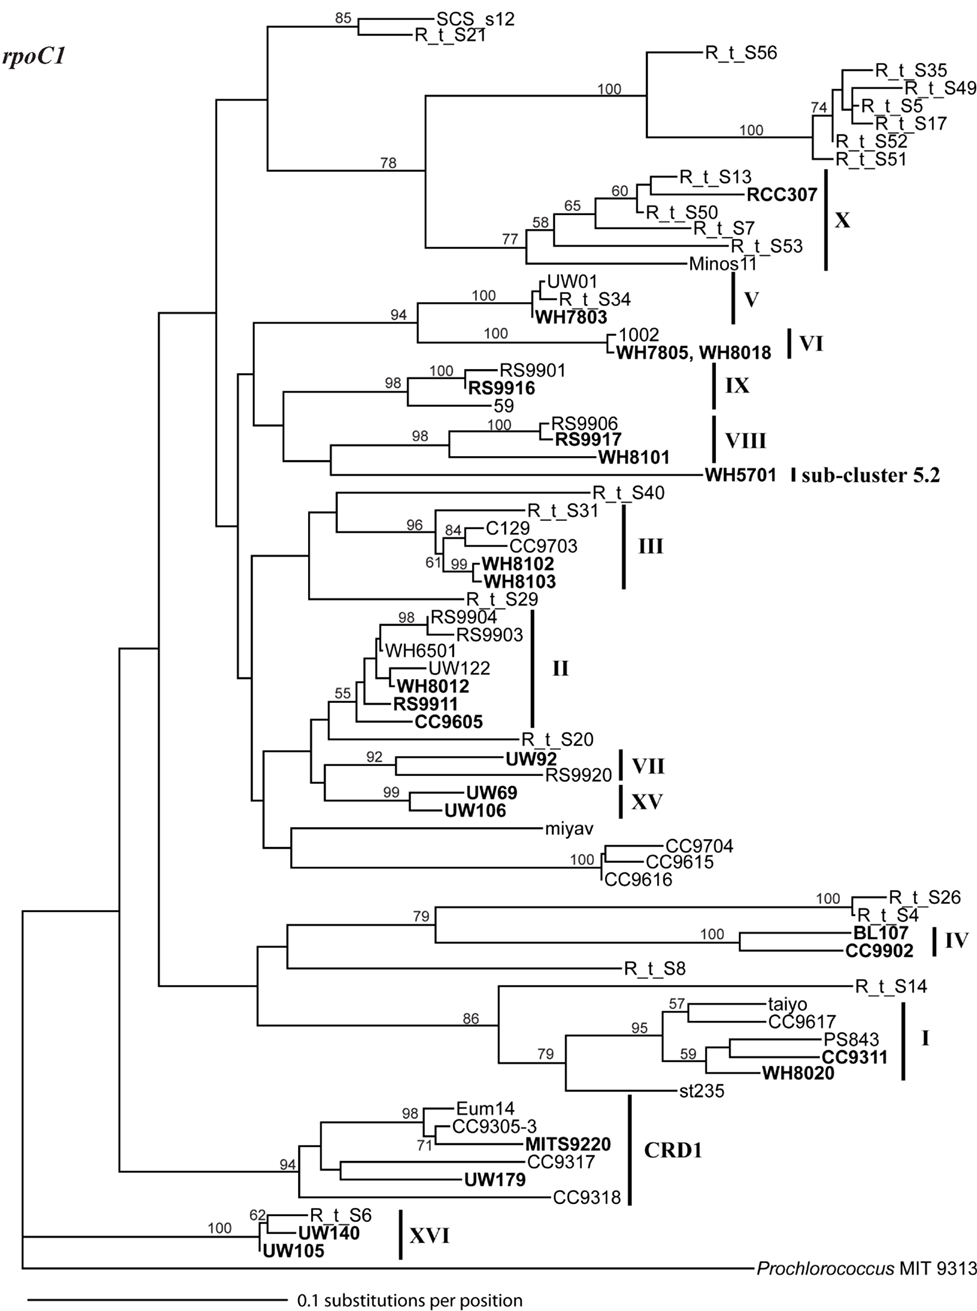
Figure A5. Phylogenetic tree based on 460 nucleotide positions of the rpoC1 gene. Tree construction, bootstrap analysis, and taxa and clade labels are the same as described in Figure A1. Prochlorococcus strain MIT 9313 was used as the outgroup.
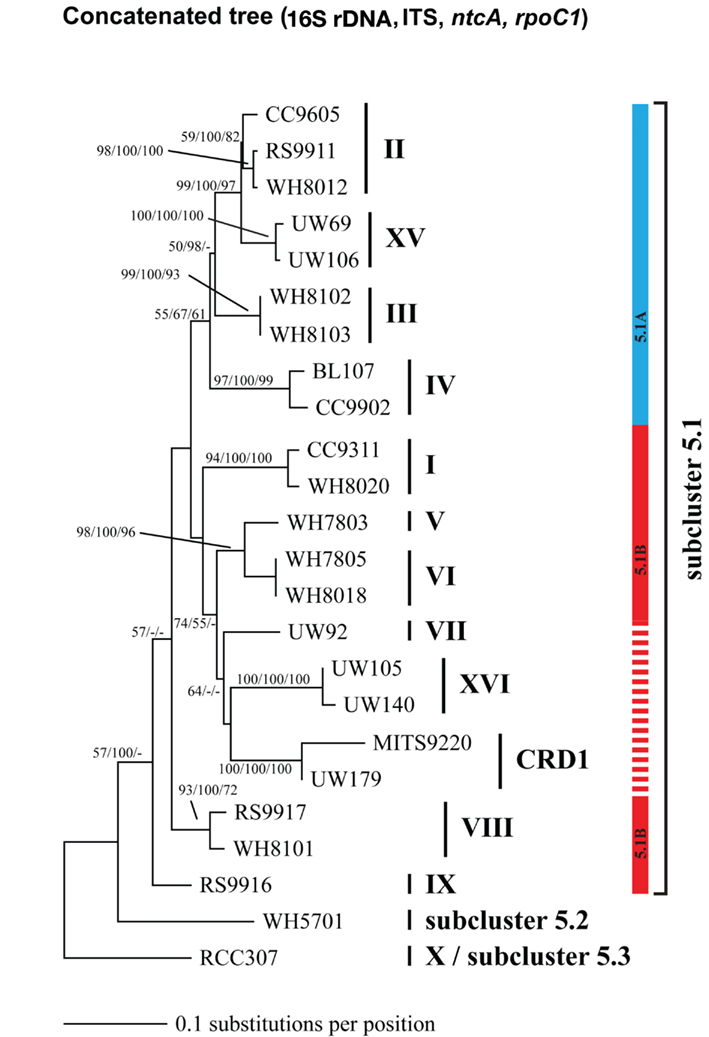
Figure A6. Phylogenetic tree based on concatenation of four loci: the 16S rDNA gene, the ITS, ntcA, and rpoC1. Tree construction, bootstrap analysis, and taxa and clade labels as the same as described in Figure A1 except that bootstrap values at the nodes were obtained using three methods: (neighbor joining, HKY + i + g model, 100 replicates/neighbor joining, Jukes–Cantor model, 1000 replicates/maximum likelihood, GTRGAMMA model, 1000 replicates). Phylogeny based on 1,129 core genes from strains with sequenced genomes support the division of strains subcluster 5.1 into two groups 5.1A (blue bar) and 5.1B (solid red bar) (Dufresne et al., 2008). The four loci concatenated phylogeny in Figure A6 also supports the grouping of 5.1A strains, including clade XV. Strains in clades VII, CRD1, and XVI cluster with other 5.1B strains in clades V and VI with high bootstrap support, however it is unclear if these additional new strains without sequenced genomes form a single monophyletic cluster with all 5.1B strains (dashed red line).
Keywords: microbial ecology, cyanobacteria, Synechococcus, microbial diversity, quantitative PCR, multiple gene locus phylogeny, biogeography, ecotype
Citation: Ahlgren NA and Rocap G (2012) Diversity and distribution of marine Synechococcus: multiple gene phylogenies for consensus classification and development of qPCR assays for sensitive measurement of clades in the ocean. Front. Microbio. 3:213. doi: 10.3389/fmicb.2012.00213
Received: 14 February 2012; Accepted: 24 May 2012;
Published online: 19 June 2012.
Edited by:
Anton F. Post, Marine Biological Laboratory, USAReviewed by:
David J. Scanlan, University of Warwick, UKKathleen Scott, University of South Florida, USA
Copyright: © 2012 Ahlgren and Rocap. This is an open-access article distributed under the terms of the Creative Commons Attribution Non Commercial License, which permits non-commercial use, distribution, and reproduction in other forums, provided the original authors and source are credited.
*Correspondence: Gabrielle Rocap, School of Oceanography, University of Washington, Box 357940, Seattle, WA 98195, USA. e-mail: rocap@ocean.washington.edu