Penetrating insights?

- 1Department of Medical Microbiology, Faculty of Medicine, University of Manitoba, Winnipeg, MB, Canada
- 2Manitoba Center for Proteomics and Systems Biology, University of Manitoba, Winnipeg, MB, Canada
- 3Manitoba Institute of Child Health, University of Manitoba, Winnipeg, MB, Canada
Mass spectrometry-based methods have allowed elucidation of alterations in complex proteomes, such as eukaryotic cells. Such studies have identified and measured relative abundances of thousands of host proteins after cells are infected with a virus. One of the potential limitations in such studies is that generally only the most abundant proteins are identified, leaving the deep richness of the cellular proteome largely unexplored. We differentially labeled HeLa cells with light and heavy stable isotopic forms of lysine and arginine and infected cells with reovirus strain T3D. Cells were harvested at 24 h post-infection. Heavy-labeled infected and light-labeled mock-infected cells were mixed together 1:1. Cells were then divided into cytosol and nuclear fractions and each fraction analyzed, both by standard 2D-HPLC/MS, and also after each fraction had been reacted with a random hexapeptide library (Proteominer® beads) to attempt to enrich for low-abundance cellular proteins. A total of 2,736 proteins were identified by two or more peptides at >99% confidence, of which 66 were significantly up-regulated and 67 were significantly down-regulated. Up-regulated proteins included those involved in antimicrobial and antiviral responses, GTPase activity, nucleotide binding, interferon signaling, and enzymes associated with energy generation. Down-regulated proteins included those involved in cell and biological adhesion, regulation of cell proliferation, structural molecule activity, and numerous molecular binding activities. Comparisons of the r2 correlations, degree of dataset overlap, and numbers of peptides detected suggest that non-biased enrichment approaches may not provide additional data to allow deeper quantitative and comparative mining of complex proteomes.
Introduction
The mammalian reoviruses (MRV) are non-enveloped viruses with genomes consisting of 10 segments of double-stranded RNA. MRV is the prototype member of the Orthoreovirus genus in the Reoviridae family and was first isolated in the respiratory and enteric tracts of healthy humans in the early 1950s. MRV infections are generally mild in humans. The Orthoreoviruses include non-fusogenic MRV and fusogenic avian reovirus. MRV consist of three serotypes. Each serotype has prototype strains: strain Lang (T1L) for serotype 1, strain Jones (T2J) for serotype 2, and strain Dearing (T3D) for serotype 3 (Tran and Coombs, 2006; Schiff et al., 2007). One of the most potentially useful characteristics of MRV is its ability to selectively kill certain cancer cells (Coffey et al., 1998; Forsyth et al., 2008; Thirukkumaran et al., 2010). An activated Ras pathway and functional p53 appear to be requirements for this selective oncolytic property (Coffey et al., 1998; Pan et al., 2011). Global analyses of oligonucleotide microarrays have detected activation of numerous cellular genes, including many related to apoptosis (Poggioli et al., 2002; DeBiasi et al., 2003). However, global alterations in proteins (the effector molecules) after MRV infection have not yet been reported.
Except for certain epigenetic events (reviewed in Goldberg et al., 2007), a cell’s genome generally remains relatively constant. However, the cell’s proteome (the total protein repertoire, including all co-translational and post-translational modifications) varies greatly due to its biochemical interactions with the genome, as well as the cell’s interactions with the environment. In the case of viruses, which require the host cell’s machinery and metabolism to replicate, the cell’s proteome also reflects the specific alterations of the pathways induced by virus infection.
Previous analyses of how cells respond to virus infection have used microarray technologies which measure the cellular “transcriptome” (see for example; Geiss et al., 2002; Kobasa et al., 2007). However, there frequently is little concordance between microarray and protein data (Tian et al., 2004; Baas et al., 2006), partly because mRNA levels cannot provide complete information about levels of protein synthesis or extents of post-translational modifications. Thus, proteomic analyses have also been employed to better understand host alterations induced by virus infection. These have included two-dimensional difference in gel electrophoresis (2D-DIGE; see for examples; Burgener et al., 2008; Lucitt et al., 2008), isotope coded affinity tags (ICAT; Booy et al., 2005; Stewart et al., 2006), isobaric tags for relative and absolute quantitation (iTRAQ; Dwivedi et al., 2009; Zhang et al., 2009), and stable isotope labeling by amino acids in cell culture (SILAC; Skiba et al., 2008). We have previously used SILAC to measure proteomic alterations in influenza virus-infected A549 cells (Coombs et al., 2010). Cells were labeled with either 12C6-Lys and12C614N4-Arg (“light”; L), or13C6-Lys and 13C615N4-Arg (“heavy”; H), because virtually every tryptic peptide is expected to contain an L or H label, thereby providing increased protein coverage. In addition, L and H samples are mixed together early in this process, thereby reducing sample-to-sample variability.
Most quantitative proteomic analyses succeed in identifying and measuring several 1,000 proteins. Head-to-head comparisons suggest SILAC identifies more proteins than other methods (reviewed in Coombs, 2011); however, the 3,000–5,000 identified in many such studies still represents a small fraction of the estimated entire eukaryotic proteome. It is generally assumed that high-abundance proteins are most easily detected and low-abundance proteins masked by other components (Zolotarjova et al., 2008). Some studies have attempted to deplete high-abundance proteins (for example Dwivedi et al., 2009) or to use methods to enrich for selected proteins (Jiang et al., 2007). Both of these methods potentially suffer from selective bias for specific proteins. We decided to attempt to enrich for low-abundance proteins by using Proteominer™ (PM) beads (Bio-rad), which consist of a “library” of 64 million random hexapeptides to non-selectively bind interacting partners. We succeeded in the current study in identifying and measuring 2,736 host proteins. Sixty six proteins were significantly up-regulated, including those involved in antimicrobial and antiviral responses, GTPase activity, nucleotide binding, interferon signaling, and enzymes associated with energy generation. Sixty seven proteins, including those involved in cell and biological adhesion, regulation of cell proliferation, structural molecule activity, and numerous molecular binding activities were significantly down-regulated. However, comparison of the numbers of proteins identified with or without PM enrichment suggests this type of non-biased enrichment may not contribute substantially to deeper proteomic elucidation.
Materials and Methods
Cells and Viruses
Cell lines
Spinner-adapted mouse fibroblast L929 cells (L929) were grown in Joklik’s modified minimal essential medium (J-MEM; Gibco, Grand Island, NY, USA) supplemented with 6% fetal bovine serum (FBS; Hyclone, Rockford, IL, USA), and 2 mM L-glutamine as described (Berard and Coombs, 2009). Reovirus was grown according to standard lab practice (Berard and Coombs, 2009).
Human HeLa cells were routinely cultured in Dulbecco’s modified MEM (DMEM) supplemented with non-essential amino acids, sodium pyruvate, 0.2% (w/v) glucose, 10% FBS (Hyclone), and 2 mM L-glutamine. Cells were maintained as monolayers in 5% CO2 and were passaged by trypsinization 2–3 times each week. For SILAC labeling, cells were grown in DMEM media provided with a SILAC™ Phosphoprotein Identification and Quantification Kit (Invitrogen Canada Inc., Burlington, ON, Canada), supplemented as above (except without non-essential amino acids), and with 10% dialyzed FBS (Invitrogen Canada Inc.), plus 100 mg each of “light” (L) or “heavy” (H) L-lysine and L-arginine per liter of DMEM.
Viruses
Reovirus strain Type 3 Dearing (T3D) is a laboratory stock. Virus amplifications were routinely performed in L929 cell monolayers grown in the presence of 5% CO2 at 37°C, supplemented with J-MEM as described above, except with 3% FBS instead of 6% FBS in the cell culture media, 100 U/ml of penicillin, 100 μg/ml streptomycin sulfate, and 100 μg/ml amphotericin-B as previously described (Berard and Coombs, 2009).
Virus purification
Large amounts of reovirus T3D were grown in 1 l suspension L929 cell cultures and purified by routine procedures involving Vertrel-XF™ extraction and cesium chloride (CsCl) ultracentrifugation (Mendez et al., 2000). Purified virions were then dialyzed against D-Buffer (150 mM NaCl, 15 mM MgCl2, 10 mM Tris, pH 7.4). Virus concentration was measured by optical density at 260 nm, using the relationship 1 ODU = 2.1 × 10¹² particles per milliliter (Smith et al., 1969) and infectivity was titrated.
Virus titrations
Serial 1:10 dilutions of virus samples were made in gel saline (137 mM NaCl, 0.2 mM CaCl2, 0.8 mM MgCl2, 19 mM HBO3, 0.1 mM Na2B4O7, and 0.3% w/v gelatin). HeLa cell and L929 cell monolayers in six-well plates were infected in duplicate, viruses allowed to attach to cells for 1 h with periodic rocking, and each well overlaid with a 50:50 ratio of 2% agar and 2× Medium 199 (M199) supplemented with a final concentration of 3% FBS, 2 mM L-glutamine, 100 U/ml of penicillin, 100 μg/ml streptomycin sulfate, and 100 μg/ml amphotericin-B. Plates were fed 3 days later with fresh agar/M199 and were stained with a 0.04% neutral red solution on day 6. Viral plaques were counted 15–18 h later and titers calculated (Berard and Coombs, 2009).
SILAC infection
Once HeLa cells had grown through six doublings in appropriate SILAC media, H cells were infected with gradient-purified T3D at a multiplicity of infection (MOI) of seven plaque forming units (PFU) per cell. An equivalent number of L cells were mock-infected with diluent as control. Cells were overlaid with appropriate media and cultured for 24 h.
Cell Fractionation
At 24hpi, L and H cells in the T75 flasks were collected and counted. To verify infection status of each culture, aliquots of all cultures were saved for virus titration. For comparative SILAC assays, equivalent numbers of L and H cells were mixed together, and the mixed cells were washed 3× in >50 volumes of ice-cold Phosphate Buffered Saline (PBS). Washed cells were lysed with 0.5% NP-40, supplemented with 1.1 μM pepstatin A, incubated on ice for 30 min, and nuclei removed by pelleting at 5,000 × g for 10 min. The cytosol and soluble membranes (supernatant) were transferred to a fresh microfuge tube; and the two fractions (nuclear pellet and supernatant) were frozen at −80°C until further processing took place.
Thawed nuclei were extracted with one volume of High Salt Buffer (620 mM NaCl, 1 mM DTT, 10 mM Tris, pH 8.0), insoluble material pelleted at 15,000 × g for 10 min, and the supernatant removed and saved. Insoluble pellets were then extracted with 1/3rd volume of 8 M urea, insoluble material pelleted as above, the two extractions combined, and samples stored at −80°C until further processing took place.
Proteominer™ Purification
Approximately 90% of each fraction (cytosol and nucleus) was passed through separate PM Mini columns. The columns were processed according to manufacturer’s protocol (Bio-Rad Corp). Briefly, the cytosolic and nuclear protein fractions were measured and each fraction concentrated to ≈20 mg/ml (∼1 ml). PM beads were washed twice with Wash Buffer then incubated with each concentrated protein sample for 2 h with end-to-end shaking. Columns were spun at 1,000 × g for 2 min to remove excess fluid, washed 3× with Wash Buffer, and then bound proteins eluted with two sequential applications of 200 μl One-step Elution Buffer.
Western Blotting
Western blot analyses of HeLa cells were performed essentially as described previously (Coombs et al., 2010). Briefly, unlabelled cells were harvested essentially as described above and cytosolic proteins were resolved on a 10% SDS-PAGE gel at 120 V for 70 min. Proteins were transferred to polyvinylidenedifluoride (PVDF) membranes at 20 V for 30 min in a semi-dry apparatus, and the transfer confirmed by Ponceau staining. Membranes were blocked with 5% skim milk in TBST and probed with various antibodies in 1% BSA in TBST. Primary antibodies were: in-house rabbit anti-reovirus, α-GAPDH (Cell Signaling, cat#2118), α-IFIT2 (Abcam, cat#ab55837), and α-SAMD9 (Sigma cat#HPA021318), goat α-Mx1 (Santa Cruz cat#sc-34128), and mouse anti-STAT1 (Cell Signaling, cat#9176), α-Actin (Sigma, cat#A5441). The secondary antibodies were the appropriate horseradish peroxidase (HRP)-conjugated rabbit anti-mouse or goat anti-rabbit (Cell Signaling, cat#7076 and cat#7074, respectively). Bands were detected by enhanced chemiluminescence using an Alpha Innotech FluorChem Q Multi Image III instrument.
Immunofluorescent Microscopy
HeLa cells were grown overnight in a 37°C, 5% CO2 incubator to 80% confluency on autoclaved 12-spot slides and then infected with MRV T3D at a MOI of seven or mock-infected. Mock, 0, 6, 12, and 24 h infected cells were washed 5× with PBS and fixed with 4% paraformaldehyde for 15 min at 4°C. Cells were then washed 4× with 1× PBS and kept in 1× PBS at 4°C until the 24 h time point was collected. Cells from all time points were then permeabilized with 0.1% TritonX-100 in 1× PBS for 5 min at 4°C followed by five washes with 1× PBS. Cells were blocked with 1% BSA in 1× PBS and then treated with primary antibody (in-house rabbit anti-reovirus). Cells were then washed 5× with 1× PBS and treated with Alexa Fluor® 488 Goat anti-Rabbit (Invitrogen, cat#A11008) secondary antibody (all antibodies were diluted in 1% BSA in 1× PBS). Cells were then washed 5× with 1× PBS and Anti-fade prolong gold reagent with DAPI (Invitrogen, Cat# P36935) was added to each spot before slides were covered with coverslips, dried, and sealed. Slides were examined on a Zeiss Axio Observer Z1 inverted microscope using 10 and 20× objectives and fluorescence illumination using ExfoXcite. Images were acquired using AxioVision 4.8.2 software.
Protein Digestion
Protein content in the non-purified (“standard”) and PM-purified cytosolic and nuclear fractions collected as described above were determined using a BCA™ Protein Assay Kit (Pierce; Rockford, IL, USA) and BSA standards. After protein concentration determinations, samples were diluted with freshly made 100 mM ammonium bicarbonate to provide concentrations of ∼1 mg/ml and pH ∼ 8. Three hundred microliters of each sample (∼300 μg of protein) were reduced, alkylated, and trypsin digested as previously described (Coombs et al., 2010). Briefly, 30 μl of freshly prepared 100 mM dithiothreitol (DTT) in 100 mM ammonium bicarbonate was added, incubated for 45 min at 60°C, 30 μl of freshly prepared iodoacetic acid (500 mM solution in 100 mM ammonium bicarbonate) was added, and the tubes were then incubated for 30 min at room temperature, in the dark. Finally, 50 μl of 100 mM DTT solution was added to quench the excess iodoacetic acid. Samples were digested overnight at 37°C with 6 μg of sequencing grade trypsin (Promega, Madison, WI, USA). The samples were lyophilized and stored at −80°C.
Peptide Fractionation Using 2D RP HPLC
A newly developed orthogonal procedure (Gilar et al., 2005; Spicer et al., 2007) was employed for 2D RP (reversed-phase) high pH – RP low pH peptide fractionation. Lyophilized tryptic digests were dissolved in 200 μl of 20 mM ammonium formate pH 10 (buffer A for first dimension separation), injected onto a 1 mm × 100 mm XTerra (Waters, Milford, MA, USA) column and fractionated using a 0.67% acetonitrile per minute linear gradient (Agilent 1100 Series HPLC system, Agilent Technologies, Wilmington, DE, USA) at a 150 μl/min flow rate. Sixty one-minute fractions were collected (covering ∼40% acetonitrile concentration range) and concatenated using procedures described elsewhere (Spicer et al., 2007; Dwivedi et al., 2008); the last 30 fractions were combined with the first 30 fractions in sequential order (i.e., #1 with #31; #2 with #32, etc.). Combined fractions were vacuum-dried and re-dissolved in buffer A for the second dimension RP separation (0.1% formic acid in water).
A split less nano-flow Tempo LC system (Eksigent, Dublin, CA, USA) with 20 μl sample injection via a 300 μm × 5 mm PepMap 100 pre-column (Dionex, Sunnyvale, CA, USA) and a 100 μm × 200 mm analytical column packed with 5 μm Luna C18(2; Phenomenex, Torrance, CA, USA) were used in the second dimension separation prior to MS analysis. Both eluents A (water) and B (acetonitrile) contained 0.1% formic acid as an ion-pairing modifier. A 0.33% acetonitrile per minute linear gradient (0–30% B) was used for peptide elution, providing a total 2 h run time per fraction in the second dimension.
Mass Spectrometry, Bioinformatics, and Data Mining
A QStar Elite mass spectrometer (Applied Biosystems, Foster City, CA, USA) was used in a data-dependent MS/MS acquisition mode. One-second survey MS spectra were collected (m/z 400–1,500) followed by MS/MS measurements on the three most intense parent ions (80 counts/s threshold, +2 ±4 charge state, m/z 100–1,500 mass range for MS/MS), using the manufacturer’s “smart exit” (spectral quality five) settings. Previously targeted parent ions were excluded from repetitive MS/MS acquisition for 60 s (50 mDa mass tolerance). Raw data files (30 in total for each run) were submitted for simultaneous search using standard SILAC settings for QStar instruments and were analyzed by Protein Pilot®, version 4.0, using the non-redundant human gene database. A decoy database search strategy (NCBInr Homo sapiens in which all protein sequences were reversed) was used to estimate the false discovery rate, which for this dataset was <0.8%. Proteins, and their confidences and H:L ratios, were returned with GeneInfo Identifier gi accession numbers. Proteins for which at least two fully trypsin digested L and H peptides were detected at >99% confidence were used for subsequent comparative quantitative analysis.
Differential regulation within each experimental dataset was determined by normalization of each dataset, essentially as described (Keshamouni et al., 2009). Briefly, every H:L ratio was converted into log2 space to determine geometric means and facilitate normalization. The average log2H:L ratios and SDs of the log2 H:L ratios were determined for each dataset. Every proteins’ log2 H:L ratio was then converted into a z-score, using the formula:
where “b” represents an individual protein in a dataset population a…n, and z-score is the measure of how many SD units (expressed as “σ”) that protein’s log2H:L ratio is away from its population mean. Thus, a protein with a z-score >1.645σ indicates that protein’s differential expression lies outside the 90% confidence level, >1.960σ indicates outside the 95% confidence level, 2.576σ indicates 99% confidence, and 3.291σ indicates 99.9% confidence. z-Scores >1.960 were considered significant. gi numbers of all significantly regulated proteins were converted into HGNC identifiers by Uniprot1 and HGNC terms were submitted to and analyzed by the DAVID bioinformatic suite at the NIAID, version 6.7 (Dennis et al., 2003; Huang et al., 2009a) and gene ontologies examined with the “FAT” datasets. The gi numbers were also submitted to, and pathways constructed with, Ingenuity Pathway Analysis software (IPA®).
Results and Discussion
Identification of Altered Host Proteins
We combined ∼108H-labeled reovirus-infected HeLa cells with an equivalent amount of L-labeled non-infected cells, lysed the cells to generate cytosolic and nuclear fractions, and reacted ∼95% of each fraction with a commercially available random hexapeptide library (PM™) to enrich for low-abundance proteins. This strategy was chosen to attempt to complement the proteomic coverage of high-abundance and medium-abundance proteins expected from standard 2D-HPLC/MS processing (outlined in Figure 1). We also confirmed that the majority of HeLa cells demonstrated virus replication under our experimental conditions by 12–24hpi, as measured by immunofluorescent microscopy (Figure 2). Our standard 2D-HPLC/MS process identified 2,472 proteins from 21,989 non-redundant H:L peptide pairs in the cytosolic fraction. However, exclusion of those proteins whose identification confidence was <99% reduced the number of identified proteins to 1,903 (Table 1; Figure 3A). Using similar criteria, we found 1,657 proteins at ≥99% confidence in the cytosolic fraction reacted with the PM library and about 1,100 proteins in each of the nuclear fractions. Since crude nuclear fractions were frozen and no attempts were made to remove traces of cytosolic proteins from this fraction, these assays were meant to provide additional cell fractions rather than to allow meaningful distributional characterization and the “nuclear” fractions were expected to be contaminated with some cytosolic proteins.
TABLE 1
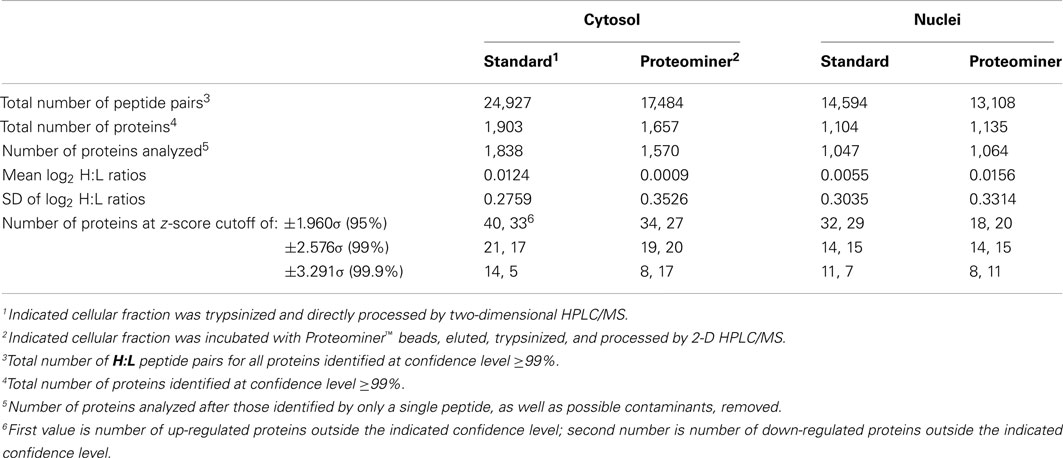
Table 1. Number of peptides, proteins, log2 H:L ratio means and SD, and z-scores of SILAC-measured HeLa cell proteins.
FIGURE 1
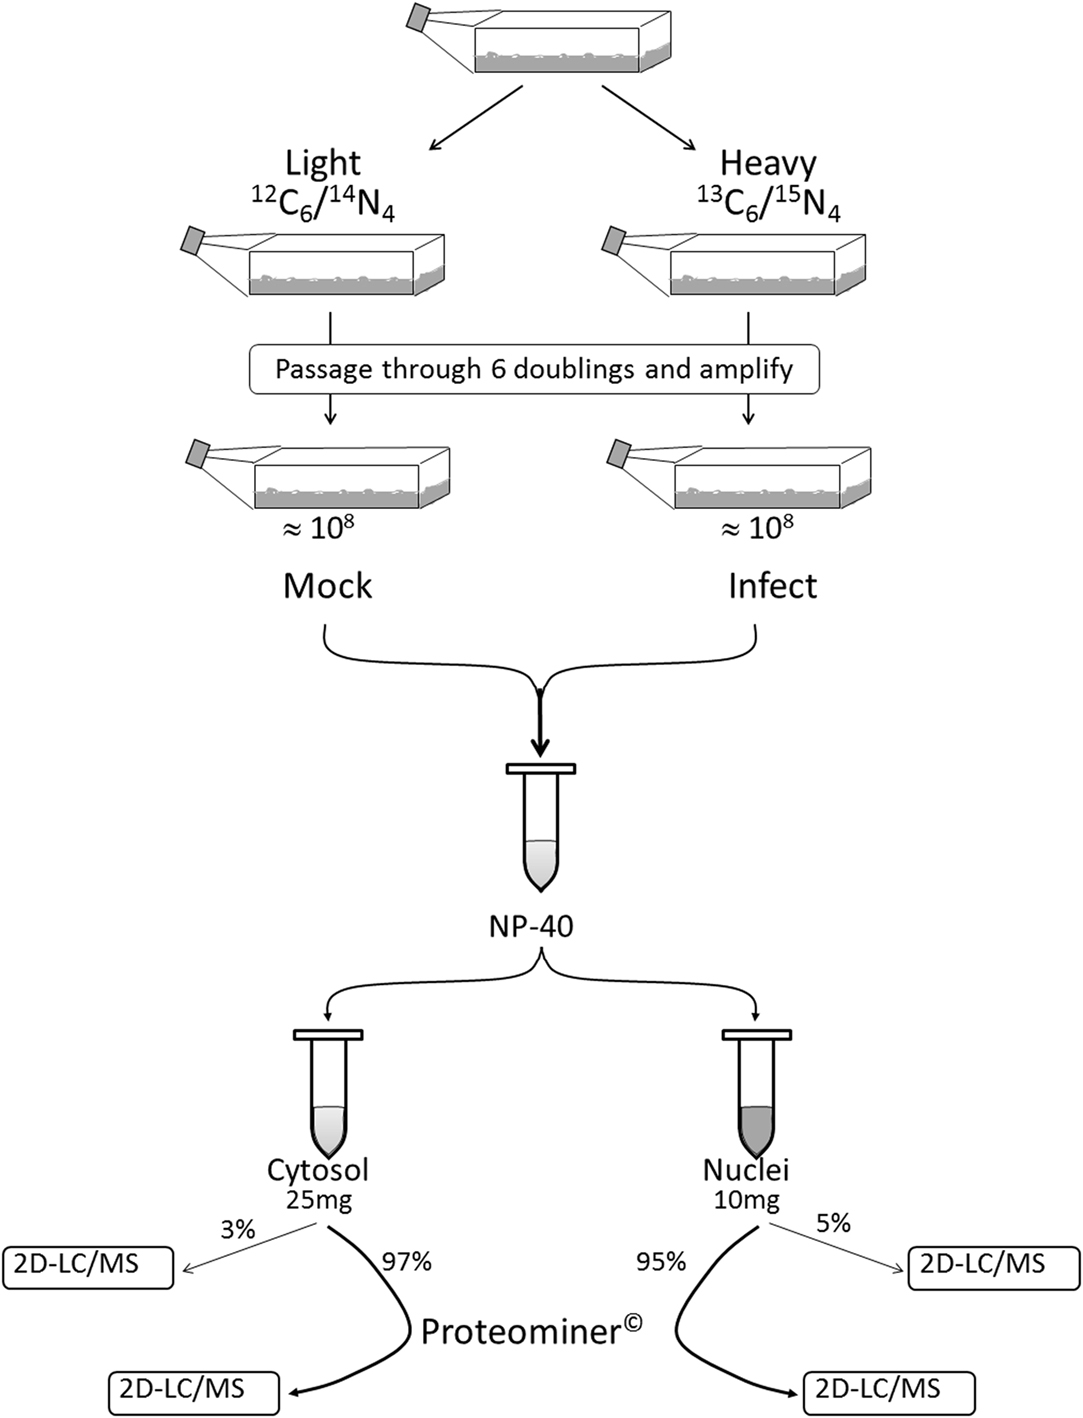
Figure 1. Outline of experimental set-up. Cells were passaged through six doublings in either Light or Heavy SILAC medium and the H cells infected with reovirus T3D. Infected (H) and mock-infected (L) cells were mixed together 1:1. After the cells were washed and lysed to separate cytosol from nucleus, 95–95% of each fraction was non-specifically enriched for low-abundance proteins by reaction with Proteominer™(PM) beads. Each of the four fractions (two PM-enriched as well as two residual 3–5% “standard” fractions) were then processed by 2D-HPLC/MS.
FIGURE 2
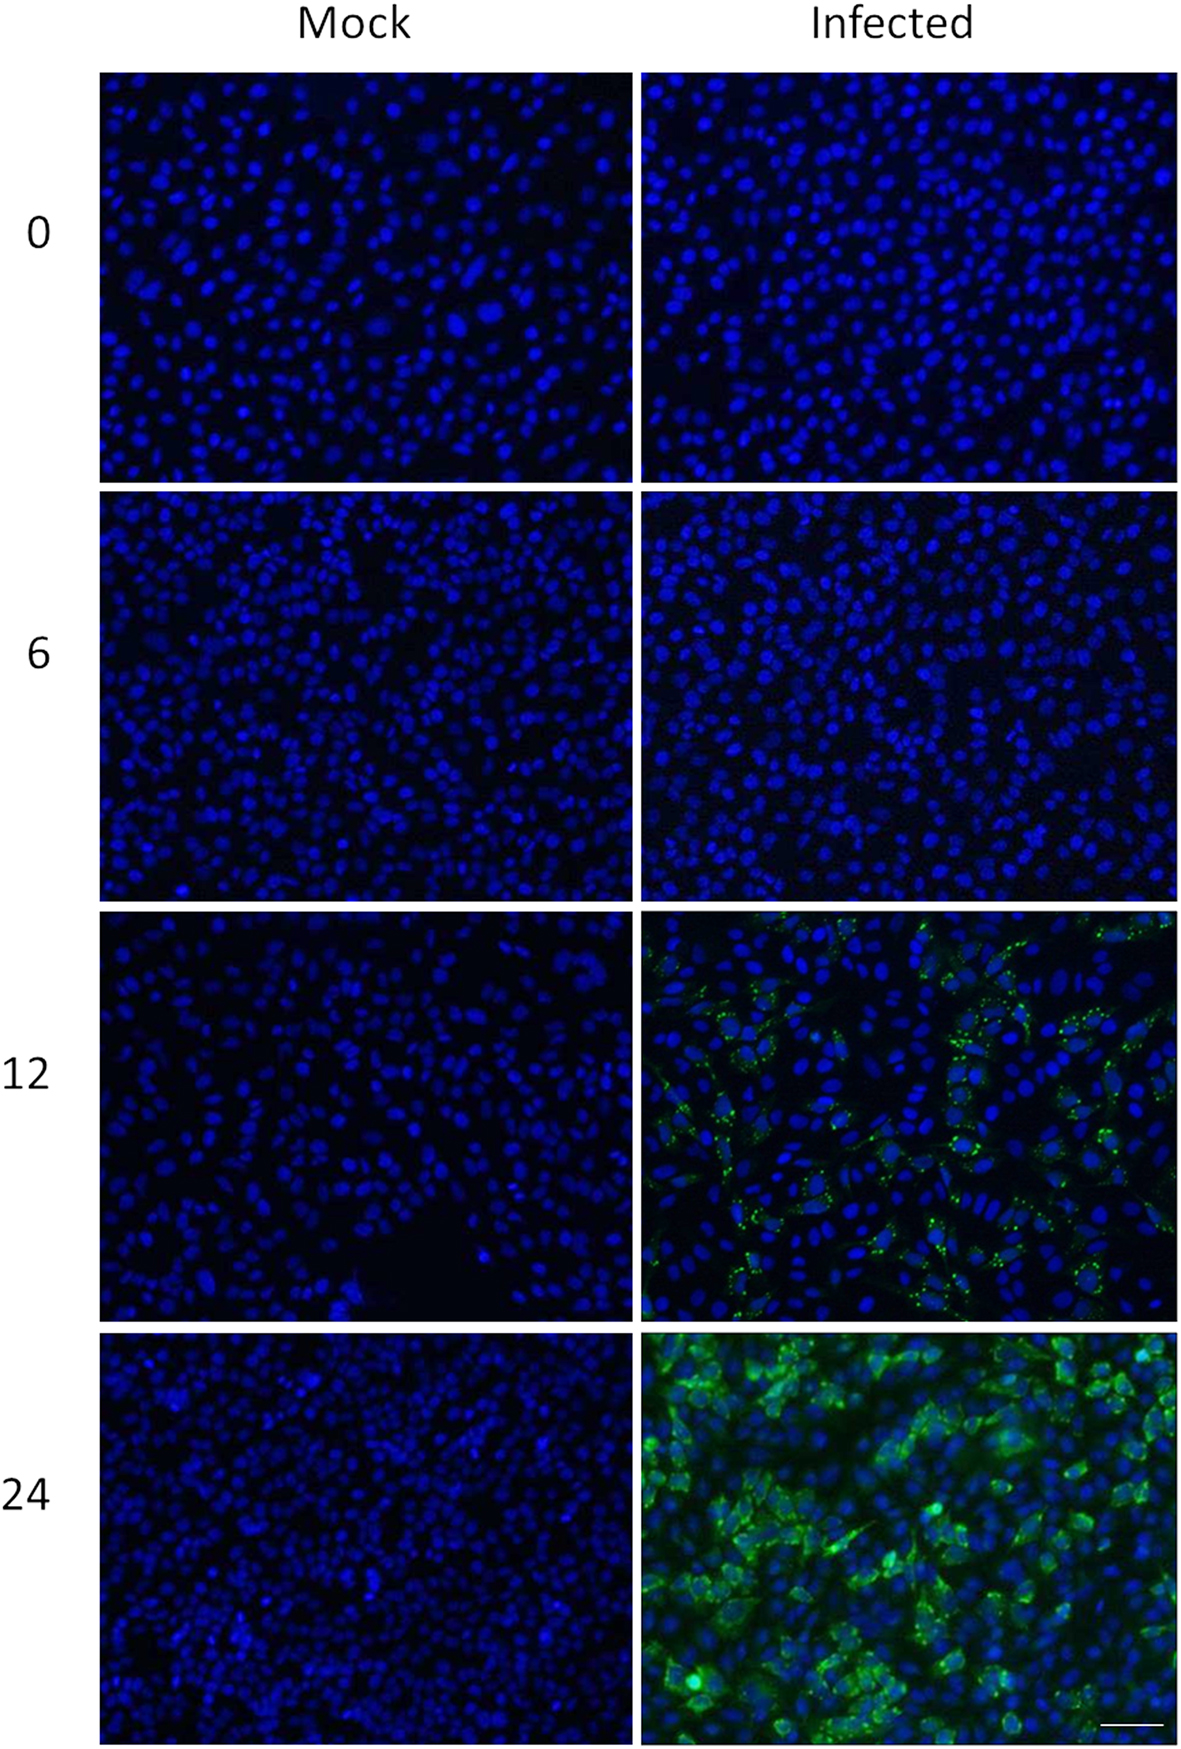
Figure 2. Confirmation of HeLa cell infectivity. HeLa cells were mock-infected (left), or infected with MRV strain T3D at an MOI of 7 (right). Cells were harvested at indicated times post-infection (left) and processed for immunofluorescence microscopy, using in-house rabbit anti-reovirus and Alexa-488-conjugated secondary anti-rabbit antibody (green) and DAPI (blue). Scale bar is 50 μm.
FIGURE 3
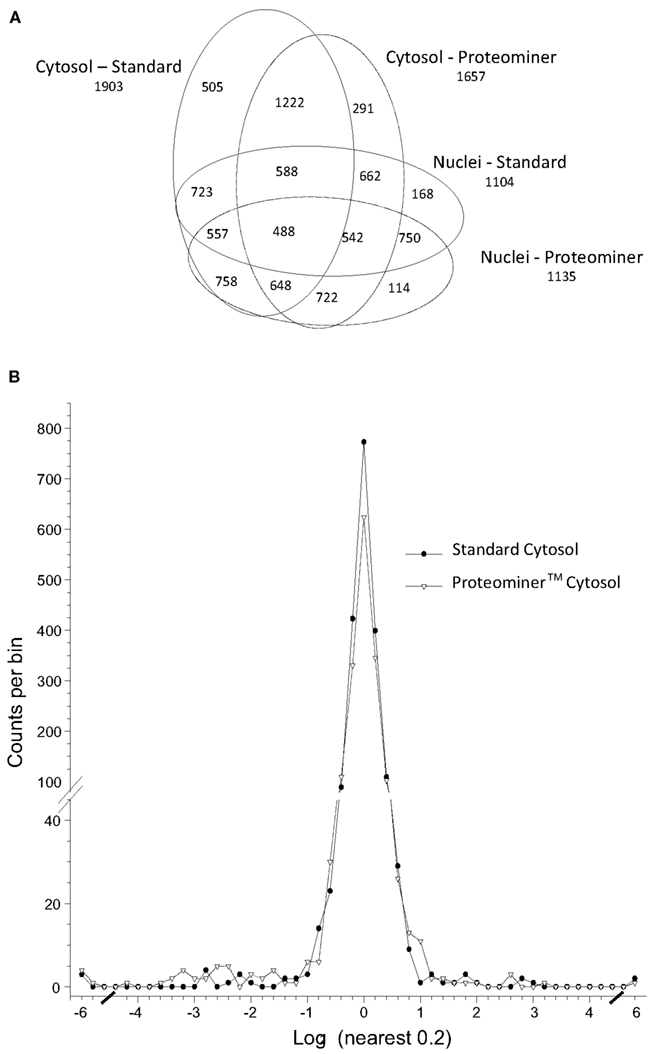
Figure 3. Distributions of proteins identified in various experiments. (A) Venn diagram of numbers of identified proteins from various analyses. (B) Frequency distributions of identified proteins in two virus-infected sample sets, with H:L ratios expressed as log2 values. Positive values represent up-regulated host proteins in virus-infected cells; negative values represent down-regulated host proteins. Characteristics of all peptide and protein distributions, mean log2H:L ratios, and SDs of log2 H:L ratios are shown in Table 1.
Combination of all fractions, and removal of all proteins identified by only a single peptide, resulted in identification and measurement of 2,759 total unique protein pairs. Each protein’s H:L ratio was converted to log space and inspection of each dataset indicated variability in each dataset’s mean log2 value and in each dataset’s log2 SD (Figure 3B; Table 1). Thus, every proteins’ H:L ratio was converted into a z-score as described in Section “Materials and Methods” (and in Coombs et al., 2010) to facilitate comparisons of each dataset. A number of proteins with significantly high or low log2 values and corresponding z-scores represented keratins and other proteins identified in other studies as probable contaminants (i.e., S200 binding proteins); thus, these proteins were removed from further calculations.
Stratification of each protein’s H:L ratio and its corresponding z-score indicated that numerous proteins in each sample could be considered significantly regulated. For example, of the 1,838 proteins identified in the standard cytosolic preparation, 40 were up-regulated at 95% confidence and 14 were also up-regulated at 99.9% confidence (Table 1). Thirty three proteins in the same dataset were down-regulated at 95% confidence, and five of these proteins were also down-regulated at 99.9% confidence. Inspection of protein H:L ratios and z-scores indicated that most proteins differentially regulated at >95% confidence had H:L ratios altered by >1.5-fold. Thus, proteins observed more than a single time were considered significantly regulated if at least one of their observations had a z-score ≥1.960σ, if another observation in the same type of fraction (i.e., standard cytosolic and PM cytosolic) was no more than 0.75σ in the opposite direction, and if the average H:L ratio was >1.5-fold. Using the above criteria, we identified and measured 66 proteins that were significantly up-regulated and 67 proteins that were significantly down-regulated (Table 2).
TABLE 2
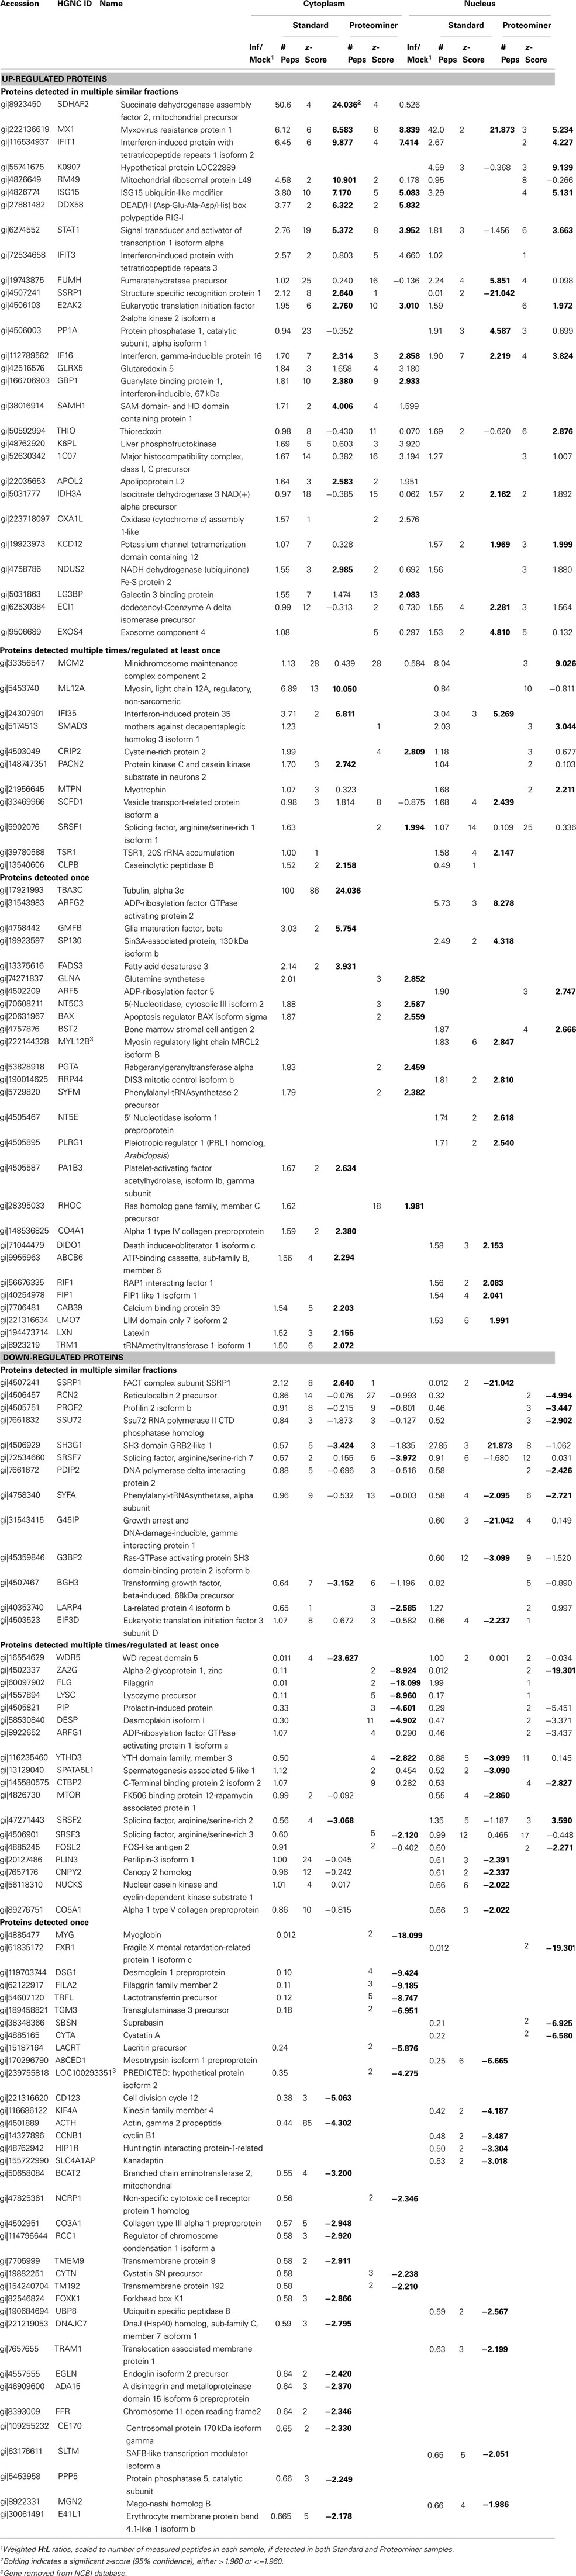
Table 2. Significantly affected HeLa cell proteins after reovirus infection.
Several of the up-regulated and non-regulated proteins that were identified and measured in the SILAC analysis were confirmed by Western blotting (Figure 4). Most Western blot results confirmed the SILAC-determined results although some differences in measured ratios probably reflect different levels of sensitivity of the two assays.
FIGURE 4
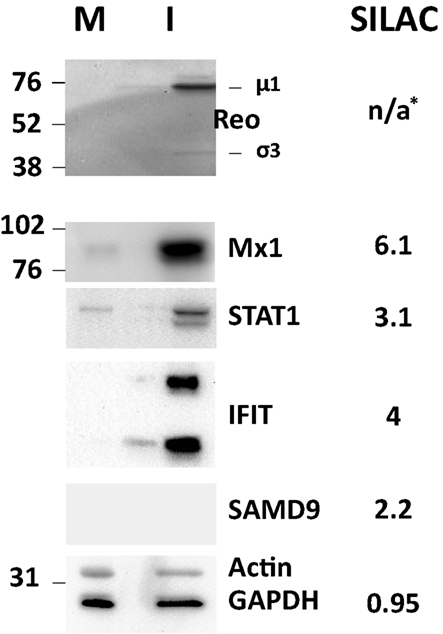
Figure 4. Western blot validation of experimentally determined SILAC ratos. HeLa cells were harvested and lysed with 0.5% NP-40 detergent, nuclei removed, and cytosolic fractions dissolved in SDS electrophoresis sample buffer. Proteins were resolved in 10% mini-SDS-PAGE, transferred to PVDF, and probed with indicated antibodies. Bands were visualized, and intensities measured, with an Alpha Innotech FluorChem®Q Multi Image® III instrument. Molecular weight standards are indicated at left and SILAC-measured ratios are indicated on the right. *, No viral proteins measured by SILAC as these are absent from mock-infected samples.
Proteins Up-Regulated by Reovirus Infection are Associated with Antimicrobial and Antiviral Responses, GTPase Activity, Nucleotide Binding, Interferon Signaling, and Enzymes Associated with Energy Generation
Proteins, and their levels of regulation, were analyzed by a variety of means. Protein gi numbers were imported into Uniprot (see text foot note 1) and converted into HUGO nomenclature committee (HGNC) identifiers. The HGNC IDs that represented significantly up-regulated and down-regulated proteins at the 95% confidence interval were then imported into DAVID (Dennis et al., 2003; Huang et al., 2009b), gene identifications converted to Entrez gene IDs by that suite of programs, and gene ontological biological processes and molecular functions identified at 95% confidence (Figure 5).
FIGURE 5
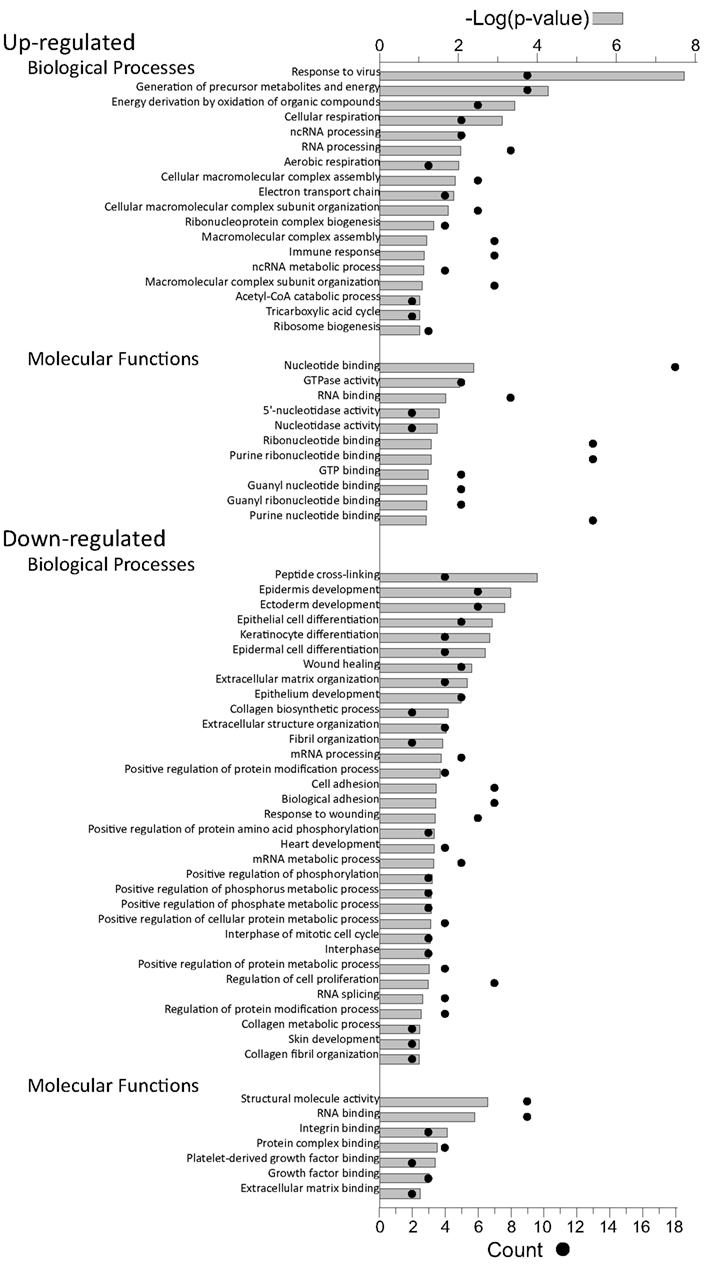
Figure 5. Gene ontology analyses of up-regulated and down-regulated proteins. The proteins identified in Table 2 were imported into the DAVID gene ontology suite of programs at the NIAID, gene identifications converted by that program, and ontological functions determined by GOTERM.
Up-regulated proteins were assigned to 18 GOTERM biological processes at 95% confidence (Figure 5, upper), that included cellular respiration, energy metabolism, and responses to viruses. Up-regulated proteins were also assigned to 11 functional groups (Figure 5) including primarily nucleotide binding. Protein gi numbers and levels of regulation were also imported into the Ingenuity Pathways Analysis (IPA®) tool which identified 13 GO categories (Figure 6A). Up-regulated proteins were enriched in growth factor, ion channel, kinase, phosphatase, and transmembrane receptor categories, whereas there were proportionally fewer up-regulated peptidase, translation regulators, and “other” (unknown) categories. Interacting pathways were also constructed by IPA. A total of 22 pathways were identified at a confidence level of 95% or greater. Five of these pathways, each with 11 or more “focus” members (significantly up- or down-regulated proteins), shared common members, and it was possible to build a single, merged pathway (Figure 6B). One other pathway (RNA post-transcriptional modification) contained only five focus molecules. The other 16 pathways consisted of several proteins, but contained only a single focus protein (data not shown). The five networks that contained 11 or more focus members corresponded to antimicrobial and inflammatory response; gastrointestinal disease; cell cycle, death, growth, proliferation, and movement; and DNA replication pathways (Figure 6C). Proteins present in the pathways and identified in our analyses as up-regulated are depicted in shades of red and include FADS3, IFIT1, and SAP130. Proteins present in the pathways and identified as down-regulated are shown in green and include AZGP1, LTF, and WDR5. Proteins present in the pathways and identified in our analyses, but neither up- nor down-regulated, are depicted in gray and include NF-KB complex, MAPK1, and TUBB, and proteins known to participate in the pathways but not identified in our analyses are shown in white and include AGER, IL28A, and MARK1–3. IPA analyses identify interaction nodes. For example, several of the highly up-regulated proteins interact with few other proteins, but some, such as STAT, ISG15, and Mx1 interact with four or more. Many of these molecules are involved in innate immunity. In addition, the interferon-induced, large GTPase dynamin-like Mx proteins are important anti viral proteins, particularly against RNA viruses (Haller and Kochs, 2002; Haller et al., 2009) and have been identified in several proteomic studies as up-regulated by influenza virus infection (Baas et al., 2006; Vester et al., 2009; Coombs, 2011). In addition, modulation of interferon response by reoviruses, including through STAT activation, has been demonstrated (Goody et al., 2007; Sherry, 2009; Zurney et al., 2009). Thus, our SILAC observations are validated by, and support, previous findings. Similarly, a few of the down-regulated proteins interact with few partners, but several, including WDR5, appear as interaction “hubs.” We identified numerous other interaction hubs, such as LGAL53 and NF-KB which were not, themselves, significantly altered, but which interacted with several differentially regulated proteins.
FIGURE 6
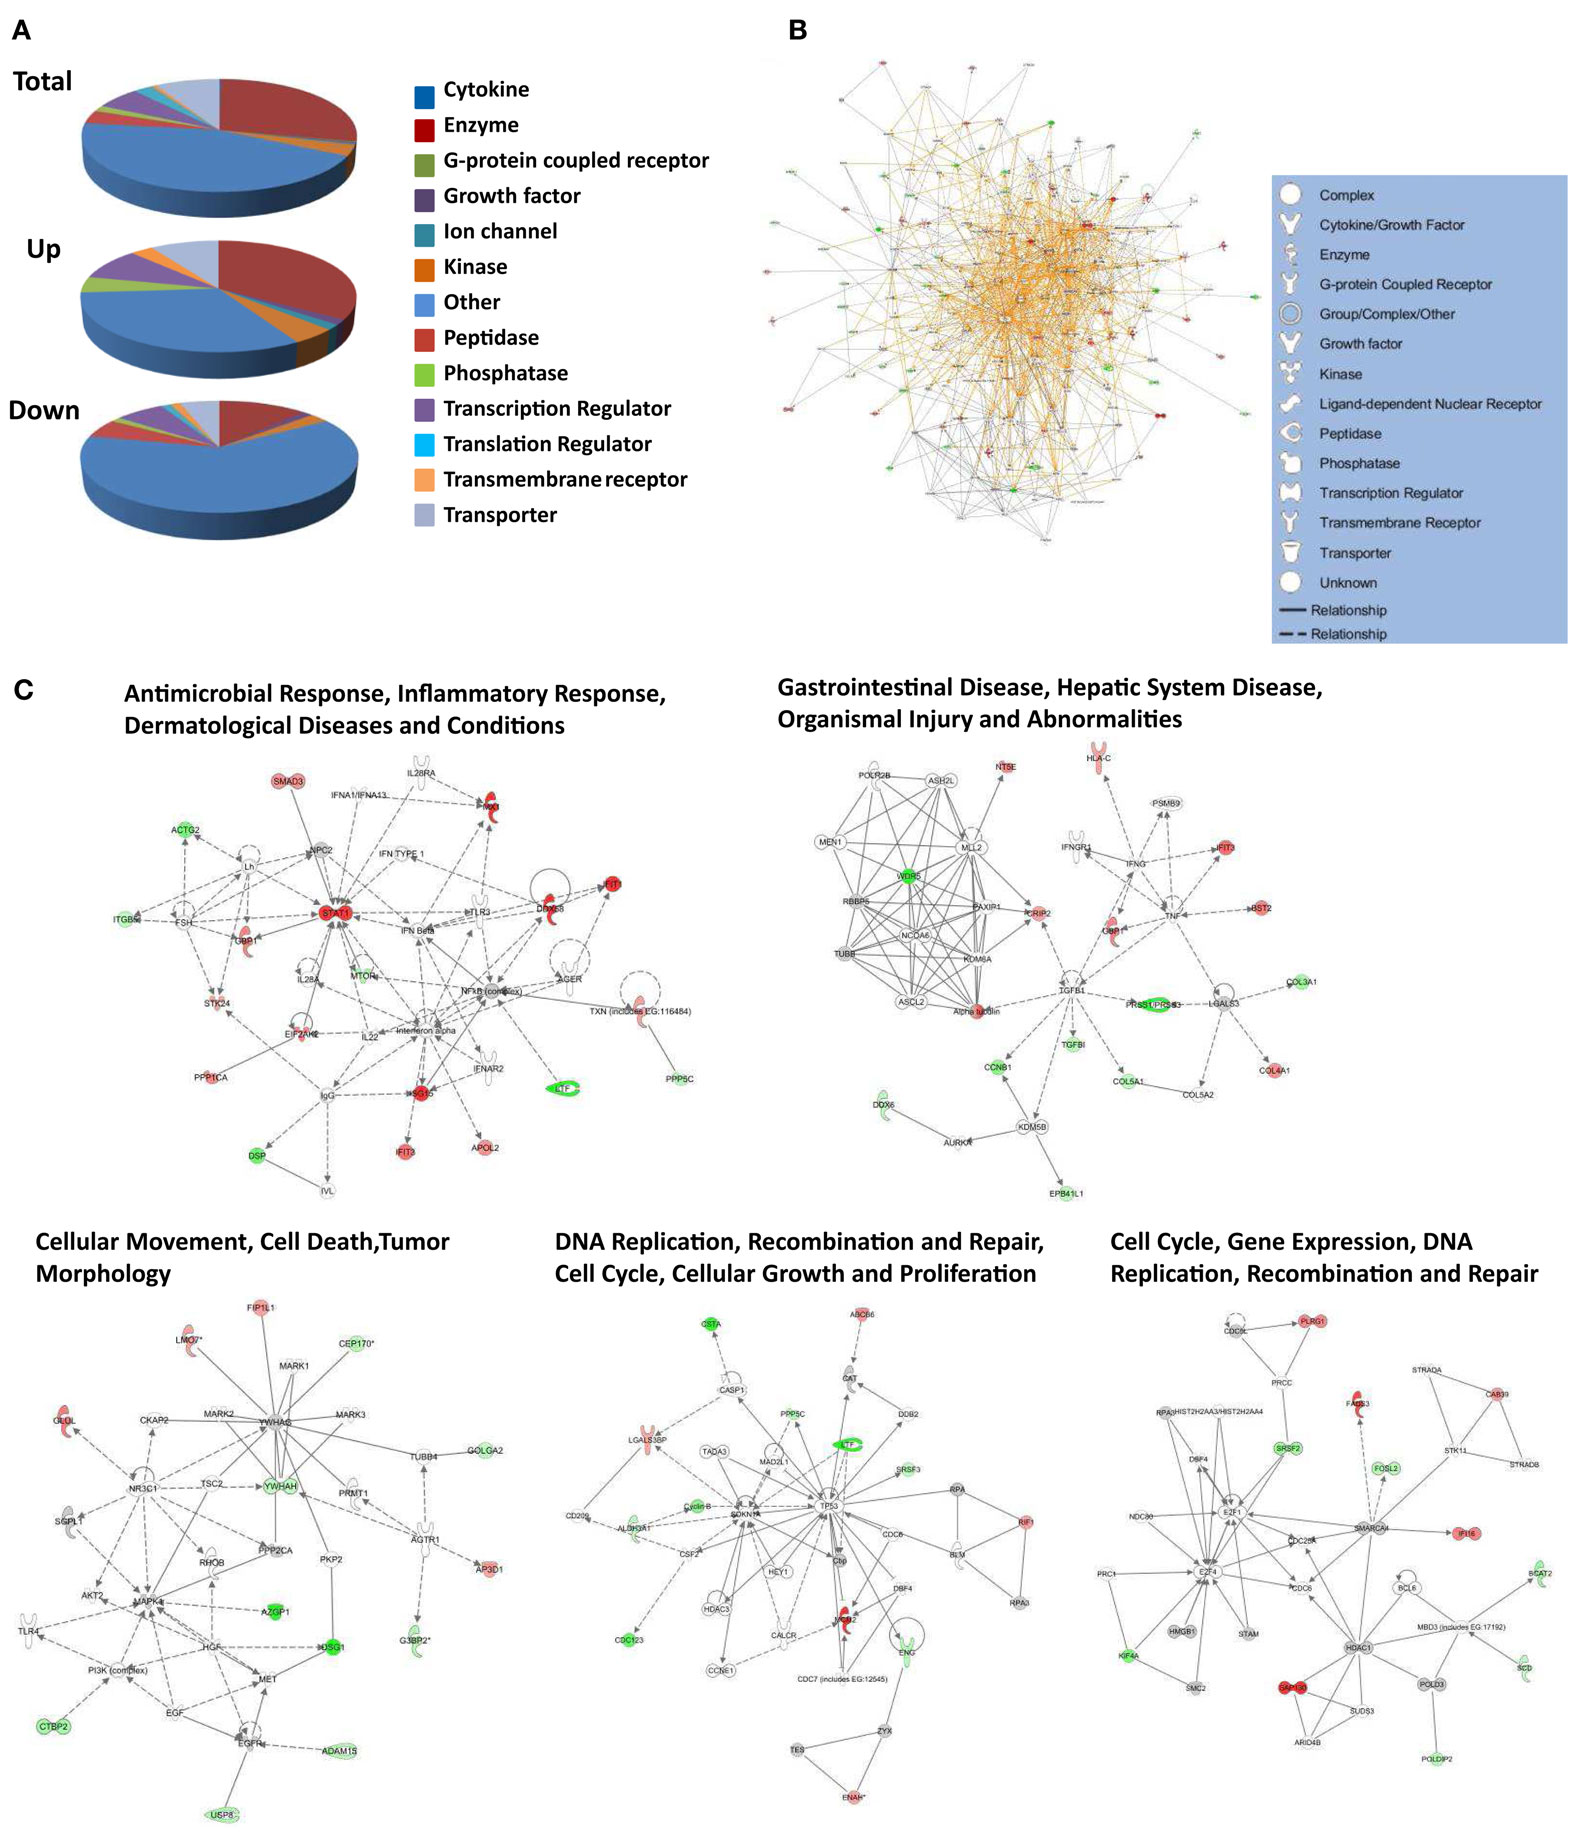
Figure 6. Molecular pathways of regulated proteins. Proteins and their levels of regulation were imported into the Ingenuity Pathways Analysis (IPA®) tool and interacting pathways were constructed. (A) Ontological classifications of all measured proteins (Total) as well as those significantly up- and down-regulated. The indicated ontological classifications start at the top of each pie chart and are presented clockwise. (B) Merged networks, containing all molecules present in each of the five individual networks. (C) The top five networks, identified at 95% confidence and each of which contained 11 or more “focus” molecules (molecules significantly up- or down-regulated), with pathway names indicated. Solid lines: direct known interactions; dashed lines: suspected or indirect interactions; red: significantly up-regulated proteins; pink: moderately up-regulated proteins; gray: proteins identified but not significantly regulated; light green: moderately down-regulated proteins; dark green: significantly down-regulated proteins; white: proteins known to be in network, but not identified in our study.
Proteins Down-Regulated by Reovirus Infection are Associated with Cell Differentiation, Dermal Differentiation, and Molecular Binding
Down-regulated proteins were assigned to 33 biological processes at 95% confidence (Figure 5, lower), that included cell differentiation, peptide cross-linking, and ectoderm and endoderm development. Down-regulated proteins were also assigned to seven functional groups, including structural molecule activity and various factor binding roles (Figure 5). IPA-generated GO categories indicated down-regulated proteins were enriched in unknown categories whereas there were proportionally fewer down-regulated enzymatic and transporter categories (Figure 6A). Additional IPA pathway analyses indicated numerous components of the “Interferon signaling” and “Role of PKR in interferon induction and antiviral response” canonical pathways were significantly up-regulated, whereas numerous arms of the “Regulation of actin-based motility by rho” canonical pathway were down-regulated (data not shown).
Proteominer Enrichment Led to Identification of Comparable Numbers of Proteins, but PM-Enriched Proteins were Identified by Fewer Peptides
As indicated earlier, 1,903 proteins were identified in the standard cytosolic fraction, compiled from 24,927 H:L peptide pairs (Table 1). This corresponds to an average of 13.1 peptides/protein (SD ± 20.5; Figure 7). In contrast, PM enrichment of the cytosolic fraction led to identification of 17,484 H:L peptide pairs and 1,657 proteins (average = 10.3 peptides, ±15.8). Slightly more proteins were identified in the PM-enriched nuclear fraction than in the standard nuclear fraction, but the average numbers of identified peptides, and the corresponding SD, were also lower in the PM-enriched fraction (Figure 7). This pattern was seen irrespective of whether all proteins were examined (white boxes), or only proteins common to both the standard and PM enrichment fractions (gray boxes). Previous studies in our lab have shown that biologic replicates have ∼67% overlap and an r2 degree of correlation of about 0.04, whereas technical replicates of the same biologic replicate have ∼82% overlap and an r2 value of about 0.66 (Coombs et al., 2010; Table 3). Comparisons of the overlap and r2 values between standard preparations and their cognate PM enrichment preparations showed intermediate values of ∼68–74% overlap and r2 ranging between 0.25 and 0.44 (Table 3), suggesting the PM enrichment strategy did not add substantially to information provided by standard preparations.
TABLE 3
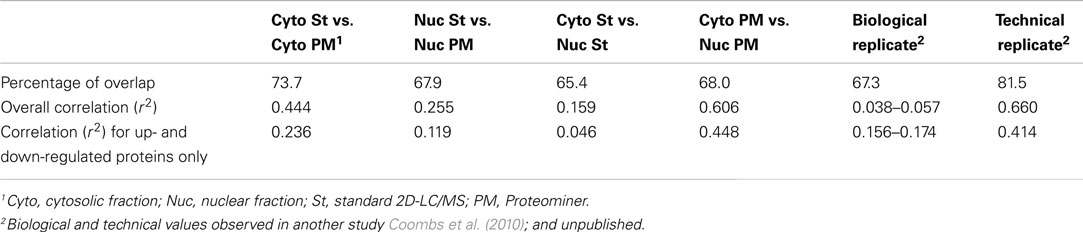
Table 3. Correlation and overlap between various sample preparation schemes.
FIGURE 7
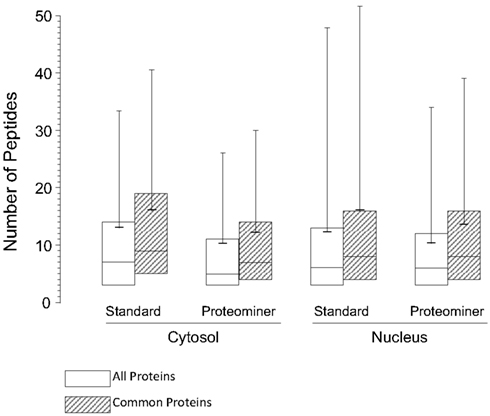
Figure 7. Box plots of number of peptides identified under each experimental condition. The box encompasses the upper and lower quartile. Median values for each condition are indicated by the full horizontal line inside each box, the average is indicated by the shorter thick line, and SDs are indicated by upward error bars  , all identified proteins;
  , only proteins identified as common to both the standard and PM analyses.
Note Added in Proof
The Mann laboratory has recently used label-free approaches to determine the relative quantity of each of thousands of proteins in a variety of human cell lines, including HeLa cells (Geiger et al., 2012). As a more direct analysis to determine whether application of Proteominer beads led to identification of lower abundance proteins, we sorted our datasets and determined there were no significant differences in the average and median quantities of proteins identified by either of the two methods in each of the cytosolic and nuclear fractions, further strengthening the main conclusion of this study, that non-biased enrichment using this particular affinity method does not contribute to deeper proteomic mining.
Author Contributions
Jieyuan Jiang and Kolawole J. Opanubi performed experimental work described herein, all co-authors performed database and computational analyses, and all co-authors wrote and edited the manuscript.
Conflict of Interest Statement
The authors declare that the research was conducted in the absence of any commercial or financial relationships that could be construed as a potential conflict of interest.
Acknowledgments
This work was supported by grant MT-11630 from the Canadian Institutes of Health Research to Kevin M. Coombs. The authors thank Peyman Ezatti for expert technical assistance, and members of the laboratory for reviewing the manuscript.
Footnote
References
Baas, T., Baskin, C. R., Diamond, D. L., Garcia-Sastre, A., Bielefeldt-Ohmann, H., Tumpey, T. M., Thomas, M. J., Carter, V. S., Teal, T. H., Van Hoeven, N., Proll, S., Jacobs, J. M., Caldwell, Z. R., Gritsenko, M. A., Hukkanen, R. R., Camp, D. G. II, Smith, R. D., and Katze, M. G. (2006). Integrated molecular signature of disease: analysis of influenza virus-infected macaques through functional genomics and proteomics. J. Virol. 80, 10813–10828.
Berard, A., and Coombs, K. M. (2009). Mammalian reoviruses: propagation, quantification, and storage. Curr. Protoc. Microbiol. Chapter 15, :Unit15C.1.
Booy, A. T., Haddow, J. D., Ohlund, L. B., Hardie, D. B., and Olafson, R. W. (2005). Application of isotope coded affinity tag (ICAT) analysis for the identification of differentially expressed proteins following infection of Atlantic salmon (Salmo salar) with infectious hematopoietic necrosis virus (IHNV) or Renibacterium salmoninarum (BKD). J. Proteome Res. 4, 325–334.
Burgener, A., Boutilier, J., Wachihi, C., Kimani, J., Carpenter, M., Westmacott, G., Cheng, K., Ball, T. B., and Plummer, F. (2008). Identification of differentially expressed proteins in the cervical mucosa of HIV-1-resistant sex workers. J. Proteome Res. 7, 4446–4454.
Coffey, M. C., Strong, J. E., Forsyth, P. A., and Lee, P. W. (1998). Reovirus therapy of tumors with activated Ras pathway. Science 282, 1332–1334.
Coombs, K. M. (2011). Quantitative proteomics of complex mixtures. Expert Rev. Proteomics 8, 659–677.
Coombs, K. M., Berard, A., Xu, W., Krokhin, O., Meng, X., Cortens, J. P., Kobasa, D., Wilkins, J., and Brown, E. G. (2010). Quantitative proteomic analyses of influenza virus-infected cultured human lung cells. J. Virol. 84, 10888–10906.
DeBiasi, R. L., Clarke, P., Meintzer, S., Jotte, R., Kleinschmidt-Demasters, B. K., Johnson, G. L., and Tyler, K. L. (2003). Reovirus-induced alteration in expression of apoptosis and DNA repair genes with potential roles in viral pathogenesis. J. Virol. 77, 8934–8947.
Dennis, G., Sherman, B. T., Hosack, D. A., Yang, J., Gao, W., Lane, H. C., and Lempicki, R. A. (2003). DAVID: Database for annotation, visualization, and integrated discovery. Genome Biol. 4. doi: 10.1186/gb-2003-4-9-r60
Dwivedi, R. C., Dhindsa, N., Krokhin, O. V., Cortens, J., Wilkins, J. A., and El-Gabalawy, H. S. (2009). The effects of infliximab therapy on the serum proteome of rheumatoid arthritis patients. Arthritis Res. Ther. 11. doi:10.1186/ar2637
Dwivedi, R. C., Spicer, V., Harder, M., Antonovici, M., Ens, W., Standing, K. G., Wilkins, J. A., and Krokhin, O. V. (2008). Practical implementation of 2D HPLC scheme with accurate peptide retention prediction in both dimensions for high-throughput bottom-up proteomics. Anal. Chem. 80, 7036–7042.
Forsyth, P., Roldan, G., George, D., Wallace, C., Palmer, C. A., Morris, D., Cairncross, G., Matthews, M. V., Markert, J., Gillespie, Y., Coffey, M., Thompson, B., and Hamilton, M. (2008). A phase I trial of intratumoral administration of reovirus in patients with histologically confirmed recurrent malignant gliomas. Mol. Ther. 16, 627–632.
Geiger, T., Wehner, A., Schaab, C., Cox, J., Mann M. (2012). Comparative proteomic analysis of eleven common cell lines reveals ubiquitous but varying expression of most proteins. Mol. Cell. Proteomics. PMID:22278370. [Epub ahead of print].
Geiss, G. K., Salvatore, M., Tumpey, T. M., Carter, V. S., Wang, X. Y., Basler, C. F., Taubenberger, J. K., Bumgarner, R. E., Palese, P., Katze, M. G., and Garcia-Sastre, A. (2002). Cellular transcriptional profiling in influenza A virus-infected lung epithelial cells: the role of the nonstructural NS1 protein in the evasion of the host innate defense and its potential contribution to pandemic influenza. Proc. Natl. Acad. Sci. U.S.A. 99, 10736–10741.
Gilar, M., Olivova, P., Daly, A. E., and Gebler, J. C. (2005). Orthogonality of separation in two-dimensional liquid chromatography. Anal. Chem. 77, 6426–6434.
Goldberg, A. D., Allis, C. D., and Bernstein, E. (2007). Epigenetics: a landscape takes shape. Cell 128, 635–638.
Goody, R. J., Beckham, J. D., Rubtsova, K., and Tyler, K. L. (2007). JAK-STAT signaling pathways are activated in the brain following reovirus infection. J. Neurovirol. 13, 373–383.
Haller, O., and Kochs, G. (2002). Interferon-induced mx proteins: dynamin-like GTPases with antiviral activity. Traffic 3, 710–717.
Haller, O., Staeheli, P., and Kochs, G. (2009). Protective role of interferon-induced Mx GTPases against influenza viruses. Rev. Sci. Tech. 28, 219–231.
Huang, D. W., Sherman, B. T., and Lempicki, R. A. (2009a). Systematic and integrative analysis of large gene lists using DAVID bioinformatics resources. Nat. Protoc. 4, 44–57.
Huang, Q. L., Wang, L., Bai, S. Y., Lin, W. S., Chen, W. N., Lin, J. Y., and Lin, X. (2009b). Global proteome analysis of hepatitis B virus expressing human hepatoblastoma cell line HepG2. J. Med. Virol. 81, 1539–1550.
Jiang, J., Parker, C. E., Fuller, J. R., Kawula, T. H., and Borchers, C. H. (2007). An immunoaffinity tandem mass spectrometry (iMALDI) assay for detection of Francisella tularensis. Anal. Chim. Acta 605, 70–79.
Keshamouni, V. G., Jagtap, P., Michailidis, G., Strahler, J. R., Kuick, R., Reka, A. K., Papoulias, P., Krishnapuram, R., Srirangam, A., Standiford, T. J., Andrews, P. C., and Omenn, G. S. (2009). Temporal quantitative proteomics by iTRAQ 2D-LC-MS/MS and corresponding mRNA expression analysis identify post-transcriptional modulation of actin-cytoskeleton regulators during TGF-beta-Induced epithelial-mesenchymal transition. J. Proteome Res. 8, 35–47.
Kobasa, D., Jones, S. M., Shinya, K., Kash, J. C., Copps, J., Ebihara, H., Hatta, Y., Kim, J. H., Halfmann, P., Hatta, M., Feldmann, F., Alimonti, J. B., Fernando, L., Li, Y., Katze, M. G., Feldmann, H., and Kawaoka, Y. (2007). Aberrant innate immune response in lethal infection of macaques with the 1918 influenza virus. Nature 445, 319–323.
Lucitt, M. B., Price, T. S., Pizarro, A., Wu, W., Yocum, A. K., Seiler, C., Pack, M. A., Blair, I. A., Fitzgerald, G. A., and Grosser, T. (2008). Analysis of the zebrafish proteome during embryonic development. Mol. Cell Proteomics 7, 981–994.
Mendez, II Hermann, L. L., Hazelton, P. R., and Coombs, K. M. (2000). A comparative analysis of freon substitutes in the purification of reovirus and calicivirus. J. Virol. Methods 90, 59–67.
Pan, D., Pan, L. Z., Hill, R., Marcato, P., Shmulevitz, M., Vassilev, L. T., and Lee, P. W. K. (2011). Stabilisation of p53 enhances reovirus-induced apoptosis and virus spread through p53-dependent NF-kappa B activation. Br. J. Cancer 105, 1012–1022.
Poggioli, G. J., DeBiasi, R. L., Bickel, R., Jotte, R., Spalding, A., Johnson, G. L., and Tyler, K. L. (2002). Reovirus-induced alterations in gene expression related to cell cycle regulation. J. Virol. 76, 2585–2594.
Schiff, L. A., Nibert, M. L., and Tyler, K. L. (2007). “Orthoreoviruses and their replication,” in Fields Virology, Vol. 5, eds D. M. Knipe and P. M. Howley (Philadelphia: Lippincott Williams & Wilkins), 1853–1915.
Sherry, B. (2009). Rotavirus and reovirus modulation of the interferon response. J. Interferon Cytokine Res. 29, 559–567.
Skiba, M., Mettenleiter, T. C., and Karger, A. (2008). Quantitative whole-cell proteome analysis of pseudorabies virus-infected cells. J. Virol. 82, 9689–9699.
Smith, R. E., Zweerink, H. J., and Joklik, W. K. (1969). Polypeptide components of virions, top component and cores of reovirus type 3. Virology 39, 791–810.
Spicer, V., Yamchuk, A., Cortens, J., Sousa, S., Ens, W., Standing, K. G., Wilkins, J. A., and Krokhin, O. (2007). Sequence-specific retention calculator. A family of peptide retention time prediction algorithms in reversed-phase HPLC: applicability to various chromatographic conditions and columns. Anal. Chem. 79, 8762–8768.
Stewart, J. J., White, J. T., Yan, X., Collins, S., Drescher, C. W., Urban, N. D., Hood, L., and Lin, B. (2006). Proteins associated with Cisplatin resistance in ovarian cancer cells identified by quantitative proteomic technology and integrated with mRNA expression levels. Mol. Cell Proteomics 5, 433–443.
Thirukkumaran, C. M., Nodwell, M. J., Hirasawa, K., Shi, Z. Q., Diaz, R., Luider, J., Johnston, R. N., Forsyth, P. A., Magliocco, A. M., Lee, P., Nishikawa, S., Donnelly, B., Coffey, M., Trpkov, K., Fonseca, K., Spurrell, J., and Morris, D. G. (2010). Oncolytic viral therapy for prostate cancer: efficacy of reovirus as a biological therapeutic. Cancer Res. 70, 2435–2444.
Tian, Q., Stepaniants, S. B., Mao, M., Weng, L., Feetham, M. C., Doyle, M. J., Yi, E. C., Dai, H., Thorsson, V., Eng, J., Goodlett, D., Berger, J. P., Gunter, B., Linseley, P. S., Stoughton, R. B., Aebersold, R., Collins, S. J., Hanlon, W. A., and Hood, L. E. (2004). Integrated genomic and proteomic analyses of gene expression in mammalian cells. Mol. Cell Proteomics 3, 960–969.
Tran, A. T., and Coombs, K. M. (2006). “Reoviruses,” in Encyclopedia of Life Sciences, Vol. 2. (Elsevier). doi: 10.1038/npg.els.0004289
Vester, D., Rapp, E., Gade, D., Genzel, Y., and Reichl, U. (2009). Quantitative analysis of cellular proteome alterations in human influenza A virus-infected mammalian cell lines. Proteomics 9, 3316–3327.
Zhang, J., Niu, D., Sui, J., Ching, C. B., and Chen, W. N. (2009). Protein profile in hepatitis B virus replicating rat primary hepatocytes and HepG2 cells by iTRAQ-coupled 2-D LC-MS/MS analysis: insights on liver angiogenesis. Proteomics 9, 2836–2845.
Zolotarjova, N., Mrozinski, P., Chen, H., and Martosella, J. (2008). Combination of affinity depletion of abundant proteins and reversed-phase fractionation in proteomic analysis of human plasma/serum. J. Chromatogr. A 1189, 332–338.
Keywords: RNA virus, virus infection, host cell alterations, mass spectrometry, liquid chromatography, bioinformatics
Citation: Jiang J, Opanubi KJ and Coombs KM (2012) Non-biased enrichment does not improve quantitative proteomic delineation of reovirus T3D-infected HeLa cell protein alterations. Front. Microbio. 3:310. doi: 10.3389/fmicb.2012.00310
Received: 17 May 2012; Accepted: 06 August 2012;
Published online: 20 September 2012.
Edited by:
Ben Berkhout, University of Amsterdam, NetherlandsReviewed by:
Hendrik Huthoff, King’s College London, UKDave Speijer, University of Amsterdam, Netherlands
Copyright: © 2012 Jiang, Opanubi and Coombs. This is an open-access article distributed under the terms of the Creative Commons Attribution License, which permits use, distribution and reproduction in other forums, provided the original authors and source are credited and subject to any copyright notices concerning any third-party graphics etc.
*Correspondence: Kevin M. Coombs, Manitoba Centre for Proteomics and Systems Biology, John Buhler Research Centre, Room 799, 715 McDermot Avenue, Winnipeg, MB, Canada R3E 3P4. e-mail: kcoombs@cc.umanitoba.ca
†Present address: Jieyuan Jiang, Institute of Veterinary Medicine, Jiangsu Academy of Agricultural Sciences, Nanjing 210014, China.