
- 1Department of Environmental Earth System Science, Stanford University, Stanford, CA, USA
- 2MIT/WHOI Joint Program in Chemical Oceanography, Woods Hole, MA, USA
The microbial nitrogen (N) cycle involves a variety of redox processes that control the availability and speciation of N in the environment and that are involved with the production of nitrous oxide (N2O), a climatically important greenhouse gas. Isotopic measurements of ammonium (NH+4), nitrite (NO−2), nitrate (NO−3), and N2O can now be used to track the cycling of these compounds and to infer their sources and sinks, which has lead to new and exciting discoveries. For example, dual isotope measurements of NO−3 and NO−2 have shown that there is NO−3 regeneration in the ocean's euphotic zone, as well as in and around oxygen deficient zones (ODZs), indicating that nitrification may play more roles in the ocean's N cycle than generally thought. Likewise, the inverse isotope effect associated with NO−2 oxidation yields unique information about the role of this process in NO−2 cycling in the primary and secondary NO−2 maxima. Finally, isotopic measurements of N2O in the ocean are indicative of an important role for nitrification in its production. These interpretations rely on knowledge of the isotope effects for the underlying microbial processes, in particular ammonia oxidation and nitrite oxidation. Here we review the isotope effects involved with the nitrification process and the insights provided by this information, then provide a prospectus for future work in this area.
Nitrification in the Ocean—Roles in NO−3 Supply and N2O Production
Nitrification comprises a key link in the marine nitrogen (N) cycle converting the most reduced form of N (ammonia, NH3) to the most oxidized (nitrate, NO−3). Although sunlight appears to partly inhibit nitrification (Olson, 1981a; Guerrero and Jones, 1996; Merbt et al., 2012), there are many indications that nitrification occurs in the euphotic zone (Ward, 1985, 2005; Wankel et al., 2007; Yool et al., 2007; Clark et al., 2008). Therefore, when reduced organic N is released into solution through cell lysis, grazing and digestion, it can be either reassimilated or oxidized back to NO−3 in the sunlit surface waters. Also, when particulate organic matter (in the form of detritus, fecal pellets, or marine snow) sinks out of the euphotic zone, it is gradually broken down into its component parts and remineralized into its inorganic forms: CO2, NH+4, and PO3−4. In oxic water columns, the NH+4 released from organic matter remineralization below the euphotic zone is rapidly oxidized to NO−3. The distribution of nitrification rates in the ocean is therefore expected to follow the distribution of NH+4 supply from organic matter remineralization, which decreases exponentially with depth (Ward and Zafiriou, 1988).
Nitrification is carried out through the combination of two microbial processes: ammonia oxidation to NO−2 and nitrite oxidation to NO−3. Ammonia oxidation is a chemoautotrophic process carried out by ammonia-oxidizing bacteria (AOB) and ammonia-oxidizing archaea (AOA). These organisms use NH3 as their source of reducing power for CO2 fixation and energy production. Nitrite oxidation is also a chemoautotrophic process and is carried out by nitrite-oxidizing bacteria (NOB). These bacteria use nitrite (NO−2) as their source of reducing power for CO2 fixation and energy production (Watson, 1965; Bock et al., 1989). Most ammonia and nitrite oxidizers are obligate chemoautotrophs (Watson and Waterbury, 1971), although a few are able to grow mixotrophically (Watson et al., 1986).
Although NO−2 is an intermediate in the nitrification process, it rarely accumulates in the ocean. NO−2 can be found at the base of the euphotic zone in a feature termed the primary nitrite maximum (PNM; Wada and Hattori, 1971). The processes contributing to NO−2 accumulation in the PNM are still debated, but most likely include a combination of ammonia oxidation and nitrite oxidation, as well as assimilatory nitrate and nitrite reduction by phytoplankton (Ward et al., 1982, 1989; Dore and Karl, 1996; Lomas and Lipschultz, 2006; Mackey et al., 2011). The relative contributions of these processes to NO−2 cycling have different implications for N biogeochemistry and the links between C and N cycling. Net production of NO−2 through nitrification (decoupling of ammonia and nitrite oxidation) can also have implications for the production of nitrous oxide (N2O), a climatically important greenhouse gas. It is therefore important to know how the processes contributing to the production and maintenance of the PNM vary in space and time.
NO−2 also accumulates in oxygen deficient regions of the water column in a feature termed the secondary nitrite maximum (SNM; Brandhorst, 1959). The SNM is generally assumed to reflect active denitrification in oxygen deficient zones (ODZs), as SNM features are only found in the absence of dissolved oxygen (Brandhorst, 1959; Cline and Richards, 1972; Codispoti and Christensen, 1985). However, recent studies have shown that the presence of a SNM feature may not coincide with the most intense NO−2 cycling, as active NO−2 reduction occurs in the Omani upwelling region in the absence of NO−2 accumulation (Jensen et al., 2011; Lam et al., 2011). NO−2 consumption in the SNM may occur through many processes, including denitrification (reduction of NO−2 to N2), anaerobic ammonia oxidation (reduction of NO−2 to N2 and oxidation to NO−3), and nitrite oxidation (oxidation of NO−2 to NO−3). Recent studies using natural abundance isotopes (Casciotti, 2009), profile modeling (Lam et al., 2011), isotope tracers (Lipschultz et al., 1990; Füssel et al., 2012), and gene markers (Füssel et al., 2012) suggest that a significant fraction of NO−2 produced within the SNM may be consumed through oxidation to NO−3.
Several questions remain about the roles of AOB and AOA in marine nitrification, the controls on their distribution and activity, and the rates of these processes. These questions relate to the cycling of NO−3, NO−2, and NH+4 in the water column, and the production of N2O linked to nitrification. These questions can be addressed with a variety of complementary approaches, including molecular community analysis and quantification, instantaneous rate measurements, natural abundance stable isotope measurements, and geochemical modeling.
Examples of applications involving the use of natural abundance stable isotopes to study nitrification include: (1) the role of euphotic zone nitrification in supplying NO−3 for photosynthetic growth (Wankel et al., 2007; DiFiore et al., 2009), (2) the contributions of nitrification and nitrate reduction to NO−2 accumulation in the PNM (Buchwald and Casciotti, unpublished), (3) the role of nitrification in near-surface N2O production (Dore et al., 1998; Santoro et al., 2010, 2011), and (4) the role of nitrite oxidation in recycling NO−3 in and around ODZs (Sigman et al., 2005; Casciotti and McIlvin, 2007; Casciotti, 2009). Understanding the isotopic systematics for nitrification is also important for tracking the balance of high-latitude and low-latitude productivity and N budget processes (N fixation and denitrification) through NO−3 isotope distributions in the deep ocean (Sigman et al., 2009). In order to understand these applications we first review the N and O isotopic systematics of the nitrification process, including both ammonia and nitrite oxidation.
Isotope Systematics for Ammonia Oxidation
The δ18O value of NO−2 produced during ammonia oxidation (δ18ONO2,nit = (18O/16ONO2 ÷ 18O/16OVSMOW − 1) × 1000) is dependent on the δ18O values of the oxygen atom sources (O2 and H2O), isotopic fractionation during their incorporation (18εk,O2 and 18εk,H2O,1, respectively), as well as any exchange of oxygen atoms between nitrite and water (xAO) and the corresponding equilibrium isotope effect (18εeq) (Equation 1; Casciotti et al., 2011). Throughout this review, kinetic isotope fractionation factors are defined by αk = kl/kh where kl is the first order rate constant for reaction of the light isotope and kh is that for reaction of the heavy isotope. Equilibrium fractionation factors are defined as αeq = R1/R2 where R1 and R2 are the isotope ratios of two species in equilibrium. Kinetic and equilibrium isotope effects are defined by ε = (α − 1) × 1000.
Even though oxygen is incorporated enzymatically from O2 to H2O in a 1:1 ratio during ammonia oxidation (Andersson and Hooper, 1983), early studies of AOB found that a large amount of oxygen atom exchange with water could be associated with ammonia oxidation (Dua et al., 1979; Andersson et al., 1982; Andersson and Hooper, 1983). The conditions favoring oxygen atom exchange included high cell densities and high NO−2 concentrations. These findings, as well as the low variation of deep ocean δ18ONO3 (Casciotti et al., 2002; Sigman et al., 2009) led researchers to assume that the O atoms in oceanic NO−3 derive primarily from H2O with little residual signal from dissolved O2. In more recent studies, however, the amount of biologically-catalyzed exchange has been determined under lower cell densities and substrate concentrations and found to be much lower for marine AOB (Casciotti et al., 2010; Buchwald et al., 2012) and AOA (Santoro et al., 2011). Exchange levels were particularly low (5%) when NO−2 concentrations were held near 1 μm by co-cultivation with NOB (Buchwald et al., 2012). These results suggested that oxygen isotope exchange during nitrification may be quite low where ammonia and nitrite oxidation are tightly coupled, but may play a role when ammonia and nitrite oxidation become decoupled, such as in the PNM.
Given low amounts of biologically-catalyzed oxygen atom exchange with H2O, the low δ18O values of NO−3 in seawater may be surprising given the high δ18O values of dissolved O2 (Kroopnick and Craig, 1976). However, oxygen atom incorporation from O2 and/or H2O during ammonia oxidation is associated with isotopic fractionation, such that the 18O:16O of oxygen atoms incorporated into NO−2 is significantly lower than the ambient pools of O2 and H2O (Casciotti et al., 2010; Santoro et al., 2011). This leads to production of NO−2 from ammonia oxidation with δ18O values between −3‰ and 5‰ rather than near 12‰, which would be expected from average δ18OH2O and δ18OO2 values (Casciotti et al., 2010). Furthermore, since oxygen atom exchange occurs with an equilibrium isotope effect (18εeq) of 11–14‰ (Casciotti et al., 2007; Buchwald and Casciotti, unpublished), this equilibration would tend to raise the δ18O value of NO−2 relative to the initial δ18ONO2 produced by ammonia oxidation.
Nitrogen isotopic fractionation during ammonia oxidation ranges from 14‰ to 38‰ for AOB (Mariotti et al., 1981; Yoshida, 1988; Casciotti et al., 2003) and 20–22‰ for AOA (Santoro and Casciotti, 2011). These values represent the isotope effect expressed under non-limiting concentrations of NH+4. In the ocean NH+4 consumption generally goes to completion, so the isotope effect for ammonia oxidation may not be expressed. It may, however, be expressed at the branch point between ammonia assimilation and oxidation in the euphotic zone (Wankel et al., 2007; DiFiore et al., 2009) or in the production of N2O by ammonia oxidizers (Yoshida, 1988; Frame and Casciotti, 2010).
Isotope Systematics for N2O Production
Production of N2O by AOB occurs through two separate pathways: hydroxylamine decomposition and nitrite reduction, so-called “nitrifier denitrification” (Figure 1; Poth and Focht, 1985; Hooper et al., 1990). The isotopic compositions (δ15Nbulk, δ18O, δ15Nα, δ15Nβ, and site preference (SP) = δ15Nα − δ15Nβ) of the N2O produced through these pathways may provide insight into the mechanisms of N2O production under different growth conditions (Frame and Casciotti, 2010; Sutka et al., 2003, 2004). For example, N2O production through nitrifier denitrification (enhanced by high cell densities, high NO−2 concentrations, and low O2 concentrations; Frame and Casciotti, 2010) has low δ15Nbulk and low SPs relative to that produced by hydroxylamine decomposition (Figure 2). This is most likely due to the additional steps involved with the production of N2O from NO−2 and accumulation of the main product, NO−2, which enables fractionation associated with NO−2 reduction to be expressed.
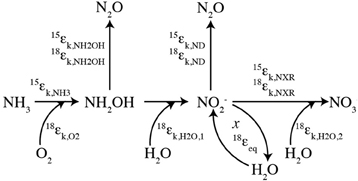
Figure 1. Isotopic systematics for nitrification. A schematic of the isotopic systematics for ammonia oxidation and nitrite oxidation during nitrification. The kinetic isotope effects for ammonia oxidation (15εk,NH3) and nitrite oxidation (15εk,NXR and 18εk,NXR) characterize the isotopic fractionation for the main N transformation processes while isotopic fractionation during oxygen atom incorporation (18εk,O2, 18εk,H2O,1, and 18εk,H2O,2) controls the oxygen isotopes incorporated by the central pathway. Oxygen isotope exchange during ammonia oxidation and/or post-production abiotic exchange (x) may also play a role through the equilibrium fractionation (18εeq) associated with it. N2O production occurs with N and O fractionation through decomposition of hydroxylamine (NH2OH) and nitrifier-denitrification (ND).
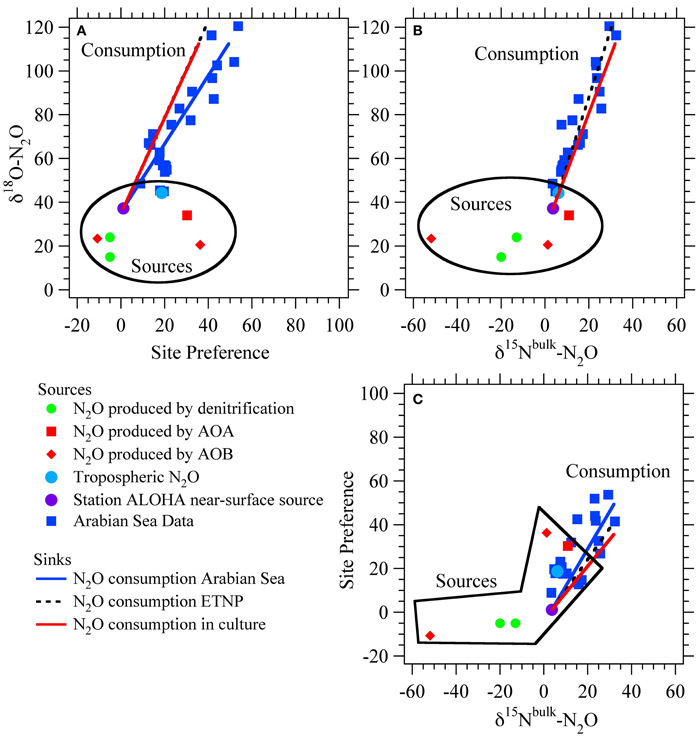
Figure 2. Isotopic signatures for nitrous oxide sources and sinks. Isotope-isotope plots for N2O sources from ammonia-oxidizing archaea (AOA; Santoro et al., 2011), nitrification and nitrifier-denitrification by ammonia-oxidizing bacteria (AOB; Frame and Casciotti, 2010), and production by denitrification of NO−3 or NO−2 (Barford et al., 1999; Casciotti et al., 2007). Also shown are average tropospheric air (Kim and Craig, 1990; Yoshida and Toyoda, 2000; Croteau et al., 2010) and the estimated near-surface source at Station ALOHA in the North Pacific Subtropical Gyre (Popp et al., 2002). The isotopic trends for N2O consumption by denitrification are based on the Arabian Sea data (McIlvin and Casciotti, 2010), ETNP data (Yamagishi et al., 2007), and culture studies (Ostrom et al., 2007). Sources and sinks are distinguished by their effects on d18O-N2O vs. SP (A), d18O-N2O vs. d15Nbulk-N2O (B), and SP vs. d15Nbulk-N2O (C).
Oxygen isotopes have been underutilized in determining N2O sources, primarily because the isotopic systematics are less well understood, but knowledge of the O isotope systematics is increasing (Frame and Casciotti, 2010; Snider et al., 2012). The N2O produced via nitrifier denitrification has a slightly lower δ18O value than that produced from hydroxylamine decomposition (Figure 2; Frame and Casciotti, 2010). This is most likely because H2O is incorporated into NO−2, leading to lower δ18O values in NO−2 relative to NH2OH. However, going from either NH2OH or NO−2 to N2O involves the loss of O atoms, which can occur with fractionation. This fractionation leads to preferential loss of 16O and retention of 18O in the residual N oxides transferred to N2O. The net isotopic fractionation for oxygen isotopes in the hydroxylamine decomposition pathway (18εNH2OH), including both incorporation of O2 into NH2OH and production of N2O from NH2OH, was 2.9 ± 0.8‰ indicating that N2O produced from this pathway had a lower 18O:16O than the ambient O2 (Frame and Casciotti, 2010). The net isotope effect for N2O production from NO−2 via nitrifier denitrification (18εND) was −8.4 ± 1.4‰ (Frame and Casciotti, 2010). The negative value indicates that the N2O produced from NO−2 is enriched in 18O relative to NO−2, consistent with branching of O atoms and preferential loss of 16O during this reaction (Casciotti et al., 2007).
The N2O site preference (SP) is determined mainly by the enzymatic mechanism, rather than the substrate δ15N value (Toyoda and Yoshida, 1999; Yoshida and Toyoda, 2000; Schmidt et al., 2004). The SP of N2O produced during nitrification is +30‰ to +38‰ (Figure 2; Sutka et al., 2003, 2004; Frame and Casciotti, 2010), while N2O produced from denitrification and nitrifier denitrification has a SP of −10‰ to +5‰ (Sutka et al., 2003, 2004; Toyoda et al., 2005; Frame and Casciotti, 2010). The large difference between the SP values of these two primary mechanisms for N2O production provides a large signal with which to distinguish their contributions. The interpretation of SP values is therefore somewhat simplified relative to bulk δ15N and δ18O values that reflect both mechanism and substrate isotope ratios, which change over time. This seemingly simple distinction is complicated, however, by the fact that N2O consumption during denitrification increases SP (Ostrom et al., 2007; Yamagishi et al., 2007; Koba et al., 2009). Therefore, a high SP value may arise through production of N2O via nitrification or net N2O consumption during denitrification. However, the δ18O signature of these two scenarios is quite different and can enable the scenarios to be distinguished (Figure 2).
Recently, the isotopic compositions of N2O produced by AOA were found to be distinct from AOB (Santoro et al., 2011). In particular, N2O produced by AOA is enriched in 15N and 18O relative to that produced by AOB, which may explain some of the elevated δ15N and δ18O values observed in oceanic N2O (Santoro et al., 2011). The reasons for the isotopic distinction between AOA and AOB is not known, but may involve a different mechanism of N2O production involving a unique intermediate or enzymatic pathway. However, the SP of N2O produced by AOA is similar to that of N2O produced by hydroxylamine decomposition by AOB (Santoro et al., 2011; Loescher et al., 2012). While it is not yet clear whether N2O production (or nitrification in general) by AOA involves hydroxylamine, isotopic evidence to date shows that the N2O produced aerobically by AOA does not have a SP consistent with denitrification or nitrifier-denitrification. δ18O data also show that the N2O produced by AOA incorporates O primarily from O2, rather than from H2O, which supports production by decomposition of an intermediate, rather than from NO−2 under the conditions tested (Santoro et al., 2011). It is still unknown whether AOA are able to produce N2O through a second pathway similar to nitrifier denitrification and thus produce N2O with a lower SP. Genetic analyses currently suggest that nitrification in AOA may proceed via a NO or HNO intermediate (Walker et al., 2010), which could potentially be converted to N2O. Further work is required to determine the pathway and intermediates of nitrification and N2O production by AOA, and to further study its isotope systematics under a variety of growth conditions.
Isotope Systematics for Nitrite Oxidation
The isotopic systematics for nitrite oxidation to nitrate have also been studied recently, and were found to occur with extremely unique inverse kinetic isotope effects for N (Casciotti, 2009) and O isotopes (Buchwald and Casciotti, 2010). Because of these inverse isotope effects, when nitrite oxidation is active, the δ15NNO2 and δ18ONO2 values are expected to be lower than the NO−2 initially produced by ammonia oxidation or nitrate reduction. As discussed below, this appears to occur in both primary and secondary nitrite maxima (Casciotti, 2009; Buchwald and Casciotti, unpublished). In most parts of the ocean, however, NO−2 does not accumulate and the isotope effects associated with nitrite oxidation can only be expressed through a branch point (Figure 3). Isotopic separation can occur at a branch point because there is more than one fate for NO−2 (e.g., NO−2 is either oxidized to NO−3 or assimilated into particulate N, PN) and the heavy isotope can be preferentially shunted in one direction vs. the other. This is analogous to the branch point that has been described during the oxidation or assimilation of ammonium (Sigman et al., 2005; Wankel et al., 2007; DiFiore et al., 2009). The equations that describe the steady state N isotopic partitioning between NO−2 and NO−3 when nitrite oxidation and assimilation occur concurrently are:
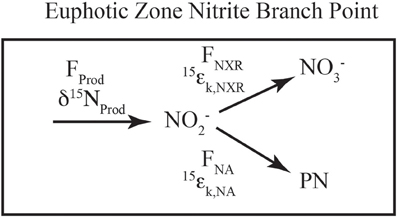
Figure 3. Schematic of euphotic zone nitrite branch point. A schematic of the fluxes and isotope effects involved with NO−2 consumption in the euphotic zone. NO−2 is produced (Fprod, δ15Nprod) from ammonia oxidation and/or nitrate reduction, the mixture of which sets the incoming flux and δ15N value. NO−2 consumption can occur through nitrite oxidation (FNXR, 15εk,NXR) or nitrite assimilation by phytoplankton (FNA, 15εk,NA). The relative rates of uptake vs. oxidation dictate the partitioning between NO−2 and NO−3 relative to the source(s) of NO−2.
where fNA and fNXR are the fractions of NO−2 consumed by assimilation and oxidation, respectively, and 15εk,NA and 15εk,NXR are the respective isotope effects. In general, nitrite oxidation will transfer NO−2 with an elevated 15N:14N ratio to the NO−3 pool, while nitrite assimilation transfers the residual NO−2 with a lower 15N:14N ratio into the PN pool. If 15εk,NA is 1‰ (Waser et al., 1998), 15εk,NXR is −15‰ (Buchwald and Casciotti, 2010), δ15NNO2 at steady state will be lower than the source of NO−2, unless nitrite assimilation is >95% of the NO−2 sink. This has the opposite sense of the ammonia oxidation/assimilation branching where ammonia oxidation transfers low 15N:14N material into the NO−2 and NO−3 pools and higher 15N:14N material into the PN pool.
When nitrite oxidation is tightly coupled to ammonia oxidation and NO−2 does not accumulate, the δ18O value of the NO−3 produced primarily reflects the δ18O values of the O atom sources (H2O and O2; Kumar et al., 1983) and the incorporation isotope effects for ammonia and nitrite oxidation (Buchwald et al., 2012). The oxygen isotope systematics of nitrite oxidation can be described by Equation 4, while the full oxygen isotope systematics of nitrification starting from NH+4, assuming no biologically-catalyzed oxygen atom exchange during nitrite oxidation (xNO = 0; DiSpirito and Hooper, 1986; Friedman et al., 1986; Buchwald and Casciotti, 2010), is described by Equation 5.
Equation 5 indicates that the δ18ONO3 produced by tightly-coupled ammonia and nitrite oxidation should reflect variations in both δ18OO2 and δ18OH2O in a ratio of 1 to 2, with slight modification of this stoichiometry by biologically-catalyzed oxygen atom exchange during ammonia oxidation (Casciotti et al., 2010; Buchwald et al., 2012). As discussed below, when ammonia and nitrite oxidation are not tightly coupled, abiotic equilibration can affect δ18ONO2 and the final δ18ONO3 produced. Regardless of whether NO−2 accumulates, isotopic fractionation during oxygen atom incorporation should lead to an isotopic offset between the substrates (O2 and H2O) and the produced NO−3. The expected δ18ONO3 value produced in oxygenated seawater with little exchange is −1‰ to +1‰ (similar to δ18OH2O), resulting from a complex series of fractionation factors rather than the unfractionated incorporation of and exchange with H2O (Buchwald et al., 2012).
Abiotic Equilibration of Oxygen Atoms in Nitrite
As introduced above, abiotic equilibration of oxygen atoms between NO−2 and H2O is likely to play a role in setting δ18ONO2 and δ18ONO3 values observed in the ocean. This process does not change the concentration of NO−2 nor it's δ15N value, only its δ18O value. Oxygen atom equilibration shifts a δ18ONO2 value from its biological starting point or “end member,” set by the isotopic systematics for biological production and consumption, toward the equilibrated δ18ONO2 value, dictated by ambient δ18OH2O and the equilibrium isotope effect for the exchange (18εeq), which is dependent on temperature (McIlvin and Casciotti, 2006; Buchwald and Casciotti, unpublished). The relevance of abiotic exchange depends on the rates of biological turnover of nitrite relative to the rate of oxygen atom exchange with water. Where nitrite turns over quickly and does not accumulate, there is little opportunity for abiotic exchange to occur. Where nitrite turns over more slowly (several weeks-months), abiotic exchange can play an important role in δ18ONO2 and δ18ONO3 (Buchwald et al., 2012).
The tendency of NO−2 to exchange oxygen atoms abiotically with H2O at typical seawater pH and temperature conditions suggests a utility of NO−2 oxygen isotopes as a tracer for determining the rate of biological turnover of NO−2 (Buchwald and Casciotti, unpublished). This provides a unique approach to determining rates of biological processes based on static isotope measurements, without bottle incubation and associated perturbations of the system. Applications such as this move us from laboratory studies of isotope effects to a deeper understanding of the cycling of N in the environment. There are many additional examples of how knowledge of the isotope effects for nitrification has enabled advances in our understanding of the marine N cycle, and we highlight a few below.
Implications for Understanding N Cycling in Oxygen Deficient Zones
As mentioned above, processes that occur in ODZs are important for the marine N budget. Both denitrification and anammox can occur in these regions, producing N2 gas from dissolved inorganic nitrogen (DIN) compounds thereby removing them from the nutrient inventory. The magnitudes of these fluxes have been estimated in many different ways: through isotope tracer experiments (Kuypers et al., 2005; Thamdrup et al., 2006; Hamersley et al., 2007; Lam et al., 2009; Ward et al., 2009; Bulow et al., 2010; Jensen et al., 2011), as well as geochemical techniques based on NO−3 deficit calculations (Cline and Richards, 1972; Naqvi et al., 1982; Codispoti and Christensen, 1985; Naqvi and Sen Gupta, 1985; Gruber and Sarmiento, 1997; Deutsch et al., 2001) and biogenic N2 production (Devol et al., 2006; Chang et al., 2010). The 15N experiments in particular showcase a complex series of interacting processes cycling N in and around ODZs that can vary sporadically in space and time. What controls the overall rate of N2 production is not known with certainty, although it is most likely tied directly or indirectly to organic carbon supply (Ward et al., 2008). Natural abundance stable isotopes provide an integrative longer-term view of the average rates of the major fluxes of N that can be used to complement short-term incubation studies. For example, natural abundance δ15NNO3 and δ18ONO3 measurements have been used to estimate the relative rates of N cycle processes such as N fixation and denitrification (Brandes et al., 1998; Sigman et al., 2005).
Another aspect of N cycling in ODZs that is of great interest is the fate of NO−2 that is produced in ODZs. Once produced, NO−2 can be consumed through oxidation, regenerating NO−3, or reduction to N2 and loss from the nutrient inventory. Since nitrite oxidation is believed to be an oxygen requiring process, the fate of NO−2 in the oxygen deficient zone has generally been assumed to be through nitrite reduction. However, it has been shown though a variety of approaches that NO−2 can also be oxidized to NO−3 in and around ODZs. For example, early 1-D modeling studies suggested that a large fraction of NO−2 produced by nitrate reduction is reoxidized to NO−3, likely on the fringes of the oxygen deficient zone (Anderson et al., 1982). More recent nutrient profile modeling suggests that NO−2 could be oxidized to NO−3 within the oxygen deficient zone itself (Lam et al., 2011). Furthermore, direct evidence for NO−2 oxidation to NO−3 within the ODZ comes from short-term 15N incubation experiments (Lipschultz et al., 1990; Füssel et al., 2012).
The importance of nitrite oxidation as a sink of NO−2 in and around ODZs is supported by natural abundance isotope measurements of NO−3 and NO−2, which integrate over longer periods. Sigman et al. (2005) and Casciotti and McIlvin (2007) found that nitrite oxidation could be an important sink for NO−2 at the top of the SNM based on δ15NNO3 and δ18ONO3 measurements. Casciotti (2009) also showed the need for nitrite oxidation to explain the large δ15N differences between NO−3 and NO−2 (Δδ15N = δ15NNO3 − δ15NNO2) observed within ODZs (Casciotti and McIlvin, 2007). Although the isotope effect for NO−3 reduction to NO−2 is approximately 25‰ (Brandes et al., 1998; Voss et al., 2001), Δδ15N values within the SNM ranged from 25‰ to 40‰ (Casciotti and McIlvin, 2007). At steady state, Δδ15N is given by equation 6:
where FNAR, FNXR, and FNIR are the fluxes from nitrate reduction, nitrite oxidation, and nitrite reduction, respectively, and 15εk,NAR, 15εk,NXR, and 15εk,NIR are the respective N isotope effects. At steady state, the large Δδ15N values cannot be explained by reductive processes alone since nitrite reduction would be expected to increase δ15NNO2, thereby decreasing Δδ15N below 25‰. The only known mechanism for increasing Δδ15N above 25‰ is through NO−2 consumption with an inverse kinetic isotope effect, such as observed in nitrite oxidation (Casciotti, 2009; Buchwald and Casciotti, 2010). If all NO−2 consumption occurs through oxidation (FNXR/FNAR = 1) with a kinetic isotope effect of −15‰, then Δδ15N at steady state should approach 40‰. If all NO−2 consumption occurs through nitrite reduction (FNXR/FNAR = 0) with a kinetic isotope effect of +15‰, then Δδ15N would be expected to approach 10‰ at steady state. The δ15N difference between NO−3 and NO−2 may therefore be diagnostic of NO−2 sinks in ODZs (Casciotti, 2009).
While nitrite oxidation is generally considered to be an oxygen requiring process, O2 is not required as an enzymatic substrate for nitrite oxidation. Rather, O2 is used as an electron acceptor to support the oxidation of NO−2 to NO−3. Therefore, if an alternative electron acceptor could be substituted, nitrite oxidation may proceed in the absence of O2. The alternate electron acceptors that can be used by NOB for nitrite oxidation remain to be determined, but oxidation of NO−2 by species such as iodate (IO−3), Fe(III), and Mn(IV) would be thermodynamically feasible. Moreover, as mentioned above, there is independent evidence based on 15N incubations for nitrite oxidation occurring within the ODZs in the ETSP (Lipschultz et al., 1990) and Namibian upwelling (Füssel et al., 2012). The presence of nitrite oxidizing bacteria from the genera Nitrospina and Nitrococcus comprising up to 9% of the microbial community in the Namibian upwelling (Füssel et al., 2012) also gives strong support to their success even in low oxygen environments.
Of course, even if nitrite oxidation is occurring in ODZs, more than one process may contribute, as both bacterial nitrite oxidizers and anammox bacteria can oxidize NO−2 to NO−3. The contribution of anammox to nitrite oxidation can be estimated by comparison of FNXR/FNIR required to explain the isotopic data with that observed during anammox (0.26:1.06; Strous et al., 2006). This ratio places an upper limit on the amount of nitrite oxidation that could be catalyzed by anammox. If the ratio of nitrite oxidation to nitrite reduction necessary to explain observed Δδ15N values is greater than this, then contributions from bacterial nitrite oxidation would be inferred (Casciotti, 2009). If the ratio of nitrite oxidation to nitrite reduction required to explain the isotopic data is less than this, then nitrite oxidation could potentially all be catalyzed by anammox, although denitrification may be required to explain the additional nitrite reduction. This analysis thus provides a new constraint on the relative rates of anammox and denitrification, integrated over long time periods. However, it assumes that the isotope effects for anammox are similar to denitrification for nitrite reduction and similar to nitrite oxidation for that step. Thus, the approach can be refined with additional information about the isotopic systematics of anammox.
Implications for Understanding NO−3 Cycling and Budgets: Δ(15, 18) Revisited
Knowing the isotopic systematics of nitrification is critical for interpreting δ18ONO3, δ18ONO2, and δ18ON2O measurements from the ocean. The culture studies described above have advanced our understanding of the oxygen isotope systematics of nitrification; however, there are also constraints from field data (Casciotti et al., 2002; Sigman et al., 2009). Casciotti et al. (2002) used the nitrate δ18O data to put the first constraints on the δ18O value of NO−3 produced in the ocean. These estimates showed that NO−3 is most likely produced with δ18O values close to those of seawater (0‰) and were used by Sigman et al. (2005) to constrain the rates of N2 fixation and nitrite reoxidation from δ15NNO3 to δ18ONO3 data. In order to do this, Sigman et al. (2005) introduced a NO−3 isotope anomaly based on expected enrichments of δ15NNO3 and δ18ONO3 due to nitrate assimilation or nitrate reduction during denitrification:
where δ15NNO3 and δ18ONO3 are the measured isotopic values of the sample, δ15NNO3,deep and δ18ONO3,deep are the isotopic values of unaltered deep seawater, which define the starting point for fractionation. 18εk,NAR and 15εk,NAR are the isotope effects for O and N isotopes, respectively, during nitrate reduction. While there is a wide range in the absolute values of 18εk,NAR and 15εk,NAR, their ratio is very close to 1 (Granger et al., 2004, 2008, 2010). Therefore, NO−3 consuming processes generally lead to δ15NNO3 and δ18ONO3 values that fall along a 1:1 line and produce samples with Δ(15, 18) = 0‰ (Figure 4). Non-zero Δ(15, 18) values correspond to an enrichment of δ18ONO3 relative to δ15NNO3, or a depletion in δ15NNO3 relative to δ18ONO3, generally arising from production of NO−3 with anomalous isotopic signatures. The most likely cause for depletion in δ15N, especially in the nitracline of oligogrophic ocean provinces, is through remineralization of newly fixed N with a δ15N value near −1‰ (Capone et al., 1997; Karl et al., 1997; Meador et al., 2007). The particulate organic N produced by N fixation is remineralized to NO−3 in the subsurface, gaining O atoms from nitrification, the same process that sets the oxygen isotopic signature of NO−3 produced from other N sources. In scenario, the magnitude of Δ(15, 18) would be proportional to the N fixation flux (Sigman et al., 2005).
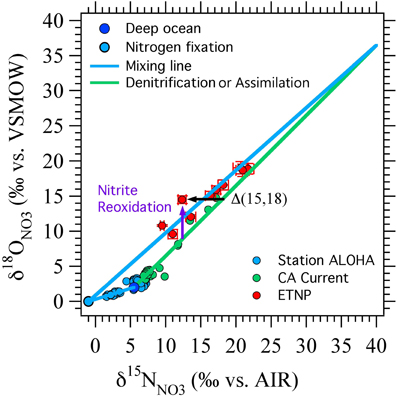
Figure 4. Δ(15, 18) as originally devised. A schematic showing the effects of nitrate reduction, assimilation, and input of NO−3 from nitrogen fixation linked to nitrification on δ15NNO3, δ18ONO3, and the nitrate isotope anomaly, Δ(15, 18) (black arrow). Deep ocean nitrate (dark blue circle) starts with δ15NNO3 of 5‰ and δ18ONO3 of 2‰. Nitrate assimilation and denitrification increase δ15N and δ18O in a 1:1 ratio ((Granger et al., 2004, 2008, 2010); green line). Remineralization of newly fixed N is assumed to add NO−3 with δ15NNO3 of −1‰ and δ18ONO3 of 0‰ (light blue circle, blue mixing lines). Nitrite reoxidation is expected to generally increase δ18ONO3 relative to δ15NNO3 because of the oxygen isotope systematics of nitrate reduction and nitrite oxidation (purple arrow). Data from station ALOHA (Casciotti et al., 2008), California Current (Santoro et al., 2010) and ETNP (Casciotti and McIlvin, 2007) are shown for comparison.
A relative enrichment in 18O, especially in the vicinity of oceanic ODZs, could represent the cycling of NO−3 through the reduction/reoxidation cycle, where the NO−3 consumed by denitrification has a similar δ15NNO3 but a lower δ18ONO3 value than that returned to the NO−3 pool from nitrite oxidation (Sigman et al., 2005). This formulation was successful at simulating data from regions of the ETNP where NO−2 did not accumulate (Sigman et al., 2005) and where NO−2 goes to zero at the top of the SNM (Casciotti and McIlvin, 2007). However, where NO−2 accumulates, its isotopic composition can vary dramatically within the oxygen deficient zone itself (Casciotti and McIlvin, 2007), and an interpretation including NO−2 isotope constraints is needed. The relationship between 18O enrichment in NO−3 and the magnitude of the nitrite reoxidation flux depends critically on the N and O isotope systematics of nitrite oxidation, which we reviewed above. Here we revisit the implications of this new knowledge for interpretations of Δ(15, 18) in euphotic zone and oxygen deficient zones.
Using a simple time-dependent 1-box model of the ODZ N cycle, we have reevaluated the impact of nitrite reoxdiation on δ15NNO3 and δ18ONO3 in a hypothetical ODZ (Figure 5) and show that nitrite oxidation can either raise or lower Δ(15, 18), depending on the relative δ15N and δ18O values of NO−2 and NO−3. Our model focuses on determining the relative rates of NO−2 reoxidation to NO−3 (FNXR) and reduction (to NO or NH+4; FNIR) from NO−3 and NO−2 isotopic data. The oxidative flux is assumed to have the N and O isotopic systematics of bacterial nitrite oxidation (Buchwald and Casciotti, 2010; Table 1), regardless of whether it is carried out by bacterial nitrite oxidizers or anammox bacteria, or some mixture of the two. The reductive processes are assumed to have 15ε = 18ε = 15‰ (Table 1) regardless of whether NO−2 is reduced to N2 (via anammox or denitrification) or NH+4 [via denitrification to ammonium (DNRA)]. Unfortunately, very little information is currently available on the N isotope effects for nitrite reduction by these processes (Bryan et al., 1983) and no information is available for the O isotope effects. In the absence of more specific information, we make the simplifying assumption that the different nitrite reductase enzymes have similar N and O isotope effects. Clearly, this is an important area of future research.
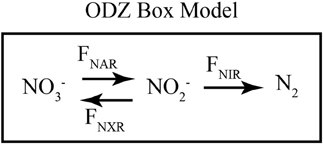
Figure 5. Schematic of ODZ box model. A schematic of the fluxes included in the time-dependent 1-box ODZ model. NO−3 is reduced to NO−2 through nitrate reduction (FNAR). NO−2 can be consumed either through dissimilatory nitrite reduction (FNIR) or nitrite oxidation (FNXR). The rates of these processes are assumed to be first order in NO−3 or NO−2, respectively, and isotope effects control the relative reaction of heavy and light isotopes. Table 1 gives the values of the parameters used in the model.
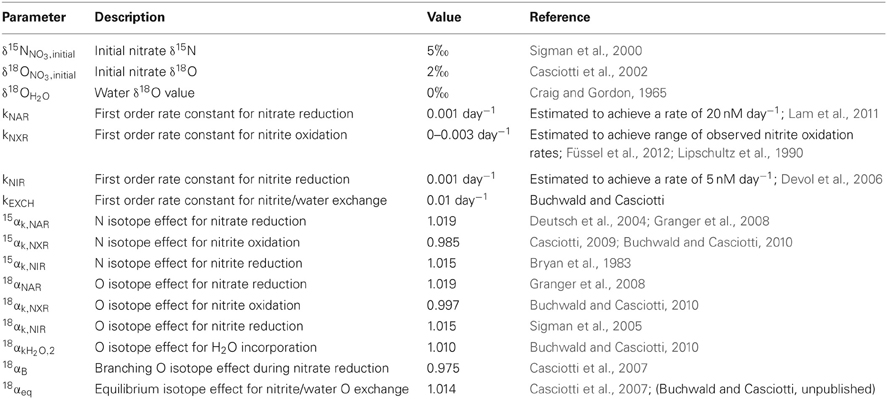
Table 1. Parameters used in oxygen deficient zone box model.
In our model, the processes are all represented as first order, and the rate constants (k's) are given in units of day−1 to match measured rates of nitrate reduction, nitrite reduction, and nitrite oxidation in ODZs (Table 1). The isotope effects taken from the literature are also given in Table 1. We vary the relative rates of nitrite oxidation and nitrite reduction (FNXR/FNIR) between 0 and 3 (FNXR representing 0–75% of NO−2 consumption) and the rate constant for exchange (kEXCH) between 0 and 1 day−1 to evaluate the effects of changes in these parameters on simulated δ15NNO3 and δ18ONO3 (Figure 6). Maximum rate constants of exchange between NO−2 and H2O of 1 day−1 appear reasonable based on recent laboratory studies (Casciotti et al., 2007; Buchwald and Casciotti, unpublished). As FNXR/FNIR increases from 0 to 3, the amount of NO−3 retained in the system increases despite an unchanging rate constant for nitrate reduction. In fact, because the reaction is taken as first order, the higher concentrations of NO−3 brought about by higher levels of FNXR lead to higher overall rates of nitrate reduction. However, it is clear from the mass balances in the different scenarios that nitrite reoxidation helps buffer against excessive loss of NO−3, accumulation of NO−2, and production of N2 (Figures 6A–D), and may help explain why NO−3 is never fully removed in oceanic ODZs.
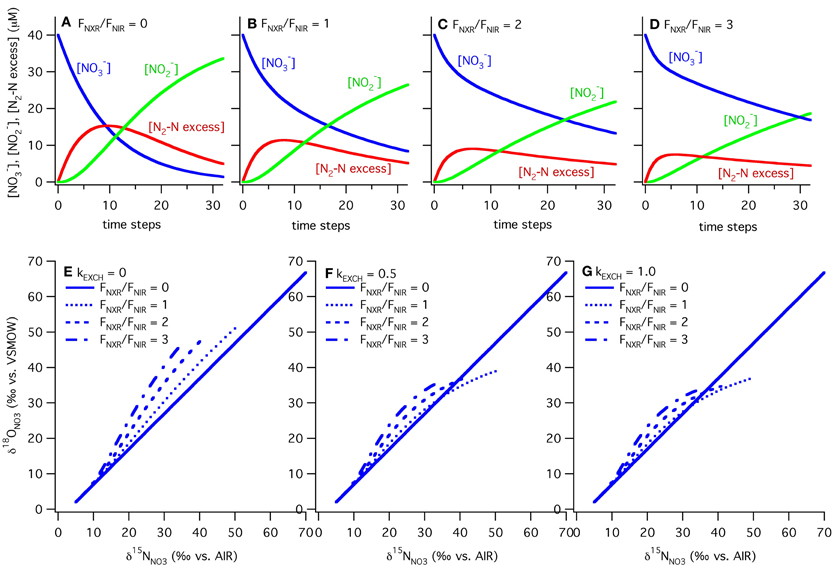
Figure 6. Results of ODZ model for varying ratios of nitrite oxidation to nitrite reduction and rates of exchange. Results from the ODZ box model at different relative rates of nitrite oxidation and nitrite reduction (FNXR/FNIR), ranging from 0 to 3. Mass balance is maintained in the model between NO−3, NO−2 and excess N2-N with FNXR/FNIR = 0 (panel A), 1 (panel B), 2 (panel C) and 3 (panel D). NO−2 accumulation and N2 production decrease as FNXR increases. The ODZ box model shows that NO−2 cycling can generate both positive and negative Δ(15, 18) values, depending on the extent of NO−3 consumption (increasing δ15N, δ18O values), the relative rates of nitrite oxidation and reduction (FNXR/FNIR), and the rate of oxygen atom exchange between NO−2 and H2O (kEXCH). In each case the slope of δ18ONO3 vs. δ15NNO3 is equal to 1 when FNXR = 0. As FNXR/FNIR increases, the magnitude of the Δ(15, 18) anomaly increases at a given δ15N value. As NO−2/H2O exchange increases (=0 in panel E, 0.5 in panel F, and 1.0 in panel G), the non-zero levels of nitrite oxidation generate positive Δ(15, 18) values, most likely due to the relative δ18O values of NO−3 produced and consumed under these scenarios. All parameters used in the model are reported in Table 1.
The magnitude of nitrite oxidation also affects the δ15NNO3 and δ18ONO3 patterns. When FNXR/FNIR = 0, the δ15NNO3 and δ18ONO3 data fall along the 1:1 line prescribed by the isotope effects for nitrate reduction (Figures 6E–G). As FNXR/FNIR increases, increasingly negative Δ(15, 18) values are produced. The strength of this effect is also dependent on the rate of abiotic NO−2/H2O exchange, with higher exchange rates partly diluting this effect and actually leading to positive Δ(15, 18) values at high extents of NO−3 consumption (the highest δ15NNO3 values; Figure 6). This interesting phenomenon is most likely due to reversal of the impact of nitrite reoxidation on δ18ONO3 at high δ18ONO3 values, with nitrite oxidation returning NO−3 with a lower δ18ONO3 value than that removed by nitrite reduction. This would be exacerbated at high rates of exchange, which helps to maintain δ18ONO2 values at a constant level regardless of δ18ONO3. Tuning the model to match observed δ18ONO2 data requires a high rate of exchange relative to biological fluxes, and therefore most closely follows the kEXCH = 1 scenario.
Larger ratios of FNXR/FNIR could be imagined, but the model results from such simulations produce unrealistic Δ(15, 18) anomalies at a given δ15NNO3 value. Furthermore, because excess N2 does accumulate in ODZs, we know that some NO−2 is ultimately reduced to N2. Indeed, we could potentially use the stoichiometry of N2 production in ODZs to interrogate the importance of nitrite oxidation. If nitrite oxidation is not important, the standard stoichiometry (Richards, 1965; Devol et al., 2006) of 106 CO2: 55.2 N2 would be expected, whereas higher amounts of CO2 would be expected if a significant fraction of the produced NO−2 is reoxidized to NO−3. This may seem counterintuitive because autotrophic nitrite oxidation should fix CO2 back into organic matter, but the excess NO−3 reduction required to supply the NO−2 in the first place should far outweigh the CO2 fixed by nitrite oxidation.
It is interesting to note that the two scenarios for producing negative Δ(15, 18) values (N2 fixation and nitrite reoxidation) are each more effective at different points in NO−3 isotope space (Figure 7). N2 fixation is most effective at generating negative Δ(15, 18) signals at δ15NNO3 and δ18ONO3 values less than 10‰, near the base of the euphotic zone. In contrast, nitrite reoxidation is most effective at generating negative Δ(15, 18) signals at intermediate δ15NNO3 and δ18ONO3 values and extents of NO−3 consumption by denitrification, where N2 fixation has relatively little effect on the Δ(15, 18). Therefore, we may be able to distinguish between the processes responsible for Δ(15, 18) generation by where the anomaly lies in δ15NNO3 vs. δ18ONO3 space, as well as from other water column indicators. For example, using a steady state model, Casciotti and McIlvin (2007) showed that the NO−3 isotope anomaly at the top of the SNM could not be generated by N2 fixation alone and was consistent with oxidation of NO−2 leaking out of the top of the SNM. However, they suggested that a combination of N2 fixation and nitrite reoxidation may best fit the observations. This conclusion is echoed here where it is difficult to generate large Δ(15, 18) signals at these δ15NNO3 and δ18ONO3 values through either N2 fixation or nitrite reoxidation alone (Figure 7).
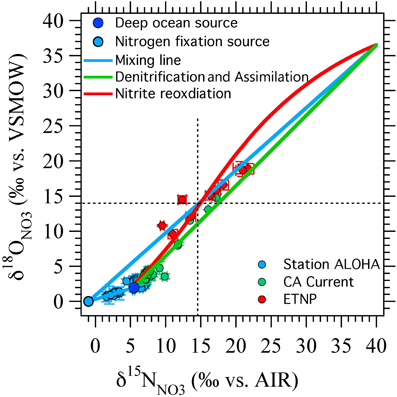
Figure 7. Results from ODZ model compared against published data. Nitrogen fixation (blue circle and blue lines) is efficient at generating negative Δ(15, 18) values at the lower range of δ15NNO3 and δ18ONO3 values, while nitrite reoxidation (red line) has a stronger effect at higher δ15NNO3 and δ18ONO3 values. The nitrite reoxidation curve shown here was generated from the box model with kEXCH = 0.5 and FNXR/FNIR = 2 (Figure 6F, dashed line). Data from station ALOHA (Casciotti et al., 2008) in the north Pacific subtropical gyre is well explained by an input from N2 fixation. Data from the California Current (Santoro et al., 2010) falls close to the 1:1 line suggesting little influence of nitrogen fixation or nitrite oxidation in the euphotic zone. Most of the data from the ETNP (Casciotti and McIlvin, 2007) could be explained by either nitrite reoxiation or nitrogen fixation, but two points (which fall in the shallow oxycline at the top of the SNM) require inputs from both nitrite reoxidation and nitrogen fixation.
In addition to oxygen deficient zone and near-surface processes, NO−3 isotopes have also been used to examine the global ocean cycle and budget of NO−3 in the ocean interior (Sigman et al., 2009). This was done using an 18-box model of the global ocean where the implications of different assumptions about the oxygen isotopic systematics of nitrification could be tested. Their model was also used to constrain the relative rates of the internal N cycle (NO−3 uptake, export, and nitrification) and N budget processes (N2 fixation and denitrification) and the ratio of low latitude productivity, where nutrient consumption goes to completion, to high latitude productivity, where nutrient uptake is incomplete. By comparing model results to δ15NNO3 and δ18ONO3 data from a variety of oceanographic profiles representing the major ocean basins, the impacts of partial NO−3 assimilation in polar regions on the N and O isotopes of NO−3 in the ocean interior, and of low latitude productivity on the 18O enrichment in preformed NO−3 was diagnosed. N budget processes (N2 fixation and denitrification) led to variations in subsurface δ15NNO3 and δ18ONO3, but in their absence, the large scale steady state δ18O value of subsurface NO−3 was set by nitrate assimilation in polar regions. Nitrate uptake in the southern ocean leads to heavy isotope enrichment in preformed NO−3, while nitrate assimilation in low latitudes removes the δ18O signal of the preformed NO−3 and replaces it with the nitrification signal (Sigman et al., 2009). Overall, when only internal processes were active in the model, the mean ocean δ18ONO3 value was 1.1‰ higher than the nitrification source. When the N budget was added to the model, the mean ocean δ18ONO3 value was 2.4‰ higher than the nitrification source value. This analysis provides additional constraints on the δ18O value of newly produced NO−3 in the ocean to fall between −1‰ and +1‰ (Sigman et al., 2009), which is consistent with culture studies that illustrate how these values are controlled biochemically (Buchwald et al., 2012).
Nitrogen Cycling in the Euphotic Zone
Several studies have now used N and O isotope ratio measurements to study the relative rates of N cycling in the euphotic zone. In particular, knowledge of the isotopic systematics of nitrate uptake (Granger et al., 2004, 2010) and nitrification (Buchwald and Casciotti, 2010; Casciotti et al., 2010, 2011; Buchwald et al., 2012) enables the assessment of the relative rates of nitrification and nitrate uptake from euphotic zone NO−3 isotope data.
Wankel et al. (2007) used a steady-state box model to interpret the amount of nitrification contributing to nitrate uptake by phytoplankton in Monterey Bay, CA using δ15NNO3 and δ18ONO3 variations. Assuming that nitrate assimilation leads to equivalent fractionation of N and O isotopes (Granger et al., 2004), and that δ18Ontr = 2.9‰, they estimated that nitrification could supply up to 30% of NO−3 assimilated by phytoplankton in Monterey Bay, consistent with intensive isotope tracer incubation studies (Ward, 2005). Because δ18Ontr was uncertain at that time, they performed sensitivity studies to address the impact of different δ18Ontr values on their interpretation. We now believe that δ18Ontr is between −1‰ and +1‰ (Buchwald et al., 2012), and applying this to the model from Wankel et al. (2007), leads to a smaller increase in δ18ONO3 for the same amount of nitrification. Thus, to achieve the same δ18ONO3 enrichment in their model requires more nitrification than originally estimated.
DiFiore and colleagues (2009) estimated the amount of nitrification contributing to nitrate uptake in the euphotic zone of the Polar Antarctic Zone using a time-dependent 1-box model. Like Wankel et al. (2007), they assumed that 18εNR = 15εNR for nitrate uptake and allowed branching of NH+4 (and NO−2) between nitrification and assimilation to partition isotopes between the NO−3 and particulate N pools. One important difference from the Wankel et al. (2007) model is that they assumed δ18Ontr = +1.1‰ based on more recent constraints on this value (Sigman et al., 2009). They inferred that δ15NNO3 should be lowered slightly due to nitrification (offsetting the isotopic fractionation during uptake) and δ18ONO3 should be raised (because the δ18O of newly produced NO−3 was higher than that removed). Both of these factors should lead to negative Δ(15, 18) values, as discussed above, but they found that nitrification had a relatively small impact on δ15NNO3 and δ18ONO3 values in the Polar Antarctic Zone. They concluded that in the Polar Antarctic Zone less than 1% of NO−3 assimilated by phytoplankton is likely to have been produced by nitrification in the euphotic zone (DiFiore et al., 2009). This is consistent with other estimates from the southern ocean (Olson, 1981b; Bianchi et al., 1997; Law and Ling, 2001) and quite a bit lower than other regions (Yool et al., 2007; Wankel et al., 2007; Clark et al., 2008). This elegant study provides an excellent example of how NO−3 isotopes can be used to constrain N cycle processes in an appropriate model framework.
NO−3 and NO−2 isotopes have also been used to understand the sources and cycling of NO−2 in the PNM at the base of the euphotic zone. Mackey et al. (2011) used natural abundance NO−3 + NO−2 isotope data and isotope tracer experiments to determine the sources of NO−2 to the PNM in the Gulf of Aqaba. They found active nutrient regeneration and nitrification throughout the water column. In the transition from well mixed to stratified conditions, NO−2 was generated by incomplete NO−3 reduction by light-limited phytoplankton creating a broad band of NO−2. After stratification was established, NO−2 generation by ammonia oxidation contributed to maintenance of the PNM. In both cases, NO−2 was consumed by nitrite oxidation below the PNM. Once again, nitrification was interpreted to play an important role in NO−3 isotope dynamics in the upper water column where increases in δ18ONO3 were much higher than increases in δ15NNO3.
In another recent study of PNM dynamics, natural abundance δ18ONO2 and δ15NNO2 values were used to infer the sources and average age of NO−2 in the PNM of the Arabian Sea (Buchwald and Casciotti, unpublished). Because the δ15NNO2 and δ18ONO2 values produced from ammonia oxidation and nitrate reduction are distinct, the sources can be readily distinguished. Based on natural abundance δ15NNO2 and δ18ONO2 data, ammonia oxidation was inferred to be the main source of NO−2 to the PNM in the Arabian Sea.
Implications for Interpreting N2O Sources
Uncertainty in the isotopic composition of N2O produced during ammonia oxidation has hampered the interpretation of near-surface N2O production rates and fluxes using two-component end member models (Dore et al., 1998; Popp et al., 2002; Santoro et al., 2010). Better understanding of the oxygen isotopic systematics of nitrification can provide further insight into outstanding questions in N2O oxygen isotope variations, such as why δ18ON2O in seawater is so high (Ostrom et al., 2000; Popp et al., 2002), what mechanisms of N2O production operate in oxyclines surrounding oceanic ODZs (Codispoti and Christensen, 1985), and what the mechanisms and controls on N2O production are in the near-surface ocean (Dore et al., 1998; Popp et al., 2002; Santoro et al., 2011).
For example, N2O production in the near-surface ocean is largely believed to be the result of nitrification. However, the isotopic composition of N2O in the near surface and the inferred near surface source (Dore et al., 1998) have higher δ15N and δ18O values than are characterized by bacterial ammonia oxidation (Yoshida, 1988; Frame and Casciotti, 2010). Recent evidence suggests that AOA are important for nitrification in such environments (Wuchter et al., 2006; Beman et al., 2008; Mincer et al., 2007; Church et al., 2010; Santoro et al., 2010) and that they produce N2O with bulk δ15N and δ18O values similar to the near-surface source (Santoro et al., 2011). These data support a role for them in near-surface N2O production. As discussed above, the mechanisms of N2O production by AOA are currently unknown, and more work is needed to characterize the N2O production and isotopic composition of marine AOA under a variety of growth conditions. For example, the SP of N2O produced by AOB varies widely with dissolved oxygen levels (Frame and Casciotti, 2010) but so far the isotopic composition of N2O produced by AOA has only been examined under aerobic growth conditions (Santoro et al., 2011; Loescher et al., 2012). Therefore, we do not know whether they are capable of producing N2O with a SP similar to near surface N2O (Popp et al., 2002).
Concluding Remarks
Understanding the nitrogen and oxygen isotopic systematics of nitrification can contribute greatly to our understanding of nitrogen cycling in the ocean, as nitrification is involved with transformations between the major pools of DIN (NH+4, NO−2, NO−3, and N2O). Both ammonia and nitrite oxidation are involved with large and distinctive isotope effects, leading to predictable patterns in the isotope ratios of compounds that they transform. The discovery of AOA and their importance in ocean biogeochemistry necessitates renewed study of the isotopic systematics of nitrification. In preliminary studies, the isotopic systematics of AOA appear similar to AOB for N isotope fractionation and O atom incorporation into NO−2 (Santoro and Casciotti, 2011; Santoro et al., 2011). However, the production of N2O and the isotopic systematics of this process need to be further investigated.
Conflict of Interest Statement
The authors declare that the research was conducted in the absence of any commercial or financial relationships that could be construed as a potential conflict of interest.
Acknowledgments
We would like to acknowledge the pioneering work of those cited in this review. We have attempted to integrate studies of many authors using various approaches to understand the importance of nitrification in the marine environment, with a focus on the use of natural abundance stable isotope measurements. We thank two anonymous reviewers for their suggestions on an earlier draft of this manuscript. Funding for this work has been provided by NSF/OCE ETSP grants 05-26277, 07-48674, and 11-40404 to Karen L. Casciotti.
References
Anderson, J. J., Okubo, A., Robins, A. S., and Richards, F. A. (1982). A model for nitrite and nitrate distributions in oceanic oxygen minimum zones. Deep Sea Res. 29, 1113–1140.
Andersson, K. K., and Hooper, A. B. (1983). O2 and H2O are each the source of one O in NO−2 produced from NH3 by Nitrosomonas: 15N-NMR evidence. FEBS Lett. 164, 236–240.
Andersson, K. K., Philson, S. B., and Hooper, A. B. (1982). 18O isotope shift in 15N NMR analysis of biological N-oxidations: H2O-NO−2 exchange in the ammonia-oxidizing bacterium Nitrosomonas. Proc. Natl. Acad. Sci. U.S.A. 79, 5871–5875.
Barford, C. C., Montoya, J. P., Altabet, M. A., and Mitchell, R. (1999). Steady-state nitrogen isotope effects of N2 and N2O production in Paracoccus denitrificans. Appl. Environ. Microbiol. 65, 989–994.
Beman, J. M., Popp, B. N., and Francis, C. A. (2008). Molecular and biogeochemical evidence for ammonia oxidation by marine Crenarchaeota in the Gulf of California. ISME J. 2, 429–441.
Bianchi, M., Feliatra, F., Treguer, P., Vincendeau, M.-A., and Morvan, J. (1997). Nitrification rates, ammonium and nitrate distribution in upper layers of the water column and in sediments of the Indian sector of the Southern Ocean. Deep Sea Res. Part II Top. Stud. Oceanogr. 44, 1017–1032.
Bock, E., Koops, H.-P., and Harms, H. (1989). “Nitrifying bacteria,” in Autotrophic Bacteria, eds H. G. Schelgel and B. Bowien (Berlin: Springer-Verlag), 81–96.
Brandes, J. A., Devol, A. H., Yoshinari, T., Jayakumar, D. A., and Naqvi, S. W. A. (1998). Isotopic composition of nitrate in the central Arabian sea and eastern tropical North Pacific: a tracer for mixing and nitrogen cycles. Limnol. Oceanogr. 43, 1680–1689.
Brandhorst, W. (1959). Nitrification and denitrification in the Eastern Tropical North Pacific. Journal du Conseil Permanent International l'Exploration de la Mer 25, 3–20.
Bryan, B. A., Shearer, G., Skeeters, J. L., and Kohl, D. H. (1983). Variable expression of the nitrogen isotope effect associated with denitrification of nitrite. J. Biol. Chem. 258, 8613–8617.
Buchwald, C., and Casciotti, K. L. (2010). Oxygen isotopic fractionation and exchange during bacterial nitrite oxidation. Limnol. Oceanogr. 55, 1064–1074.
Buchwald, C., Santoro, A. E., McIlvin, M. R., and Casciotti, K. L. (2012). Oxygen isotopic composition of nitrate and nitrite produced by nitrifying co-cultures and natural marine assemblages. Limnol. Oceanogr. 57, 1361–1375.
Bulow, S. E., Rich, J. J., Naik, H. S., Pratihary, A. K., and Ward, B. B. (2010). Denitrification exceeds anammox as a nitrogen loss pathway in the Arabian Sea oxygen minimum zone. Deep Sea Res. Part I Oceanogr. Res. Pap. 57, 384–393.
Capone, D. G., Zehr, J. P., Paerl, H. W., Bergman, B., and Carpenter, E. J. (1997). Trichodesmium, a globally significant marine Cyanobacterium. Science 276, 1221–1229.
Casciotti, K. L. (2009). Inverse kinetic isotope fractionation during bacterial nitrite oxidation. Geochim. Cosmochim. Acta 73, 2061–2076.
Casciotti, K. L., Böhlke, J. K., McIlvin, M. R., Mroczkowski, S. J., and Hannon, J. E. (2007). Oxygen isotopes in nitrite: analysis, calibration, and equilibration. Anal. Chem. 79, 2427–2436.
Casciotti, K. L., Buchwald, C., Santoro, A. E., and Frame, C. (2011). Assessment of nitrogen and oxygen isotopic fractionation during nitrification and its expression in the marine environment. Methods Enzymol. 486, 253–280.
Casciotti, K. L., and McIlvin, M. R. (2007). Isotopic analyses of nitrate and nitrite from reference mixtures and application to Eastern Tropical North Pacific waters. Mar. Chem. 107, 184–201.
Casciotti, K. L., McIlvin, M. R., and Buchwald, C. (2010). Oxygen isotopic exchange and fractionation during bacterial ammonia oxidation. Limnol. Oceanogr. 55, 753–762.
Casciotti, K. L., Sigman, D. M., Galanter Hastings, M., Bohlke, J. K., and Hilkert, A. (2002). Measurement of the oxygen isotopic composition of nitrate in seawater and freshwater using the denitrifier method. Anal. Chem. 74, 4905–4912.
Casciotti, K. L., Sigman, D. M., and Ward, B. B. (2003). Linking diversity and stable isotope fractionation in ammonia-oxidizing bacteria. Geomicrobiol. J. 20, 335–353.
Casciotti, K. L., Trull, T. W., Glover, D. M., and Davies, D. (2008). Constraints on nitrogen cycling in the subtropical North Pacific Station ALOHA from isotopic measurements of nitrate and particulate nitrogen. Deep Sea Res. Part II Top. Stud. Oceanogr. 55, 1661–1672.
Chang, B. X., Devol, A. H., and Emerson, S. R. (2010). Denitrification and the nitrogen gas excess in the eastern tropical South Pacific oxygen deficient zone. Deep Sea Res. Part I Oceanogr. Res. Pap. 57, 1092–1101.
Church, M. J., Wal, B., Karl, D. M., and DeLong, E. F. (2010). Abundances of crenarchaeal amoA genes and transcripts in the Pacific Ocean. Environ. Microbiol. 12, 679–688.
Clark, D. R., Rees, A. P., and Joint, I. (2008). Ammonium regeneration and nitrification rates in the oligotrophic Atlantic Ocean: implications for new production estimates. Limnol. Oceanogr. 53, 52–62.
Cline, J. D., and Richards, F. A. (1972). Oxygen deficient conditions and nitrate reduction in the eastern tropical North Pacific Ocean. Limnol. Oceanogr. 17, 885–900.
Codispoti, L. A., and Christensen, J. P. (1985). Nitrification, denitrification, and nitrous oxide cycling in the eastern tropical Pacific Ocean. Mar. Chem. 16, 277–300.
Craig, H., and Gordon, L. I. (1965). “Deuterium and oxygen 18 variations in the ocean and marine atmosphere,” in Stable Isotopes in Oceanographic Studies and Paleotemperatures, ed E. Tongiogi (Spoleto, Italy), 9–130.
Croteau, P., Atlas, E. L., Schauffler, S. M., Blake, D. R., Diskin, G. S., and Boering, K. A. (2010). Effect of local and regional sources on the isotopic composition of nitrous oxide in the tropical free troposphere and tropopause layer. J. Geophys. Res. 115, D00J11.
Deutsch, C., Gruber, N., Key, R. M., Sarmiento, J. L., and Ganaschaud, A. (2001). Denitrification and N2 fixation in the Pacific Ocean. Global Biogeochem. Cycles 15, 483–506.
Deutsch, C., Sigman, D. M., Thunell, R. C., Meckler, A. N., and Haug, G. H. (2004). Isotopic constraints on glacial/interglacial changes in the oceanic nitrogen budget. Global Biogeochem. Cycles 18, GB4012.
Devol, A. H., Uhlenhopp, A. G., Naqvi, S. W. A., Brandes, J. A., Jayakumar, D. A., and Naik, H. et al. (2006). Denitrification rates and excess nitrogen gas concentrations in the Arabian Sea oxygen deficient zone. Deep Sea Res. Part I Oceanogr. Res. Pap. 53, 1533–1547.
DiFiore, P. J., Sigman, D. M., Dunbar, R. B., and Wang, Y. (2009). Upper ocean nitrogen fluxes in the Polar Antarctic zone: constraints from the nitrogen and oxygen isotopes of nitrate. Geochem. Geophys. Geosyst. 10. doi: 10.1029/2009GC002468. [Epub ahead of print].
DiSpirito, A. A., and Hooper, A. B. (1986). Oxygen exchange between nitrate molecules during nitrite oxidation by Nitrobacter. J. Biol. Chem. 261, 10534–10537.
Dore, J. E., and Karl, D. M. (1996). Nitrite distributions and dynamics at station ALOHA. Deep Sea Res. 43, 385–402.
Dore, J. E., Popp, B. N., Karl, D. M., and Sansone, F. J. (1998). A large source of atmospheric nitrous oxide from subtropical North Pacific surface waters. Nature 396, 63–66.
Dua, R. D., Bhandari, B., and Nicholas, D. J. D. (1979). Stable isotope studies on the oxidation of ammonia to hydroxylamine by Nitrosomonas europaea. FEBS Lett. 106, 401–404.
Frame, C. H., and Casciotti, K. L. (2010). Biogeochemical controls and isotopic signatures of nitrous oxide production by a marine ammonia-oxidizing bacterium. Biogeosci. Discuss. 7, 3019–3059.
Friedman, S. H., Massefski, W., and Hollocher, T. C. (1986). Catalysis of intermolecular oxygen atom transfer by nitrite dehydrogenase of Nitrobacter agilis. J. Biol. Chem. 261, 10538–10543.
Füssel, J., Lam, P., Lavik, G., Jensen, M. M., Holtappels, M., and Gunter, M. et al. (2012). Nitrite oxidation in the Namibian oxygen minimum zone. ISME J. 6, 1200–1209.
Granger, J., Sigman, D. M., Needoba, J. A., and Harrison, P. J. (2004). Coupled nitrogen and oxygen isotope fractionation of nitrate during assimilation by cultures of marine phytoplankton. Limnol. Oceanogr. 49, 1763–1773.
Granger, J., Sigman, D. M., Lehmann, M. F., and Tortell, P. D. (2008). Nitrogen and oxygen isotope fractionation during dissimilatory nitrate reduction by denitrifying bacteria. Limnol. Oceanogr. 53, 2533–2545.
Granger, J., Sigman, D. M., Rhode, M. M., Maldonado, M. T., and Tortell, P. D. (2010). N and O isotope effects during nitrate assimilation by unicellular prokaryotic and eukaryotic plankton cultures. Geochim. Cosmochim. Acta 74, 1030–1040.
Gruber, N., and Sarmiento, J. L. (1997). Global patterns of marine nitrogen fixation and denitrification. Global Biogeochem. Cycles 11, 235–266.
Guerrero, M. A., and Jones, R. D. (1996). Photoinhibition of marine nitrifying bacteria. 2. Dark recovery after monochromatic or polychromatic irradiation. Mar. Ecol. Prog. Ser. 141, 193–198.
Hamersley, M. R., Lavik, G., Woebken, D., Rattray, J. E., Lam, P., and Hopmans, E. C. et al. (2007). Anaerobic ammonium oxidation in the Peruvian oxygen minimum zone. Limnol. Oceanogr. 52, 923–933.
Hooper, A., Arciero, D., DiSpirito, A. A., Fuchs, J., Johnson, M., and LaQuier, F. et al. (1990). “Production of nitrite and N2O by the ammonia-oxidizing nitrifiers,” in Nitrogen Fixation: Achievements and Objectives, eds R. Gresshoff, Stacey, and Newton (New York, NY: Chapman and Hall), 387–391.
Jensen, M. M., Lam, P., Revsbech, N. P., Nagel, B., Gaye, B., and Jetten, M. S. M. et al. (2011). Intensive nitrogen loss over the Omani Shelf due to anammox coupled with dissimilatory nitrite reduction to ammonium. ISME J. 5, 1660–1670.
Karl, D., Letelier, R., Tupas, L., Dore, J., Christian, J., and Hebel, D. (1997). The role of nitrogen fixation in biogeochemical cycling in the subtropical North Pacific Ocean. Nature 388, 533–538.
Kim, K.-R., and Craig, H. (1990). Two-isotope characterization of N2O in the Pacific Ocean and constraints on its origin in deep water. Nature 347, 58–61.
Koba, K., Osaka, K., Tobari, Y., Toyoda, S., Ohte, N., and Katsuyama, M. et al. (2009). Biogeochemistry of nitrous oxide in groundwater in a forested ecosystem elucidated by nitrous oxide isotopomer measurements. Geochim. Cosmochim. Acta 73, 3115–3133.
Kroopnick, P., and Craig, H. (1976). Oxygen isotope fractionation in dissolved-oxygen in deep-sea. Earth Planet. Sci. Lett. 32, 375–388.
Kumar, S., Nicholas, D. J. D., and Williams, E. H. (1983). Definitive N-15 NMR evidence that water serves as a source of O during nitrite oxidation by Nitrobacter-Agilis. FEBS Lett. 152, 71–74.
Kuypers, M. M. M., Lavik, G., Woebken, D., Schmid, M., Fuchs, B. M., and Amann, R. et al. (2005). Massive nitrogen loss from the Benguela upwelling system through anaerobic ammonium oxidation. Proc. Natl. Acad. Sci. U.S.A. 102, 6478–6483.
Lam, P., Lavik, G., Jensen, M. M., van de Vossenberg, J., Schmid, M., and Woebken, D. et al. (2009). Revising the nitrogen cycle in the Peruvian oxygen minimum zone. Proc. Natl. Acad. Sci. U.S.A. 106, 4752–4757.
Lam, P., Jensen, M. M., Kock, A., Lettmann, K. A., Plancherel, Y., and Lavik, G. et al. (2011). Origin and fate of the secondary nitrite maximum in the Arabian Sea. Biogeosciences 8, 1565–1577.
Law, C. S., and Ling, R. D. (2001). Nitrous oxide flux and response to increased iron availability in the Antarctic Circumpolar Current. Deep Sea Res. Part II Top. Stud. Oceanogr. 48, 2509–2527.
Lipschultz, F., Wofsy, S. C., Ward, B. B., Codispoti, L. A., Friedrich, G. J. W., and Elkins, J. W. (1990). Bacterial transformations of inorganic nitrogen in the oxygen-deficient waters of the Eastern Tropical South Pacific Ocean. Deep Sea Res. 37, 1513–1541.
Loescher, C. R., Kock, A., Koenneke, M., LaRoche, J., Bange, H. W., and Schmitz, R. A. (2012). Production of oceanic nitrous oxide by ammonia-oxidizing archaea. Biogeosci. Discuss. 9, 2095–2122.
Lomas, M. W., and Lipschultz, F. (2006). Forming the primary nitrite maximum: nitrifiers or phytoplankton? Limnol. Oceanogr. 51, 2453–2467.
Mackey, K. R. M., Bristow, L., Parks, D. R., Altabet, M. A., Post, A. F., and Paytan, A. (2011). The influence of light on nitrogen cycling and the primary nitrite maximum in a seasonally stratified sea. Prog. Oceanogr. 91, 545–560.
Mariotti, A., Germon, J. C., Hubert, P., Kaiser, P., Letolle, R., and Tardieux, A. et al. (1981). Experimental determination of nitrogen kinetic isotope fractionation: some principles; Illustration for the denitrification and nitrification processes. Plant Soil 62, 413–430.
McIlvin, M. R., and Casciotti, K. L. (2006). Method for the analysis of δ18O in water. Anal. Chem. 78, 2377–2381.
McIlvin, M. R., and Casciotti, K. L. (2010). Fully automated system for stable isotopic analyses of dissolved nitrous oxide at natural abundance levels. Limnol. Oceanogr. 8, 54–66.
Meador, T. B., Aluwihare, L. I., and Mahaffey, C. (2007). Isotopic heterogeneity and cycling of organic nitrogen in the oligotrophic ocean. Limnol. Oceanogr. 52, 934–947.
Merbt, S. N., Stahl, D. A., Casamayor, E. O., Marti, E., Nichol, G. W., and Prosser, J. I. (2012). Differential photoinhibition of bacterial and archaeal ammonia oxidation. FEMS Microbiol. Lett. 327, 41–46.
Mincer, T. J., Church, M. J., Taylor, L. T., Preston, C., Karl, D. M., and DeLong, E. F (2007). Quantitative distribution of presumptive archaeal and bacterial nitrifiers in Monterey Bay and the North Pacific Subtropical Gyre. Environ. Microbiol. 9, 1162–1175.
Naqvi, S. W. A., Noronha, R. J., and Reddy, C. V. G. (1982). Denitrification in the Arabian Sea. Deep Sea Res. 29, 459–469.
Naqvi, S. W. A., and Sen Gupta, R. (1985). “NO,” a useful tool for the estimation of nitrate deficits in the Arabian Sea. Deep Sea Res. 32, 665–674.
Olson, R. J. (1981a). Differential photoinhibition of marine nitrifying bacteria: a possible mechanism for the formation of the primary nitrite maximum. J. Mar. Res. 39, 227–238.
Ostrom, N. E., Pitt, A., Sutka, R., Ostrom, P. H., Grandy, A. S., and Huizinga, K. M. et al. (2007). Isotopologue effects during N2O reduction in soils and in pure cultures of denitrifiers. J. Geophys. Res. 112, G02005.
Ostrom, N. E., Russ, M. E., Popp, B., Rust, T. M., and Karl, D. M. (2000). Mechanisms of nitrous oxide production in the subtropical North Pacific based on determinations of the isotopic abundances of nitrous oxide and di-oxygen. Chemosphere Global Change Sci. 2, 281–290.
Popp, B. N., Westley, M. B., Toyoda, S., Miwa, T., Dore, J. E., and Yoshida, N. et al. (2002). Nitrogen and oxygen isotopomeric constraints on the origins and sea-to-air flux of N2O in the oligotrophic subtropical North Pacific gyre. Global Biogeochem. Cycles 16, 1064.
Poth, M., and Focht, D. D. (1985). 15N Kinetic analysis of N2O produced by Nitrosomonas europaea: an examination of nitrifier denitrification. Appl. Environ. Microbiol. 49, 1134–1141.
Richards, F. A. (1965). “Anoxic basins and fjords,” in Chemical Oceanography, Vol. 1, eds J. P. Riley and G. Skirrow (New York, NY: Academic Press), 611–645.
Santoro, A. E., Buchwald, C., McIlvin, M. R., and Casciotti, K. L. (2011). Isotopic signature of N2O produced by marine ammonia-oxidizing archaea. Science 333, 1282–1285.
Santoro, A. E., Casciotti, K. L., and Francis, C. A. (2010). Activity, abundance, and diversity of nitrifying archaea and bacteria in the central California Current. Environ. Microbiol. 12, 1989–2006.
Santoro, A. E., and Casciotti, K. L. (2011). Enrichment and characterization of ammonia-oxidizing archaea from the open ocean: phylogeny, physiology and stable isotope fractionation. ISME J. 5, 1796–1808.
Schmidt, H.-L., Werner, R. A., Yoshida, N., and Well, R. (2004). Is the isotopic composition of nitrous oxide an indicator for its origin from nitrification or denitrification? A theoretical approach from referred data and microbiological and enzyme kinetic aspects. Rapid Commun. Mass Spectrom. 18, 2036–2040.
Sigman, D. M., Altabet, M. A., McCorkle, D. C., Francois, R., and Fischer, G. (2000). The delta N-15 of nitrate in the Southern Ocean: nitrogen cycling and circulation in the ocean interior. J. Geophys. Res. 105, 19599–19614.
Sigman, D. M., DiFiore, P. J., Hain, M. P., Deutsch, C., Wang, Y., and Karl, D. M. et al. (2009). The dual isotopes of deep nitrate as a constraint on the cycle and budget of oceanic fixed nitrogen. Deep Sea Res. Part I Oceanogr. Res. Pap. 56, 1419–1439.
Sigman, D. M., Granger, J., DiFiore, P. J., Lehmann, M. F., Ho, R., and Cane, R. et al. (2005). Coupled nitrogen and oxygen isotope measurements of nitrate along the eastern North Pacific margin. Global Biogeochem. Cycles 19, GB4024.
Snider, D. M., Venkiteswaran, J. J., Schiff, S. L., and Spoelstra, J. (2012). Deciphering the oxygen isotope composition of nitrous oxide produced by nitrification. Global Change Biology 18, 356–370.
Strous, M., Pelletier, E., Mangenot, S., Rattei, T., Lehner, A., and Taylor, M. W. et al. (2006). Deciphering the evolution and metabolism of an anammox bacterium from a community genome. Nature 440, 790–794.
Sutka, R. L., Ostrom, N. E., Ostrom, P. H., Gandhi, H., and Breznak, J. A. (2003). Nitrogen isotopomer site preference of N2O produced by Nitrosomonas europaea and Methylococcus capsulatus Bath. Rapid Commun. Mass Spectrom. 17, 738–745.
Sutka, R. L., Ostrom, N. E., Ostrom, P. H., Gandhi, H., and Breznak, J. A. (2004). Nitrogen isotopomer site preference of N2O produced by Nitrosomonas europaea and Methylococcus capsulatus Bath. Rapid Commun. Mass Spectrom. 18, 1411–1412.
Thamdrup, B., Dalsgaard, T., Jensen, M. M., Ulloa, O., Farias, L., and Escribano, R. (2006). Anaerobic ammonium oxidation in the oxygen-deficient waters off northern Chile. Limnol. Oceanogr. 51, 2145–2156.
Toyoda, S., Mutobe, H., Yamagishi, H., Yoshida, N., and Tanji, Y. (2005). Fractionation of N2O isotopomers during production by denitrifier. Soil Biol. Biochem. 37, 1535–1545.
Toyoda, S., and Yoshida, N. (1999). Determination of nitrogen isotopomers of nitrous oxide on a modified isotope ratio mass spectrometer. Anal. Chem. 71, 4711–4718.
Voss, M., Dippner, J. W., and Montoya, J. P. (2001). Nitrogen isotope patterns in the oxygen-deficient waters of the Eastern Tropical North Pacific Ocean. Deep Sea Res. Part I Oceanogr. Res. Pap. 48, 1905–1921.
Wada, E., and Hattori, A. (1971). Nitrite metabolism in the euphotic layer of the central north Pacific Ocean. Limnol. Oceanogr. 16, 766–772.
Walker, C. B., de la Torre, J. R., Klotz, M. G., Urakawa, H., Pinel, N., and Arp, D. J. et al. (2010). Nitrosopumilus maritimus genome reveals unique mechanisms for nitrification and autotrophy in globally distributed marine crenarchaea. Proc. Natl. Acad. Sci. U.S.A. 107, 8818–8823.
Wankel, S. D., Kendall, C., Pennington, J. T., Chavez, F. P., and Paytan, A. (2007). Nitrification in the euphotic zone as evidenced by nitrate dual isotopic composition: observations from Monterey Bay, California. Global Biogeochem. Cycles 21, GB2009.
Ward, B. B. (1985). Light and substrate concentration relationships with marine ammonium assimilation and oxidation rates. Mar. Chem. 16, 301–316.
Ward, B. B. (2005). Temporal variability in nitrification rates and related biogeochemical factors in Monterey Bay, California, USA. Mar. Ecol. Prog. Ser. 292, 97–109.
Ward, B. B., Devol, A. H., Rich, J. J., Chang, B. X., Bulow, S. E., and Naik, H. et al. (2009). Denitrification as the dominant nitrogen loss process in the Arabian Sea. Nature 461, 78–81.
Ward, B. B., Kilpatrick, K. A., Renger, E., and Eppley, R. W. (1989). Biological nitrogen cycling in the nitracline. Limnol. Oceanogr. 34, 493–513.
Ward, B. B., Olson, R. J., and Perry, M. J. (1982). Microbial nitrification rates in the primary nitrite maximum off Southern-California. Deep Sea Res. Part A Oceanogr. Res. Pap. 29, 247–255.
Ward, B. B., Tuit, C. B., Jayakumar, A., Rich, J. J., Moffett, J., and Naqvi, S. W. A. (2008). Organic carbon, and not copper, controls denitrification in oxygen minimum zones of the ocean. Deep Sea Res. Part I Oceanogr. Res. Pap. 55, 1672–1683.
Ward, B. B., and Zafiriou, O. C. (1988). Nitrification and nitric oxide in the oxygen minimum of the eastern tropical North Pacific. Deep Sea Res. 35, 1127–1142.
Waser, N. A. D., Turpin, D. H., Harrison, P. J., Nielsen, B., and Calvert, S. E. (1998). Nitrogen isotope fractionation during the uptake and assimilation of nitrate, nitrite, and urea by a marine diatom. Limnol. Oceanogr. 43, 215–224.
Watson, S. W. (1965). Characteristics of a marine nitrifying bacterium, Nitrosocystis oceanus sp. n. Limnol. Oceanogr. 10(Suppl.), R274–R289.
Watson, S. W., Bock, E., Valois, F. W., Waterbury, J. B., and Schlosser, U. (1986). Nitrospira marina gen. nov. sp. nov.: a chemolithotrophic nitrite-oxidizing bacterium. Arch. Microbiol. 144, 1–7.
Watson, S. W., and Waterbury, J. B. (1971). Characteristics of two marine nitrite oxidizing bacteria, Nitrospina gracilis nov. gen. nov. sp. and Nitrococcus mobilis nov. gen. Nov. sp. Arch. Microbiol. 77, 203–230.
Wuchter, C., Abbas, B., Coolen, M. J. L., Herfort, L., van Bleijswijk, J., and Timmers, P. et al. (2006). Archaeal nitrification in the ocean. Proc. Natl. Acad. Sci. U.S.A. 103, 12317–12322.
Yamagishi, H., Westley, M. B., Popp, B. N., Toyoda, S., Yoshida, N., and Watanabe, S. et al. (2007). Role of nitrification and denitrification on the nitrous oxide cycle in the eastern tropical North Pacific and Gulf of California. J. Geophys. Res. Biogeosci. 112, G02015.
Yool, A., Martin, A. P., Fernandez, C., and Clark, D. R. (2007). The significance of nitrification for oceanic new production. Nature 447, 999–1002.
Keywords: nitrification, isotopic fractionation, oxygen, nitrogen, nitrate, nitrous oxide
Citation: Casciotti KL and Buchwald C (2012) Insights on the marine microbial nitrogen cycle from isotopic approaches to nitrification. Front. Microbio. 3:356. doi: 10.3389/fmicb.2012.00356
Received: 05 August 2012; Accepted: 18 September 2012;
Published online: 12 October 2012.
Edited by:
Bess B. Ward, Princeton University, USACopyright © 2012 Casciotti and Buchwald. This is an open-access article distributed under the terms of the Creative Commons Attribution License, which permits use, distribution and reproduction in other forums, provided the original authors and source are credited and subject to any copyright notices concerning any third-party graphics etc.
*Correspondence: Karen L. Casciotti, Department of Environmental Earth System Science, Stanford University, Yang and Yamazaki Energy and Environment Building, 473 Via Ortega, Room 140, Stanford, CA 94305, USA. e-mail: kcasciotti@stanford.edu