
- 1National Oceanography Centre Southampton, School of Ocean and Earth Science, University of Southampton, Southampton, UK
- 2Department of Biology, Woods Hole Oceanographic Institution, Woods Hole, MA, USA
- 3Department of Earth Sciences, University of Cambridge, Cambridge, UK
- 4GEOMAR. Helmholtz Centre for Ocean Research Kiel, Kiel, Germany
- 5Department of Ecology, Evolution and Marine Biology, University of California Santa Barbara, Santa Barbara, CA, USA
Growth and calcification of the marine coccolithophorid Emiliania huxleyi is affected by ocean acidification and macronutrients limitation and its response varies between strains. Here we investigated the physiological performance of a highly calcified E. huxleyi strain, NZEH, in a multiparametric experiment. Cells were exposed to different CO2 levels (ranging from 250 to 1314 μatm) under three nutrient conditions [nutrient replete (R), nitrate limited (-N), and phosphate limited (-P)]. We focused on calcite and organic carbon quotas and on nitrate and phosphate utilization by analyzing the activity of nitrate reductase (NRase) and alkaline phosphatase (APase), respectively. Particulate inorganic (PIC) and organic (POC) carbon quotas increased with increasing CO2 under R conditions but a different pattern was observed under nutrient limitation. The PIC:POC ratio decreased with increasing CO2 in nutrient limited cultures. Coccolith length increased with CO2 under all nutrient conditions but the coccosphere volume varied depending on the nutrient treatment. Maximum APase activity was found at 561 μatm of CO2 (pH 7.92) in -P cultures and in R conditions, NRase activity increased linearly with CO2. These results suggest that E. huxleyi's competitive ability for nutrient uptake might be altered in future high-CO2 oceans. The combined dataset will be useful in model parameterizations of the carbon cycle and ocean acidification.
Introduction
Since the beginning of the industrial revolution, atmospheric CO2 has increased at the fastest rate experienced by the Earth in the last 65 million years (Zachos et al., 2001). Consequently, the increase in CO2 dissolution in seawater has been altering the balance of the inorganic carbon species leading to a decrease in pH predicted to intensify over the next century (Raven et al., 2005). Additionally, global warming derived from an increase in greenhouse gases induces stratification of the water column reducing mixing processes that maintain nutrient supply into the euphotic zone (Sarmiento et al., 1998). Therefore, the duration and timing of nitrate and phosphate limitation and the biogeographical regions affected are likely to vary in future oceans (Sarmiento et al., 1998). Coccolithophores play a major role in the carbon cycling being an important source of calcite in the open ocean (Gehlen et al., 2007). Emiliania huxleyi is the most abundant bloom-forming coccolithophore species (Tyrrell and Merico, 2004), and its calcification process is known to be affected by variations in carbon chemistry (Riebesell et al., 2000; Iglesias-Rodriguez et al., 2008; Langer et al., 2009). However, this response varies if other environmental parameters such as nutrient availability, temperature or light are simultaneously changed (Zondervan et al., 2002; Sciandra et al., 2003; Feng et al., 2008; De Bodt et al., 2010; Borchard et al., 2011).
E. huxleyi flourishes after the demise of diatoms, when silicate, nitrate, and phosphate are limiting (Litchman et al., 2006). This ecological strategy stems from a low nutrient quota and an extremely high phosphate affinity under phosphate-limiting conditions (Riegman et al., 2000). E. huxleyi also takes up nitrogen compounds other than nitrate (Benner and Passow, 2010; Bruhn et al., 2010), and assimilates nutrients from organic sources through the controlled expression of enzymes active in specific metabolic pathways (Dyhrman and Palenik, 2003; Bruhn et al., 2010). Despite the sensitivity of E. huxleyi to CO2 (Riebesell et al., 2000; Iglesias-Rodriguez et al., 2008; Langer et al., 2009) and its diversity of nutrient acquisition pathways, the majority of contemporary work has not considered the effect of [CO2] on the efficiency of nutrient assimilation. Previous studies have independently assessed the biogeochemical responses of E. huxleyi to high CO2 under nitrogen (Sciandra et al., 2003; Leonardos and Geider, 2005; Müller et al., 2012) or phosphorus (Borchard et al., 2011) limitation using three different E. huxleyi strains (TW1 PML, B92/11 and a strain isolated in the Raunefjord, Norway). It is well accepted that different E. huxleyi strains respond differently to varying CO2 levels (e.g., Langer et al., 2009). For example, the E. huxleyi NZEH strain presents contrasting calcification responses to elevated CO2 compared to other strains tested in the laboratory. Similarly, a recent field study revealed the presence of a heavy calcified E. huxleyi morphotype (R-morphotype) in “acidic” waters of the South Pacific Ocean, as an exception to the global correlation found between coccolithophore calcification and CO−23 concentration (Beaufort et al., 2011). Considering this biological variability and the projected changes in the extent of oligotrophic waters, studying the effect of nutrient limitation in conjunction with ocean acidification in different E. huxleyi strains is crucial.
In this study, we assessed the combined effects of elevated atmospheric CO2 and nitrate or phosphate limitation on the physiology of the E. huxleyi strain NZEH. This is a highly calcified strain bearing coccoliths that display the R-morphotype whose production appears to be resilient to ocean acidification (Iglesias-Rodriguez et al., 2008; Beaufort et al., 2011). We also investigated the effect of CO2 on nitrate and phosphate utilization by analyzing the activity of two enzymes involved in nutrient assimilation: alkaline phosphatase (APase), and nitrate reductase (NRase). Investigating the response of different E. huxleyi strains, and potential discrepancies between them, to environmental change is central to model the contribution of this ecologically important species to the global carbon cycle.
Materials and Methods
Culture Conditions
Experiments were conducted in diluted batch cultures of E. huxleyi (Lohmann) W. W. Hay and H. P. Mohler, strain NZEH (CAWPO 6), isolated in 1992 in the South Pacific Ocean and obtained from the Plymouth Culture Collection (UK). Artificial sea-water (ASW) was prepared according to Kester et al. (1967) with different nitrogen and phosphorus concentrations to achieve nutrient (nitrate, phosphate)-replete (R), nitrate-limited (-N) and phosphate-limited (-P) conditions (Table 1). Trials were conducted prior to the experiments to ensure that -N and -P cultures reached nutrient limitation at the desired cell density, a density below levels that would alter significantly the media carbon chemistry. The three nutrient regimes were combined with different CO2 partial pressures (ranging from 250 to 1314 μatm) corresponding to pre-industrial levels and projected values for the middle and the end of the century respectively (Table 1). Medium carbonate chemistry was adjusted by additions of sodium carbonate (Na2CO3) and hydrochloric acid (HCl) to change the relative proportion of dissolved inorganic carbon (DIC) species and restore total alkalinity (TA) respectively (Riebesell et al., 2010). The conditions mimicked changes in carbonate chemistry associated with ocean acidification (CO2 increases while TA remains constant at ~2268 ± 64.86 μmol kg−1) (Table 1). The culture medium was filtered through sterile 0.22 μm polycarbonate filters (Millipore® Stericup™ Filter Units). All other environmental parameters remained constant throughout the experiments: salinity = 34.00 ± 0.40, temperature = 19.00 ± 0.50°C, 12:12 h light:dark cycle, irradiance = 120.00 ± 15.00 μmol photons m2 s−1 under Sylvania Standard F36W/135-T8 white fluorescent lighting (Havells Sylvania, Newhaven, UK).
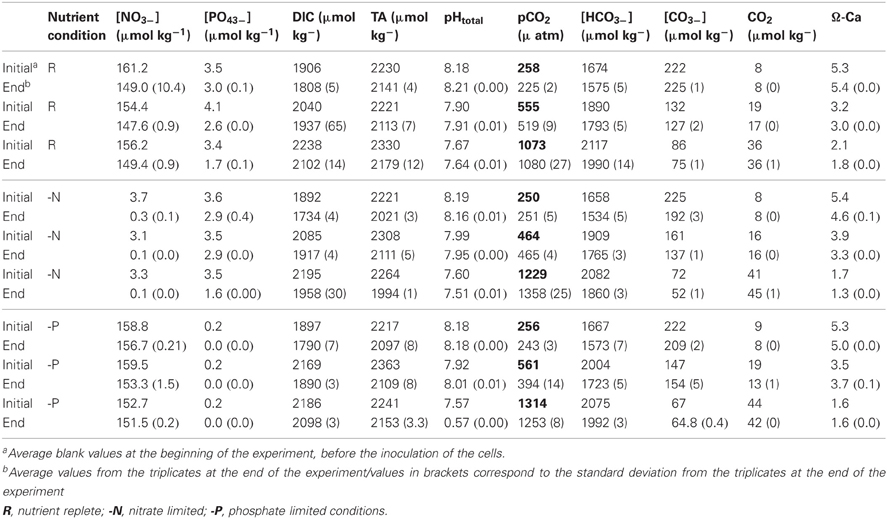
Table 1. Nutrient concentrations and carbon chemistry parameters of the media at the beginning and at the end of the experiment.
Incubation Experiments
Experiments were conducted in triplicate in 4 L Nalgene® polycarbonate bottles. After the cell inoculation at an initial density of 100 cells ml−1, the bottles were completely filled to minimize headspace, closed and sealed with Parafilm® until harvested. A blank control bottle (containing no cells) was incubated alongside each treatment. A fourth replicate bottle (seeded with the same original stock culture and at the same concentration as that used in the triplicate bottle experiments) was used for daily monitoring of cell density, temperature, pH and irradiance, to avoid opening any of the triplicate bottles during the course of the experiment. Cell densities at the time of harvest in R cultures were 75,988 ± 13,159 cells ml−1 depending on the treatments. The R cultures were harvested during exponential growth phase and did not experience nutrient limitation over the course of the experiment. The -N and -P cultures were harvested two days after exponential growth stopped (assessed by daily cell counts from the test bottle). This allowed cultures to be in growth-limiting conditions for 2 days (cell densities at the time of harvest were 71,587 ± 9250 and 43,288 ± 14,651 cells ml−1 for -N and -P cultures respectively). All cultures were allowed to grow for 8–10 generations, corresponding to a maximal DIC consumption of 12%. This number of generations ensured that almost 100% of the cells in the cultures experience the study conditions. At time 0 (pre-inoculation) and during harvesting (always conducted 3 h after the beginning of the light phase), samples were collected from all experimental bottles for analysis of carbon chemistry and macronutrient concentration in the medium, particulate organic carbon (POC), Ca2+ measurements [for determination of particulate inorganic carbon (PIC)], particulate organic nitrogen (PON) and phosphorous (POP), cell density, and scanning electron microscope (SEM) imaging. Samples were also collected for APase and NRase assays.
Determination of Nitrate Reductase Activity
Aliquots of 400 ml were centrifuged (2000 g, 4°C, 15 min), and the resulting pellets were snap frozen in liquid nitrogen and stored at −80°C. NRase was extracted by adding 500 μ l of a solution containing 0.20 M phosphate buffer (pH = 8.20), 1 mM dithiothreitol (DTT) and 0.50 M methylenediaminetetra-acetic acid (EDTA) to each pellet. The resuspended material was sonicated on ice for nine 10-s bursts (30 s intervals between bursts) using a VC300 Vibracell sonicator (Sonics and Materials, USA) with a 20-kHz frequency, 50% duty cycle and an output of 3 (90 W). The final extract was centrifuged again (750 g, 4°C, 5 min), and the supernatant was used for the enzyme activity determination. NRase assays were developed according to Rigobello-Masini et al. (2006). Tests were carried out in triplicate in 1 ml at 19°C. The reaction mixture contained 100 μ l of crude extract, 10 mM KNO3 and 2 mM MgSO4 and was initiated by the addition of reduced nicotinamide adenine dinucleotide (NADH) substrate to a final concentration of 0.40 mM. The NRase reaction was stopped after 15 min with 250 μl of absolute ethanol at 0°C and with 50 mM ZnSO4. Activity was estimated based on the final nitrate concentration, indicated by the formation of a red AZO product after the simultaneous addition of 100 μ l (0.10% weight in volume, w/v) sulphanilamide and 100 μ l (0.10% w/v) N-1-naphtyl ethylenediamine dihydrochloride (Nicholas and Nason, 1957). After these additions, the reaction mixture was centrifuged again (21,000 g, 5 min), and the supernatant taken for colorimetric analysis at 543 nm. Absorbance values were converted to nitrate concentration using a calibration curve. Enzymatic activities were expressed in enzymatic units per total protein, where one unit of the enzyme activity (UEA) catalyzes the conversion of 1 μmol of nitrate to nitrite. Total protein determinations were performed with a commercial kit (Thermo Scientific Pierce® BCA Protein Assay Kit).
Determination of Alkaline Phosphatase Activity
APase is expressed on the cell surface of E. huxleyi (Dyhrman et al., 2006), allowing the activity assay to be performed on whole cells. Aliquots (40 ml) of sample were centrifuged at 2000 g and 19°C for 15 min, and the pellets were resuspended in 2.90 ml of a solution containing 0.01 M Tris buffer (pH = 9.00), 0.05 M MgCl2 and 0.01 M CaCl2. After resuspension, 100 μl of 13.50 M p-nitrophenilphosphate (p-NPP; Sigma) substrate were added, and the mixture was incubated at 19°C for 20 min. The reaction was stopped by the addition of 0.60 ml of 1 M NaOH, and samples were centrifuged again (3000 g, 19°C, 15 min) before the absorbance of the supernatant at 410 nm was measured. Absorbance values were transformed to p-nitrophenol (p-NP) concentration using a suitable calibration curve. One unit of enzymatic activity corresponds to 1 nmol of p-NP produced per 106 cells min−1.
Growth Rate and Coccosphere Volume
Growth rate was determined with a standard exponential growth equation (Reynolds, 1984):
where N0 and Nt are the cell densities at the start and at the harvest day respectively, and t corresponds to the length of incubation (in days). Cell density and estimated coccosphere (cell + coccoliths) volume were determined in triplicates using a Beckman Coulter Multisizer III with a 70 μm aperture.
Coccolith Length
Coccolith length was measured from SEM images. For SEM sample collection, a 25 mm MF 300 filter was soaked with a drop of dilute ammonium hydroxide, and a 0.22 μm polycarbonate filter was placed on top. A few drops of culture were placed on the polycarbonate filter, and samples were dried on an open Petri dish (37°C for 24 h). A section of the top filter was cut out and sputter-coated in a Hummer VI-A gold coater, and a grid of 100 images at 5000× magnification was taken at a random location on each filter using a LEO 1450 VP SEM with SmartSEM V05-1 software. At least 60 coccoliths were measured on consecutive images along their longest axis (defined as coccolith length).
Particulate Matter Analyses
POC and PON concentrations were measured using a Thermo Finnigan Flash EA1112 elemental analyzer with acetanilide standards at Plymouth Marine Laboratory (PML). Aliquots of 200 ml were filtered through two pre-combusted (400°C, 4 h) MF 300 filters (25 mm glass microfiber 0.70 μm pore size, Fisherbrand). Filters were kept at −20°C until required for analysis and fumed with sulphurous acid for 24 h in a desiccator chamber to remove inorganic carbon (Verardo et al., 1990). The filters were then dried at 60°C for 16 h and pelleted in pre-combusted aluminium foil (EMA; 100 × 30 mm circles) following Hilton et al. (1986).
For PIC analysis, 200 ml of medium was filtered through 0.20 μm 47 mm diameter Nuclepore polycarbonate filters, previously rinsed twice with 5 ml of dilute ammonium hydroxide solution (pH ~9), and washed again three times after filtering. Filters were stored in 50 ml Falcon tubes at −20°C until analysis. Samples (including blanks) were then weighed, and 15 ml of 0.10 M nitric acid were added and re-weighed to determine the acid volume. The filters were left in acid for 2–3 h with continuous shaking, after which 500 μl of the acid leach was removed and centrifuged (6500 g for 6 min). A 250 μl aliquot of the supernatant was taken to determine elemental concentrations in a Varian Vista Pro ICP-OES. The Ca2+ per coccolithophore was calculated and extrapolated to PIC, assuming that all Ca2+ on the filters originated in CaCO3 (Fagerbakke et al., 1994). The precision of the method, assessed from periodical measurements (n = 11) of standards was 1.17% RSD.
POP was measured using a wet-oxidation method, as described by Raimbault et al. (1999). Medium aliquots (200 ml) were filtered through a single pre-combusted (400°C, 4 h) MF 300 filter (25 mm glass microfiber 0.70 μm pore size, Fisherbrand). Samples were digested with sodium tetraborate and potassium persulphate and autoclaved before analysis in a Segmented Flow Auto Analyser (SEAL QuAAtro) at the National Oceanography Centre Southampton (NOCS), UK.
Media Chemistry
Samples (20 ml) of media were collected for nutrient measurements by filtration through a 0.22 μm Millex filter (Millipore, Billerica, MA, USA) and stored at −20°C until analysis. Macronutrient concentrations were determined colorimetrically following Hansen and Koroleff (1999) using a Segmented Flow Auto Analyser (QuAAtro, SEAL Analytical) at the NOCS (UK).
Samples for carbonate chemistry were collected in 300 ml borosilicate bottles and preserved in the dark with HCl at a final concentration of 2.5 10−3 M to prevent microbial growth during storage. These samples were later analysed to determine TA and DIC using a Verstatile INstrument for the Determination of Total inorganic carbon and titration Alkalinity (VINDTA3C) at the NOCS. DIC was analysed using a colorimetric titration (coulometer 5011, UIC, USA), and TA was determined using a semi-closed cell titration (Dickson et al., 2007). The precision of the method, assessed daily from repeated measurements (n ≥ 5) on the same batch of seawater, was 2.7 ± 1.6 μmol Kg−1 for DIC and 0.78 ± 0.78 μmol Kg−1 for TA. The accuracy was controlled against Certified Reference Materials (from A. G. Dickslon, Scripps Institution of Oceanography, USA) measured at the beginning and end of each day of analysis applying a correction factor obtained from the difference between the certified and the measured values. The carbonate system was calculated from temperature, salinity, DIC, TA and nutrients using the “CO2SYS” macro (Lewis and Wallace, 1998). The equilibrium constants were from Mehrbach et al. (1973) and refitted by Dickson and Millero (1987). The KSO4 constants were from Dickson (1990), and a seawater pH scale was used.
Statistical Analysis
One way factor ANOVA was conducted using SPSS 17 (SPSS Inc., Chicago IL, USA). Linear correlation factors (r2 value) were calculated using Sigma Plot 11.0 version (Systat Software Inc.).
Limitation of the Experimental Approach
Our batch culture experimental design precludes a direct quantitative comparison of PON, POP, PIC, and POC quotas (pmol per cell−1) between R and -P or -N cultures. Unlike in R cultures, growth rates in the -N and -P treatments were not constant over the course of the experiment (see Langer et al., 2012; Langer et al., who used the same experimental approach). In nutrient-limited batch cultures, cells experienced an initial exponential nutrient-replete phase followed by a nutrient-limited phase when cell division rate decreased. Therefore, cellular quotas include cellular PIC and POC produced in both exponential and nutrient-limited periods. For this reason, these cannot be compared with cellular quotas under nutrient-replete conditions, where growth is constant and exponential during the experiment. Therefore, in this study, R, -P, and -N cultures are treated as separate experiments and comparisons of cellular PIC and POC quotas can be drawn between CO2 treatments but only within the same nutrient condition. Within each nutrient-limiting condition, the initial nutrient concentrations for all the CO2 conditions were identical (see Table 1). Given that in -N and -P experiments cells were harvested 2 days after the end of the exponential growth phase, any differences in PIC and POC quotas between the CO2 treatments (within each nutrient condition) are only the result of different CO2 levels.
Results
Enzymatic Activity
NRase activity was detected only under R conditions, and a linear increase in its activity [r2 = 0.79; F(1,7) = 26.4; p = 0.01] was observed with increasing CO2 levels (Figure 1). This increase in NRase activity was accompanied by a simultaneous increase in the cellular POC quota [Figure 2; r2 = 0.74; F(2,7) = 20.5; p = 0.02]. APase activity was only detected in the -P cultures and showed a maximum rate of 6.25 nmoles of p-NP 106 cells min−1 at 561 μatm CO2. APase activity at 256 and 1314 μatm CO2 was 77 and 61% lower than at 561 μatm CO2 [Figure 1; F(2,6) = 149.0, p < 0.001]. Cellular PIC quota showed a strong correlation with APase activity [Figure 3; r = 0.94; F(1,7) = 59.1; p < 0.001] but not with cellular POC (Figure 3).
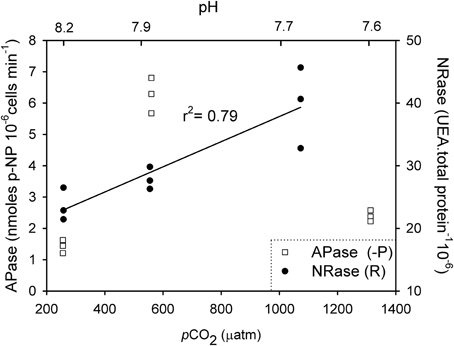
Figure 1. Enzymatic response of nitrate reductase (NRase) and alkaline phosphatase (APase) to different CO2 and nutrient scenarios in Emiliania huxleyi NZEH.
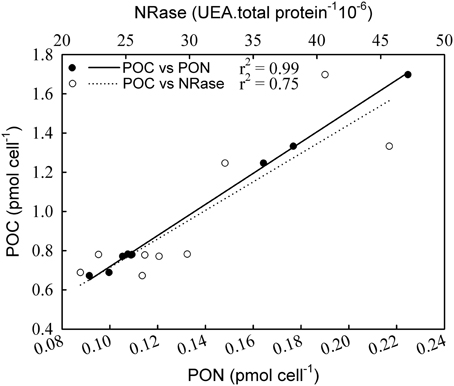
Figure 2. Correlation of particulate organic carbon (POC) with particulate organic nitrogen (PON) and nitrate reductase (NRase) under nutrient replete conditions.
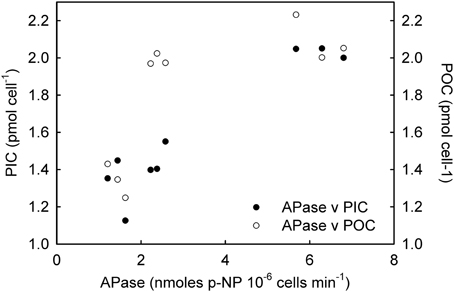
Figure 3. Correlation of alkaline phosphatase (APase) with particulate organic carbon (POC) and particulate inorganic carbon (PIC) under phosphorus limited conditions.
Cell Organic and Inorganic Matter Quotas
In R cultures, both cellular PON and POP quotas increased significantly with increasing CO2 [Figure 4A; F(2,6) = 19.28, p = 0.002 (PON); F(2,6) = 24.69, p = 0.002 (POP)]. Cellular PIC and POC quotas were ~70 and 90% higher respectively at the highest CO2 levels (555 and 1073 μatm) compared with cells grown under ~258 μatm of CO2 [Figure 4B; F(2,6) = 80.37, p ≤ 0.001 (PIC); F(2,6) = 10.65, p = 0.01 (POC)]. In addition, cellular POC quotas increased in parallel to PON quotas under different CO2 conditions [Figure 2; r2 = 0.99; F(1,7) = 3596.4; p < 0.001]. The PIC:POC ratio did not change significantly with rising CO2 [Figure 4C; F(2,6) = 1.41, p = 0.315] although a decreasing trend could be observed.
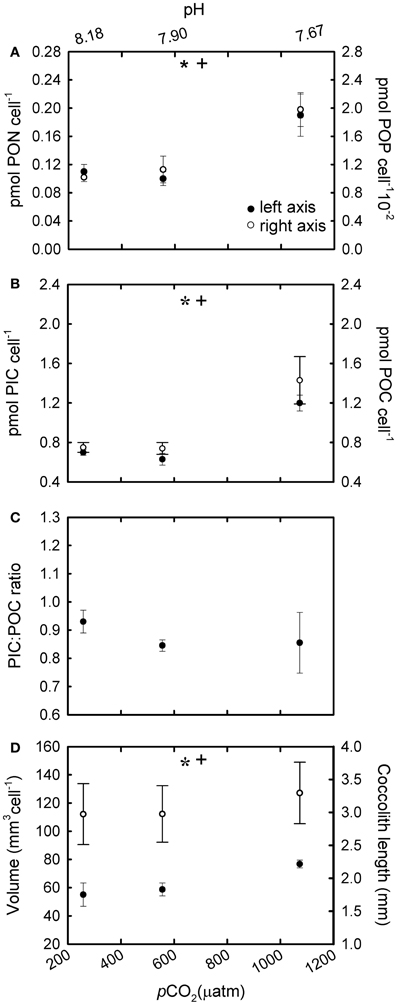
Figure 4. The response of Emiliania huxleyi NZEH to different CO2 scenarios under nutrient replete conditions. (A) Cellular PON quota, cellular POP quota; (B) Cellular PIC quota, cellular POC quota; (C) PIC:POC; (D) Coccosphere volume (μ m3) and coccolith length (μm). (* and +) significant differences (p < 0.05) between CO2 levels within nutrient treatments from One-Way ANOVA analysis: left (*) and right(+) axis.
In -N cultures, nitrate in the culture media was almost completely depleted after 8–9 generations (Table 1). The cellular PON quota was less than half the concentration of the R cultures [Table 2; F(4,18) = 9.70, p ≤ 0.001]. Cellular PON quotas did not vary [Figure 5A; F(2,6) = 1.22, p = 0.361] but POP quotas increased significantly [Figure 5A; F(2,6) = 16.33, p = 0.004] with increasing CO2. Similarly, PIC quotas did no vary [Figure 5B; F(2,6) = 0.35, p = 0.72], but POC quotas increased significantly with increasing CO2 levels [Figure 5B; F(2,6) = 6.14, p = 0.035]. A significant decreasing pattern in PIC:POC was observed in -N cultures [Figure 5C; F(2,6) = 9.07, p = 0.015] with increasing CO2.
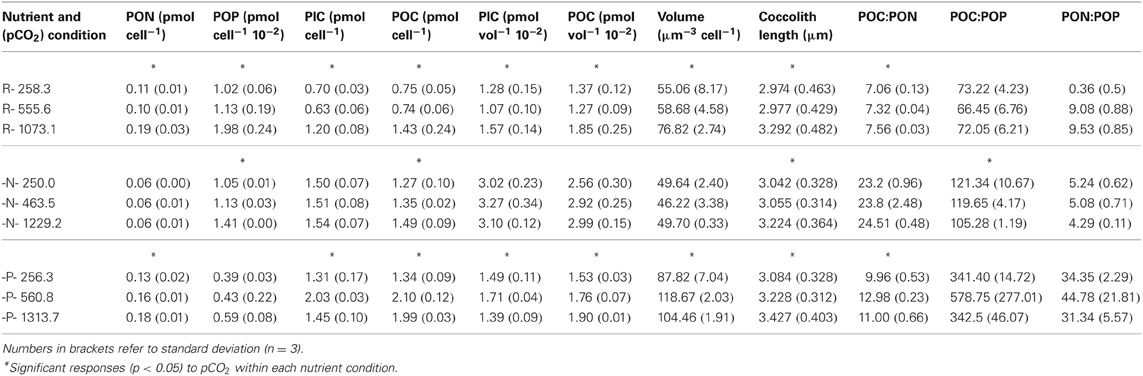
Table 2. Cell quota, coccosphere volume, coccolith length, and cellular ratios at the end of the experimental period (exponential phase for R cultures and exponential + nutrient limiting phase for -N and -P cultures).
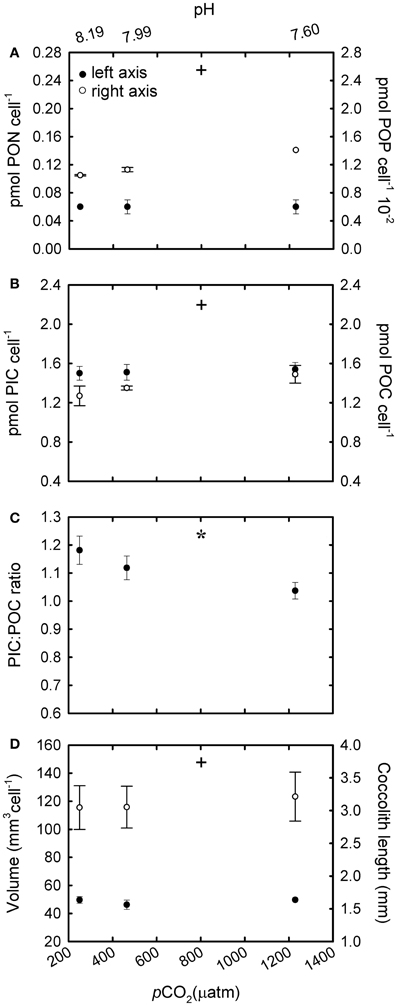
Figure 5. The response of Emiliania huxleyi NZEH to different CO2 scenarios under nitrate limited conditions. (A) Cellular PON quota, cellular POP quota; (B) Cellular PIC quota, cellular POC quota; (C) PIC:POC; (D) Coccosphere volume (μm3) and coccolith length (μm). (* and +) significant differences (p < 0.05) between CO2 levels within nutrient treatments from One-Way ANOVA analysis: left (*) and right(+) axis.
In -P cultures, phosphate in the culture media was almost completely depleted after 8–9 generations (Table 1). The cellular POP quota was less than half the concentration of the R cultures [Table 2; F(4,18) = 7.39, p = 0.001]. Cellular PON quotas increased significantly [Figure 6A; F(2,6) = 9.34, p = 0.014] but POP quotas did not vary [Figure 6A; F(2,6) = 1.59, p = 0.279] with increasing CO2 conditions. The trend in cellular PIC quotas was not uniform and the most pronounced increase (>100%) was observed at 561 μatm of CO2 [Figure 6B; F(2,6) = 37.03, p < 0.001]. Cellular POC quotas were ~50% higher at the two highest CO2 levels (~561 and 1314 μatm) compared with cells grown under 256 μatm CO2 [F(2,6) = 10.742, p = 0.010]. In general, within each nutrient condition, the trend in PIC and POC quotas with CO2 varied when expressed as a function of coccosphere volume (Table 2). PIC:POC showed a decreasing pattern with increasing CO2 conditions [Figure 6C; F(2,6) = 8.97, p = 0.016].
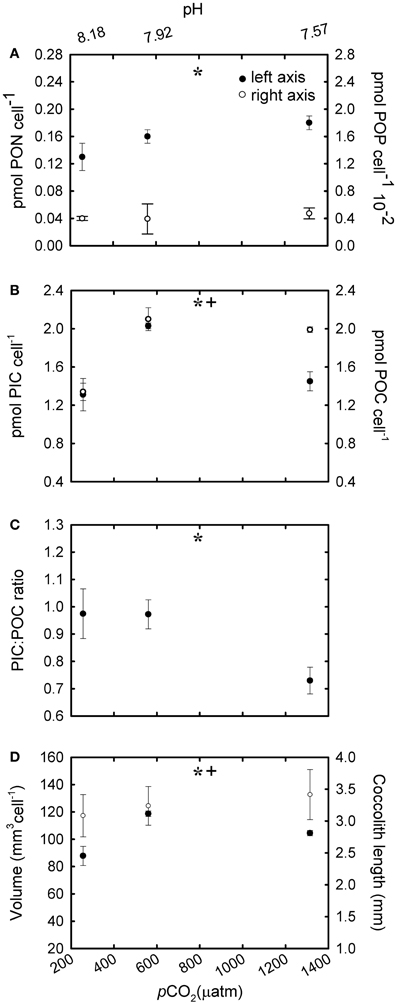
Figure 6. The response of Emiliania huxleyi NZEH to different CO2 scenarios under phosphate limited conditions. (A) Cellular PON quota, cellular POP quota; (B) Cellular PIC quota, cellular POC quota; (C) PIC:POC; (D) Coccosphere volume (μm3) and coccolith length (μm). (* and +) significant differences (p < 0.05) between CO2 levels within nutrient treatments from One-Way ANOVA analysis: left (*) and right(+) axis.
Coccolith Length and Coccosphere Volume
Under the highest CO2 level used, coccolith length was ~10% higher compared to the lowest CO2 condition for all the nutrient treatments [Figure 4D; F(2,567) = 31.7, p < 0.001 (R); Figure 5D; F(2,567) = 14.5, p < 0.001 (-N); Figure 6D; F(2,567) = 43.8, p < 0.001 (-P)]. Coccosphere volume increased by ~39% over the CO2 range considered under R conditions [Figure 4D; F(2,6) = 12.8, p = 0.007]. No differences in coccosphere volume were observed under -N conditions for all the CO2 levels tested [Figure 5D; F(2,6) = 2.1, p = 0.207]. The highest coccosphere volume under -P conditions was observed at 561 μatm of CO2 [Figure 6D; F(2,6) = 37.5, p < 0.001].
Discussion
Nutrient Utilization: Alkaline Phosphatase and Nitrate Reductase
This is the first study to investigate E. huxleyi APase and NRase activities under varying CO2 levels. APase was only detected in -P cultures since APase activity is typically enhanced by phosphorus limitation. This enzyme allows phytoplankton to overcome phosphorus starvation by hydrolysing phosphate from esters in the dissolved organic phosphorus pool. APase activity showed a clear response to CO2 partial pressure, and its maximum activity was found at 561 μatm CO2 (Figure 1). Very little is known about the effect of CO2 in APase activities and phytoplankton (Tanaka et al., 2008; Endres et al., 2013), and the only study with E. huxleyi focused on the effect of pH (Xu et al., 2006). Since both CO2 and pH covaried in this study, the independent effect of these two parameters in APase activity cannot be discerned. As APase activity is known to be affected by changes in pH (Kuenzler and Perras, 1965), it is likely that pH is one, although maybe not the only, parameter affecting APase activity in this study.
A non-uniform response of APase activity to CO2 levels was observed, increasing from 256 μatm CO2 (pH = 8.18) to 561 μatm CO2 (pH = 7.92) but decreasing at the highest CO2 conditions (1314 μatm, pH = 7.57) (Figure 1). This decline in activity may be the result of a CO2 threshold exceeding the pH upper limit for optimum APase activity. In a study on the cyanobacterium species Nodularia spumigena, APase activity increased with CO2 (Endres et al., 2013). However, direct comparison across studies is not always possible because of the different CO2 levels applied. For example, the maximum CO2 conditions used in their study was ~700 μatm, probably still within the optimal pH range for this species. Additionally the thresholds of pH/CO2 tolerance cannot be generalized as APase optimum pH is species-specific (Kuenzler and Perras, 1965) and also dependent on the species biogeography (Yamada and Suzumura, 2010). The decline in APase activity at high CO2 (1314 μatm) suggests that the competitive ability of E. huxleyi to acquire phosphorus may be compromised in future more “acidic” oceans. However, the ecological implications of physiological results should be carefully considered given the high degree of genetic diversity among E. huxleyi strains (Iglesias-Rodriguez et al., 2006), the marked differences between strain maximum activities (Xu et al., 2010; Reid et al., 2011), as well as synergies with other levels of ecological organization.
NRase was only found in nutrient replete (R) cultures, when nitrate was present in the medium (Figure 1). Previous studies indicate a down-regulation of proteins involved in the acquisition and assimilation of inorganic nitrogen after nitrate depletion in E. huxleyi (Bruhn et al., 2010). Despite the presence of nitrate in the medium, NRase was absent when cultures grew in -P conditions. Since some regulatory mechanisms involved in nitrate assimilation include phosphorylation, phosphate limitation may be impairing this process (Beardall et al., 1998). NRase increased with rising CO2 levels under R conditions. The significant positive correlation between cellular POC and PON with NRase (Figure 2) could be explained by nitrogen and carbon metabolism being tightly coupled, such that a decrease in photosynthetic carbon fixation limits nitrogen assimilation (Hipkin et al., 1983; Turpin, 1991). It is possible that responses in NRase activity to ocean acidification may be species- and possibly strain-specific such as those found in higher plants (Fonseca et al., 1997; Matt et al., 2001) and phytoplankton species (Xia and Gao, 2005; Rigobello-Masini et al., 2006).
Particulate Inorganic and Organic Carbon Quotas Under Nutrient-Replete Conditions
Both cellular POC and PIC quotas increased at high CO2 under nutrient replete (R) conditions (Figure 4B). This increase was accompanied by slight increases in coccosphere volume and coccolith size (Figure 4D). The observed increase in cellular POC quotas at high CO2 concentrations has been observed in previous studies (e.g., Riebesell et al., 2000; Iglesias-Rodriguez et al., 2008; Langer et al., 2009) and suggests that this species could be carbon limited in the present ocean. Considering the low affinity of RUBISCO for CO2 and the poorly efficient carbon concentrating mechanisms in E. huxleyi (Paasche, 2002), any increase in available CO2 would increase the speed of carbon fixation, and thereby cellular POC quotas (Barcelos e Ramos et al., 2010). The observed increase in cellular PIC quotas with rising CO2 levels is in accordance with other studies using E. huxleyi NZEH (Iglesias-Rodriguez et al., 2008; Shi et al., 2009) but in disagreement with Hoppe et al. (2011). Discrepancies between studies with the same strain have also been found with strains others than NZEH (Langer et al., 2009; Hoppe et al., 2011) and with parameters others than PIC such as growth rate. Several explanations could reconcile the different outcomes observed between studies using the same strain; for example, differences in the experimental set up (i.e., carbon manipulation methods, number of generations under the experimental conditions, differences in temperature or light). The method of pH manipulation does not seem to be driving the reported differences between experiments according to results by Hoppe et al. (2011) and Shi et al. (2009), which revealed similar PIC responses to increasing CO2 using bubbling with different CO2 partial pressures or acid/base addition. Regarding the number of generations exposed to the manipulation, Barcelos e Ramos et al. (2010) showed a rapid response of E. huxleyi's metabolic properties (including PIC quotas) in response to ocean acidification. Finally, any differences in laboratorial culturing conditions, e.g., temperature and irradiance could give different outcomes. For example, results from this study and those by Iglesias-Rodriguez et al. (2008) and Shi et al. (2009) cannot be compared with those by Hoppe et al. (2011) because the temperature used in the latter was 4–5°C higher. Additionally, synergistic effects can give different outcomes; for example, trends in cellular PIC can change when CO2 levels are combined with different temperatures (Borchard et al., 2011) or light levels (Zondervan et al., 2002).
Different outcomes between studies using the same strain could also be explained by genetic differences between the cultured strains themselves. For example, there is evidence of shifts in phenotypic and genomic properties of strains over time under continuous culturing in the laboratory (Lakeman et al., 2009). Also, the potential for a strain to evolve properties that deviate from those of its original phenotype it is known to increase with time of exposure under the new growth conditions (Lakeman et al., 2009). Thus, comparisons between studies using the “same” strain must be conducted with caution.
Particulate Inorganic and Organic Carbon Quotas Under Nutrient-Limited Conditions
The ocean is a dynamic system and the physiological response of an independent species might differ depending on the combination of environmental parameters or stressors to which they are exposed, including nutrient limitation. Similarly to R cultures, the increase in POC quotas with increasing CO2 levels in both -N and -P cultures (Figures 5B, 6B) suggests that, under nutrient limitation, carbon may be rate-limiting for photosynthesis under the CO2 conditions commonly found in the open ocean. Our results are however, in disagreement with those using nitrogen (Sciandra et al., 2003) and phosphorous (Borchard et al., 2011) limiting conditions in a calcifying E. huxleyi strain, but in accordance with Leonardos and Geider (2005), using a non-calcifying E. huxleyi strain under high irradiance. These differences probably result from strain-specific responses and/or variations in laboratorial conditions. In contrast to cellular POC quotas, PIC quotas in -N and -P cultures showed a different trend to that observed under R conditions. Interestingly, in -N cultures, PIC quotas remained constant under the different CO2 conditions suggesting that nitrogen metabolism may be decoupled from calcification. However, under phosphate limitation a decrease in PIC quotas was observed under the highest CO2 conditions (1314 μatm). Interestingly, APase activity was tightly correlated with PIC quotas (Figure 3). However, elucidating the mechanistic effect of CO2 and phosphate limitation on calcification requires further work.
Different cellular elemental stoichiometry was found in the E. huxleyi NZEH strain under different environmental scenarios (Table 2). Stoichiometric mechanisms are known to play a very important role in defining the structure of the food web in aquatic ecosystems (Elser et al., 2000). Specifically, the biochemical composition of phytoplankton is known to affect grazing preference (Jones et al., 2002). Thus, changes in stoichiometry could influence the grazing-selection pressure, ultimately determining the prevalence of some strains versus others in future oceans. In addition, changes in cellular elemental stoichiometry should be taken into consideration when predicting the role of E. huxleyi in future biogeochemical cycles.
Unlike in the R manipulations, the PIC:POC ratios decreased with CO2 under both -N and -P conditions in the NZEH strain (Figures 5C, 6C), comparable to other E. huxleyi strains under nitrogen (Sciandra et al., 2003; Müller et al., 2012) and phosphorus (Borchard et al., 2011) limitation. This finding is important considering the geographic extent of oligotrophic oceanic waters and the importance of PIC:POC ratio in determining aggregate formation processes, properties and sinking velocities (Armstrong et al., 2002). The data presented here suggest that a N- and P-limited population in a high CO2 ocean would have a reduced PIC:POC ratio, which would increase the removal of CO2 as a combined effect of calcification (a source of CO2) and photosynthesis (a sink of CO2) (Frankignoulle et al., 1994). However, this could also reduce the net CO2 export to the deep ocean associated with the role of coccolith CaCO3 in forming aggregate as ballast (Armstrong et al., 2002; Biermann and Engel, 2010).
Coccolith Length and Coccosphere Volume
Although coccolith length was correlated with CO2, coccosphere volume was better correlated with nutrient availability (Figures 4D, 5D, 6D). Coccosphere volume increased with rising CO2 under R conditions, but an 11% decrease in coccosphere volume was observed under the highest CO2 level in -P cultures, similar to previous studies with the E. huxleyi strain PML-B92/11 (Borchard et al., 2011). It is interesting to note that, unlike R and -N cultures, changes in POC quotas were not associated with changes in coccosphere volume in -P cultures. Additionally, maximum PIC quotas were observed at 561 μatm CO2 while coccolith length showed the highest values at 1314 μatm CO2. Similarly, in -N cultures, increased coccolith sizes did not correlate with PIC quotas, which were constant at all CO2 conditions. These results suggest that under nutrient limitation and at the highest CO2 condition, E. huxleyi might hold coccoliths bearing less calcite than under the lowest CO2 levels.
Implications
The E. huxleyi strain NZEH, whose coccolith production seemed to be resilient to ocean acidification, presents a different response to increasing CO2 depending on the nutrient condition. However, and similar to what was found under R conditions, this response still seems to be different to that observed in other E. huxleyi strains under -N and -P conditions. For the past few years, the ocean acidification community is urging the need for multiparametric experiments in order to gain a better insight into more realistic species-specific responses to environmental pressure. However, more strain-specific studies are also necessary in order to predict and understand the direction of future changes with a degree of certainty. This information is important to improve parameterizations in diagnostic and prognostic of global biogeochemical models.
Conflict of Interest Statement
The authors declare that the research was conducted in the absence of any commercial or financial relationships that could be construed as a potential conflict of interest.
Acknowledgments
The authors thank the financial support given to Mónica Rouco by the Spanish Ministry of Science and by the Ramon Areces Fundation. We thank Edward Smith, John Gittins and Sonya Dyhrman for most helpful technical support and advice on enzyme assay protocols and laboratorial assistance. We thank Harry Elderfield and Mervyn Greaves for PIC analysis and Chris Daniels for his help with analysis of SEM samples. This research was supported by the “European Project on Ocean Acidification” (EPOCA) which received funding from the European Community's Seventh Framework Programme (FP7/2007-2013) under grant agreement n° 211384. This work was also funded in part by The European Research Council (ERC grant 2010-ADG-267931 to Harry Elderfield) and the Spanish Ministry of Science and Innovation (grant CTM2008-05680-C02-01).
References
Armstrong, R. A., Lee, C., Hedges, J. I., Honjo, S., and Wakeham, S. G. (2002). A new, mechanistic model for organic carbon flux in the ocean based on the quantitative association of POC with ballast minerals. Deep-Sea Res. II 49, 219–236. doi: 10.1016/S0967-0645(01)00101-1
Barcelos e Ramos, J., Müller, M. N., and Riebesell, U. (2010). Short-term response of the coccolithophore Emiliania huxleyi to abrupt changes in seawater carbon dioxide concentrations. Biogeosci. Discuss. 7, 177–186. doi: 10.5194/bg-7-177-2010
Beardall, J., Johnston, A., and Raven, J. (1998). Environmental regulation of CO2-concentrating mechanisms in microalgae. Can. J. Bot. 76, 1010–1017. doi: 10.1139/b98-079
Beaufort, L., Probert, I., de Garidel-Thoron, T., Bendif, E. M., Ruiz-Pino, D., Metzl, N., et al. (2011). Sensitivity of coccolithophores to carbonate chemistry and ocean acidification. Nature 476, 80–83. doi: 10.1038/nature10295
Benner, I., and Passow, U. (2010). Utilization of organic nutrients by coccolithophores. Mar. Ecol. Prog. Ser. 404, 21–29. doi: 10.3354/meps08474
Biermann, A., and Engel, A. (2010). Effect of CO2 on the properties and sinking velocity of aggregates of the coccolithophore Emiliania huxleyi. Biogeosciences 7, 1017–1029. doi: 10.5194/bg-7-1017-2010
Borchard, C., Borges, A., Händel, N., and Engel, A. (2011). Biogeochemical response of Emiliania huxleyi (PML B92/11) to elevated CO2 and temperature under phosphorus limitation: a chemostat study. J. Exp. Mar. Bio. Ecol. 410, 61–71. doi: 10.1016/j.jembe.2011.10.004
Bruhn, A., La Roche, J., and Richardson, K. (2010). Emiliania huxleyi (Prymnesiophyceae): nitrogen-metabolism genes and their expression in response to external nitrogen sources. J. Phycol. 46, 266–277. doi: 10.1111/j.1529-8817.2010.00809.x
De Bodt, C., Van Oostende, N., Harlay, J., Sabbe, K., and Chou, L. (2010). Individual and interacting effects of pCO2 and temperature on Emiliania huxleyi calcification: study of the calcite production, the coccolith morphology and the coccosphere size. Biogeosciences 7, 1401–1412. doi: 10.5194/bg-7-1401-2010
Dickson, A. (1990). Thermodynamics of the dissociation of boric acid in synthetic seawater from 273.15 to 18.15 K. Deep-Sea Res. A. 37, 755–766.
Dickson, A., and Millero, F. (1987). A comparison of the equilibrium constants for the dissociation of carbonic acid in seawater media. Deep-Sea Res. A. 34, 1733–1743. doi: 10.1016/0198-0149(87)90021-5
Dickson, A. G., Sabine, C. L., and Christian, J. R. (Eds.). (2007). Guide to Best Practices for Ocean CO2 Measurements, PICES Special Publication 3, 191.
Dyhrman, S. T., Haley, S. T., Birkeland, S. R., Wurch, L. L., Cipriano, M. J., and McArthur, A. J. (2006). Long serial analysis of gene expression for gene discovery and transcriptome profiling in the widespread marine coccolithophore Emiliania huxleyi. Appl. Environ. Microbiol. 72, 252–260. doi: 10.1128/AEM.72.1.252-260.2006
Dyhrman, S. T., and Palenik, B. (2003). Characterization of ectoenzyme activity and phosphate-regulated proteins in the coccolithophore Emiliania huxleyi. J. Plankton Res. 25, 1215–1225.
Elser, J. J., Sterner, R. W., Galford, A. E., Chrzanowski, T. H., Findlay, D. L., Mills, K. H., et al. (2000). Pelagic C:N:P stoichiometry in a eutrophied lake: responses to a whole-lake food-web manipulation. Ecosystems 3, 293–307. doi: 10.1007/s100210000027
Endres, S., Unger, J., Wannicke, N., Nausch, M., Voss, M., and Engel, A. (2013). Response of Nodularia spumigena to pCO2 – Part 2: exudation and extracellular enzyme activities. Biogeosci. Discuss. 9, 5109–5151.
Fagerbakke, K., Heldal, M., Norland, S., Heimdal, B., and Baatvik, H. (1994). Chemical composition and size of coccoliths from enclosure experiments and a Norwegian fjord. Sarsia 79, 349–355. doi: 10.1080/00364827.1994.10413566
Feng, Y., Warner, M. E., Zhang, Y., Sun, Y., Fu, F.-X., Rose, J. M., et al. (2008). Interactive effects of increased pCO2, temperature and irradiance on the marinecoccolithophore Emiliania huxleyi (Prymnesiophyceae). Eur. J. Phycol. 43, 87–98. doi: 10.1080/09670260701664674
Fonseca, F., Browsher, C. G., and Stulen, I. (1997). Impact of elevated atmospheric CO2 on nitrate reductase transcription and activity in leaves and roots of Plantago major. Physiol. Plant. 100, 940–948. doi: 10.1111/j.1399-3054.1997.tb00021.x
Frankignoulle, M., Canon, C., and Gattuso, J. P. (1994). Marine calcification as a source of carbon dioxide: positive feedback of increasing atmospheric CO2. Limnol. Oceanogr. 39, 458–462.
Gehlen, M., Gangsto, R., Schneider, B., Bopp, L., Aumont, O., and Ethe, C. (2007). The fate of pelagic CaCO3 production in a high CO2 ocean: a model study. Biogeosciences 4, 505–519.
Hansen, H. P., and Koroleff, F. (1999). “Determination of nutrients,” in Methods of Seawater Analysis, eds K. Grasshoff, K. Kremling, and M. Ehrhardt (Weinheim: Wiley-VCH), 159–228. doi: 10.1002/9783527613984.ch10
Hilton, J., Lishman, J. P., Mackness, S., and Heaney, S. I. (1986) An automated method for the analysis of ‘particulate’ carbon and nitrogen in natural waters. Hydrobiologia 141, 269–271. doi: 10.1007/BF00014221
Hipkin, C. R., Thomas, R. J., and Syrett, P. J. (1983). Effects of nitrogen deficiency on nitrate reductase, nitrate assimilation and photosynthesis in unicellular marine algae. Mar. Biol. 77, 101–105. doi: 10.1007/BF00396306
Hoppe, C. J. M., Langer, G., and Rost, B. (2011). Emiliania huxleyi shows identical responses to elevated pCO2 in TA and DIC manipulations. J. Exp. Mar. Biol. Ecol. 406, 54–62. doi: 10.1016/j.jembe.2011.06.008
Iglesias-Rodriguez, M. D., Halloran, P. R., Rickaby, R. E. M., Hall, I. R., Colmenero-Hidalgo, E., Gittins, J. R., et al. (2008). Phytoplankton calcification in a high- CO2 world. Science 320, 336–340. doi: 10.1126/science.1154122
Iglesias-Rodriguez, M. D., Schofield, O., Batley, J., and Medlin, L. K. (2006). Intraspecific genetic diversity in the marine coccolithophore Emiliania huxleyi (prymnesiophyceae): the use of microsatellite analysis in marine phytoplankton population studies. J. Phycol. 42, 526–536. doi: 10.1111/j.1529-8817.2006.00231.x
Jones, R. H., Flynn, K. J., and Anderson, T. R. (2002). Effect of food quality on carbon and nitrogen growth efficiency in the copepod Acartia tonsa. Mar. Ecol. Prog. Ser. 235, 147–156. doi: 10.3354/meps235147
Kester, D., Duedall, I., Connors, D., and Pytkowicz, R. (1967). Preparation of artificial seawater. Limnol. Oceanogr. 12, 176–179.
Kuenzler, E. J., and Perras, J. P. (1965). Phosphatases of marine algae. Biol. Bull. 128, 271–286. doi: 10.2307/1539555
Lakeman, M. B., von Dassow, P., and Cattolico, R. A. (2009). The strain concept in phytoplankton ecology. Harmful Algae 8, 746–758. doi: 10.1016/j.hal.2008.11.011
Langer, G., Nehrke, G., Probert, I., Ly, J., and Ziveri, P. (2009). Strain-specific responses of Emiliania huxleyi to changing seawater carbonate chemistry. Biogeosciences 6, 2637–2646. doi: 10.5194/bg-6-2637-2009
Langer, G., Oetjen, K., and Brenneis, T. (2012). Calcification of Calcidiscus leptosporus under nitrogen and phosphorus limitation. J. Exp. Mar. Biol. Ecol. 413, 1131–1137. doi: 10.1016/j.jembe.2011.11.028
Leonardos, N., and Geider, R. J. (2005). Elevated atmospheric carbon dioxide increases organic carbon fixation by Emiliania huxleyi (Haptophyta), under nutrient-limited high-light conditions. J. Phycol. 41, 1196–1203. doi: 10.1111/j.1529-8817.2005.00152.x
Lewis, E., and Wallace, D. W. R. (1998). Program Developed for CO2 System Calculations. Rep. ORNL/CDIAC-105, Carbon Dioxide Information Analysis Centre. Oak Ridge, TN: Oak Ridge National Laboratory, U.S. Department of Energy.
Litchman, E., Klausmeier, C. A., Miller, J. R., Schofield, O. M., and Falkowski, P. G. (2006). Multi-nutrient, multi-group model of present and future oceanic phytoplankton communities. Biogeosciences 3, 585–606. doi: 10.5194/bg-3-585-2006
Matt, P., Geige, rM., Walch-Liu, P., Engels, C., Krapp, A., and Stitt, M. (2001). Elevated carbon dioxide increases nitrate uptake and nitrate reductase activity when tobacco is growing on nitrate, but increases ammonium uptake and inhibits nitrate reductase activity when tobacco is growing on ammonium nitrate. Plant Cell Environ. 24, 1119–1137. doi: 10.1046/j.1365-3040.2001.00771.x
Mehrbach, C., Culberson, C., Hawley, J., and Pytkowicz, R. (1973). Measurement of the apparent dissociation constants of carbonic acid in seawater at atmospheric pressure. Limnol. Oceanogr. 18, 897–907.
Müller, M. N., Beaufort, L., Bernard, O., Pedrotti, M. L., Talec, A., and Sciandra, A. (2012). Influence of CO2 and nitrogen limitation on the coccolith volume of Emiliania huxleyi (Haptophyta). Biogeosci. Discuss. 9, 4979–5010. doi: 10.5194/bg-9-4155-2012
Nicholas, D. J. D., and Nason, A. (1957). Determination of nitrate and nitrite. Meth. Enzymol. 3, 982–984.
Paasche, E. (2002). A review of the coccolithophorid Emiliania huxleyi (Prymnesiophyceae), with particular reference to growth coccolith formation and calcification-photosynthesis interactions. Phycologia 40, 503–529. doi: 10.2216/i0031-8884-40-6-503.1
Raimbault, P., Diaz, F., Pouvesle, W., and Boudjellal, B. (1999). Simultaneous determination of particulate forms of carbon, nitrogen and phosphorus collected on filters using a semi-automatic wet-oxidation method. Mar. Ecol. Prog. Ser. 180, 289–295.
Raven, J., Caldeira, K., Elderfield, H., Hoegh-Guldberg, O., Liss, P., Riebesell, U., et al. (2005). Ocean Acidification Due to Increasing Atmospheric Carbon Dioxide. London: The Royal Society.
Reid, E., Worthy, C. A., Probert, I., Ali, S. T., Love, J., Napier, J., et al. (2011). Coccolithophores: functional biodiversity, enzymes and bioprospecting. Mar. Drugs 9, 586–602. doi: 10.3390/md9040586
Reynolds, C. S. (1984). The Ecology of Freshwater Phytoplankton. Cambridge: Cambridge University Press.
Riebesell, U., Fabry, V. J., Hansson, L., and Gattuso, J.-P. (2010). Guide to Best Practices for Ocean Acidification Research and Data Reporting. Luxembourg: Office for Official Publications of the European Union. doi: 10.2777/58454
Riebesell, U., Zondervan, I., Rost, B., Tortell, P., Zeebe, R. E., and Morel, F. (2000). Reduced calcification of marine plankton in response to increased atmospheric CO2. Nature 407, 364–367. doi: 10.1038/35030078
Riegman, R., Stolte, W., Noordeloos, A. A. M., and Slezak, D. (2000). Nutrient uptake and alkaline phosphatase (EC 3, 1:3, 1) activity of Emiliania huxleyi (Prymnesiophyceae) during growth under N and P limitation in continuous cultures. J. Phycol. 36, 87–96. doi: 10.1046/j.1529-8817.2000.99023.x
Rigobello-Masini, M., Masini, J. C., and Aidar, E. (2006). The profiles of nitrate reductase and carbonic anhydrase activity in batch cultivation of the marine microalgae Tetraselmis gracilis growing under different aeration conditions. FEMS Microbiol. Ecol. 57, 18–25. doi: 10.1111/j.1574-6941.2006.00106.x
Sarmiento, J. L., Hughes, T. M. C., Stouffer, R. J., and Manabe, S. (1998). Stimulated response of the ocean carbon cycle to anthropogenic climate warming. Nature 393, 245–249. doi: 10.1038/30455
Sciandra, A., Harlay, J., Lefèvre, D., Lemée, R., Rimmelin, P., Denis, M., et al. (2003). Response of coccolithophorid Emiliania huxleyi to elevated partial pressure of CO2 under nitrogen limitation. Mar. Ecol. Prog. Ser. 26, 111–122. doi: 10.3354/meps261111
Shi, D., Xu, Y., and Morel, F. M. M. (2009). Effects of the pH/pCO2 control method on medium chemistry and phytoplankton growth. Biogeosciences 6, 1199–1207. doi: 10.5194/bg-6-1199-2009
Tanaka, T., Thingstad, T. F., Løvdal, T., Grossart, H.-P., Larsen, A., Allgaier, M., et al. (2008). Availability of phosphate for phytoplankton and bacteria and of glucose for bacteria at different pCO2 levels in a mesocosm study. Biogeosciences 5, 669–678. doi: 10.5194/bg-5-669-2008
Turpin, D. H. (1991). Effects of inorganic N availability on algal photosynthesis and carbon metabolism. J. Phycol. 27, 14–20. doi: 10.1111/j.0022-3646.1991.00014.x
Tyrrell, T., and Merico, M. (2004). “Emiliania huxleyi: bloom observations and the conditions that induce them,” in Coccolithophores from Molecular Processes to Global Impact, eds H. R. Thierstein and J. R. Young (Heidelberg: Springer), 75–97.
Verardo, D., Froelich, P., and McIntyre, A. (1990). Determination of organic carbon and nitrogen in marine sediments using the Carlo Erba NA-1500 Analyzer. Deep-Sea Res. A. 37, 157–165. doi: 10.1016/0198-0149(90)90034-S
Xia, J.-R., and Gao, K.-S. (2005). Impacts of Elevated CO2 Concentration on biochemical composition, carbonic anhydrase, and nitrate reductase activity of freshwater green algae. J. Integr. Plant Biol. 47, 668–675. doi: 10.1111/j.1744-7909.2005.00114.x
Xu, Y., Boucher, J. M., and Morel, F. M. M. (2010). Expression and diversity of alkaline phosphatase EHAP1 in Emiliania Huxleyi (Prymnesiophyceae). J. Phycol. 46, 85–92. doi: 10.1111/j.1529-8817.2009.00788.x
Xu, Y., Wahlund, T. M., Feng, L., Shaked, Y., and Morel, F. M. M. (2006). A novel alkaline phosphatase in the coccolithophore Emiliania huxleyi (Prymnesiophyceae) and its regulation by phosphorus. J. Phycol. 42, 835–844. doi: 10.1111/j.1529-8817.2006.00243.x
Yamada, N., and Suzumura, M. (2010). Effects of seawater acidification on hydrolytic enzyme activities. J. Oceanogr. 66, 233–241. doi: 10.1007/s10872-010-0021-0
Zachos, J., Pagani, M., Sloan, L., Thomas, E., and Billups, K. (2001). Trends, rhythms, and aberrations in global climate 65 Ma to present. Science 292, 686–693. doi: 10.1126/science.1059412
Keywords: Emiliania huxleyi, ocean acidification, nutrients, alkaline phosphatase, nitrate reductase, calcification
Citation: Rouco M, Branson O, Lebrato M and Iglesias-Rodríguez MD (2013) The effect of nitrate and phosphate availability on Emiliania huxleyi (NZEH) physiology under different CO2 scenarios. Front. Microbiol. 4:155. doi: 10.3389/fmicb.2013.00155
Received: 04 February 2013; Accepted: 29 May 2013;
Published online: 18 June 2013.
Edited by:
Benjamin Van Mooy, Woods Hole Oceanographic Institution, USAReviewed by:
Shawn R. Campagna, University of Tennessee, USABenjamin Van Mooy, Woods Hole Oceanographic Institution, USA
Copyright © 2013 Rouco, Branson, Lebrato and Iglesias-Rodríguez. This is an open-access article distributed under the terms of the Creative Commons Attribution License, which permits use, distribution and reproduction in other forums, provided the original authors and source are credited and subject to any copyright notices concerning any third-party graphics etc.
*Correspondence: Mónica Rouco, Department of Biology, Woods Hole Oceanographic Institution, 266 Woods Hole Road, MS#33, Woods Hole, MA 02543-1050, USA e-mail: mroucomolina@whoi.edu