 Katrin Aschenbach
 Ralf Conrad
 Klára Řeháková2
 Jiří Doležal
 Roey Angel
- 1Max Planck Institute for Terrestrial Microbiology, Marburg, Germany
- 2Institute of Botany, Academy of Sciences of the Czech Republic, Třeboň, Czech Republic
- 3Faculty of Science, University of South Bohemia, České Budějovice, Czech Republic
Methanogens typically occur in reduced anoxic environments. However, in recent studies it has been shown that many aerated upland soils, including desert soils also host active methanogens. Here we show that soil samples from high-altitude cold deserts in the western Himalayas (Ladakh, India) produce CH4 after incubation as slurry under anoxic conditions at rates comparable to those of hot desert soils. Samples of matured soil from three different vegetation belts (arid, steppe, and subnival) were compared with younger soils originating from frontal and lateral moraines of receding glaciers. While methanogenic rates were higher in the samples from matured soils, CH4 was also produced in the samples from the recently deglaciated moraines. In both young and matured soils, those covered by a biological soil crust (biocrust) were more active than their bare counterparts. Isotopic analysis showed that in both cases CH4 was initially produced from H2/CO2 but later mostly from acetate. Analysis of the archaeal community in the in situ soil samples revealed a clear dominance of sequences related to Thaumarchaeota, while the methanogenic community comprised only a minor fraction of the archaeal community. Similar to other aerated soils, the methanogenic community was comprised almost solely of the genera Methanosarcina and Methanocella, and possibly also Methanobacterium in some cases. Nevertheless, ~103 gdw−1 soil methanogens were already present in the young moraine soil together with cyanobacteria. Our results demonstrate that Methanosarcina and Methanocella not only tolerate atmospheric oxygen but are also able to survive in these harsh cold environments. Their occurrence in newly deglaciated soils shows that they are early colonizers of desert soils, similar to cyanobacteria, and may play a role in the development of desert biocrusts.
Introduction
Methanogenic archaea are strict anaerobes and are therefore typically found in permanently water-logged, anoxic habitats such as wetlands, rice fields, marine sediments, hot springs, and the guts of ruminants and termites (Zinder, 1993; Liu and Whitman, 2008; Brune, 2011). Despite that, it has been shown that active methanogens inhabit many aerated, oxic soils including desert soils (Peters and Conrad, 1995; West and Schmidt, 2002; Angel et al., 2012). Methanogens belong to the phylum Euryarchaeota and are phylogenetically divided into six orders: Methanobacteriales, Methanococcales, Methanomicrobiales, Methanosarcinales, Methanopyrales (Ferry, 1994), and Methanocellales (Sakai et al., 2008). Recently two archaeal strains from the order Thermoplasmatales isolated from human and termite guts have been shown to be methanogenic and were reclassified as the seventh order of methanogens—the Methanoplasmatales (Dridi et al., 2012; Paul et al., 2012). While the aforementioned anoxic environments typically host a wide variety of methanogens, only the genera Methanosarcina and Methanocella were found in aerated soils, and it has been suggested that these methanogens are universal inhabitants of upland soils (Angel et al., 2012). All known methanogens possess the gene encoding for the enzyme methyl coenzyme M reductase, which is responsible for the last step of methanogenesis in all known pathways. Thanks to its universal occurrence and conserved sequence, the gene encoding for its α-subunit—the mcrA—is commonly used as a phylogenetic marker gene for methanogens (Lueders et al., 2001; Friedrich, 2005).
The production of biogenic CH4 is important in nature since it is the terminal step in the biodegradation of organic matter under anoxic conditions (Deppenmeier et al., 1996). In most terrestrial environments CH4 arises primarily from the reduction of CO2 (hydrogenotrophic methanogenesis) or the cleavage of acetate (aceticlastic methanogenesis). Although the two processes yield the same product, the source of the CH4 can nevertheless be differentiated by analysing the stable isotopic signatures of the carbon in the CH4 and its precursors (acetate and CO2; Conrad, 2005). The production of biogenic CH4 in nature typically leads to its release to the atmosphere where it acts as a greenhouse gas which is 25–33 times more potent than CO2 (Shindell et al., 2009).
Deserts (non-polar arid and hyperarid regions) are the largest biome on Earth, spanning over 20% of the land surface (Middleton and Thomas, 1997). Many of these deserts are characterized by a warm climate but some, particularly in high altitudes, experience frequent sub-zero temperatures throughout the year, and are termed cold deserts. The flora, fauna, and microbiota in these regions are therefore adapted to coping with low temperatures in addition to the desiccation stress common to all deserts (Dvorský et al., 2013). The area of East Ladakh, India in the western Himalayan slopes is an extensive and thinly populated high-altitude plateau characterized by both low temperatures as well as low precipitation owing to its location in the Himalayan rain shadow (Dvorský et al., 2011). This area can thus serve as a nearly pristine model for studying the ecology of cold deserts.
The soils of arid and semi-arid regions are often covered by a unique layer, a few millimeters thick and densely colonized by microorganisms, termed biological soil crust (biocrust). Biocrusts are formed by living organisms and their by-products, creating a layer of soil particles bound together by organic materials, e.g., the sticky sheath material of Microcoleus (Büdel, 2003). Biocrusts are predominantly composed of bacteria (cyanobacteria and others), archaea, fungi, and green and brown algae (Belnap et al., 2003; Angel and Conrad, 2013). In more humid areas, mosses, lichens, and liverworts can also be present. The particular composition of microorganisms that dominate the crust varies in nature and is largely determined by climate, soil type, the successional stage of the crust development as well as by historical contingency (Büdel, 2003; Bahl et al., 2011). In contrast to hot desert biocrusts, which are smooth and very thin, in cold climates biocrusts tend to be much thicker and develop three-dimensional structures, up to several centimeters high, in response to freeze-thaw cycles, termed as rolling and pinnacled crusts (Belnap, 2003). Whether this morphological difference is also reflected in differences in microbial community composition and function still requires research. In previous studies it has been shown that biocrusts from hot deserts can produce CH4 when wet (Angel et al., 2012). The primary goal of this study was therefore to investigate whether CH4 production can also be observed in high-altitude cold deserts such as in Eastern Ladakh. In addition, the presence of receding glaciers allowed us to also study how quickly methanogens colonize young soils. We hypothesized that similar to marine microbial mats (Hoehler et al., 2001), methanogens are an integral part of biocrusts and will be found already at early successional stages of the soil development together with cyanobacteria. Since it has been estimated that ~40% of the land area in Ladakh is covered by biocrusts (Janatková et al., 2013), we also set out to compare the potential activity and community composition between patches covered by a biocrust and bare soil.
For this purpose, soil and biocrust samples from three different vegetation belts: arid, steppe, and subnival, as well as from front and lateral moraines of receding glaciers were collected and tested for the production of CH4. In addition, the carbon isotopic signatures of CH4 and CO2 were analyzed to determine the pathway by which CH4 was formed. Finally, the methanogenic community was characterized by molecular analysis.
Materials and Methods
Soil Samples and Site Characterization
Soil samples were collected from two sites in a high-altitude cold desert in Ladakh, India, from Nubra Valley and from Tsomoriri Plains. Nubra Valley is characterized by a dry climate (100 mm annual precipitation) and a neutral to alkaline soil pH. In Nubra Valley samples were collected from the frontal moraines of three glaciers (N1 – N34° 40′ 26.87″ E77° 45′ 36.17″; N2 – N34° 39′ 16.98″ E77° 45′ 8.63″ and N3 – N34° 39′ 16.10″ E77° 44′ 36.48″) located at 5400, 5300, and 5150 m above sea level, respectively. Three to six frontal moraines where studied at each glacier, and from each moraine three samples were collected at different positions (A, B, and C; Figure A1). The annual mean temperatures in these sites range from −1.6 to −3.6°C (measured at 4850 and 5250 m between Aug. 2009 and Aug. 2011; Dvorský et al., 2013). The second sampling site was Tsomoriri Plains where the annual precipitation is just under 100 mm yr−1 and the soil pH is neutral to alkaline. At this site, soil and crust samples from three vegetation belts were sampled: arid, steppe, and subnival located at 4700, 5300, and 5800 m, respectively (N 32°58′56,51″ E78°21′24,95″, N 32°59′31,75″, E 78°24′7,56″, N 33° 0′ 23,26″ E 78° 26′ 46,76″). Furthermore, samples from lateral moraines of the Chamser glacier (N32° 59′ 13.17″ E78° 25′ 54.084″) were also collected at altitudes 5650, 5700, and 5800 m. Here, samples were collected from lateral moraines (A, B, and C), each divided into three transects (TS1, TS2, and TS3; Figure A1). From each moraine/transect samples were collected from the top and the bottom of the moraine. The annual mean temperatures at this site range from −4.4 to −10.4°C (measured at 5350 and 5850 m between Aug. 2009 and Aug. 2011; Dvorský et al., 2013). Sample characteristics are given in Table 1. The sampling areas were partially covered by a biocrust, and soil samples were collected from either the top soil which was covered by biocrust or from bare areas (0–5 cm), which were in proximity. In Nubra Valley only biocrust samples were collected. Samples of approximately 100–150 g soil from the top layer were collected into Whirl-Pak® bags (118-ml sterile sampling bags, Nasco) and air dried in the field. Altogether a total of 84 samples were collected, and shipped at room temperature to Germany for further analysis. For nucleic acids extraction, 1 g of each sample was split in two 2 ml tubes upon arrival at the laboratory and stored at −80°C until extraction. Soil pH was determined in a 1:1 soil:water slurry solution. Soil content of total and organic carbon and total nitrogen were analyzed using an elemental analyser (vario Micro cube, CHNS mode, Elementar) by the Analytical Chemical Laboratory of the Philipps-Universität, Marburg while the stable carbon isotope signature (δ13C) of the total and organic carbon were analyzed at the Institute for Soil Science and Forest Nutrition (IBW) at the University of Göttingen, Göttingen, Germany, using an elemental analyser (NA2500, CE-Instruments) coupled over an interface (Conflo III, Thermo) to a mass spectrometer (Delta plus, Finnigan MAT). In both cases measurements were done before and after acidification with 10% HCl, and the difference in values was attributed to carbonate (Nüsslein et al., 2003).
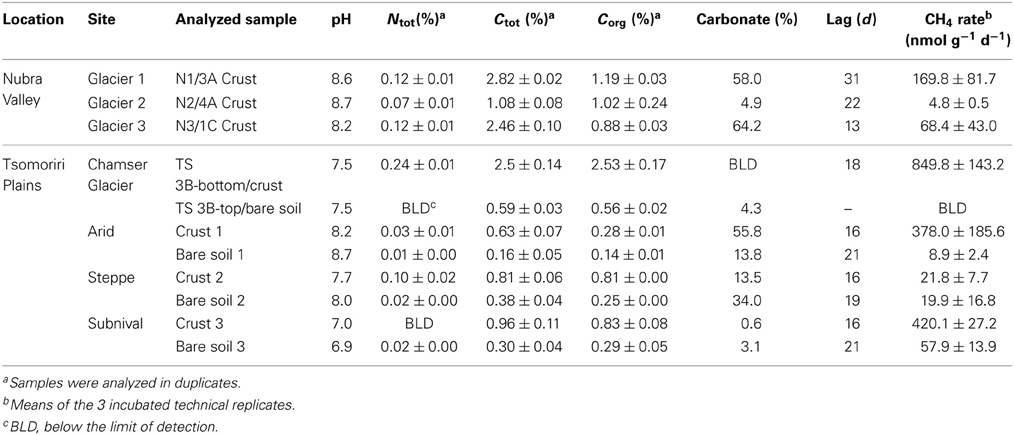
Table 1. Physico-chemical characteristics and methanogenic potentials of a selection of the soil samples.
Incubation Conditions and Gas Measurements
For determining the methanogenic potential of a sample, 5 g of sieved soil were incubated in a 27-ml pressure tube and amended with 5 ml sterile, distilled–deionized water in triplicates. The tubes were closed with butyl rubber stoppers (cleaned by boiling before use), purged with N2 and incubated at 25°C in the dark. Samples were sacrificed after CH4 concentration has reached about 15,000 nmol g-dry-weight−1 (gdw) or after 95 days if less CH4 was produced. Previous experience suggested that such a level of accumulated CH4 should allow for easy detection of methanogens through TRFLP (data not shown). Each sample was incubated in triplicated tubes representing 3 technical replicates. Prior to gas analysis, the tubes were shortly shaken by hand to equilibrate gas and aqueous phase. Measurements of CO2 and CH4 were performed following Angel et al. (2012), gas samples (500 μl) were taken from the headspace using a 500-μl glass gas-tight pressure-lock syringe (Vici) every 7–14 days and analyzed immediately. Methane and CO2 concentrations were analyzed using a GC (GC-8A; Shimadzu) equipped a 3 m, ø 1/8″ stainless steel column filled with Hayesep Q 80/100 mesh, a methanizer (Ni-catalyst at 350°C, Chrompack) and a flame ionization detector (SRI, temperature: 160°C). The injector temperature was 160°C, the oven temperature: 120°C, and the carrier gas was H2.
The isotopic signatures of the carbon in the CH4 and CO2 were determined using a Gas Chromatograph Combustion Isotope Ratio Mass Spectrometer (GC-C-IRMS; Trace GC Ultra, Thermo Fischer Scientific), following Conrad et al. (2009). The principle operation of GC-C-IRMS has been described by Brand (1996). The CH4 and CO2 in a 500 μ l gas samples were first separated in a Trace GC Ultra Gas Chromatograph using a Pora PLOT Q column (27.5 m length, 0.32 mm i.d.; 10 μm film thickness; Varian, Palo Alto, CA, USA) at 30°C with helium (99.996% purity; 2.6 ml/min) as carrier gas. After conversion of CH4 to CO2 in a GC Isolink 1030 Oxidation Reactor at 940°C, the isotope ratio of 13C/12C was analyzed in an IRMS (Delta V Advantage, Thermo). The isotope reference gas was CO2 (99.998% purity; Air Liquide), calibrated with the working standard methylstearate (Merck). Values are reported in the delta notation against the Vienna Pee Dee Belemnite (Hayes, 1993):
Where Rsa = 13Csa/12Csa and Rst = 13Cst/12Cst of sample (sa) and standard (st), respectively.
The preference of a reaction for the light carbon isotope is described by the fractionation factor (α), which is defined as:
equivalent to:
Where δSubstrat and δProduct are the δ13C values of the substrate and the product, respectively.
The relative fraction of the hydrogenotrophically derived CH4 was calculated with the following equation:
Where δ13CCH4 = δ13C of CH4 in the headspace; δma is the δ13C of CH4 produced solely from acetate and δmc is the δ13C of CH4 produced solely from H2/CO2. Values of δma and δmc were estimated from measured δ13CCO2 (δ13C of CO2 in the headspace) using fractionation factors (α or ε values) from the literature and assuming that the δ13C of acetate (δ13Cac) is identical to the δ13C of organic matter (δ13Corg):
Extraction and Amplification of Nucleic Acids
After incubations were completed, the pressure tubes were opened and the slurries were centrifuged at 10,000 rpm for 2 min to remove pore water. One gram of soil slurry was frozen in liquid nitrogen and stored at −80°C. Total nucleic acids were extracted from 0.5 g of the dry unincubated soil as well as from the incubated slurry samples as previously described (Angel, 2012; Angel et al., 2012).
The primers for the PCR reactions are listed in Table 2. Each PCR reaction was 50 μl in volume and contained: 10 μl GoTaq®Flexi 5× Green Buffer (Promega), 0.2 mM dNTP mixture, 1.5 mM MgCl2, 0.8 μg/μl BSA (Roche), 0.25 μM of each primer, 1.5 U of GoTaq® DNA polymerase (Promega), and 1 μl of DNA template. The following programme was used: 94°C for 4 min followed by 30 cycles of 94°C for 30 s, 52°C for 30 s, and 72°C for 45 s and a single step of final elongation at 72°C for 10 min.
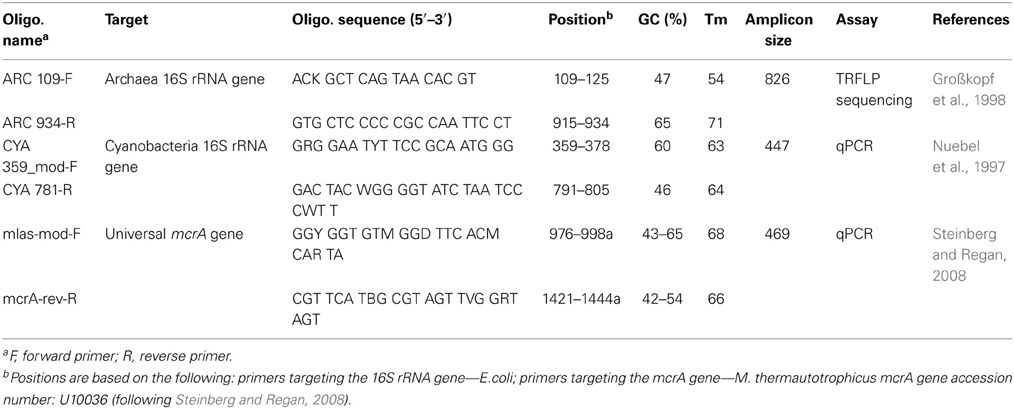
Table 2. Overview of the used primers in this study.
For analysis of terminal restriction fragment length polymorphism (TRFLP) of archaeal 16S rRNA genes, the forward primer 109f was labeled with 6-FAM (6-carboxyfluorescein) at the 5′ end. Approximately 200 ng of purified PCR products were digested overnight at 65°C with the restriction enzyme Taqα 1 (New England BioLabs). TRFLP sample preparation and processing were performed as previously described (Angel et al., 2012). For analysis, the height of the measured peaks was used, and expressed in relative abundance of the total height. All peaks under 1% of the total height were treated as noise and were removed.
Cloning and Sequencing and Phylogenetic Analysis
Four samples (TS 2B-top/biocrust, TS 3B-bottom/biocrust, subnival-biocrust 3, and subnival-bare soil 2) showing the most diverse TRFLP patterns were used for cloning of archaeal 16S rRNA genes and Sanger sequencing, in order to assign TRFs to genus. Libraries were constructed using purified PCR products (GenElute PCR cleanup kit, Sigma) which were cloned into the pGEM-T easy vector (Promega) following the manufacturer's instructions. Sanger sequencing services were provided by GATC (Germany) and M13f and M13r primers were used to sequence from both flanking regions of the vector to the insert. Twenty four clones from each sample were analyzed (96 clones in total). Only reads that fulfilled the following criteria were used: the two reads were overlapping up to the opposite primer sequence, the assembled contig was longer than 800 bp, the contig was confirmed to be archaeal and also not chimeric using BLAST. Sixty six sequences passed our quality filtering and were used for phylogenetic analysis. Sequences were aligned against the SILVA 108 SSU Ref database (Quast et al., 2013) using the ARB software package (Ludwig et al., 2004). The phylogenetic tree was calculated using RAxML (Stamatakis, 2006), implemented in Arb, using rapid hill climbing algorithm, PROTMIXJTT evolutionary model and a 1000 bootstrap runs. Nucleotide sequences were submitted to GenBank and can be found under the following accession numbers: KF445438–KF445503.
Quantitative Real-Time PCR Assays
Quantitative real-time PCR (qPCR) assays were used to quantify the 16S rRNA gene of cyanobacteria and the mcrA gene of methanogens. The assays were based on SYBR® Green and were performed as previously described (Angel et al., 2011; Angel and Conrad, 2013). A standard containing a known number of DNA copies of the target gene was used for all assays in serial dilutions for generating a calibration curves. These standards were generated from an environmental clone of a cyanobacterium and from a pure culture of Methanosarcina thermophila. All qPCR reactions were performed on an iCycler thermocycler equipped with MyiQ™ detection system (BioRad). The resulting data were analyzed with the iQ5 optical systems software (BioRad). Accounting for the dilutions of DNA template, our assays allowed detecting 5 × 10² copies per gram dry soil.
Results
Soil Characteristics
The pH in the samples obtained from the vegetation belts and the lateral moraines (Tsomoriri) was neutral to alkaline (pH 6.93–8.66), which is typical for desert soils, while the samples from the frontal moraines of Nubra Valley were slightly more alkaline (pH 8.14–8.96). Overall the samples were poor in both carbon and nitrogen. Total carbon content ranged from 0.16 to 2.8% while that of nitrogen was below the detection limit in many samples and reached at most 0.24% of the dry soil mass (Table 1). Further analysis showed that in many of the samples much of the carbon was inorganic, i.e., carbonate, which made up as much as ~60% of the total carbon in the samples (Table 1). The isotopic signature of the carbon in the soil typically ranged from −10 to −22‰ and tended to be heavier in samples with higher carbonate content (Table 3).
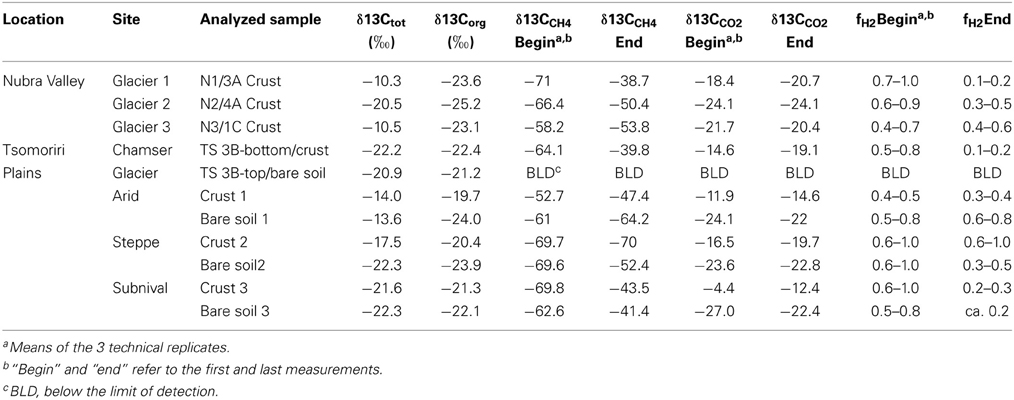
Table 3. Stable carbon isotope analysis.
Methane Production Potential and the Stable Isotope Ratio of CH4 and CO2
Methane production was tested in all 84 samples. The CH4 production rate was always higher in the biocrust samples than in the bare soil samples. In total, 50 (60%) of the samples produced at least some CH4 (>1 nmol gdw−1 d−1; Table 1; Table A1). The CH4 production rate of 14 highly methanogenic samples (~30% of the methanogenic samples) reached over 100 (and in some cases up to around 1000) nmol gdw−1 d−1. Linear CH4 accumulation rates were detected in the vegetation belt samples at Tsomoriri Plains after a lag phase of 19 days on average (Table 1; Table A1). First traces of CH4 were detected in the lateral moraine samples at Tsomoriri Plains after a lag phase of 24 days on average and in Nubra Valley samples after 31 days on average.
All samples from the different vegetation belts produced CH4 (Table 1; Table A1). The highest methanogenic activity was found in the subnival soil samples with 835 ± 228 and 65 ± 5 nmol CH4 gdw−1 d−1 on average in the crust and bare soil, respectively, followed by the arid samples with 329 ± 124 and 19 ± 14 nmol CH4 gdw−1 d−1 on average in the crust and bare soil, respectively and by the steppe samples with only 99 ± 69 and 17 ± 6 nmol CH4 gdw−1 d−1 on average in the crust and bare soil, respectively.
Also the soils from the lateral moraines of the receding Chamser glacier in Tsomoriri Plains showed methanogenic potential, though not in all samples and in lower amounts compared to the vegetation belts samples. In transect 1 samples did not produce CH4, in transect 2, only 4 of the 10 samples produced CH4, and in the last transect (3), 9 of the 10 samples produced CH4. Here as well, biocrust samples produced more CH4 than the bare soils in nearly all cases except moraine C, where the bare soil sample produced slightly more CH4 than the sample with the crust (Table A1). On average, the active biocrust samples produced CH4 at a rate of 239 ± 114 nmol CH4 gdw−1 d−1 while the active bare soil samples produced only 89 ± 48 nmol CH4 gdw−1 d−1.
In Nubra Valley a larger proportion of the samples were active compared to the Tsomoriri Chamser glacier samples and all three glacier moraines showed at least some CH4 production, but most samples produced very little CH4. On average, active samples here (which were all biocrust) produced 20 ± 8 nmol CH4 gdw−1 d−1.
In addition to the measurement of gas concentrations, the isotopic signatures of the carbon containing compounds, namely CH4 and CO2, were measured in this study. The isotopic signatures (δ13C) of the carbon in the CH4 and CO2 indicate which methanogenic pathway—hydrogenotrophic or aceticlastic—was favored in our incubations. The δ13C of the CH4 ranged from −100 to −30‰, and showed generally a positive trend with time (and therefore also with concentration; Figures 1–3). At the beginning of the incubations, the average δ13CCH4 values of all analyzed samples were around −70 to −52‰ (Figures 1–3). Over time values shifted to heavier δ13C in the soil samples from the lateral (δ13CCH4 = −40‰; Figure 2) and the frontal moraines (δ13CCH4 = −54 to −32‰; Figure 3). In contrast, the isotopic signature of CH4 of the steppe-biocrust sample as well as the bare soil samples from arid sites were relatively constant over time (δ13CCH4 = −70 to 64‰; Figure 1). As for CO2, the δ13C ranged from −30 to −5‰ (Figures 1–3). The bare soil samples showed a heavier isotopic signature in the CO2 compared with the biocrust samples.
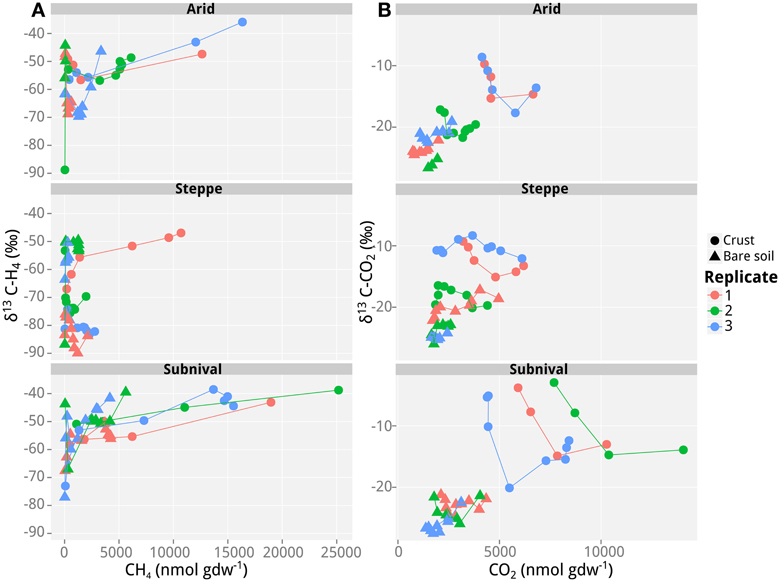
Figure 1. Values of δ13C of CH4 and CO2 as a function of CH4 and CO2 concentrations in incubations with soil samples from the different vegetation belts in Tsomoriri Plains. Depicted are the three vegetation belts samples: arid, steppe, and subnival. (A) δ13C of CH4 and (B) δ13C of CO2. Only samples producing >40 nmol g−1 CH4 produced reliable δ13C measurements of CH4 and are shown here. Temporal progression is always along the x-axis. Three biological replicates were analyzed and each data point represents a mean of n = 3 technical replicates.
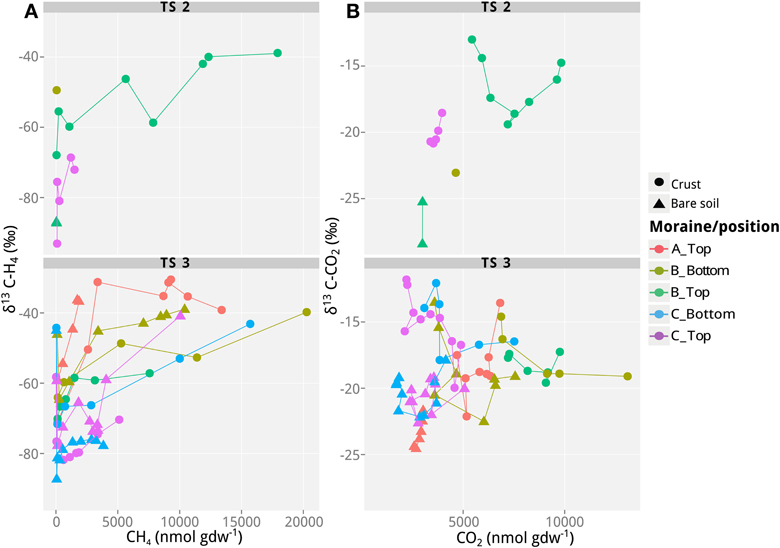
Figure 2. Values of δ13C of CH4 and CO2 as a function of CH4 and CO2 concentrations in incubations with soil samples from the different lateral moraines in Tsomoriri Plains. (A) δ13C of CH4 and (B) δ13C of CO2. Only samples producing >40 nmol g−1 CH4 produced reliable δ13C measurements of CH4 and are shown here. Therefore, only transects TS2 and TS3 are plotted. Temporal progression is always along the x-axis. Means of n = 3 (technical replicates).
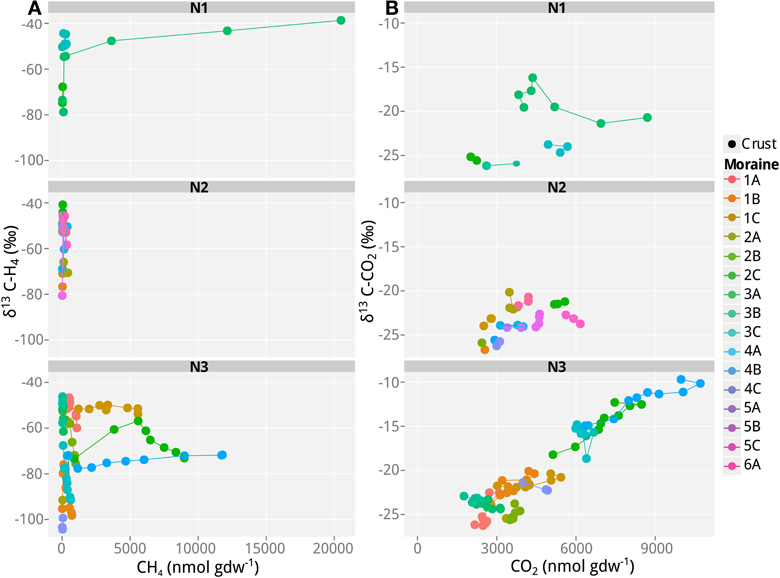
Figure 3. Values of δ13C of CH4 and CO2 as a function of CH4 and CO2 concentrations in incubations with soil samples from the different frontal moraines in Nubra Valley. (A) δ13C of CH4 and (B) δ13C of CO2. Only samples producing >40 nmol g−1 CH4 produced reliable δ13C measurements of CH4 and are shown here. N1, glacier 1 in Nubra Valley, containing 4 moraines; N2, glacier 2 with 6 moraines, N3, glacier 3 with 4 moraines. Temporal progression is always along the x-axis. Means of n = 3 (technical replicates).
The characteristic δ13C values of CH4 and CO2 at the beginning and the end of incubation are summarized in Table 3. These values were used to calculate the fraction of hydrogenotrophic methanogenesis (fH2) using Equation (4). For these calculations we assumed εac,CH4 = −10‰ (Goevert and Conrad, 2009; Angel et al., 2012) and δ13Cac = δ13Corg. On average, δma was therefore −32.2‰. We further assumed previously published fractionation factors for conversion of H2/CO2 to CH4 (−73 and −49‰; Fey et al., 2004; Conrad et al., 2010) so that δmc was in the range of −90 to −70‰. The relative fraction of CH4 derived from H2/CO2 in the early emitted methane was relatively high (fH2> 0.50 in almost all samples; Table 3). Thereby the samples seem to be generally dominated by hydrogenotrophic methanogenesis in the beginning. Toward the end of the incubation, however, fH2 dropped to 0.10–<0.50. Nevertheless, in some samples (arid-bare soil, steppe-biocrust, and glacier 3–1C biocrust) hydrogenotrophically derived CH4 remained a dominant pathway over time (fH2 = 0.4–1.0).
Composition of the Archaeal Community
TRFLP was used to characterize the archaeal community in different samples. TRFLP profiles were generated only for a subset of the total samples, i.e., for one original sample (before incubation) from each vegetation belt and glacial moraine at Tsomoriri or Nubra, and for two out of three of the respective incubation technical replicates. The tested samples showed similar occurrence of TRFs but their proportion varied between sites (Figure 4). Altogether some 14 different TRFs could be reliably detected in the analyzed samples, but only five of the major TRFs could be identified in the sequences from the clone library (Figure A2).
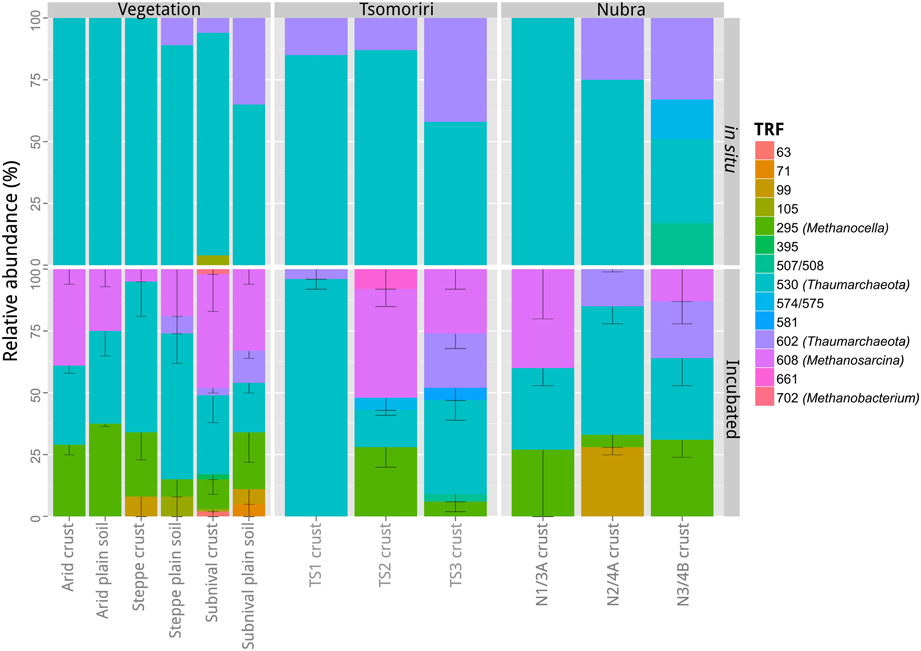
Figure 4. TRFLP community profiles of archaeal 16S rRNA genes from different soil samples. The community composition was characterized in a selection of in situ and incubated soil samples from the three vegetation belts, the lateral moraines in Tsomoriri Plains and the frontal moraines in Nubra Valley. For the incubated samples technical replicates were analyzed. Means ± SE of n = 2 (technical replicates). TS1, Tsomoriri moraine 1; TS2, Tsomoriri moraine 2; TS3, Tsomoriri moraine 3; N1/3A, Nubra glacier 1 moraine 3a; N2/4A, Nubra glacier 2 moraine 4a; N3/4B, Nubra glacier 3 moraine 4b.
The diversity of archaea in the in situ samples was dominated (80–100% of TRFs) by Thaumarchaeota (TRFs 530 and 602 bp) while no methanogens could be detected. Following incubation, the diversity of archaea increased with the appearance of methanogens. Methanosarcina (608 TRF) and Methanocella (295 TRF) appeared in all CH4 producing samples and in one case also Methanobacterium (702 TRF) was detected. The proportion of methanogens in the incubated methanogenic samples increased to 30–100% of the total community, with the level of enrichment correlating with the methanogenic potential. The nine TRFs (63, 71, 99, 105, 395, 507, 574, 581, 661 bp) which could not be affiliated to the sequence data occurred only occasionally in the samples, and made up only ~14% of the population. In the case of one sample from Nubra Valley (N2/4A), unidentified TRF = 99 bp was shown to contribute 27% to total T-RFs. However, the CH4 production rate in this sample was very low, thus this TRF is unlikely to have represented a methanogen.
Quantification of Cyanobacteria and Methanogens Along a Lateral Moraine
To determine how quickly methanogens colonize soils that were newly exposed by deglaciation and to better understand the relationship between methanogens and biocrusts, we quantified the density of methanogens and cyanobacteria in the soil samples obtained from the lateral moraines at Tsomoriri-Plains. Cell densities of methanogens (as determined from the mcrA gene copies) were close to the detection limit of 5 × 10² gene copies per gram dry weight and ranged from 5 × 10² to 1.5 × 10⁴ (Figure 5). The cell densities of cyanobacteria (estimated from the 16S rRNA gene copy numbers) were much higher and ranged from 2 × 10⁷ to 4.2 × 10⁸. The cell densities of both cyanobacteria and methanogens were relatively constant with respect to the glacier moraine, with no apparent pattern. However, in all cases the cell densities of both cyanobacteria and methanogens were higher in biocrust samples compared to bare soil samples.
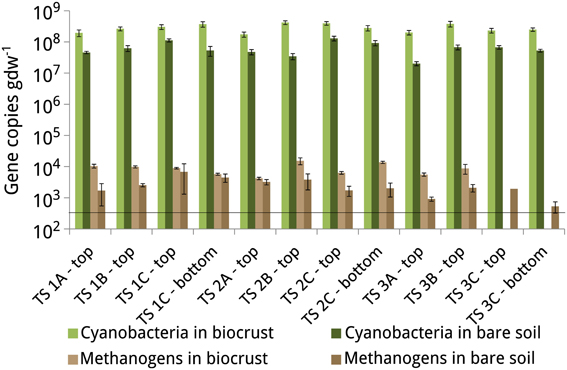
Figure 5. Gene copy numbers of the 16S rRNA gene of cyanobacteria and the mcrA gene of methanogens in the biocrusts and bare soils of the lateral moraines in Tsomoriri Plains. Horizontal line: detection limit (5 × 10² gene copies gdw−1). Means ± SE of n = 6 (2 independent qPCR reactions containing 3 replicates of the PCR mixture).
Discussion
The occurrence of methanogens in dry soils of hot deserts has previously been demonstrated (Angel et al., 2011, 2012). Here we tested for their presence in high-altitude cold deserts, in both mature as well as in very young soils, recently exposed by glacial recession. East Ladakh in the north of India is characterized by both very high altitudes (leading to a very cold climate) as well as little precipitation, resulting from its geographical location in the monsoon rain shadow. These characteristics together with its pristine nature made it an ideal location for performing these tests.
Overall, all three sites examined in this study (Nubra Valley glaciers, Tsomoriri Plains glaciers, and vegetation belts at Tsomoriri Plains) showed methanogenic potential, though not in all samples and to varying degrees. As expected, only some of the samples from the younger moraine soils produced CH4 in our incubations, and the production rates were nearly always lower than in the samples from the various vegetation belts, where the soil is more mature. The production of endogenous CH4 under anoxic slurry conditions in soils obtained from high altitudes stands in contrast to a previous report by West and Schmidt (2002), who could stimulate methanogenesis in alpine soils only by supplying H2 to their slurries. Hence, it seems that methanogens were present in their soils, but were limited by the supply of substrate. In the Himalayan samples, on the other hand, the entire microbial cascade involved in degradation of organic matter to CH4 plus CO2 was apparently present and could be activated upon anoxic incubation.
The vegetation belt samples produced CH4 at rates reaching up to 1200 nmol gdw−1 d−1 while the moraine soil samples reached at most 850 and 142 nmol gdw−1 d−1 CH4 for the lateral moraines from Tsomoriri Plains and the frontal moraines in Nubra Valley, respectively. These rates (particularly for the vegetation belt samples) are well within the range of values previously reported by Angel et al. (2012) for upland soils from various parts the world under the same incubation conditions, indicating little effect of the particular local stress factors (e.g., low temperatures) on the potential methanogenic activity of the soils. Also the fact that of the three vegetation belts tested, the subnival one, which is the coldest but the wettest one, showed the highest methanogenic rates indicates that even in this cold-desert, water scarcity is more limiting than temperature. Similar to previous reports by Angel et al. (2012), biocrust samples always exhibited higher CH4 production rates than their bare soil counterparts.
Analysis of the soil organic matter and nitrogen contents in the samples showed very low values and overall little difference between sites (although they were generally lower in the Tsomoriri vegetation belts samples). Lack of substrate can therefore not explain the difference in CH4 production rates between the samples and the lack of methanogenic potential in many of the moraine soils. Instead we suggest that it is the development of the microbial community (and particularly the development of mature biocrusts) that plays a crucial role in determining whether CH4 will be produced or not and to what extent, i.e., how much time has passed from the glacier recession. The observed CH4 production gradient along the lateral moraines of Tsomoriri Plains and the frontal moraines of Nubra Valley would sustain this theory because the oldest soils (TS3/N3) showed the highest rates and the greatest proportion of active methanogenic samples. Nemergut et al. (2007) who studied the development of microbial communities along a receding glacier in Peru reported not just an increase in the complexity of the microbial communities with soil age but also an overall increase in similarity between the communities in the young soil to that of a mature soil with age. Similarly, Gangwar et al. (2009) could show an increase in both bacterial population size and diversity with increasing altitude in Western Himalayian mountain tops. A similar trend was reported for the Rocky Mountains (Bryant et al., 2008). This indicates that despite being considered “dispersion unlimited” (Lindström and Langenheder, 2012) soil bacterial communities, much like plants, undergo successional development over time and do not simply grow in size from the moment of soil exposure.
Analysis of the stable isotopes signatures as a reflection of the pathways leading to the formation of CH4 showed a clear dominance of the hydrogenotrophic pathway (~50–100%) during the first third of the incubation period, but a shift toward the aceticlastic pathway in the latter part of the incubation. While this is a typical pattern for such slurry incubations and has often been reported in the past, also for upland soils (e.g., Roy et al., 1997; Glissmann and Conrad, 2002; Angel et al., 2012), this might not reflect well the processes as they occur in the field, particularly for aerated soils. Angel et al. (2012) showed that in the presence of oxygen acetate is consumed by other processes (probably heterotrophic ones) and CH4 is produced exclusively from H2/CO2.
Initiation of CH4 production commenced after a lag of 19–34 days on average. The lag time for the mature soils from the various vegetation belts was in agreement with lag times measured for other upland soils, but the moraine soils needed significantly more time to initiate CH4 production (Angel et al., 2012). Assuming no inhibitors in the soil and accounting for the very low concentrations of alternative electron acceptors such as NO3− (>2 mg kg−1; Janatková et al., 2013) we assumed that the long lag times resulted from the low population size of the methanogens. Indeed, the initial population density of methanogens in the soil from Tsomoriri moraines was very low (102–104 copies gdw−1) and in several cases even below the detection limit. However, it was about tenfold larger in the biocrusts, showing again that biocrusts are favorable habitats for methanogens despite their photosynthetic nature. Still, these values are lower than those obtained for mature biocrusts from the Negev Desert (Angel et al., 2012), indicating either that these Himalayan crusts still undergo development, or that cold desert crust inherently harbor a smaller methanogenic community. The numbers of methanogens were also much lower than the densities observed in anoxic soils such as rice fields (usually 106 to 107 copies gdw−1; Conrad and Frenzel, 2002).
Cyanobacteria are typically the dominant primary producers in biocrusts and also act as the pioneer colonizers in the successional development of the crust (Büdel, 2003). In a previous study it was shown that cyanobacteria comprised 70–99% of all phototrophs in these Himalayan slopes, and were particularly dominant in the newly exposed moraines (Řeháková et al., 2011; Janatková et al., 2013). Also our quantification of cyanobacteria in the samples from Tsomoriri Plains showed a high density of these organisms even in these young soils. Nevertheless, numbers of cyanobacteria were lower in the bare soil samples than the biocrusts and were overall lower by about an order of magnitude compared to mature crusts from hot deserts (Steven et al., 2012; Angel and Conrad, 2013). The association between cyanobacteria and methanogens is well-known in marine mats (Hoehler et al., 2001) and has also been postulated for desert crusts (Angel et al., 2011). This notion is strengthened here with the occurrence of methanogens in these newly developed crusts alongside cyanobacteria, which are typical for mature crusts (e.g., lichens and mosses; Belnap and Eldridge, 2003). As the main nitrogen fixers in arid environments (Evans and Ehleringer, 1993) cyanobacteria are crucial for the proliferation of nearly all other microorganisms in the soil, including methanogens. Brankatschk et al. (2011) pointed out that N2 fixation, mineralization, nitrification and denitrification are important drivers of N turnover in young soils and that soils along a glacier forefield were characterized by a high abundance of N2 fixing organisms. Also Nemergut et al. (2007) showed that cyanobacteria played an important role in the soil development of unvegetated, recently deglaciated soil and that the cyanobacteria were the abundant N2-fixing clade. Apart from supplying nitrogen it is also possible that methanogens in biocrusts rely on cyanobacteria for the supply of degradable organic matter or even hydrogen, as is known to occur in hypersaline mats (Hoehler et al., 2001).
Fingerprinting of the archaeal community in the native soils showed that they were dominated by Thaumarchaeota, which is common for upland soils (formerly considered to be Crenarchaeota; Bates et al., 2011), and even for desert biocrusts specifically (Soule et al., 2009; Angel et al., 2012). Only few members of the thaumarchaeotal phylum have been cultivated so far, all of which seem to belong to the ammonia oxidizing archaea guild (Offre et al., 2013). Yet considering the abundance of Thaumarchaeota in natural environments it cannot be excluded that they perform other biogeochemical processes than ammonia oxidation. The dominance of Thaumarchaeota indicates that the methanogenic population comprised less than 1% of the initial archaeal population (the typical detection limit of TRFLP). In fact, considering our quantitative measurements of ~103 methanogens gdw−1 and an average population size of ~107–108 copies gdw−1 for archaea in desert biocrusts (Soule et al., 2009; Angel and Conrad, 2013) methanogens most likely comprised less than 0.01% of the archaeal population. This estimation of total archaeal population size is also supported by recent quantification of soils from this environment (RA, unpublished). Similar to previous reports on methanogens from upland soils (both arid and humid), this high-altitude cold desert was also dominated by methanogens of the genus Methanosarcina and Methanocella (Nicol et al., 2003; Poplawski et al., 2007; Angel et al., 2012; Scavino et al., 2013). This is in stark contrast to the communities found in typical methanogenic environments, such as wetlands, rice fields, lake sediments, and guts of ruminants or termites, which host a variety methanogenic genera simultaneously (Lueders et al., 2001; Sjoeling and Cowan, 2003; Banning et al., 2005; Brune, 2011; Nicholson et al., 2007). It has been postulated that the occurrence of only these two genera of methanogens is related to their relative oxygen tolerance compared to other methanogens (Erkel et al., 2006; Angel et al., 2011), and the findings of this study further corroborate the notion that Methanosarcina and Methanocella are globally distributed upland soil methanogens. However, the environment in these Himalayan mountaintops poses yet another type of stress in the form of extreme cold temperatures and frequent freeze-thaw cycles. It is therefore not surprising that two previous studies found a majority of psychrophilic and psychrotolerant bacteria in the communities from these soils (Nemergut et al., 2007; Gangwar et al., 2009). Hence, Methanosarcina and Methanocella appear to be also psychrotolerant in addition to their ability to tolerate air exposure and desiccation.
Conflict of Interest Statement
The authors declare that the research was conducted in the absence of any commercial or financial relationships that could be construed as a potential conflict of interest.
Acknowledgments
The study was financially supported by the German Research Foundation (SFB 987) and the Grant Agency of the Czech Republic (13-13368S).
References
Angel, R. (2012). Total nucleic acid extraction from soil. Protoc. Exch. doi: 10.1038/protex.2012.046
Angel, R., Claus, P., and Conrad, R. (2012). Methanogenic archaea are globally ubiquitous in aerated soils and become active under wet anoxic conditions. ISME J. 6, 847–862. doi: 10.1038/ismej.2011.141
Angel, R., and Conrad, R. (2013). Elucidating the microbial resuscitation cascade in biological soil crusts following a simulated rain event. Environ. Microbiol. 15, 2799–2815. doi: 10.1111/1462-2920.12140
Angel, R., Matthies, D., and Conrad, R. (2011). Activation of methanogenesis in arid biological soil crusts despite the presence of oxygen. PLoS ONE 6:e20453. doi: 10.1371/journal.pone.0020453
Bahl, J., Lau, M. C. Y., Smith, G. J. D., Vijaykrishna, D., Cary, S. C., Lacap, D. C., et al. (2011). Ancient origins determine global biogeography of hot and cold desert cyanobacteria. Nat. Commun. 2, 163. doi: 10.1038/ncomms1167
Banning, N., Brock, F., Fry, J. C., Parkes, R. J., Hornibrook, E. R. C., and Weightman, A. J. (2005). Investigation of the methanogen population structure and activity in a brackish lake sediment. Environ. Microbiol. 7, 947–960. doi: 10.1111/j.1462-2920.2004.00766.x
Bates, S. T., Berg-Lyons, D., Caporaso, J. G., Walters, W. A., Knight, R., and Fierer, N. (2011). Examining the global distribution of dominant archaeal populations in soil. ISME J. 5, 908–917. doi: 10.1038/ismej.2010.171
Belnap, J. (2003). “Comparative structure of physical and biological soil crusts,” in Biological Soil Crusts: Structure, Function and Management Ecological Studies, eds J. Belnap and O. L. Lange (Berlin; Heidelberg: Springer), 177–191. doi: 10.1007/978-3-642-56475-8
Belnap, J., Büdel, B., and Lange, O. L. (2003). “Biological soil crusts: characteristics and distribution,” in Biological Soil Crusts: Structure, Function and Management Ecological Studies, eds J. Belnap and O. L. Lange (Berlin; Heidelberg: Springer), 3–30. doi: 10.1007/978-3-642-56475-8
Belnap, J., and Eldridge, D. (2003). “Disturbance and recovery of biological soil crusts,” in Biological Soil Crusts: Structure, Function, and Management Ecological Studies. eds J. Belnap and O. L. Lange (Berlin; Heidelberg: Springer), 363–383.
Brand, W. A. (1996). High precision isotope ratio monitoring techniques in mass spectrometry. J. Mass Spectrom. 31, 225–235. doi: 10.1002/(SICI)1096-9888(199603)31:3<225::AID-JMS319>3.0.CO;2-L
Brankatschk, R., Toewe, S., Kleineidam, K., Schloter, M., and Zeyer, J. (2011). Abundances and potential activities of nitrogen cycling microbial communities along a chronosequence of a glacier forefield. ISME J. 5, 1025–1037. doi: 10.1038/ismej.2010.184
Brune, A. (2011). “Methanogens in the digestive tract of termites,” in (Endo)symbiotic Methanogenic Archaea Microbiology Monographs, ed J. H. P. Hackstein (Berlin; Heidelberg: Springer), 81–100.
Bryant, J. A., Lamanna, C., Morlon, H., Kerkhoff, A. J., Enquist, B. J., and Green, J. L. (2008). Microbes on mountainsides: contrasting elevational patterns of bacterial and plant diversity. Proc. Natl. Acad. Sci. U.S.A. 105, 11505–11511. doi: 10.1073/pnas.0801920105
Büdel, B. (2003). “Synopsis: comparative biogeography of soil-crust biota,” in Biological Soil Crusts: Structure, Function, and Management Ecological Studies, eds J. Belnap and O. L. Lange (Berlin; Heidelberg: Springer), 141–152.
Conrad, R. (2005). Quantification of methanogenic pathways using stable carbon isotopic signatures: a review and a proposal. Org. Geochem. 36, 739–752. doi: 10.1016/j.orggeochem.2004.09.006
Conrad, R., Claus, P., and Casper, P. (2009). Characterization of stable isotope fractionation during methane production in the sediment of a eutrophic lake, Lake Dagow, Germany. Limnol. Oceanogr. 54, 457–471. doi: 10.4319/lo.2009.54.2.0457
Conrad, R., Claus, P., and Casper, P. (2010). Stable isotope fractionation during the methanogenic degradation of organic matter in the sediment of an acidic bog lake, Lake Grosse Fuchskuhle. Limnol. Oceanogr. 55, 1932–1942. doi: 10.4319/lo.2010.55.5.1932
Conrad, R., and Frenzel, P. (2002). “Flooded soils,” in Encyclopedia of Environmental Microbiology, ed G. Bitton (New York, NY: John Wiley and Sons, Inc.), 1316–1333.
Deppenmeier, U., Mueller, V., and Gottschalk, G. (1996). Pathways of energy conservation in methanogenic archaea. Arch. Microbiol. 165, 149–163. doi: 10.1007/BF01692856
Dridi, B., Fardeau, M.-L., Ollivier, B., Raoult, D., and Drancourt, M. (2012). Methanomassiliicoccus luminyensis gen. nov., sp. nov., a methanogenic archaeon isolated from human faeces. Int. J. Syst. Evol. Microbiol. 62, 1902–1907. doi: 10.1099/ijs.0.033712-0
Dvorský, M., Doleܞal, J., de Bello, F., Klimešová, J., and Klimeš, L. (2011). Vegetation types of East Ladakh: species and growth form composition along main environmental gradients. Appl. Veg. Sci. 14, 132–147. doi: 10.1111/j.1654-109X.2010.01103.x
Dvorský, M., Doležal, J., Kopeckı, M., Chlumská, Z., Janatková, K., Altman, J., et al. (2013). Testing the stress-gradient hypothesis at the roof of the world: effects of the cushion plant thylacospermum caespitosum on species assemblages. PLoS ONE 8:e53514. doi: 10.1371/journal.pone.0053514
Erkel, C., Kube, M., Reinhardt, R., and Liesack, W. (2006). Genome of rice cluster I archaea - the key methane producers in the rice rhizosphere. Science 313, 370–372. doi: 10.1126/science.1127062
Evans, R. D., and Ehleringer, J. R. (1993). A break in the nitrogen cycle in aridlands. Evidence from δ 15N of soils. Oecologia 94, 314–317. doi: 10.1007/BF00317104
Ferry, J. G. (1994). Methanogenesis: Ecology, Physiology, Biochemistry and Genetics. New York, NY: Chapman and Hall.
Fey, A., Claus, P., and Conrad, R. (2004). Temporal change of 13C-isotope signatures and methanogenic pathways in rice field soil incubated anoxically at different temperatures. Geochim. Cosmochim. Acta 68, 293–306. doi: 10.1016/S0016-7037(03)00426-5
Friedrich, M. W. (2005). Methyl−coenzyme M reductase genes: unique functional markers for methanogenic and anaerobic methane−oxidizing archaea. Methods Enzymol. 397, 428–442. doi: 10.1016/S0076-6879(05)97026-2
Gangwar, P., Alam, S. I., Bansod, S., and Singh, L. (2009). Bacterial diversity of soil samples from the western Himalayas, India. Can. J. Microbiol. 55, 564–577. doi: 10.1139/W09-011
Glissmann, K., and Conrad, R. (2002). Saccharolytic activity and its role as a limiting step in methane formation during the anaerobic degradation of rice straw in rice paddy soil. Biol. Fertil. Soils 35, 62–67. doi: 10.1007/s00374-002-0442-z
Goevert, D., and Conrad, R. (2009). Effect of substrate concentration on carbon isotope fractionation during acetoclastic methanogenesis by Methanosarcina barkeri and M. acetivorans and in rice field soil. .Appl. Environ. Microbiol. 75, 2605–2612. doi: 10.1128/AEM.02680-08
Großkopf, R., Janssen, P. H., and Liesack, W. (1998). Diversity and structure of the methanogenic community in anoxic rice paddy soil microcosms as examined by cultivation and direct 16S rRNA gene sequence retrieval. Appl. Environ. Microbiol. 64, 960–969.
Hayes, J. M. (1993). Factors controlling 13C contents of sedimentary organic compounds: principles and evidence. Mar. Geol. 113, 111–125. doi: 10.1016/0025-3227(93)90153-M
Hoehler, T. M., Bebout, B. M., and Marais, D. J. D. (2001). The role of microbial mats in the production of reduced gases on the early Earth. Nature 412, 324–327. doi: 10.1038/35085554
Janatková, K., Řeháková, K., Doležal, J., Šimek, M., Chlumská, Z., Dvorskı, M., et al. (2013). Community structure of soil phototrophs along environmental gradients in arid Himalaya. Environ. Microbiol. 15, 2505–2516. doi: 10.1111/1462-2920.12132
Lindström, E. S., and Langenheder, S. (2012). Local and regional factors influencing bacterial community assembly. Environ. Microbiol. Rep. 4, 1–9. doi: 10.1111/j.1758-2229.2011.00257.x
Liu, Y., and Whitman, W. B. (2008). Metabolic, phylogenetic, and ecological diversity of the methanogenic archaea. Ann. N.Y. Acad. Sci. 1125, 171–189. doi: 10.1196/annals.1419.019
Ludwig, W., Strunk, O., Westram, R., Richter, L., Meier, H., Yadhukumar, et al. (2004). ARB: a software environment for sequence data. Nucleic Acids Res. 32, 1363–1371. doi: 10.1093/nar/gkh293
Lueders, T., Chin, K., Conrad, R., and Friedrich, M. (2001). Molecular analyses of methyl−coenzyme M reductase α−subunit (mcrA) genes in rice field soil and enrichment cultures reveal the methanogenic phenotype of a novel archaeal lineage. Environ. Microbiol. 3, 194–204. doi: 10.1046/j.1462-2920.2001.00179.x
Nemergut, D. R., Anderson, S. P., Cleveland, C. C., Martin, A. P., Miller, A. E., Seimon, A., et al. (2007). Microbial community succession in an unvegetated, recently deglaciated soil. Microb. Ecol. 53, 110–122. doi: 10.1007/s00248-006-9144-7
Nicholson, M., Evans, P., and Joblin, K. (2007). Analysis of methanogen diversity in the rumen using temporal temperature gradient gel electrophoresis: identification of uncultured methanogens. Microb. Ecol. 54, 141–150. doi: 10.1007/s00248-006-9182-1
Nicol, G. W., Glover, L. A., and Prosser, J. I. (2003). Molecular analysis of methanogenic archaeal communities in managed and natural upland pasture soils. Global Change Biol. 9, 1451–1457. doi: 10.1046/j.1365-2486.2003.00673.x
Nuebel, U., Garcia-Pichel, F., and Muyzer, G. (1997). PCR primers to amplify 16S rRNA genes from cyanobacteria. Appl. Environ. Microbiol. 63, 3327–3332.
Nüsslein, B., Eckert, W., and Conrad, R. (2003). Stable isotope biogeochemistry of methane formation in profundal sediments of Lake Kinneret (Israel). Limnol. Oceanogr. 48, 1439–1446. doi: 10.4319/lo.2003.48.4.1439
Offre, P., Spang, A., and Schleper, C. (2013). Archaea in biogeochemical cycles. Annu. Rev. Microbiol. 67, 437–457. doi: 10.1146/annurev-micro-092412-155614
Paul, K., Nonoh, J. O., Mikulski, L., and Brune, A. (2012). “Methanoplasmatales,” Thermoplasmatales-related archaea in termite guts and other environments, are the seventh order of methanogens. Appl. Environ. Microbiol. 78, 8245–8253. doi: 10.1128/AEM.02193-12
Peters, V., and Conrad, R. (1995). Methanogenic and other strictly anaerobic bacteria in desert soil and other oxic soils. Appl. Environ. Microbiol. 61, 1673–1676.
Poplawski, A. B., Mårtensson, L., Wartiainen, I., and Rasmussen, U. (2007). Archaeal Diversity and community structure in a Swedish barley field: specificity of the Ek510r/(EURY498) 16S rDNA Primer. J. Microbiol. Methods 69, 161–173. doi: 10.1016/j.mimet.2006.12.018
Quast, C., Pruesse, E., Yilmaz, P., Gerken, J., Schweer, T., Yarza, P., et al. (2013). The SILVA ribosomal RNA gene database project: improved data processing and web-based tools. Nucleic Acids Res. 41, D590–D596. doi: 10.1093/nar/gks1219
Řeháková, K., Chlumská, Z., and Doležal, J. (2011). Soil cyanobacterial and microalgal diversity in dry mountains of Ladakh, NW Himalaya, as related to site, altitude, and vegetation. Microb. Ecol. 62, 337–346. doi: 10.1007/s00248-011-9878-8
Roy, R., Klueber, H. D., and Conrad, R. (1997). Early initiation of methane production in anoxic rice soil despite the presence of oxidants. FEMS Microbiol. Ecol. 24, 311–320. doi: 10.1111/j.1574-6941.1997.tb00448.x
Sakai, S., Imachi, H., Hanada, S., Ohashi, A., Harada, H., and Kamagata, Y. (2008). Methanocella paludicola gen. nov., sp. nov., a methane-producing archaeon, the first isolate of the lineage “Rice Cluster I,” and proposal of the new archaeal order Methanocellales ord. nov. Int. J. Syst. Evol. Microbiol. 58, 929–936. doi: 10.1099/ijs.0.65571-0
Scavino, A. F., Ji, Y., Pump, J., Klose, M., Claus, P., and Conrad, R. (2013). Structure and function of the methanogenic microbial communities in Uruguayan soils shifted between pasture and irrigated rice fields. Environ. Microbiol. 15, 2588–2602. doi: 10.1111/1462-2920.12161
Shindell, D. T., Faluvegi, G., Koch, D. M., Schmidt, G. A., Unger, N., and Bauer, S. E. (2009). Improved attribution of climate forcing to emissions. Science 326, 716–718. doi: 10.1126/science.1174760
Sjoeling, S., and Cowan, D. A. (2003). High 16S rDNA bacterial diversity in glacial meltwater lake sediment, Bratina Island, Antarctica. Extremophiles 7, 275–282. doi: 10.1007/s00792-003-0321-z
Soule, T., Anderson, I. J., Johnson, S. L., Bates, S. T., and Garcia-Pichel, F. (2009). Archaeal populations in biological soil crusts from arid lands in North America. Soil Biol. Biochem. 41, 2069–2074. doi: 10.1016/j.soilbio.2009.07.023
Stamatakis, A. (2006). RAxML-vi-hpc: maximum likelihood-based phylogenetic analyses with thousands of taxa and mixed models. Bioinformatics 22, 2688–2690. doi: 10.1093/bioinformatics/btl446
Steinberg, L. M., and Regan, J. M. (2008). Phylogenetic comparison of the methanogenic communities from an acidic, oligotrophic fen and an anaerobic digester treating municipal wastewater sludge. Appl. Environ. Microbiol. 74, 6663–6671. doi: 10.1128/AEM.00553-08
Steven, B., Gallegos-Graves, L. V., Yeager, C. M., Belnap, J., Evans, R. D., and Kuske, C. R. (2012). Dryland biological soil crust cyanobacteria show unexpected decreases in abundance under long-term elevated CO2. Environ. Microbiol. 14, 3247–3258. doi: 10.1111/1462-2920.12011
West, A. E., and Schmidt, S. K. (2002). Endogenous methanogenesis stimulates oxidation of atmospheric methane in alpine tundra soil. Microb. Ecol. 43, 408–415. doi: 10.1007/s00248-001-1049-x
Zinder, S. H. (1993). “Physiological ecology of methanogens,” in Methanogenesis: Ecology, Physiology, Biochemistry and Genetics, ed J. G. Ferry (London: Chapmann and Hall), 128–208.
Appendix
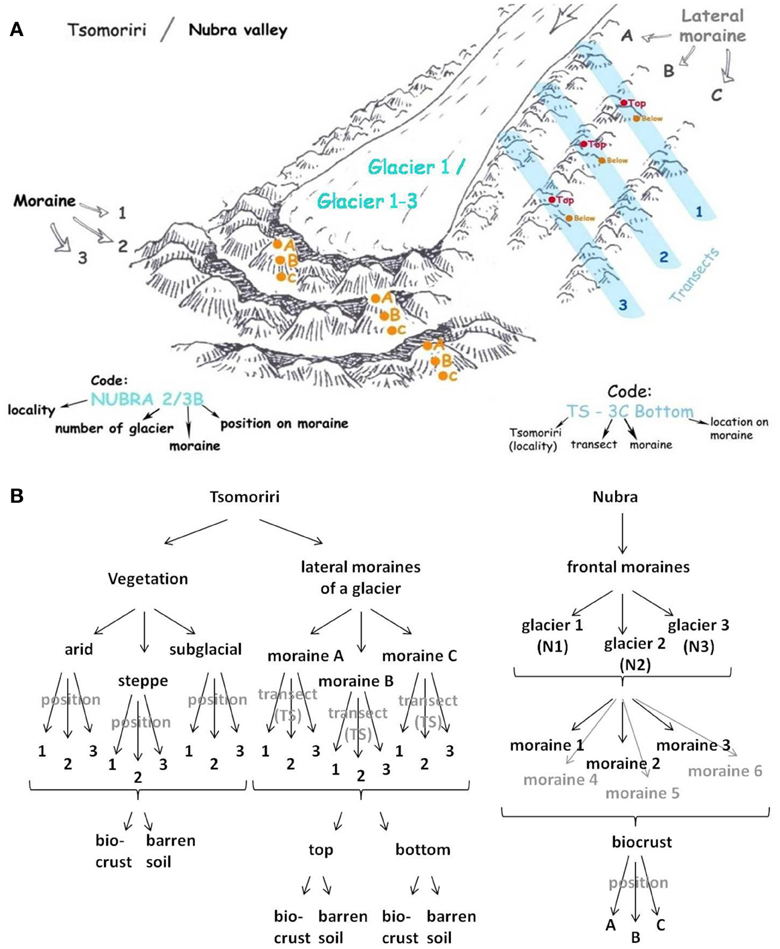
Figure A1. (A) Schematic depiction of the location of sampling sites along a glacier and code of sample denotation. (B) Overview of soil samples taken at different positions at Tsomoriri and Nubra. In Tsomoriri samples of matured soil were taken from three vegetation belts and of young soil from the lateral moraines of a glacier. In Nubra young soil samples were collected from the frontal moraines of three different glaciers.
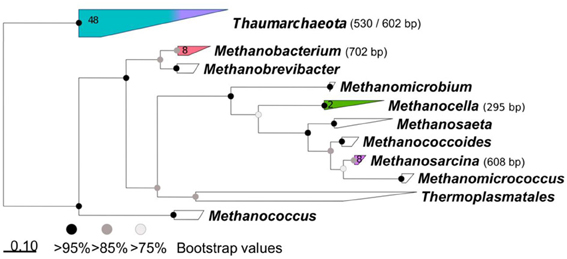
Figure A2. Archaeal 16S rRNA phylogenetic tree. Maximum likelihood phylogenetic tree based on aligned partial 16S rRNA gene sequences obtained from clones from four incubated soil samples. Clusters containing sequences obtained in this study are shown in colors. The length of the terminal restriction fragment is indicated in brackets. The number of sequences obtained is indicated in each cluster. Scale bar: substitutions per base.
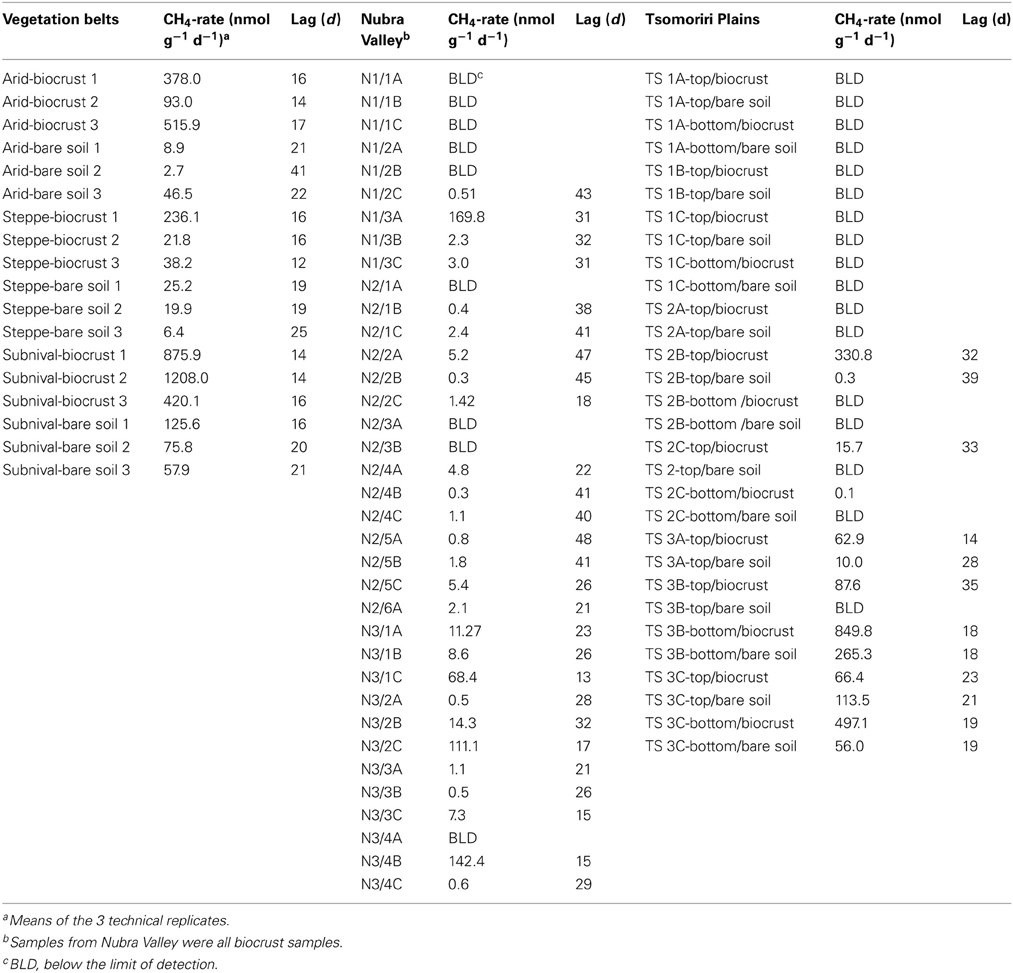
Table A1. Methane production rates and lag times of all samples.
Keywords: methanogens, desert ecosystems, cold climate, deglaciations, cyanobacteria, biological soil crust, high-altitude ecosystem, stable carbon isotope
Citation: Aschenbach K, Conrad R, Řeháková K, Doležal J, Janatková K and Angel R (2013) Methanogens at the top of the world: occurrence and potential activity of methanogens in newly deglaciated soils in high-altitude cold deserts in the Western Himalayas. Front. Microbiol. 4:359. doi: 10.3389/fmicb.2013.00359
Received: 13 September 2013; Accepted: 12 November 2013;
Published online: 03 December 2013.
Edited by:
Eoin L. Brodie, Lawrence Berkeley National Laboratory, USAReviewed by:
Hinsby Cadillo-Quiroz, Arizona State University, USAKuk-Jeong (Kuki) Chin, Georgia State University, USA
Copyright © 2013 Aschenbach, Conrad, Řeháková, Doležal, Janatková and Angel. This is an open-access article distributed under the terms of the Creative Commons Attribution License (CC BY). The use, distribution or reproduction in other forums is permitted, provided the original author(s) or licensor are credited and that the original publication in this journal is cited, in accordance with accepted academic practice. No use, distribution or reproduction is permitted which does not comply with these terms.
*Correspondence: Roey Angel, Max Planck Institute for Terrestrial Microbiology, Karl-von-Frisch-Strasse 10, D-35043 Marburg, Germany e-mail: angel@microbial-ecology.net
†Present address: Roey Angel, Division of Microbial Ecology, University of Vienna, Vienna, Austria