 Pádhraig Madden1
 Abdul M. Al-Raei2Anne M. Enright1†Fabio A. Chinalia3†
 Dirk de Beer2
 Vincent O'Flaherty1,4
 Gavin Collins1,4,5*
- 1Microbiology, School of Natural Sciences, National University of Ireland Galway, Galway, Ireland
- 2Department of Biogeochemistry, Max Planck Institute for Marine Microbiology, Bremen, Germany
- 3Centre for Resource Management and Efficiency, School of Applied Science, Cranfield University, Bedfordshire, UK
- 4Ryan Institute for Environmental, Marine and Energy Research, National University of Ireland Galway, Galway, Ireland
- 5Infrastructure and Environment, School of Engineering, University of Glasgow, UK
The effect of sulfate addition on the stability of, and microbial community behavior in, low-temperature anaerobic expanded granular sludge bed-based bioreactors was investigated at 15°C. Efficient bioreactor performance was observed, with chemical oxygen demand (COD) removal efficiencies of >90%, and a mean SO2−4 removal rate of 98.3%. In situ methanogensis appeared unaffected at a COD: SO2−4 influent ratio of 8:1, and subsequently of 3:1, and was impacted marginally only when the COD: SO2−4 ratio was 1:2. Specific methanogenic activity assays indicated a complex set of interactions between sulfate-reducing bacteria (SRB), methanogens and homoacetogenic bacteria. SO2−4 addition resulted in predominantly acetoclastic, rather than hydrogenotrophic, methanogenesis until >600 days of SO2−4-influenced bioreactor operation. Temporal microbial community development was monitored by denaturation gradient gel electrophoresis (DGGE) of 16S rRNA genes. Fluorescence in situ hybridizations (FISH), qPCR and microsensor analysis were combined to investigate the distribution of microbial groups, and particularly SRB and methanogens, along the structure of granular biofilms. qPCR data indicated that sulfidogenic genes were present in methanogenic and sulfidogenic biofilms, indicating the potential for sulfate reduction even in bioreactors not exposed to SO2−4. Although the architecture of methanogenic and sulfidogenic granules was similar, indicating the presence of SRB even in methanogenic systems, FISH with rRNA targets found that the SRB were more abundant in the sulfidogenic biofilms. Methanosaeta species were the predominant, keystone members of the archaeal community, with the complete absence of the Methanosarcina species in the experimental bioreactor by trial conclusion. Microsensor data suggested the ordered distribution of sulfate reduction and sulfide accumulation, even in methanogenic granules.
Introduction
The application of anaerobic digestion (AD) is an efficient approach for the treatment of high-strength organic wastewater (Yu et al., 2005a). AD does not require costly aeration and is thus considered more sustainable than aerobic systems (Rittmann and McCarty, 2001). Moreover, anaerobic systems generate re-usable biogases and significantly less nuisance, excess sludge (Yu et al., 2005a). Furthermore, low-temperature (>20°C) AD (LtAD) has been demonstrated as a feasible approach for wastewater treatment (e.g., Connaughton et al., 2006; Akila and Chandra, 2007; Enright et al., 2009), allowing for further efficiencies by eliminating the need to heat AD bioreactors, and opening AD to new areas of environmental management, including for the digestion of raw sewage in temperate climates (Lew et al., 2004).
AD has also been applied in the treatment of sulfate-rich wastewaters. Many industrial processes that use sulfuric acid (e.g., fermentation or seafood processing); or reduced sulfur compounds i.e., sulfide (e.g., in tanneries, kraft pulping), sulfite (e.g., sulfite pulping), thiosulfate (e.g., fixing of photographs) or dithionite (e.g., pulp bleaching) generate sulfate-contaminated wastewaters (Hulshoff Pol et al., 1998).
In the absence of oxygen, sulfate-reducing bacteria (SRB) use sulfate as electron acceptor in the oxidation of an energy substrate with the production of hydrogen sulfide (H2S; Boshoff et al., 2004). Sulfate-rich wastewaters stimulate SRB growth, which can out-compete methanogens for substrates (e.g., H2, CO2 and acetate) in anaerobic environments (Kristjanson et al., 1982; Schonheit et al., 1982), such as in AD bioreactors. Furthermore, SRB consume hydrogen below a minimum threshold for hydrogen metabolism by methanogens (Lovley, 1985; Lovley and Ferry, 1985). Thus, sulfate reduction can impair methane production in wastewater treatment systems.
A particular problem arising from SRB activity is H2S production (Koschorreck, 2008). H2S is a potentially toxic gas, which is an industrial and municipal nuisance due to its flammability, as well as the corrosive effect on steel and concrete owing to sulfuric acid generation. Additionally, there is a negative effect on microbial cells due to the precipitation of essential trace metals as metal sulfides. Moreover—though depending on the charge of the sulfide ion—H2S can have a toxic effect on cellular mechanics as neutrally-charged H2S can be transported across the cell membrane, thus increasing the potential for toxicity (Tursman and Cork, 1989; Moosa and Harrison, 2006).
The impact of sulfate ions on AD has been investigated using specific methanogenic activity (SMA) assays and toxicity assays. For instance, O'Flaherty et al. (1998a,b) found competition between SRB and methanogens for available substrates, as well as impaired methanogenesis due to sulfide toxicity, which resulted in reduced methane production. In any case, sulfide toxicity is unlikely to be de-coupled from competition between SRB and methanogens, and due to their more favorable growth and thermodynamic properties, SRB are considered to out-compete other anaerobes in the presence of excess sulfate. O'Flaherty and Colleran (1999), O'Flaherty et al. (1999), and Pender et al. (2004) showed that acetoclastic methanogenesis was the most susceptible reaction to H2S inhibition. The outcome of the competition is important, as it determines the relative concentrations of biogas sulfide and methane (Hulshoff Pol et al., 1998). The chemical oxygen demand (COD): SO2−4 ratio in the influent wastewater is also important. For wastewater with a COD: SO2−4 ratio of 0.66, there is theoretically sufficient sulfate available to SRB to completely remove the organic matter (Rinzema and Lettinga, 1988); however, for lower COD: SO24 ratios, the organic matter is insufficient for complete SO2−4 reduction. Similarly, for wastewaters with higher COD: SO2−4 ratios, complete removal of organic matter can only be achieved with concomitant methanogenesis and sulfidogenesis (Omil et al., 1997).
In this study, expanded granular sludge bed (EGSB) bioreactors were used to investigate SRB activity in low-temperature anaerobic digesters. The impact of sulfate contamination on methanogenesis, as well as on community structure, and the distribution and abundance of SRB functional genes, was assessed at different COD: SO2−4 ratios.
Materials and Methods
Source of Biomass
Anaerobic sludge was obtained from a full-scale, granular biomass nursery plant operated at 30°C in the Netherlands (Paques B.V.). The sludge consisted of well-settling, green-gray granules (Ø, 0.5–3 mm) with a volatile suspended solids (VSS) content of 73 g l−1.
Bioreactor Design and Operation
Two glass, laboratory-scale (3.8 l active volume), hybrid, expanded granular sludge bed-anaerobic filter (EGSB-AF) bioreactors (R1 and R2), which were of the same design as described by McHugh et al. (2004), were used for this study. A total mass of 73 g VSS of the sludge was used to seed each bioreactor. R1 and R2 were each fed a synthetic wastewater (pH 7.25 ± 0.2) consisting of acetate, propionate, butyrate, ethanol and glucose in the COD ratio of 1:1:1:1:1, to a total of 5 g COD l−1. The influent was buffered with NaHCO3 (8 g l−1) and fortified, as described by Shelton and Tiedje (1984), with macro- (10 ml l−1) and micro- (1 ml l−1) nutrients. The trial was accordingly divided into five experimental periods (P1-P5), as indicated in Table 1 and Figure 1, where operating parameters of all bioreactors are outlined.
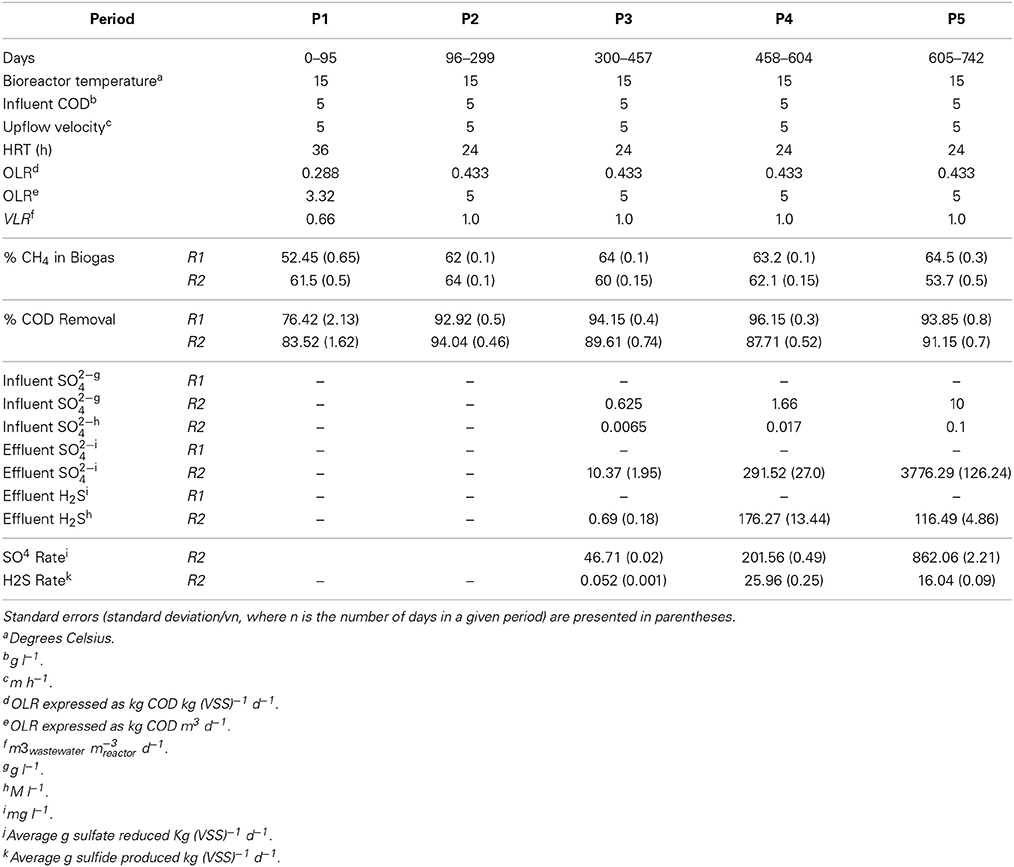
Table 1. Operational periods, and associated parameters, of R1+2.
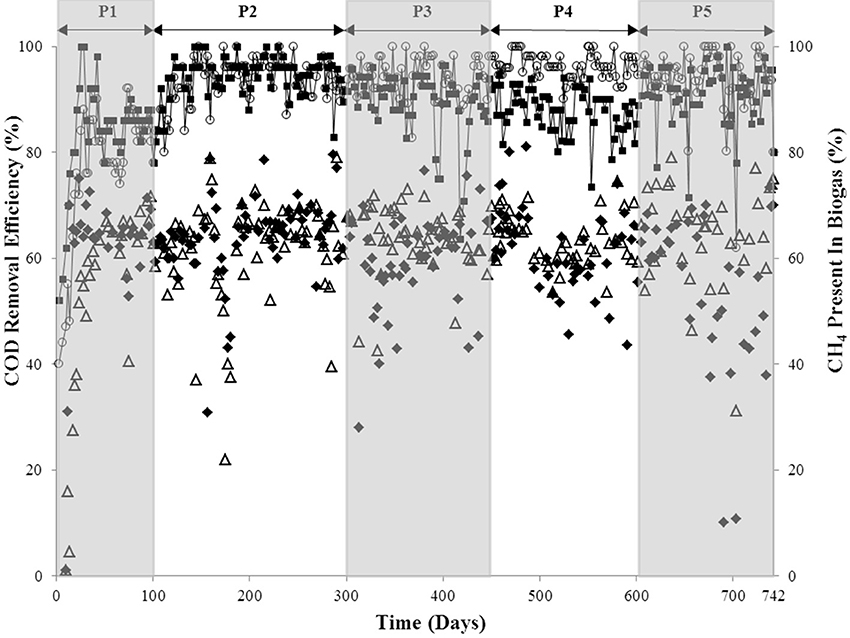
Figure 1. COD removal efficiency of R1 (◦) and R2 (■); and biogas methane concentrations of R1 (△) and R2 (♦) over each of the five periods (P1–P5).
Routine Analytical Techniques
Samples of bioreactor effluent and biogas were routinely sampled to determine concentrations of COD and methane, respectively, according to Standard Methods (APHA, 1998). Residual sulfate concentrations and sulfide production were routinely (average, 4 times per week) determined using a colorimetric spectrophotometer (HACH, Colorado, USA).
Determination of Sulfidogenic Rates
The rate of R2 sulfate reduction (SRR) was calculated for P3, P4, and P5 as a function of the VSS content (kg) of the bioreactor, which was based on the measured VSS concentration (g/100 ml) of typical granules sampled from R2 on days 304, 449, 605, and at the conclusion of the trial. The rate of R2 sulfide production (SPR) was calculated similarly.
DNA Extraction and PCR-Amplification
A DNA extraction protocol (Griffiths et al., 2000) was applied for the recovery of total genomic DNA from sludge granules (0.5 g) sampled from the sludge bed of R1 and R2 on days 0 (seed sludge), 136 (P2), 304 (P3), 356 (P3), 455 (P3), 515 (P4), 602 (P4), and 742 (P5). 16S rRNA gene fragments were amplified using the Archaea-specific primer set A751F and UA1204R (Baker et al., 2003), and the Bacteria-specific primer set EB341F and UN517R (Muyzer et al., 1993). PCR-amplification of the archaeal and bacterial 16S rRNA genes was performed as described in detail by Madden et al. (2010). Dissimilatory sulfite reductase ß-subunit (dsrB) gene fragments were amplified using dsrB-specific primers DSRp2060F (Geets et al., 2006) and DSR4R (Wagner et al., 1998) to yield a dsrB gene fragment of ~350 bp. A 40-base-pair GC-clamp (Muyzer et al., 1993) had been added to the 5′-end of A751F, EB341F, and DSRp2060F. PCR assays, including no-template controls, using dsrB primers were performed in 50-μl reactions containing: ~200 ng of template DNA, 12.5 pmol of each primer, 1.5 mmol MgCl2, 5 μl 1× NH4 reaction buffer [16 mM (NH4)2SO4, 67 mM Tris-HCl (pH 8.8 at 25°C), 0.01% Tween-20], 500 nmol dNTP (125 nmol of each of dATP, dCTP, dGTP, and dTTP) and 2 U Taq DNA polymerase (Bioline, London, UK). The dsrB PCR conditions were: denaturation at 94°C for 3 min; 9 cycles of denaturation at 94°C for 30 s, annealing of primers at 60°C for 30 s (−1°C at each cycle) and extension at 72°C for 45 s; this was then followed by 24 cycles of denaturation at 94°C for 30 s, annealing of primers at 55°C for 30 s and extension at 45°C for 45 s. Final extension at 72°C was for 7 min.
DGGE and Analysis of 16S rRNA and dsrB Gene Fragments
Community-based patterns were generated by denaturing gradient gel electrophoresis (DGGE) of archaeal and bacterial 16S rRNA, and dsrB, gene PCR products. Polyacrylamide gels (8% [w/v]; thickness, 1 mm) with a denaturing gradient consisting of 30–60% urea-formamide for archaeal and dsrB samples, or 30–70% urea-formamide for bacterial samples, were used. DGGE was performed, and bands were excised and re-amplified, as described in detail by Madden et al. (2010). PCR amplicons from excised bands were sequenced by MWG (UK) using Sanger sequencing technology. Gene sequences from this study were deposited in Genbank under accession numbers FJ535442-FJ535447 for Archaea, FJ535448-FJ535456 for Bacteria and FJ535457-FJ535466 for dsrB genes (Table 2), with the following nomenclature and generic prefixes: ARC-PM1, ARC-PM2 and ARC-PM4 to ARC-PM7 for archaeal sequences; B1-PM to B6-PM and B10-PM to B12-PM for bacterial sequences; and SRB1-PM to SRB-PM10 for dsrB sequences (Table 2). DGGE data were analyzed as described by Madden et al. (2010).
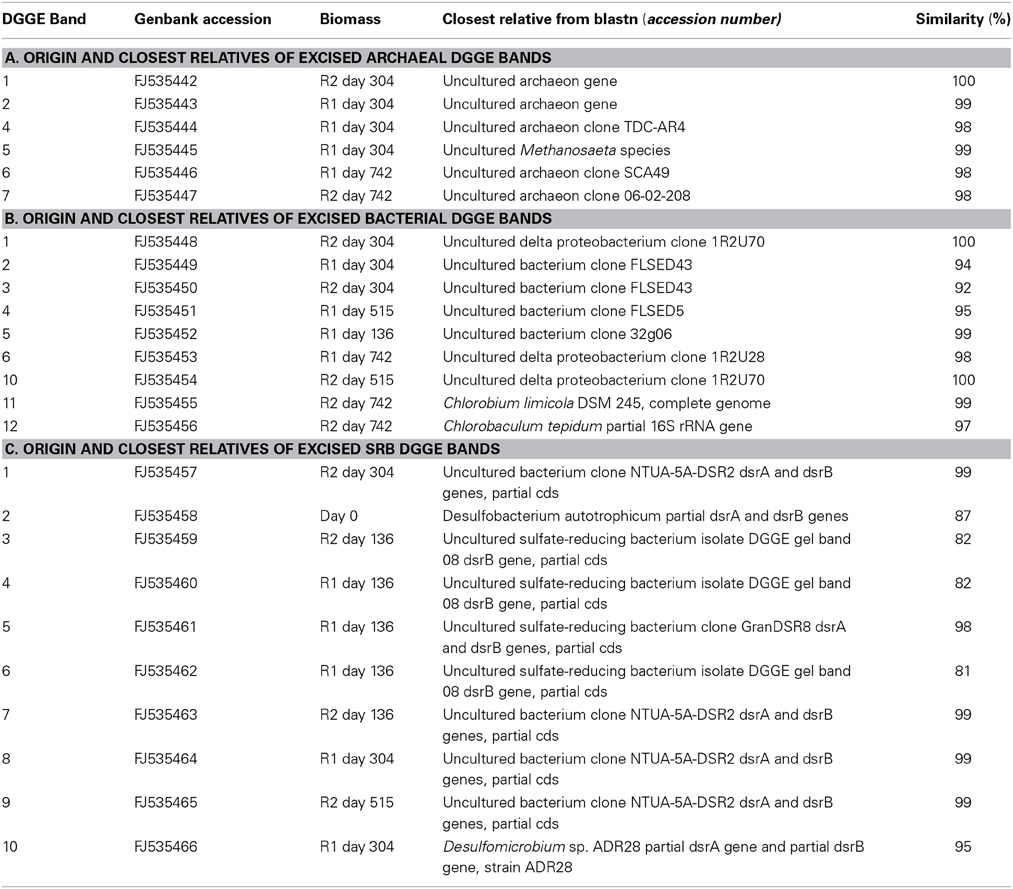
Table 2. Origin and closest relatives of excised DGGE bands.
Real-Time PCR Analysis
Quantitative, real-time PCR assays were performed using a LightCycler 480 (Roche, Mannheim, Germany). Four methanogenic primer and probe sets (Yu et al., 2005b; Lee et al., 2009), specific for two orders (Methanomicrobiales and Methanobacteriales) and two families (Methanosaetaceae and Methanosarcinaceae) were used (Table 3). One bacterial primer and probe set was also used (Yu et al., 2005b; Lee et al., 2009). Archaeal and bacterial reaction mixtures were prepared as described by O'Reilly et al. (2010).
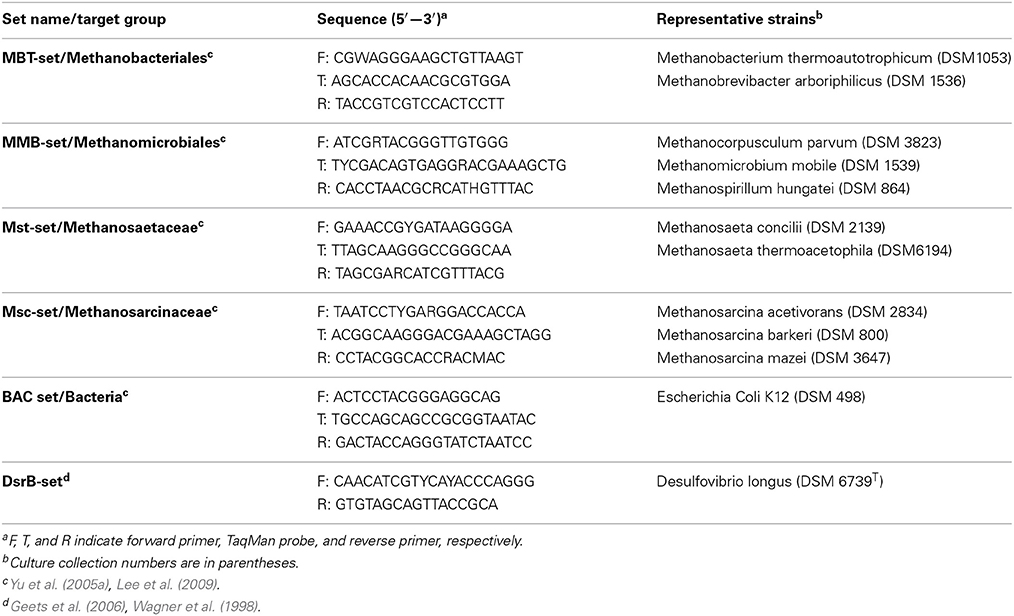
Table 3. Characteristics of the real-time PCR primer and probe sets used in this study.
The dsrB reaction mixtures were prepared using the LightCycler 480 SYBR Green I Master kit (Roche): 3 μl of PCR-grade water, 10 μl of SYBR green reaction solution (final conc. 200 nM), 1 μl of each primer (final conc. 500 nM), and 5 μl of DNA template. The amplification consisted of 45 cycles, with 1 cycle of denaturation (95°C for 40 s), annealing (55°C for 40 s), and elongation (72°C for 1 min).
Quantitative standard curves were constructed using the standard plasmids containing the full-length 16S rRNA gene sequences from the representative strains of the target methanogenic and bacterial groups as previously described (Yu et al., 2005b; Lee et al., 2009). Desulfovibrio longus 6739T (Magot et al., 1992), grown up in desulfovibrio medium no. 63 (DSMZ), was used as a source of dsrB gene sequences. Standard curves and analysis were performed as described by O'Reilly et al. (2010).
Specific Methanogenic Activity (SMA) Assays
SMA assays were performed as described by Colleran et al. (1992) and Coates et al. (1996) using the seed inoculum and granular biomass samples recovered from the bioreactors at days 449, 605 and at the conclusion of the experiment (Table 4). The substrates tested, and the concentrations used, were acetate (30 mM), butyrate (15 mM), propionate (30 mM), ethanol (30 mM), and H2/CO2 (80:20 v/v), as described in greater detail by Collins et al. (2003). All tests were performed with and without the addition of sulfate (Table 4).
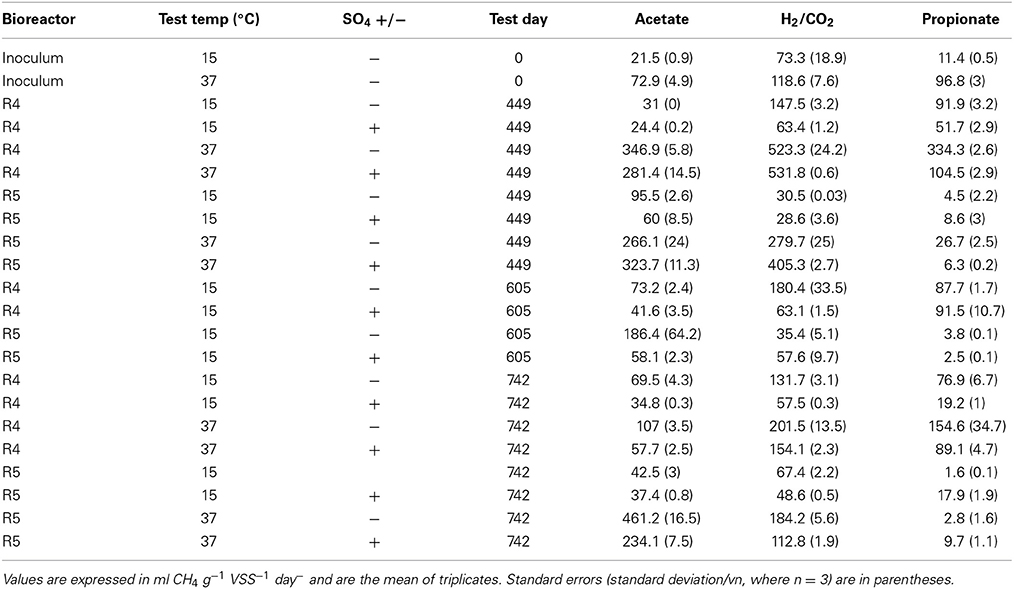
Table 4. SMA data for seed sludge and temporal biomass from R4 and R5.
Microsensor Measurements
Microsensor analysis was applied to study granules from both bioreactors on day 625 and at the conclusion of the trial (day 742). Single granules were stacked on top of each other in glass capillary tubes (Ø, 10 mm; height, 180 mm), which were sealed at the base. The stack of granules was then completely immersed in anaerobic medium. Anaerobic conditions were maintained by continuous bubbling of the mixture with argon gas, and the apparatus was placed in a 15°C water bath to simulate, as closely as possible, the distribution, and physico-chemical conditions, of anaerobic granules in the bioreactors. After incubation for 24 h, microprofiles were recorded by penetrating the granules with microsensors in increments of 20 or 50 μm and at time intervals of 10 or 20 s. A dissection microscope was used to monitor complete microsensor penetration into each individual granule.
Hydrogen sulfide microsensors
Sulfide concentration profiles were measured with H2S microsensors (Jeroschewski et al., 1996; Kuhl et al., 1998) with a tip diameter of 30 μm and a 90% response time of <0.5 s. The microsensors were calibrated in accordance with the colorimetric methylene blue method (Fonselius et al., 1999). The concentration of total dissolved sulfide (H2S + HS− + S2−) in the dilution series was determined by spectrophotometry (Cline, 1969). Calibration was performed in a medium of the same pH as the granules and incubation medium; therefore no pH correction was necessary. The sensor showed a linear response to H2S concentrations of up to 1000 μM and the detection limit of the microsensors was 1 μM total sulfide.
Sulfate microsensors
The sulfate microsensor used was a liquid-ion exchange (LIX) microelectrode. The filling electrolyte used was 300 mM KCl. The filling solution was degassed under vacuum and filtered through a 0.2-μm-pore-size Millipore membrane. The silanized capillaries were filled with electrolyte by using a plastic syringe drawn in a flame to a 0.1-mm tip; applying pressure from the back pushed out the air pocket that typically was left in the tip. Then, under microscopic inspection, the tips were dipped in LIX and suction was applied until a membrane with a thickness of 300 μm was introduced. The capillary was left for at least 2 h, during which the tetrahydrofuran evaporated and a solid ion-selective membrane was a formed in the tip.
pH Microsensors
The pH sensor used was a LIX microelectrode. pH sensors were constructed from raw glass capillaries following the procedure of de Beer et al. (1997) described for nitrite microsensors.
Granule Fixation, Sectioning and Fluorescence in situ Hybridization
Granules were fixed by overnight incubation in paraformaldehyde [4% (w/v) in 1× phosphate-buffered saline (PBS)] at 4°C. After washing three times in 1× PBS, fixed granules were incubated in an OCT freezing medium (Sakura Finetek USA, Torrance, Calif.) at 4°C overnight. Embedded granules were then sectioned and prepared for hybridizations as described by Sekiguchi et al. (1999).
The protocols described by Sekiguchi et al. (1999) and Schramm et al. (1998) were used for FISH experiments. Probes were synthesized and labeled with a hydrophilic sulfoindocyanide dye (Cy3 or Cy5) by Interactiva GmbH (Ulm, Germany) (Table 5). Microscopy was with a Nikon Y-FL epifluorescence microscope and Nikon E300. All images were captured using a Qi-camera and QImaging software (QImaging, BC, Canada).
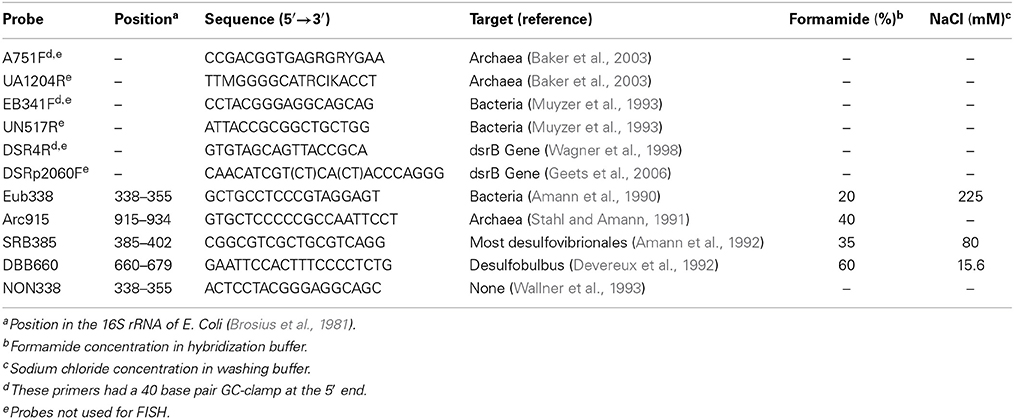
Table 5. Oligonucleotide probes used for PCR and FISH analysis.
Results
Bioreactor Performance and Response to Sulfate Addition
A start-up period of ~20–25 days was observed, after which, the COD removal efficiency of both bioreactors was 80–90% (P1; Figure 1). The shortened HRT (from 36 to 24 h) in P2 resulted in improved COD removal (P2; Figure 1). On day 300, sulfate was added to the influent of R2 at a COD:SO2−4 ratio of 8:1 but no difference in the performance of R1 and R2 was detected until day 392, and again at day 418, when reduced R2 COD removal efficiency (to 75 and 64%) was observed (P3; Figure 1). Nonetheless, after a recovery period (of 7 days in both examples), R2 COD removal efficiency returned to ~90%. The COD: SO2−4 ratio was decreased to 3:1 during P4, which resulted in reduced R2 COD removal. On average, R1 performed better than R2 during P4 (P4; Figure 1). Upon increasing the SO2−4 concentration for P5 (COD: SO2−4 ratio of 1:2), the average COD removal efficiency for R2 increased to 91%. This was comparable to R1, with an average COD removal efficiency of 94% (P5; Figure 1). With the exception of during P1, the R1 biogas methane concentration was consistently at 62–64% (average value each period). The concentration of R2 biogas methane, on the other hand, decreased during the final period to 54% (Figure 1).
Sulfate Reduction and Sulfide Production in Bioreactor Effluent
Throughout P3 (Table 1), an average of 98.3% of R2 influent sulfate was removed, with an average dissolved effluent sulfide concentration of 0.69 mg l−1.
On day 458 (beginning of P4), influent sulfate dosing was increased from 625 mg l−1 to 1660 mg l−1. The sulfate removal efficiency during P4 decreased to 82%. The average P4 effluent sulfide concentration was 176 mg l−1, which was a 255-fold increase of the P3 average concentration. Indeed, in one instance (day 593), the sulfide concentration was 320 mg l−1, which was almost twice the period average (Figure 2).
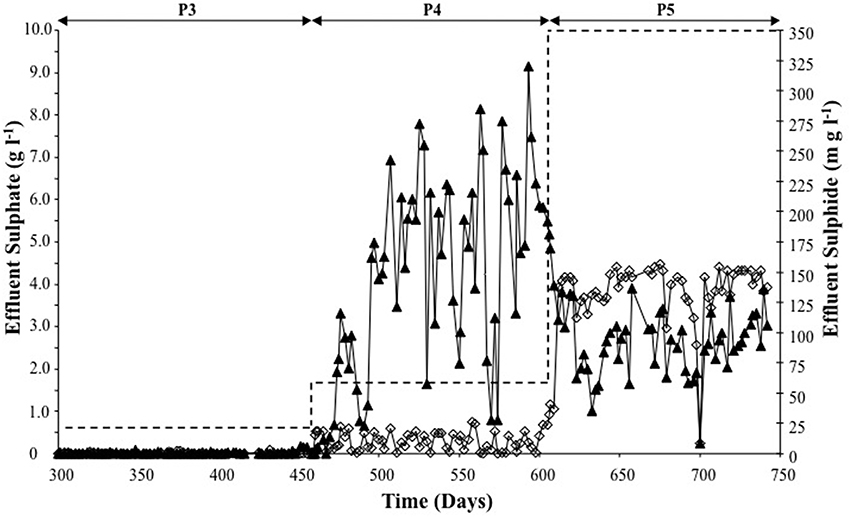
Figure 2. Sulfate reduction (▲) and sulfide production (◊) determined from analysis of R2 effluent for P3–P5 (during sulfate supply to R2). Dashed line represents R2 sulfate influent for each of the periods P3–P5.
The average sulfate removal efficiency during P5 decreased (to c. 63%) with increased sulfate dosing to the R2 influent (Figure 2). Despite the increased sulfate dosing during P5, reduced sulfide production (by 50%–116.5 mg l−1) was observed (Figure 2).
Sulfidogenic Rates
SRRs and SPRs are presented in Table 1. A steady increase in the SRR was observed from P3 through P5. The SPR increased from P3 to P4, but decreased in P5, which was in line with reduced effluent sulfide concentrations, indicating that the remaining sulfur was present a H2S.
Microbial Community Development
Changes in the microbial populations, as detected by DGGE analysis, were visualized by NMDS analysis because it avoids the assumption of linear relationships among variables and it is reported to be the most generally effective ordination method for ecological community data (McCune and Grace, 2002). Firstly, for the Archaea, a migration through all four quadrants for the control bioreactor (R1) occurred (Figure 3). Migration starts with the inoculum in the upper-right quadrant and moves down to the bottom-right quadrant for the next two samples (d 136, P2; and d 304, P3). Community succession is indicated by further movement to the bottom-left quadrant (days 356, 455); the top-left quadrant (days 515, 602); and, finally, at the top-right quadrant (the final sample on day 742), which was relatively close to the inoculum (Figure 3). However, in the case of R2, with the exception of one sample (d 304); only limited movement occurred between the two upper quadrants (Figure 3).
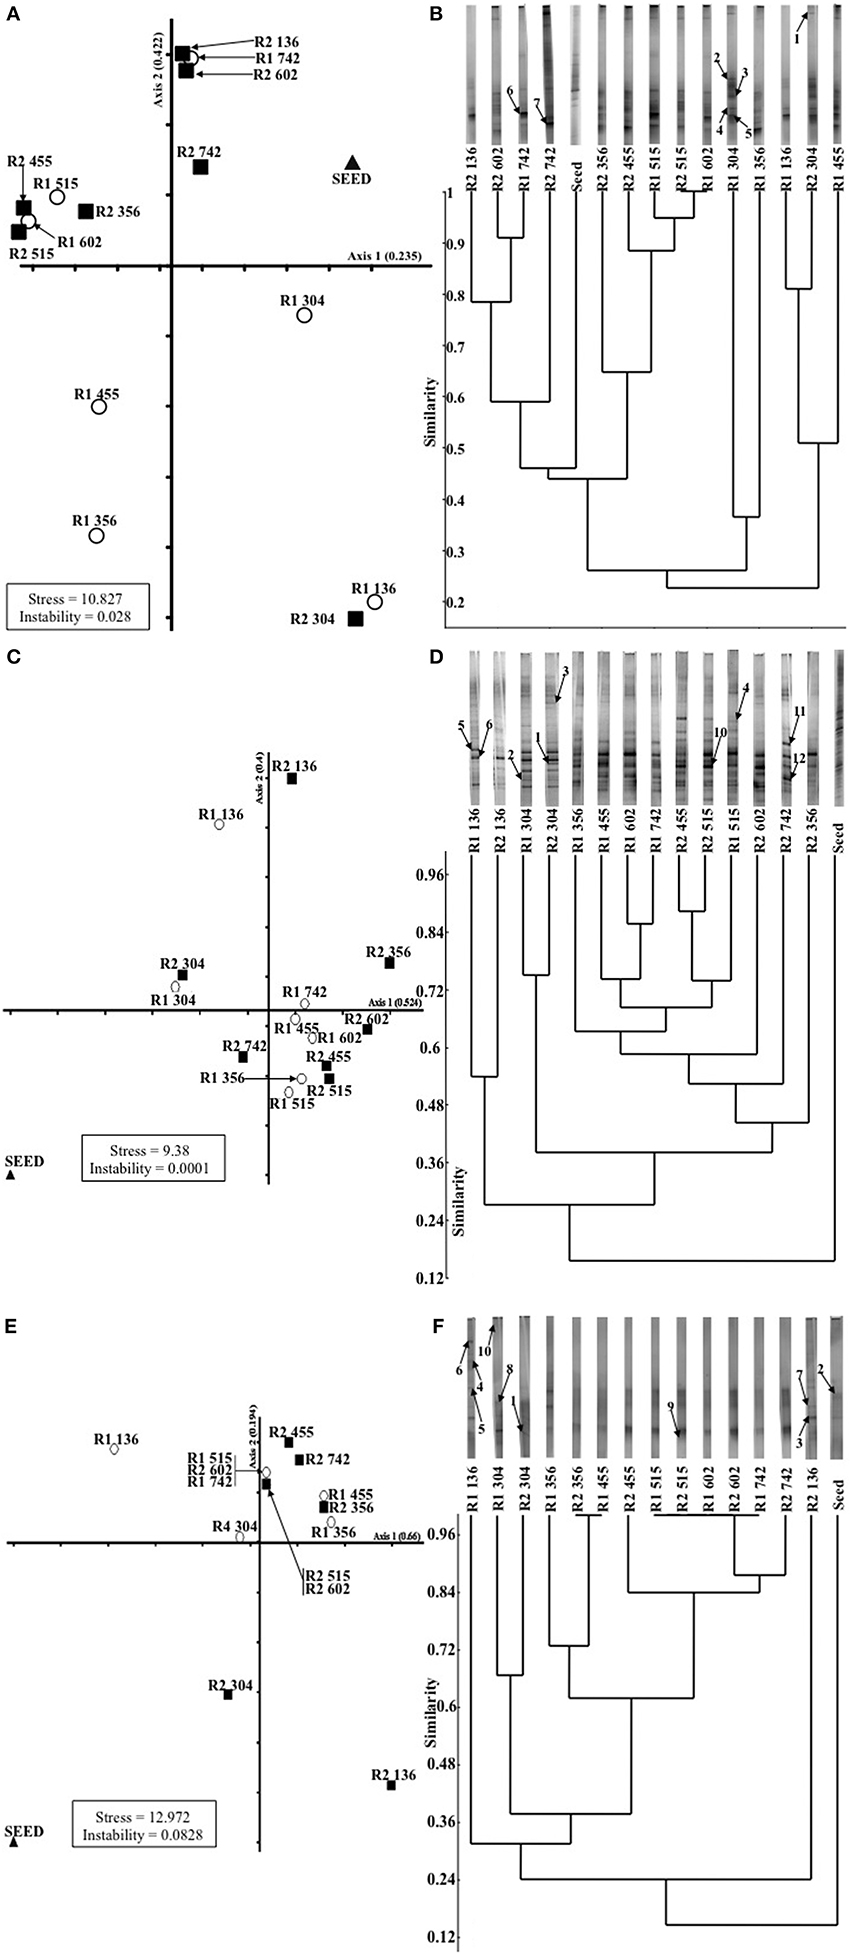
Figure 3. Non-metric multi-dimensional spacing (NMDS; A,C,E) analysis of (A) archaeal, (C) bacterial and (E) SRB DGGE profiles; and unweighted pair-group methods using arithmetic averages (UPGMA) dendrograms (B,D,F), with associated banding patterns, illustrating temporal analysis of (B) archaeal, (D) bacterial and (F) SRB populations. Excised bands from DDGE gels (as described in Table 3) are indicated by arrows.
For the bacteria, the plot indicated closely replicated R1 and R2 community structure prior to, and immediately after, the addition of sulfate to R2 influent (Figure 3; days 136, P2; and 304, P3). Based on samples from 56 days after the addition of sulfate, diverged bacterial communities were apparent. No discernable deviation was apparent for the remainder of P3 or during P4 (Figure 3). However, samples from the conclusion of the trial indicated diverged communities during the final period (Figure 3).
Finally, the greatest R1 and R2 similarity was in the plot of temporal dsrB gene fragments (Figure 3). Outside the inoculum, only two samples were outside the top-right quadrant of the plot (Figure 3).
Specific Methanogenic Activity (SMA) Assays
The SMA of the seed sludge against each of the substrates was higher when tested at 37°C than at 15°C (Table 4). Methanogenic activity was highest against H2/CO2 at both temperatures. In addition, activity was observed against propionate.
SMA assays at 15°C
On day 449 (P3), SMAs were, again, higher at 37°C than at 15°C against each substrate tested. In R1 biomass, methanogenic activity against H2, in tests performed without the addition of SO2−4, was doubled compared to the seed sludge. In fact, the pathway of methane production in R1 appeared to be through H2, irrespective of the presence of SO2−4. Nonetheless, the presence of SO2−4 in R1 assays did impair methane production (Table 4). In R2, on the other hand, the main route of methane production appeared to be through acetoclastic methanogenesis (Table 4). High activity on acetate, even after c. 150 d with SO2−4-contaminated influent in R2, points to the maintenance of an active acetoclastic methanogenic community. The presence of SO2−4 in the assays impaired acetoclastic activity but the presence of SO2−4 appeared to have little effect on methane production from H2/CO2. Finally, reduced propionate-degrading activity, compared with the seed sludge, was measured in R2 biomass, with and without SO2−4 amendment.
Assays on day 605 (P5) indicated that hydrogenotrophic methanogenesis dominated the R1 community. At the same time, the assays indicated further development of the acetoclastic SMA in R2, which was still impaired by SO2−4 addition in the assays. High activity on propionate was observed in R1 assays, but not in R2 biomass (Table 4).
By day 742, reduced methanogenic activity was observed against acetate in R1 and R2. Methanogenesis in R1 was still dominated by hydrogenotrophy and activity was still impaired with the addition of SO2−4. However, in R2 biomass, most of the methanogenic activity potential was routed through H2, for the first time during the trial (Table 4).
SMA assays at 37°C
SMAs were higher at 37°C than at 15°C against each substrate tested in P3 (Day 449), with the exception of SO2−4 amended R2 assays against propionate (Table 4). R1 assays indicated a H2-mediated methanogenic pathway, coupled with prominent propionate degradation. Similarly, R2 assays also indicated a dominant hydrogenotrophic methanogenic community. SO2−4 impairment of R2 biomass was only observed in propionate-fed assays, whereas acetate- and H2/CO2–fed SO2−4-amended assays performed better than the non-amended assays (Table 4).
On day 742 (P5), assays indicated decreased methanogenic activity compared to day 449. Nonetheless, H2-mediated methanogenesis appeared to still be the dominant pathway in R1. However, SO2−4 impairment was observed against each substrate in R1 assays (Table 4). R2 assays in P5 showed that acetoclastic methanogenesis was the main route for methanogenesis compared with day 449 (P3), when hydrogenotrophic methanogenesis appeared dominant. Furthermore, SO2−4 impairment was observed for two of the three substrates. Contrary to assays performed on day 449, the activity in the R2 SO2−4 amended, propionate-fed assays was greater than in non-amended assays (Table 4).
Analysis of Microsensor Measurements
The SO2−4 profile of a typical R1 sludge granule (Ø, ~2 mm), sampled on day 742, indicated the internal concentration ranged from ~4.45 mM at the surface to 4.0 mM at the center of the granule. As the microsensor continued through the granule, the sulfate concentration peaked again at 4.45 mM close to the bottom surface. R1 H2S profiles indicated concentrations between 2.75 μM at the outer layers and 22 μM at the core. Only a marginal reduction was observed in sulfide production as the microsensor moved through to the bottom surface. The R1 pH microsensor profile indicated only a slight decrease in pH, ranging from 8.52 at the edge to ~8.44 at the center.
The SO2−4 profile from a typical R2 granule (Ø, 1.1 mm; Figure 4), on day 742, indicated that the concentration ranged from 9.87 mM at the edge to 6.71 mM at the center (c. 0 μm). The sulfate concentration was marginally higher (6.9 μM) toward the bottom (+550 μm) surface (Figure 4). The R2 H2S profile indicated a sulfide production range of 183 μM at the outer layer to 226 μM at the center (0 μm). The sulfide concentration decreased, to 169.5 μM, as the sensor moved toward the bottom surface, which resulted in an “∩-shaped” profile (Figure 4). The R2 pH profile indicated a gradual, but continuous, increase as the microsensor moved through the granule (Figure 4).
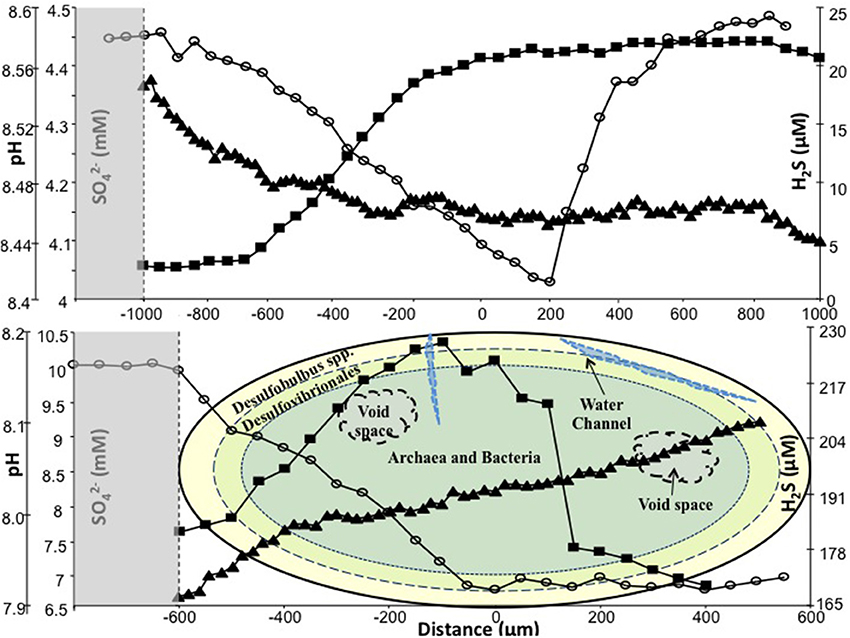
Figure 4. In situ SO4 (◦), H2S (■) and pH (▲) measured on day 742 using microsensors. Top: typical R1 granule; bottom: typical R2 granule, with illustration of microbial trophic zones. Shaded areas represent data from the external environment of the granules. Zero on the y-axis represents center of granule.
Fish Analysis
FISH revealed a multilayer structure of the granules, where both sulfate (R2) and non-sulfate (R1) granules displayed a similar microbial hierarchical structure. Dense microbial clusters, along with some void spaces, which possibly were water channels in the biofilm, were observed in all granules tested.
Using the group-specific oligonucleotide probes DBB 660 and SRB 385, sections of both R1 and R2 specimens on day 515 indicated that the SRB colonized the outer layers of the biofilm, either as dense, bright clusters along the edge, or as small spherical groups a little deeper into the granule (Figure 5). By day 304, Desulfobulbus spp. occurred sporadically as rod-like clusters (Figure 5A), whereas smaller spheres of Desulfovibrionales detected by the SRB 385 probe were ubiquitous in the sections examined (Figure 5A).
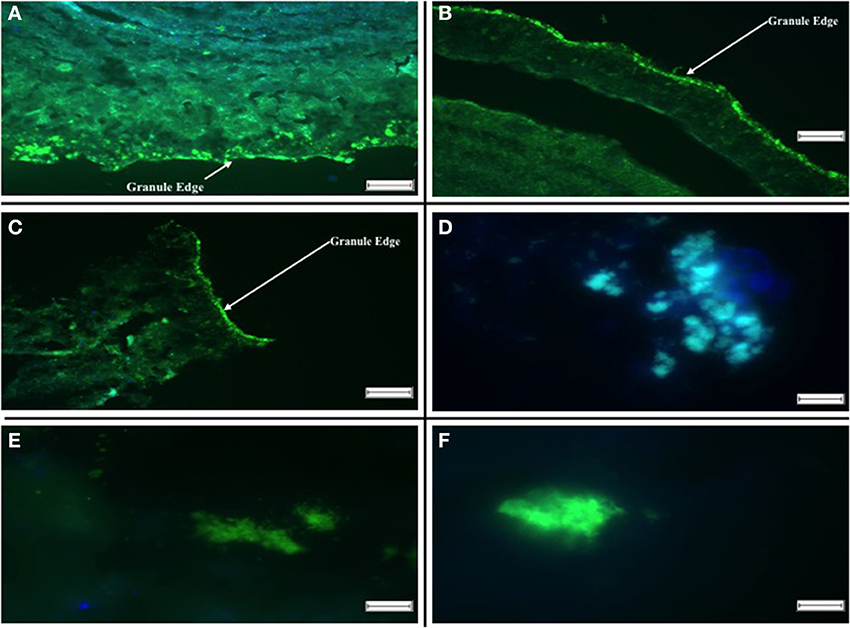
Figure 5. Fluorescent in situ Hybridizations illustrating localization of archaeal and SRB populations in aggregates. (A) R1 Day 515: Hybridization probes DBB 660 [green] and SRB 385 [blue]. (B) R2 Day 515: Hybridization probes DBB 660 [green] and SRB 385 [blue]. (C) R1 Day 602: Hybridization probes SRB 385 [green] and ARC 915 [blue]. (D) R2 Day 602: Hybridization probes DBB 660 [green] and ARC 915 [blue]. (E) R1 Day 742: Hybridization probes DBB 660 [green] and SRB 385 [blue]. (F) R2 742: Hybridization probes DBB 660 [green] and SRB 385 [blue]. The scale bar in (A–C) is 100 μm, and the arrows indicate the aggregate surface, the scale bar in (D–F) is 10 μm.
Hybridized sections using the same probes for day 742 on both R1 and R2 showed a similar result. The SRB predominantly colonized the outer edges of the granule. However, at the conclusion of the trial, larger and more abundant clusters of Desulfobulbus spp. were observed. In R2 granules, the SRB inhabited the outer layers of the granule, with archaea located closer to the center of the granule (Figure 5C). No SRB were detected in the core of either R1 or R2 granules.
qPCR Analysis
Of the methanogenic groups analyzed, the Methanosaetaceae were the dominant species in all of the samples from R1 and R2. As the trial progressed, more Methanosaetaceae were detected, whereas the concentration of Methanosarcinaceae genes decreased (Figure 6). For R2, on day 742, no Methanosarcinaceae targets were detected. The concentration of Methanobacteriales and Methanomicrobiales was similar throughout, with only marginally more Methanomicrobiales routinely detected, with the exception of on day 304 (Figure 6). Although sulfate was not present in R1 influent, comparable dsrB concentrations [~108 copies g(VSS)−1] were detected in R1 and R2 granules at each of the sampling dates (Figure 6).
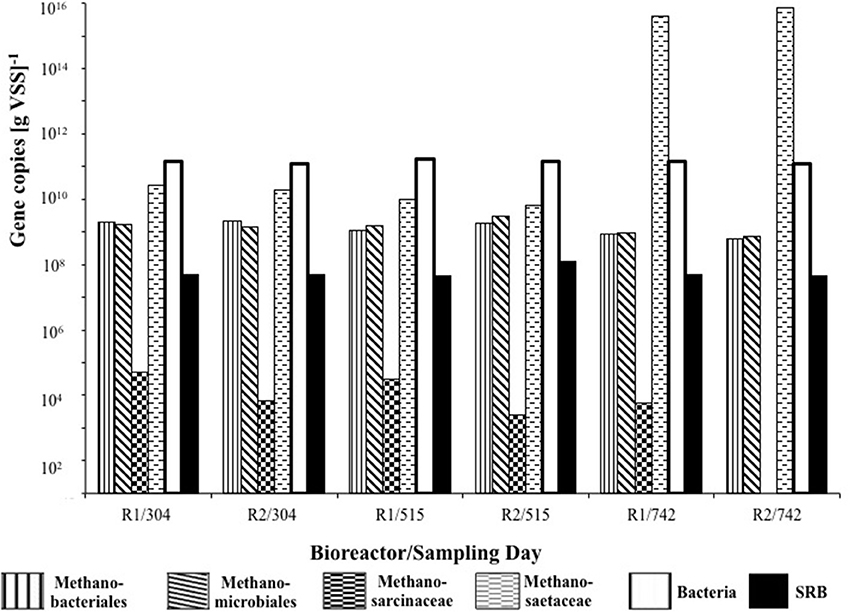
Figure 6. Quantitative changes in concentration of 16S rRNA genes of bacteria and four methanogenic groups, and in dsrB genes of sulfate-reducing bacteria.
Discussion
Bioreactor Performance
Low-temperature AD trials have previously demonstrated the potential of cold bioreactors for waste conversion (Collins et al., 2003; Enright et al., 2009; McKeown et al., 2012), including for the treatment of acidified, industrial wastewater similar to the feedstock used for this study (Nedwell and Reynolds, 1996; O'Flaherty and Colleran, 1999; O'Flaherty et al., 1999; Fukui et al., 2000). Similarly, successful COD removal (average, >80% efficiency) was achieved by both EGSB bioreactors in this study at 15°C during the start-up phase and throughout the trial. The impact of methanogenic and SRB activity on COD removal, and the interactions between methanogens and SRB, was apparent from bioreactor performance data. COD removal efficiency was not significantly different in R1 and R2, regardless of the presence of sulfate in the influent wastewater. The presence of sulfide indicated dissimilatory sulfate reduction by a sulfidogenic population. Based on the quality of the biogas produced, methanogenesis in the sulfate-amended bioreactor (R2) appeared to only be impacted during the final period (P5) of the bioreactor trial, when the COD: SO2−4 ratio was 1:2. Even then, the biogas methane concentration was reduced by only 10% compared with the periods before sulfate dosing. Although we do not present volumetric in situ methane yield data, and it is possible that methane production was depressed, the biogas quality data shown (Figure 1) indicate that methane concentrations were not diluted by sulfidogenic activity.
O'Flaherty et al. (1998a) and Pender et al. (2004) found that in mesophilic bioreactors treating sulfate-rich wastewaters, all of the methane produced originated from acetate, while H2 was consumed by the SRB. These divergent pathways for acetate and hydrogen utilization can facilitate methanogenic and SRB populations to avoid competitive scavenging for available substrates. Moreover, this strategy also avoids impeding the growth of either population. In situ COD removal efficiency and biogas methane quality data, however, cannot alone be directly used to address questions on methanogenic-SRB competition, or on sulfide toxicity, in bioreactors. SRB activity can impact methanogenesis directly—through competition for available substrates—or indirectly—through toxicity from by-products, such as hydrogen sulfide. Therefore, the investigations using batch incubations, which were assayed under a range of specific and targeted conditions, are valuable to elucidate interactions along the methanogenic pathway. The assays cannot support differentiation between sulfide inhibition and interspecies competition, as these are largely interdependent i.e., sulfide toxicity in this system will arise from competition provided by the SRB; instead the assays are used to assess the competitive pressure on methanogens from SRB, rather than specific toxicity.
Impact of Sulfate on Potential for Methanogenic Activity
The higher SMAs at 37°C than in 15°C assays was expected, owing to the mesophilic origin of the seed biomass. Generally, due to the scarcity of full-scale, low-temperature anaerobic digesters, the use of biomass from mesophilic AD systems to seed new, cold systems is a likely option in most countries, and was thus the approach taken in this experiment. Although the route of methane production in AD bioreactors is usually through acetoclastic methanogenesis (Scully et al., 2006; Akila and Chandra, 2007; Enright et al., 2009), several previous studies have also found biomass in which hydrogenotrophic methanogenesis was dominant (McHugh et al., 2003; Enright et al., 2005; O'Reilly et al., 2010), as was the case with the seed sludge—and in R1 biomass throughout the trial (Table 4).
The inhibition of hydrogenotrophic methanogenic activity in R1 (control) biomass at 15°C—and in 37°C assays by the conclusion of the trial—indicated the presence of, and competition from, SRB despite the absence of sulfate in R1 influent (Table 4). This was supported by DGGE fingerprinting, qPCR and FISH data (Figures 3, 5, 6).
Indeed, it has been observed that in the absence of sulfate, many SRB ferment organic acids and alcohols, producing hydrogen, acetate, and carbon dioxide, and may even rely on hydrogen- and acetate-scavenging methanogens to convert organic compounds to methane (Plugge et al., 2011). Furthermore, whilst sulfate reducers can also grow without sulfate, in some cases they grow only in syntrophic association with methanogens or other hydrogen-scavengers. Thus, sulfate reducers may compete with methanogens or grow in syntrophy with methanogens depending on the prevailing environmental conditions (Muyzer and Stams, 2008). The dominant methanogens in R1 appeared to be Methanosaeta-like organisms (Figure 6), which are acetoclastic and are characterized by high affinity for acetate. Under conditions of low prevailing concentrations of acetate, therefore, Methanosaeta will out-compete acetoclastic methanogens with a lower affinity for acetate, such as Methanosarcina. SRB may have contributed to the maintenance of a low prevailing acetate concentration in R1, such that the dominant methanogen was Methanosaeta.
Conversely, in R2, acetoclastic methanogenesis was the dominant route of methane production, at least at 15°C and at least until day 605 (Table 4). This may be due to a less active hydrogenotrophic methanogenic population owing to competition for H2 from SRB, or syntrophic SRB aligning with acetoclastic methanogens resulting in this population shift (Bryant et al., 1967; Schink, 1997; Stams and Plugge, 2009; Plugge et al., 2011). Nonetheless, and interestingly, the assays indicated that sulfate impaired acetoclastic methanogenesis in R2 biomass (Table 4), but the high activity in sulfate-free assays suggests that the toxicity and/or competition was easily reversed, and supports the evidence from DGGE experiments indicating the persistence of acetoclastic methanogens (Figure 3, Table 2).
The findings indicate that acetoclastic methanogenesis was impaired even when the COD: SO2−4 ratio in the R2 influent was 8:1. Although increased methanogenic activity was observed on acetate in R2 by day 605 (>300 d after SO2−4 introduction to R2 influent) it was still strongly impaired—up to 69%—by SO2−4, indicating continued competition from SRB at the lower COD: SO2−4 ratio at that time.
The data also identify a rather complex situation in R2: SMA against H2 in R2 assays was elevated with the addition of SO2−4. This condition is reflective of R2 in situ conditions. This may be due to inhibited homoacetogenic activity, and hence inhibited acetoclastic methanogenic activity, which provides an opportunity for hydrogenotrophic methanogens. For instance, it is widely accepted that H2-utilizing SRB out-compete hydrogenotrophic methanogens and homoacetogens because of their lower Km values (higher affinity) (Chaganti et al., 2012). This, in turn, indirectly points to a syntrophic SRB lifestyle in collaboration with hydrogenotrophic methanogens, similar to observations from marine sediments (Plugge et al., 2011).
By the conclusion of the trial, R2 assays (at 15°C) indicated reduced SMA on acetate and increased activity on H2, suggesting that the route of methane production had switched to predominantly hydrogenotrophic activity. Despite this, however, the hydrogenotrophic methanogens appeared outcompeted by SRB for H2.
Intriguingly, SMA on the indirect substrate, propionate, increased when SO2−4 was present in assays (at 15 and 37°C), which suggests that propionate oxidation, coupled with SO2−4 reduction provided methanogenic substrates, which were otherwise unavailable in the absence of sulfidogenesis. Thus, it appears that non-sulfate-reducing propionate-oxidizers—i.e., obligate hydrogen-producing acetogens—were less abundant or less active in R2 biomass.
Sulfate Impacts on Community Structure and Population Dynamics, but not on the Distribution of SRB, in Anaerobic Sludge Granules
The microbial communities of R1 and R2 diverged during the course of the trial, indicating that the addition of sulfate to R2 influent impacted community structure. Specifically, for example, Methanosarcina were undetected in R2 by the final sampling day. However, the physical distribution of microbial groups was not obviously different along the structure of the granular biofilms, with SRB clustering around the surface of sludge granules and with archaea located toward the core of the granules (Figure 5). During the trial, the abundance of dsrB genes was similar in R1 and R2, further indicating a persistent, background population of SRB even in the bioreactor without sulfate addition. Furthermore, little movement was observed in DGGE profile of the dsrB genes. However, the SRB populations detected by FISH experiments appeared to become more abundant in granules over the course of the trial. DGGE profiles and qPCR assays targeting the dsrB mRNA transcripts would provide greater insight; nonetheless, the FISH assays targeting rRNA from SRB do support the conclusion that, although a similar potential for sulfate reduction was present in R1 and R2 biomass, the active portion of the SRB community was more abundant in R2. Microsensor data supported the findings of FISH experiments, indicated an ordered distribution of sulfate reduction and the accumulation of sulfide in the low-temperature granules, as well as indicating the activity of SRB even in the previously unexposed R1 granules.
Conclusion
COD removal can proceed at 15°C in anaerobic digesters exposed to sulfate. In situ methane production appears impacted only at COD: SO2−4 ratios ≤1:2; thus, higher COD: SO2−4 ratios would appear to support biogas production in cold anaerobic digesters. Hydrogenotrophic methanogens in low-temperature anaerobic sludge granules were more sensitive to sulfate than acetoclastic methanogens, but complex interactions of SRB, methanogens and homoacetogenic bacteria appear to underpin COD removal by sulfate reduction and methanogenesis.
Conflict of Interest Statement
The authors declare that the research was conducted in the absence of any commercial or financial relationships that could be construed as a potential conflict of interest.
Acknowledgments
Pádhraig Madden was supported by a scholarship from the Irish Research Council. Gavin Collins is supported by a European Research Council (ERC) Starting Grant (‘3C-BIOTECH’; project no. 261330). Profs. Michael Böttcher and Tim Ferdelman, and Dr. Raeid Abed, are thanked for their insightful conversations.
References
Akila, G., and Chandra, T. S. (2007). Performance of an UASB reactor treating synthetic wastewater at low-temperature using cold-adapted seed slurry. Process Biochem. 42, 466–471. doi: 10.1016/j.procbio.2006.09.010
Amann, R. I., Binder, B. J., Olsen, R. J., Chisholm, S. W., Devereux, R., and Stahl, D. A. (1990). Combination of 16S rRNA-targeted oligonucleotide probes with flow cytometry for analyzing mixed microbial populations. Appl. Environ. Microbiol. 56, 1919–1925.
Amann, R., Stromley, J., Devereux, R., Key, R., and Stahl, D. A. (1992). Molecular and microscopic identification of sulfate-reducing bacteria in multispecies biofilms. Appl. Environ. Microbiol. 58, 614–623.
APHA. (1998). Standard Methods for the Examination of Water and Wastewater. 20th Edn. Washington, DC: APHA.
Baker, G. C., Smith, J. J., and Cowan, D. A. (2003). Review and re-analysis of domain-specific 16S primers. J. Microbiol. Methods 55, 541–555. doi: 10.1016/j.mimet.2003.08.009
Boshoff, G., Duncan, J., and Rose, P. D. (2004). Tannery effiuent as a carbon source for biological sulphate reduction. Water Res. 38, 2651–2658. doi: 10.1016/j.watres.2004.03.030
Brosius, J., Ullrich, A., Raker, M. A., Gray, A., Dull, T. J., Gutell, R. R., et al. (1981). Construction and fine mapping of recombinant plasmids containing the rrnB ribosomal RNA operon of E. coli. Plasmid 6, 112–118. doi: 10.1016/0147-619X(81)90058-5
Bryant, M. P., Wolin, E. A., Wolin, M. J., and Wolfe, R. S. (1967). Methanobacillus omelianskii, a symbiotic association of two species of bacteria. Arch. Microbiol. 59, 20–31.
Chaganti, S. R., Lalman, J. A., and Heath, D. D. (2012). 16S rRNA gene based analysis of the microbial diversity and hydrogen production in three mixed anaerobic cultures. Int. J. Hydrogen Energy 37, 9002–9017. doi: 10.1016/j.ijhydene.2012.02.146
Cline, J. D. (1969). Spectrophotometric determinations of hydrogen sulfide in natural waters. Limnol. Oceanogr. 14, 454–458. doi: 10.4319/lo.1969.14.3.0454
Coates, J. D., Coughlan, M. F., and Colleran, E. (1996). Simple method for the measurement of the hydrogenotrophic methanogenic activity of anaerobic sludges. J. Microbiol. Methods 26, 237–246. doi: 10.1016/0167-7012(96)00915-3
Colleran, E., Concannon, F., Golden, T., Geoghegan, F., Crumlish, B., Killilea, E., et al. (1992). Use of methanogenic activity tests to characterise anaerobic sludges, screen for anaerobic biodegradability and determine toxicity thresholds against individual anaerobic trophic groups and species. Water Sci. Technol. 25, 31–40.
Collins, G., Woods, A., McHugh, S., Carton, M. W., and O'Flaherty, V. (2003). Microbial community structure and methanogenic activity during start-up of psychrophilic anaerobic digesters treating synthetic industrial wastewaters. FEMS Microbiol. Ecol. 46, 159–170. doi: 10.1016/S0168-6496(03)00217-4
Connaughton, S., Collins, G., and O'Flaherty, V. (2006). Development of microbial community structure and activity in a high-rate anaerobic bioreactor at 18°C. Water Res. 40, 1009–1017. doi: 10.1016/j.watres.2005.12.026
de Beer, D., Schramm, A., Santegoeds, C. M., and Kuhl, M. (1997). A nitrite microsensor for profiling environmental biofilms. Appl. Environ. Microbiol. 63, 973–977.
Devereux, R., Kane, M. D., Winfrey, J., and Stahl, D. A. (1992). Genus- and group-specific hybridization probes for determinative and environmental studies of sulfate-reducing bacteria. Syst. Appl. Microbiol. 15, 601–609. doi: 10.1016/S0723-2020(11)80122-0
Enright, A. M., McGrath, V., Gill, D., Collins, G., and O'Flaherty, V. (2009). Effects of seed sludge and operation conditions on performance and archaeal community structure of low-temperature anaerobic solvent-degrading bioreactors. Syst. Appl. Microbiol. 32, 65–79. doi: 10.1016/j.syapm.2008.10.003
Enright, A. M., McHugh, S., Collins, G., and O'Flaherty, V. (2005). Low-temperature anaerobic biological treatment of solvent-containing pharmaceutical wastewater. Water Res. 39, 4587–4596. doi: 10.1016/j.watres.2005.08.037
Fonselius, S., Dryssen, D., and Yhlen, B. (1999). “Determination of hydrogen sulfide,” in Methods of Sea Water Analysis, eds K. Grasshoff, K. Kremling, and M. Ehrhardt (Weinheim: Wiley-VCH), 73–80. ISBN: 9783527295890.
Fukui, M., Suh, J., and Urushigawa, Y. (2000). In-Situ substrates for sulfidogens and methanogens in municipal anaerobic sewage digesters with different levels of sulfate. Water Res. 34, 1515–1524. doi: 10.1016/S0043-1354(99)00306-1
Geets, J., Borrernans, B., Diels, L., Springael, D., Vangronsveld, J., van der Lelie, D., et al. (2006). DsrB gene-based DGGE for community and diversity surveys of sulfate-reducing bacteria. J. Microbiol. Methods 66, 194–205. doi: 10.1016/j.mimet.2005.11.002
Griffiths, R. I., Whiteley, A. S., O'Donnell, A. G., and Bailey, M. J. (2000). Rapid method for coextraction of DNA and RNA from natural environments for analysis of ribosomal DNA and rRNA-based microbial community composition. Appl. Environ. Microbiol. 66, 5488–5491. doi: 10.1128/AEM.66.12.5488-5491.2000
Hulshoff Pol, L. W., Lens, P. N. L., Stams, A. J. M., and Lettinga, G. (1998). Anaerobic treatment of sulphate-rich wastewaters. Biodegradation 9, 213–224. doi: 10.1023/A:1008307929134
Jeroschewski, P., Steuckart, C., and Kuhl, M. (1996). An amperometric rnicrosensor for the determination of H2S in aquatic environments. Analyt. Chem. 68, 4351–4435. doi: 10.1021/ac960091b
Koschorreck, M. (2008). Microbial sulphate reduction at a low pH. FEMS Microbiol. Ecol. 64, 329–342. doi: 10.1111/j.1574-6941.2008.00482.x
Kristjanson, J. K., Schonheit, P., and Thauer, R. K. (1982). Different KS values for hydrogen of methanogenic bacteria and sulfate reducing bacteria: an explanation for the apparent inhibition of methanogenesis by sulfate. Arch. Microbiol. 131, 278–282. doi: 10.1007/BF00405893
Kuhl, M., Steuckert, C., Eickert, G., and Jeroschewski, P. (1998). A H2S microsensor for profiling biofilms and sediments: application in an acidic lake sediment. Aquat. Microb. Ecol. 15, 201–209. doi: 10.3354/ame015201
Lee, C., Kim, J., Hwang, K., O'Flaherty, V., and Hwang, S. (2009). Quantitative analysis of methanogenic community dynamics in three anaerobic batch digesters treating different wastewaters. Water Res. 43, 157–165. doi: 10.1016/j.watres.2008.09.032
Lew, B., Tarre, S., Belavski, M., and Green, M. (2004). UASB reactor for domestic wastewater treatment at low temperatures: a comparison between a classical UASB and hybrid UASB-filter reactor. Water Sci. Technol. 49, 295–301.
Lovley, D. R. (1985). Minimum threshold for hydrogen metabolism in methanogenic bacteria. Appl. Environ. Microbiol. 49, 1530–1531.
Lovley, D. R., and Ferry, J. G. (1985). Production and consumption of H2 during growth of Methanosarcina spp. on acetate. Appl. Environ. Microbiol. 49, 247–249.
Madden, P., Chinalia, F. A., Enright, A. M., Collins, G., and O'Flaherty, V. (2010). Perturbation-independent community development in low-temperature anaerobic biological wastewater treatment bioreactors. Biotechnol. Bioeng. 105, 79–87. doi: 10.1002/bit.22507
Magot, M., Caumette, P., Desperrier, J. M., Matheron, R., Dauga, C., Grimont, F., et al. (1992). Desulfovibrio longus sp. nov., a sulfate-reducing bacterium isolated from an oil-producing well. Int. J. Syst. Bacteriol. 42, 398–403. doi: 10.1099/00207713-42-3-398
McCune, B., and Grace, J. B. (2002). Analysis of Ecological Communities. Gleneden Beach, OR: MjM Software Design.
McHugh, S., Carton, M., Collins, G., and O'Flaherty, V. (2004). Reactor performance and microbial community dynamics during anaerobic biological treatment of wastewaters at 16-37°C. FEMS Microbiol. Ecol. 48, 369–378. doi: 10.1016/j.femsec.2004.02.012
McHugh, S., Carton, M., Mahony, T., and O'Flaherty, V. (2003). Methanogenic population structure in a variety of anaerobic bioreactors. FEMS Microbiol. Lett. 219, 297–304. doi: 10.1016/S0378-1097(03)00055-7
McKeown, R., Hughes, D., Collins, G., Mahony, T., and O'Flaherty, V. (2012). Low-temperature anaerobic digestion for wastewater treatment. Curr. Opin. Biotechnol. 23, 444–451. doi: 10.1016/j.copbio.2011.11.025
Moosa, S., and Harrison, S. T. L. (2006). Product inhibition by sulphide species on biological sulphate reduction for the treatment of acid mine drainage. Hydrometallurgy 83, 214–222. doi: 10.1016/j.hydromet.2006.03.026
Muyzer, G., and Stams, A. J. M. (2008). Ecology and biotechnology of sulphate-reducing bacteria. Nat. Rev. Microbiol. 6, 441–454. doi: 10.1038/nrmicro1892
Muyzer, G., Waal, E. C. D., and Uitterlinden, A. G. (1993). Profiling of complex microbial populations by denaturing gradient gel electrophoresis analysis of polymerase chain reaction-amplified genes coding for 16S rRNA. Appl. Environ. Micorb. 59, 695–700.
Nedwell, D. B., and Reynolds, P. J. (1996). Treatment of landfill leachate by methanogenic and sulphate-reducing digestion. Water Res. 30, 21–28. doi: 10.1016/0043-1354(95)00128-8
O'Flaherty, V., and Colleran, E. (1999). Effect of sulphate addition on volatile fatty acid and ethanol degradation in an anaerobic hybrid reactor I: process disturbance and remediation. Bioresour. Technol. 68, 101–107.
O'Flaherty, V., Colohan, S., Mulkerrins, D., and Colleran, E. (1999). Effect of sulphate addition on volatile fatty acid and ethanol degradation in an anaerobic hybrid reactor II: microbial interactions and toxic effects. Bioresour. Technol. 68, 109–120.
O'Flaherty, V., Lens, P., Leahy, B., and Colleran, E. (1998a). Long-term competition between sulphate-reducing and methane producing bacteria during full-scale anaerobic treatment of citric acid production wastewater. Water Res. 32, 815–825.
O'Flaherty, V., Mahony, T., O'Kennedy, R., and Colleran, E. (1998b). Effect of pH on the growth kinetics and sulphide toxicity thresholds of a range of methanogenic, syntrophic and sulphate reducing bacteria. Process Biochem. 33, 555–569.
O'Reilly, J., Lee, C., Chinalia, F., Collins, G., Mahony, T., and O'Flaherty, V. (2010). Microbial community dynamics associated with biomass granulation in low-temperature (15°C) anaerobic wastewater treatment bioreactors. Bioresour. Technol. 101, 6336–6344. doi: 10.1016/j.biortech.2010.03.049
Omil, F., Lens, P., Hulshoff Pol, L. W., and Lettinga, G. (1997). Characterisation of biomass from a sulphidogenic volatile fatty acid-degrading granular sludge reactor. Enzyme Microbial Technol. 20, 229–236. doi: 10.1016/S0141-0229(96)00119-6
Pender, S., Toomey, M., Carton, M., Eardly, D., Patching, J. W., Colleran, E., et al. (2004). Long-term effects of operating temperature and sulphate addition on the methanogenic community structure of anaerobic hybrid reactors. Water Res. 38, 619–630. doi: 10.1016/j.watres.2003.10.055
Plugge, C. M., Zhang, W., Scholten, J. C. M., and Stams, A. J. M. (2011). Metabolic flexibility of sulfate-reducing bacteria. Front. Microbiol. 2:81. doi: 10.3389/fmicb.2011.00081
Rinzema, A., and Lettinga, G. (1988). “Anaerobic treatment of sulfate-containing waste water,” in Biotreatment Systems, Vol. III, ed D. L. Wise (Boca Raton, FL: CRC Press, Inc.), 65–110. ISBN: 0-8493-4850-1
Rittmann, B. E., and McCarty, P. L. (2001). Environmental Biotechnology: Principles an Applications. New York, NY: McGraw-Hill Book, C.o. ISBN: 0-072-34553-5
Schink, B. (1997). Energetics of syntrophic cooperation in methanogenic degradation. Microbiol. Mol. Biol. Rev. 61, 262–280.
Schonheit, P., Kristjansson, J. K., and Thauer, R. K. (1982). Kinetic mechanism for the ability of sulfate reducers to out-compete methanogens for acetate. Arch. Microbiol. 132, 285–288. doi: 10.1007/BF00407967
Schramm, A., de Beer, D., Wagner, M., and Amann, R. I. (1998). Identification and activities in situ of Nitrosospira and Nitrospira spp. as dominant populations in a nitrifying fluidized bed reactor. Appl. Environ. Microbiol. 64, 3480–3485.
Scully, C., Collins, G., and O'Flaherty, V. (2006). Anaerobic biological treatment of phenol at 9.5–15°C in an expanded granular sludge bed (EGSB)-based bioreactor. Water Res. 40, 3737–3744. doi: 10.1016/j.watres.2006.08.023
Sekiguchi, Y., Kamagata, Y., Nakamura, K., Ohashi, A., and Harada, H. (1999). Flouresence in situ hybridisation using 16S rRNA-targeted oligonucleotides reveals localisation of methanogens and selected uncultured bacteria in mesophilic and thermophilic sludge granules. Appl. Environ. Microbiol. 65, 1280–1288.
Shelton, D. R., and Tiedje, J. M. (1984). General method for determining anaerobic biodegradation potential. Appl. Environ. Microbiol. 47, 850–857.
Stahl, D. A., and Amann, R. I. (1991). “Development and application of nucleic acid probes in bacterial systematics,” in Sequencing and Hybridisation Techniques in Bacterial Systematics, eds E. Stackebrandt and M. Goodfellow (Chichester: John Wiley and Sons), 205–248.
Stams, A. J. M., and Plugge, C. M. (2009). Electron transfer in syntrophic communities of anaerobic bacteria and archaea. Nat. Rev. Microbiol. 7, 568–577. doi: 10.1038/nrmicro2166
Tursman, J. F., and Cork, D. J. (1989). “Influence of sulfate and sulfate reducing bacteria on anaerobic digestion technology,” in Biological Waste Treatment, ed A. Miz-rahi (New York, NY: Alan R. Liss), 273–285.
Wagner, M., Roger, A. J., Flax, J. L., Brusseau, G. A., and Stahl, D. A. (1998). Phylogeny of dissimilatory sulfite reductases supports an early origin of sulfate respiration. J. Bacteriol. 180, 2975–2982.
Wallner, G., Amann, R., and Beisker, W. (1993). Optimizing fluorescent in situ hybridization with rrna-targeted oligonucleotide probes for flow cytometric identification of microorganisms. Cytometry 14, 136–143. doi: 10.1002/cyto.990140205
Yu, Y., Lee, C., and Hwang, S. (2005b). Analysis of community structures in anaerobic processes using a quantitative real-time PCR method. Water Sci. Technol. 52, 85–91.
Keywords: biogas, low-temperature anaerobic digestion, sulfate, sulfide, methane, methanogenesis, wastewater
Citation: Madden P, Al-Raei AM, Enright AM, Chinalia FA, de Beer D, O'Flaherty V and Collins G (2014) Effect of sulfate on low-temperature anaerobic digestion. Front. Microbiol. 5:376. doi: 10.3389/fmicb.2014.00376
Received: 22 April 2014; Accepted: 03 July 2014;
Published online: 24 July 2014.
Edited by:
Aurelio Briones, University of Idaho, USAReviewed by:
Johannes Scholten, Synthetic Genomics, USANaresh Singhal, The University of Auckland, New Zealand
Daniel Puyol, University of Queensland, Australia
Copyright © 2014 Madden, Al-Raei, Enright, Chinalia, de Beer, O'Flaherty and Collins. This is an open-access article distributed under the terms of the Creative Commons Attribution License (CC BY). The use, distribution or reproduction in other forums is permitted, provided the original author(s) or licensor are credited and that the original publication in this journal is cited, in accordance with accepted academic practice. No use, distribution or reproduction is permitted which does not comply with these terms.
*Correspondence: Gavin Collins, School of Natural Sciences, National University of Ireland Galway, University Road, Galway, Ireland e-mail: gavin.collins@nuigalway.ie
†Present address: Anne M. Enright, Galway-Mayo Institute of Technology, Galway, Ireland;
Fabio A. Chinalia, Federal University of Salvador, Salvador, Brazil