 David H. Keating1†
 Yaoping Zhang1†Irene M. Ong1†Sean McIlwain1†
 Eduardo H. Morales1,2†Jeffrey A. Grass1,3Mary Tremaine1
 William Bothfeld1Alan Higbee1Arne Ulbrich4
 Allison J. Balloon4Michael S. Westphall2,4
 Josh Aldrich5
 Mary S. Lipton5
 Joonhoon Kim1,6
 Oleg V. Moskvin1Yury V. Bukhman1Joshua J. Coon1,2,4
 Patricia J. Kiley1,2
 Donna M. Bates1*
 Robert Landick1,3,7*
- 1Great Lakes Bioenergy Research Center, University of Wisconsin-Madison, Madison, WI, USA
- 2Department of Biomolecular Chemistry, University of Wisconsin-Madison, Madison, WI, USA
- 3Department of Biochemistry, University of Wisconsin-Madison, Madison, WI, USA
- 4Department of Chemistry, University of Wisconsin-Madison, Madison, WI, USA
- 5Pacific Northwest National Laboratory, Richland, WA, USA
- 6Department of Chemical and Biological Engineering, University of Wisconsin-Madison, Madison, WI, USA
- 7Department of Bacteriology, University of Wisconsin-Madison, Madison, WI, USA
Efficient microbial conversion of lignocellulosic hydrolysates to biofuels is a key barrier to the economically viable deployment of lignocellulosic biofuels. A chief contributor to this barrier is the impact on microbial processes and energy metabolism of lignocellulose-derived inhibitors, including phenolic carboxylates, phenolic amides (for ammonia-pretreated biomass), phenolic aldehydes, and furfurals. To understand the bacterial pathways induced by inhibitors present in ammonia-pretreated biomass hydrolysates, which are less well studied than acid-pretreated biomass hydrolysates, we developed and exploited synthetic mimics of ammonia-pretreated corn stover hydrolysate (ACSH). To determine regulatory responses to the inhibitors normally present in ACSH, we measured transcript and protein levels in an Escherichia coli ethanologen using RNA-seq and quantitative proteomics during fermentation to ethanol of synthetic hydrolysates containing or lacking the inhibitors. Our study identified four major regulators mediating these responses, the MarA/SoxS/Rob network, AaeR, FrmR, and YqhC. Induction of these regulons was correlated with a reduced rate of ethanol production, buildup of pyruvate, depletion of ATP and NAD(P)H, and an inhibition of xylose conversion. The aromatic aldehyde inhibitor 5-hydroxymethylfurfural appeared to be reduced to its alcohol form by the ethanologen during fermentation, whereas phenolic acid and amide inhibitors were not metabolized. Together, our findings establish that the major regulatory responses to lignocellulose-derived inhibitors are mediated by transcriptional rather than translational regulators, suggest that energy consumed for inhibitor efflux and detoxification may limit biofuel production, and identify a network of regulators for future synthetic biology efforts.
Introduction
Elucidation of metabolic and regulatory barriers in microbial conversion of lignocellulosic sugars to ethanol is crucial for both the immediate goal of economical cellulosic ethanol and for the long-term development of next-generation biofuels and sustainable chemicals from renewable biomass. Efficient conversion of lignocellulose (LC) hydrolysates is limited by multiple factors (Mills et al., 2009; Lau and Dale, 2010), including high osmolarity (Underwood et al., 2004; Purvis et al., 2005; Miller and Ingram, 2007), toxicity of the conversion products (Ingram and Buttke, 1984), and inhibitors of microbial metabolism and growth generated during the deconstruction of LC (Zaldivar et al., 1999; Wang et al., 2011a; Tang et al., submitted). Understanding and overcoming the barriers created by LC-derived inhibitors presents significant challenges as their composition can vary depending on the biomass source of LC, the methods used to deconstruct the LC, and the diverse metabolic and regulatory responses of microbes to inhibitors (Klinke et al., 2004; Liu, 2011). Synergy among the inhibitors, the high osmolarity inherent to hydrolysates, and toxicity of conversion products (e.g., ethanol) are additional factors that contribute to the complex molecular landscape of lignocellulosic hydrolysates (Klinke et al., 2004; Liu, 2011; Piotrowski et al., 2014).
Release of sugars from LC typically requires either acidic or alkaline treatment of biomass prior to or coupled with chemical or enzymatic hydrolysis (Chundawat et al., 2011). Acidic treatments generate significant microbial inhibitors by condensation reactions of sugars (e.g., furfural and 5-hydroxymethylfurfural). Microbes typically detoxify these aldehydes by reduction or oxidation to less toxic alcohols or acids (Booth et al., 2003; Herring and Blattner, 2004; Marx et al., 2004; Jarboe, 2011), but these conversions also directly or indirectly consume energy that otherwise would be available for biofuel synthesis (Miller et al., 2009a,b) The impact of these inhibitors is especially significant for C5 sugars like xylose whose catabolism provide slightly less cellular energy (Lawford and Rousseau, 1995), and can be partially ameliorated by replacing NADPH-consuming enzymes with NADH-consuming enzymes (Wang et al., 2013).
Alkaline treatments, for instance with ammonia, are potentially advantageous in generating fewer toxic aldehydes, but the spectrum of inhibitors generated by alkaline treatments is less well characterized and their effects on microbial metabolism are less well understood. We have developed an approach to elucidate the metabolic and regulatory barriers to microbial conversion in LC hydrolysates using ammonia fiber expansion (AFEX) of corn stover, enzymatic hydrolysis, and a model ethanologen (GLBRCE1) engineered from the well-studied bacterium E. coli K-12 (Schwalbach et al., 2012). Our strategy is to compare anaerobic metabolic and regulatory responses of the ethanologen in authentic AFEX-pretreated corn stover hydrolysate (ACSH) to responses to synthetic hydrolysates (SynHs) designed to mimic ACSH with a chemically defined medium. GLBRCE1 metabolizes ACSH in exponential, transition, and stationary phases but, unlike growth in traditional rich media (Sezonov et al., 2007), GLBRCE1 enters stationary phase (ceases growth) long before depletion of available glucose but coincident with exhaustion of amino acid sources of organic nitrogen (Schwalbach et al., 2012). The growth-arrested cells remain metabolically active and convert the remaining glucose, but not xylose, into ethanol (Schwalbach et al., 2012).
Our first version of SynH (SynH1) matched ACSH for levels of glucose, xylose, amino acids, and some inorganics, overall osmolality, and the amino-acid-dependent growth arrest of GLBRCE1 (Schwalbach et al., 2012). However, gene expression profiling revealed that SynH1 cells experienced significant osmotic stress relative to ACSH cells, whereas ACSH cells exhibited elevated expression of efflux pumps, notably of aaeAB that acts on aromatic carboxylates (Van Dyk et al., 2004), relative to SynH1 cells (Schwalbach et al., 2012). Osmolytes found in ACSH (betaine, choline, and carnitine) likely explained the lower osmotic stress, whereas phenolic carboxylates derived from LC (e.g., coumarate and ferulate) likely explained efflux pump induction possibly via the AaeR and MarA/SoxS/Rob regulons known to be induced by phenolic carboxylates (Sulavik et al., 1995; Dalrymple and Swadling, 1997). We also observed elevated expression of psp, ibp, and srl genes associated with ethanol stress at ethanol concentrations three-fold lower than previously reported to induce expression (Yomano et al., 1998; Goodarzi et al., 2010) and thus consistent with a synergistic stress response with the LC-derived inhibitors. These findings led us to hypothesize that the collective effects of osmotic, ethanol, and LC-derived inhibitor stresses created an increased need for ATP and reducing equivalents that was partially offset in early growth phase by catabolism of amino acids, as N and possibly S sources. However, as these amino acids are depleted, cells transition to stationary phase where they continue to catabolize glucose for maintenance ATP and NAD(P)H but are unable to generate sufficient energy for cell growth or efficient xylose catabolism.
To test this hypothesis, we developed a new SynH formulation (SynH2) that faithfully replicates the physiological responses in ACSH and the effects of LC-derived inhibitors. Using SynH2 with and without the LC-derived inhibitors, we generated and analyzed metabolomic, gene expression, and proteomic data to define the effects of inhibitors on bacterial gene expression and physiology. The analysis allowed identification of key regulators that may provoke stress responses in the presence of LC-derived inhibitors and suggest that coping mechanisms employed by E. coli to deal with lignocellulosic stress drains cellular energy, thus limiting xylose conversion.
Materials and Methods
Reagents
Reagents and chemicals were obtained from Thermo Fisher Scientific (Pittsburgh, Pennsylvania, USA) or Sigma Aldrich Co. (Saint Louis, Missouri, USA) with the following exceptions. 5-hydroxymethyl-2-furancarboxylic acid and 5-(hydroxymethyl)furfuryl alcohol were obtained from Toronto Research Chemicals Inc. (Toronto, Ontario, Canada). Deuterated compounds for HS-SPME-GC/IDMS were obtained from C/D/N Isotopes (Pointe-Claire, Quebec, Canada). D4-acetaldehyde and U13C6-fructose were obtained from Cambridge Isotope Labs (Andover, Massachusetts, USA).
Synthesis of Feruloyl and Coumaroyl Amides
Twenty grams of ferulic or coumaric acid were dissolved in 200 ml of 100% ethanol in a 3-neck, 250 ml round-bottom flask equipped with a magnetic stir bar and a drying tube on one of the outside arms. Ten milliliters of acetyl chloride was added and incubated with stirring at room temperature overnight. Ethanol was removed in a rotary evaporator at 40°C under modest vacuum; the syrup re-dissolved in 250 ml 100% ethanol and re-evaporated twice. When the final syrup was reduced to <25 ml, ~6 ml portions were transferred to heavy-wall 25 × 150 mm tubes containing ~30 ml concentrated ammonium hydroxide and sealed with a Teflon-lined cap. The sealed tubes were incubated at 95°C in a heating block covered with a safety shield overnight. The tubes were cooled and then left open in a hood for 4–8 h to allow evaporation of ammonium hydroxide, during which the feruloyl or coumaroyl amide precipitated. The crystallized products were collected under vacuum on a glass filter and washed with 250 ml ice-cold 150 mM ammonium hydroxide. The product was allowed to air dry in a plastic weigh boat in the hood at room temperature for 2–3 days. Purity of the products was analyzed by silica gel TLC developed with 5% methanol in chloroform. Only preparations exceeding 90% purity were used for experiments.
Preparation of ACSH
ACSH was prepared by one of two methods that differed in whether or not CS was autoclaved prior to enzymatic hydrolysis. Non-autoclaved CS hydrolysate more closely replicates an industrial process, was used by Tang et al. (submitted) for compositional analysis, and was used for some of our fermentation experiments. Autoclaved CS hydrolysate ensures sterility for bacterial fermentations and was used for our compositional analysis and for experiments to generate RNA-seq data. We did not observe a significant difference in GLBRCE1 behavior in non-autoclaved vs. autoclaved CS hydrolysates, although HMF was detectable in the former, but not the latter (Table 2). We observed minor variations in growth with CS harvested in different years. For autoclaved CS hydrolysate, AFEX-pretreated CS was mixed with water to 6–10 L final volume at 60 g glucan/L loading (18–22% solids, adjusted for moisture content) and autoclaved for 30–120 min in a 15 L Applikon bioreactor vessel (Schwalbach et al., 2012). For non-autoclaved CS hydrolysate, AFEX pretreated-corn stover was added to the vessel after the water was autoclaved for 30 min. For both, the sample was cooled to ~70°C, adjusted to 10 L volume with water, and pH adjusted with ~30 ml concentrated HCl. Hydrolysis was initiated by adding Novozymes CTec2 to 24 mg/g glucan and HTec2 to 6 mg/g glucan, followed by incubation for 5 days at 50°C with stir speed at 700 rpm. Some older batches of hydrolysate were prepared using Genencor Accellerase, Genencor Accellerase XY, and Multifect pectinase A in place of Novozyme enzymes (Schwalbach et al., 2012). Solids were then removed by centrifugation (8200 × g, 4°C, 10–12 h) and the supernatant was filter-sterilized through 0.5 μm and then 0.2 μm filters. Prior to fermentation, the hydrolysate was adjusted to pH 7.0 using NaOH pellets and filtered again through a 0.2 μm filter to remove precipitates and to ensure sterility.
Preparation of Synthetic Hydrolysate (SynH2)
SynH2 (Table 1) was prepared by combining per L final volume of SynH2 the following ingredients. Water (~700 ml) was mixed with 6.25 ml of 1.6 M KPO4 buffer, pH 7.2, 20 ml of 1.5 M ammonium sulfate, 20 ml of 2.25 M KCl, 1.25 M NaCl, 20 ml of a 50X amino acid stock giving the final concentrations shown in Table 1 (except tyrosine), 20 ml of 8.75 mM tyrosine dissolved in 50 mM HCl, 50 ml of 1 mM each adenine, guanine, cytosine and uracil dissolved in 10 mM KOH, 10 ml of vitamin stock (1 mM each thiamine, calcium pantothenate, p-aminobenzoic acid, p-hydroxybenzoic acid, and 2,3-dihydroxybenzoic acid), 1 ml of a 1000X stock of micronutrients (ZnCl2, MnCl2, CuCl2, CoCl2, H3BO3, (NH4)6Mo7O24, and FeCl3) giving the final concentrations shown in Table 1, 1 ml of 1 M magnesium chloride, 1 ml of 90 mM CaCl2, 10 ml of 1 M sodium formate, 10 mM sodium nitrate, and 50 mM sodium succinate, 1 ml of 3 M glycerol, 1 ml of 500 mM lactic acid, 1 ml of 700 mM glycine betaine, 700 mM choline chloride, 200 mM DL-carnitine (osmolytes), 5.61 g acetamide, 2.71 g sodium acetate, 3.3 g sodium pyruvate, 2.94 g sodium citrate, 1.34 g DL-malic acid, 60 g D-glucose, 30 g D-xylose, 5.1 g D-arabinose, 1.48 g D-fructose, 1.15 g D-galactose, and 468 mg D-mannose. After adjusting to pH 7 with 10 N NaOH, the final volume was adjusted to 1 L. This base recipe corresponds to SynH2−. To create SynH2, the aromatic inhibitors were added as solids to the base recipe in the following quantities per L SynH2 and stirred until fully dissolved before filter sterilization; 531 mg feruloyl amide, 448 mg coumaroyl amide, 173 mg p-coumaric acid, 69 mg ferulic acid, 69 mg hydroxymethylfurfural, 59 mg benzoic acid, 15 mg syringic acid, 14 mg cinnamic acid, 15 mg vanillic acid, 2 mg caffeic acid, 20 mg vanillin, 30 mg syringaldehyde, 24 mg 4-hydroxybenzaldehyde, 3.4 mg 4-hydroxybenzophenone. For some experiments (Figures S3, S4), feruloyl amide, coumaroyl amide, p-coumaric acid, ferulic acid, and hydroxymethylfurfural were added at up to twice these concentrations. The medium was filter-sterilized through a 0.2 μm filter.
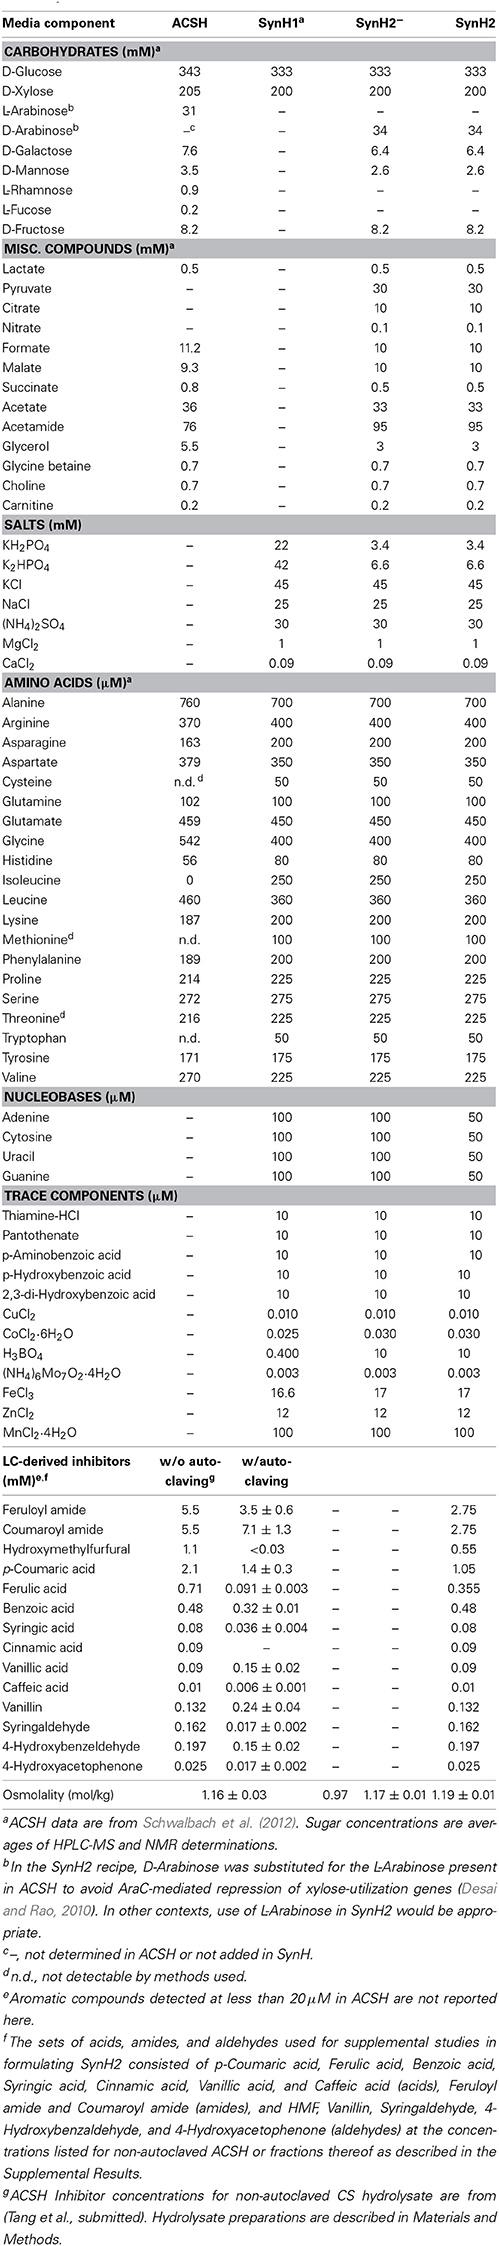
Table 1. Composition of ACSH, SynH1, SynH2−, and SynH2.
Chemical Analysis of ACSH
Carbohydrates, ethanol, and short chain acids in ACSH and fermentation media were quantified using HPLC-RID, NMR, and GC-MS as previously described (Schwalbach et al., 2012). ACSH osmolality was measured using a Vapro osmometer 5520 (Wescor Inc., Logan, Utah, USA). The synthetic hydrolysate medium used in these studies (SynH2) was based on a previously described synthetic hydrolysate medium (Schwalbach et al., 2012) that was modified to more closely approximate the composition of ACSH media, particularly with regard to the presence of alternative carbon sources and protective osmolytes. Concentrations of components in the modified SynH2 are described in Table S1.
Fermentative Growth Conditions
Cell culture was conducted as described previously (Schwalbach et al., 2012), except fermentations were carried out in 3 L bioreactors (Applikon Biotechnology) containing 2.45 L of ACSH or SynH media, and cultures were diluted into ACSH or SynH with initial OD600 at 0.2, grown anaerobically overnight, and then inoculated into bioreactors to a starting OD600 of 0.2. For fermentation experiments to determine the effect of osmolytes, it was carried out in 0.5 L Sartorius BIOSTAT Qplus bioreactors (Sartorius Stedium Biotech, Bohemia, NY) containing 0.35 L of SynH2 media in the absence or presence of osmolytes or aromatic inhibitors. Culture density was measured using a Beckman Coulter DU720 in a 1 ml cuvette. Due to the high absorbance of ACSH at 600 nm, cells were diluted 1:10 in water prior to OD600 measurement, with diluted ACSH (1:10) as a blank. For SynH, diluted SynH (1:10) was used as a blank.
RNA-seq Gene Expression Analyses
Samples for RNA-seq were captured and RNA extracted as described previously (Schwalbach et al., 2012). FASTQ formatted sequence files from strand-specific Illumina RNA-Seq reads were aligned to the GLBRCE1 reference genome using Bowtie version 0.12.7 (Langmead et al., 2009) with “—nofw” strand-specific parameter and maximal distance between the paired reads of 1000 bp. Nucleotide-level read quality information was used to weight each alignment at subsequent probabilistic expression counting step using the RNA-Seq by Expectation-Maximization (RSEM) version 1.2.4 (Li and Dewey, 2011). Posterior mean estimates of counts and FPKM values were used in the downstream analysis.
The program edgeR v.3.0.2 (Robinson et al., 2010) was used to compute differential expression by using the procedures and steps described in the package documentation in all function calls with median normalization rather than the default TMM procedure. We found that median normalization better adjusted for the particular biases within the dataset. Adjusted p-values for multiple hypothesis corrections were used as calculated by edgeR. Pairwise fold-changes and adjusted p-values are calculated between media types and within each phase and between phases within each media type.
To catalog the most significant effects, we examined the ratios using several different strategies. In addition to identifying the largest changes in expression of individual genes in SynH2 and ACSH relative to SynH2− (Table S2), we also used gene set enrichment analyses as described by Subramanian et al. (2005) and Varemo et al. (2013). We compiled gene sets for these analyses from pathways, transporters, and regulons documented in Ecocyc (Keseler et al., 2013) and KEGG.
Proteomic Measurements
Thirty-four Escherichia coli samples were processed for analysis by mass spectrometry at PNNL. Each sample was typically digested using a global urea digestion (Pasa-Tolic et al., 2004; Smyth, 2004) prior to isobaric labeling with an iTRAQ 4-plex labeling kit, following the manufacturer's directions (ABSciex, Redwood City, CA) (Ross et al., 2004; Bantscheff et al., 2008). Prior to high pH reverse phase fractionation with concatenated pooling (Wang et al., 2011b), the samples were desalted using C18 solid-phase extraction (SPE) (SUPELCO, Bellefonte, PA). All samples were processed with a custom LC system using reversed-phase C18 columns (unpublished variation of Maiolica et al., 2005) and the samples were then analyzed with a Velos Orbitrap mass spectrometer (Thermo Scientific, San Jose, CA) that was equipped with an electrospray ionization (ESI) interface (Kelly et al., 2006).
Raw files were searched against a concatenated Escherichia coli K-12 database and contaminant database using MS-GF+ (v9018) with oxidation as a dynamic modification on methionine and 4-plex iTRAQ label as a static modification (Kim et al., 2008). The parent ion mass tolerance was set to 50 ppm. The resulting sequence identifications were filtered down to a 1% false discovery rate using target-decoy approach and MS-GF derived q-values. Reporter ion intensities were quantified using the tool MASIC (Monroe et al., 2008). Results were then processed with the MAC (Multiple Analysis Chain) pipeline, an internal tool which aggregates and filters data. Missing reporter ion channel results were retained. Degenerate peptides, i.e., peptides occurring in more than one protein, were filtered out. Proteins with one peptide detected were removed if they were not repeatable across at least two replicates. Redundant peptide identification reporter ions were summed across fractions and median central tendency normalization was applied to account for channel bias. Each 4-plex sample group was normalized using a pooled sample for comparison between groups. The final protein values were obtained by averaging their associated peptide intensity values and varied from ~5000 to 350000. Finally, the protein values were then log2 transformed.
All proteins that had missing values in their replicates were removed and the pair-wise protein expression level changes and significance p-values between the SynH2 and SynH2− cells at each growth phase were estimated using limma (Smyth, 2004; Smith, 2005), which fits a linear model across the replicates to calculate the fold changes, smooths the standard errors for significance and adjusts the p-values via the Benjamini-Hochberg method.
Comparison of Proteomic Data to Transcriptomic Data
Pair-wise RNA expression level changes and significance p-values were estimated using the edgeR package as previously discussed. The log2-fold-changes for the Protein and RNA were z-score scaled separately to correct for the difference in dynamic ranges between the protein and RNA measurements.
Significant discrepant Protein/RNA ratios between SynH2 and SynH2− cells were estimated using a two-sample z-test and the corresponding p-values are adjusted for multiple comparisons using the Benjamini-Hochberg method. All Protein/RNA ratios that are either significant in the RNA or protein ratio (p < 0.05) and that significantly disagree (p < 0.05) are tabulated in Table S7.
Measurement of Internal Metabolite Abundances
Preparation of Intracellular Extracts
Two ml of cell culture was rapidly removed from bioreactors with a 10 ml sterile syringe and cells captured on Whatman 0.45 um nylon syringe filters (GE Healthcare Bio-Sciences, Pittsburgh, Pennsylvania, USA) as described previously (Schwalbach et al., 2012). To reduce the background associated with metabolites present in ACSH and SynH the cells on the filter were then rapidly washed with 5 ml of M9 medium (Neidhardt et al., 1974) lacking a carbon source. Acetonitrile-methanol-water (40:40:20; 2 ml) containing 0.1% formic acid was then applied to the filters, and the eluate captured in a 15 ml conical tube. The eluate was passed through the cells a second time to ensure complete cell lysis and then flash frozen in a dry ice/ethanol bath.
Detection/Quantification of Metabolites
The concentration of internal glycolytic and TCA cycle intermediates were determined using high performance anion exchange chromatography electrospray ionization tandem mass spectrometry (HPAEC-ESI-MS/MS). Reagents and non-labeled reference compounds were from Sigma Aldrich Co.
HPAEC was adapted from a previously reported method (Buescher et al., 2010), and was used for determination of pyruvate, citrate, α–ketoglutarate, glucose-6-phosphate, fructose-6-phosphate, fructose-1,6-bis phosphate, phospho(enol)pyruvate, and ATP. Chromatography was carried out on an Agilent 1200 series HPLC comprised of a vacuum degasser, binary pump, and a heated column compartment, and a thermostated autosampler set to maintain 6°C. Mobile Phase A was 0.5 mM NaOH and mobile phase B was 100 mM NaOH. Compounds were separated by a gradient elution of 0.35 mL per minute starting at 10% B, increased to 15% B over 5 min and held at 15% B for 10 min, then increased to 100% B over 12 min and held for 10 min before returning to 10% B to be re-equilibrated for 5 min prior to the next injection. The column temperature was 40°C. The injection volume was 20 μL of intracellular extract or calibrant standard mixture.
Measurement of Aromatic Inhibitors in ACSH and SynHd
Samples of ACSH and SynH cultures were prepared by centrifugation as described previously (Schwalbach et al., 2012), and then were subjected to reverse phase HPLC high resolution/accurate mass spectrometry (RP-HPLC-HRAM MS) and headspace solid-phase microextraction gas chromatography-isotope dilution mass spectrometry (HS-SPME/IDMS) analysis.
The majority of phenolic compounds were determined by RP-HPLC-HRAM MS, which was carried out with a MicroAS autosampler (Thermo Scientific) equipped with a chilled sample tray and a Surveyor HPLC pump (Thermo Scientific) coupled to a Q-Exactive hybrid quadrupole/orbitrap mass spectrometer by electrospray ionization. The analytical column was an Ascentis Express column (150 × 2.1 mm × 2.7 μm core-shell particles, Supelco, Bellefonte, PA) protected by a 5 mm C18 precolumn (Phenomenex, Torrance, CA). Mobile phase A was 10 mM formic acid adjusted to pH 3 with ammonium hydroxide and mobile phase B was methanol with 10 mM formic acid and the same volume of ammonium hydroxide as was added to mobile phase A. Compounds were separated by gradient elution. The initial composition was 95% A, which was held for 2 min after injection, then decreased to 40% A over the next 8 min, changed immediately to 5% A and held for 5 min, then changed back to 95% A for a column re-equilibration period of 7 min prior to the next injection. The flow rate was 0.3 mL/min.
The HPLC separation was coupled to the mass spectrometer via a heated electrospray (HESI) source (HESI II Probe, Thermo Scientific). The operating parameters of the source were: spray voltages: +3000, −2500; capillary temperature: 300°C; sheath gas flow: 20 units; auxiliary gas flow: 5 units; HESI probe heater: 300°C. Spectra were acquired with fast polarity switching to obtain positive and negative mode ionization chromatograms in a single analysis. In each mode, a full MS1 scan was performed by the Orbitrap analyzer followed by a data dependent MS2 scan of the most abundant ion in the MS1 scan. The Q-Exactive parameters (both positive and negative modes) were: MS1 range 85–500 Th, resolution: 17,500 (FWHM at 400 m/z), AGC target: 1e6, maximum ion accumulation time 100ms, S-lens level: 50. Settings for data dependent MS2 scans were: isolation width: 1.8 Th, normalized collision energy: 50 units, resolution: 17,500, AGC target: 2e5, maximum ion accumulation time: 50 ms, underfill ratio: 1%, apex trigger: 5–12 s, isotope exclusion enabled, dynamic exclusion: 10 s.
HS-SPME/IDMS was used to quantify acetaldehyde, acetamide, furfural, furfuryl alcohol, HMF, 5-(hydroxymethyl)furfural (HMF), and Bis(hydroxymethyl) furan (“HMF alcohol”/BHMF). Samples were thawed and briefly vortex mixed prior to measuring 500 microliters of sample, 500 microliters of stable isotope labeled internal standard mixture, and ~300 mg of NaCl into a 20 mL screw top headspace and quickly capped with magnetic screwtop cap with 4 mm PTFE backed silicone rubber septum for SPME. Automated SPME sample processing and analysis was carried out using a Pegasus 4D GCxGC-TOF MS (Leco Corp. Saint Joseph, Michigan) with an Agilent 6890A gas chromatograph coupled to the ToF mass analyzer via a heated capillary transfer line, and a Gerster-LEAP combi PAL autosampler and sample preparation system with Twister heated sample agitator fitted with an automated SPME holder containing a gray hub 50/30, 23 ga. Stabiliflex DVB/Carboxen/PDMS SPME fiber (Supelco, Inc.). Chromatof software (Leco, Corp.) V. 4.50.8.0 was used for system control during acquisition and for data processing, calibration and calculation of final concentrations. Sample incubation temperature 95°C, agitation speed 100 rpm, during extraction time, 100 rpm, agitation on 4 s/off 15 s, sample extraction time (SPME fiber exposed to the sample headspace in heated agitator) 20 min, desorb time (SPME fiber inserted in hot GC inlet) 60 min. GC cycle time 40 min. Critical injector positions were determined empirically through trial, error, and careful measurement: vial penetration 11 mm, Injector penetration 54 mm, Injector penetration—needle 40 mm. GC was carried out using a StabilWAX-DA column (Restek Corp, Bellefonte, Pennsylvania, USA) 0.25 mm ID × 30 m, df = 0.25 μm; carrier gas He, 1 mL/min; split 5:1; purge flow 3 mL/min; inlet temp 250°C; inlet liner type straight split/splitless deactivated glass 0.75 mm ID; equilibration time 1 min; Oven temperature program: initial temperature 30°C, hold 2 min. Increase to 10°C/min to 250°C, hold 10 min; MS transfer line 250°C. ToF mass spectrometer (unit mass resolution) Acquisition delay 85 s; start mass 10 end mass 500; acquisition 10 spectra/s; electron multiplier delta V 1475 (dependent on QC procedure) source temperature 200°C.
Quantification of organic acids in ACSH was carried out by HPAEC-MS/MS in a similar manner to that described for intracellular metabolites.
Database Submissions and Accession Numbers
Transcriptomic data (RNA-seq and microarray) have been deposited in NCBI's Gene Expression Omnibus and are accessible through GEO Series accession number GSE58927. Proteomic data can be obtained from the PeptideAtlas database (http://www.peptideatlas.org/PASS/PASS00514).
Results
SynH2 Recapitulates the Growth, Sugar Consumption, and Ethanol Production Profiles of E. coli in ACSH
We first sought to validate a new SynH recipe (SynH2) that would replicate ACSH composition and effects on cells. In addition to protective osmolytes, trace carbohydrates, organic acids, acetamide, and alternative electron donors/acceptors detected in ACSH previously (Schwalbach et al., 2012), new compositional analyses revealed significant quantities of coumarate, coumaroyl amide, ferulate, feruloyl amide, 5-hydroxymethylfurfural (HMF) and nine other aromatic carboxylates or aldehydes in ACSH (Table 1). To formulate a chemically defined ACSH-mimic (SynH2) for use with E. coli, we tested combinations of the osmolytes and the LC-derived inhibitors in a base medium composition that included the other missing components (Supplemental Results; Materials and Methods), but substituting D-arabinose for L-arabinose to avoid repression of xylose-utilization genes (Desai and Rao, 2010).
To verify that SynH2 recapitulates the major properties of ACSH and to prepare samples for gene expression and proteomic analyses, we compared growth of the E. coli ethanologen in SynH2− (SynH2 lacking aromatic inhibitors), SynH2, and ACSH. For each medium, growth could be divided into exponential, transition, stationary, and late stationary growth phases (Figure 1 and Figure S5). Growth rates of GLBRCE1 in each phase and final cell density were similar for SynH2 and ACSH, with only slight differences, whereas removal of inhibitors (SynH2−) significantly increased growth and final cell density (Figure 1 and Figure S5; Table 2). During exponential phase, glucose uptake was similar in all media. As observed previously in ACSH (Schwalbach et al., 2012), cells stopped growth prematurely in both ACSH and SynH, but remained metabolically active and continued glucose assimilation during stationary phase. However, in SynH2−, cell growth continued until the glucose was essentially gone (Figure 1 and Figure S5). Thus, cessation of cell growth and entry into the metabolically active stationary phase was caused by the presence of LC-derived inhibitors. In the absence of inhibitors, cells growth ceased when glucose was depleted. In the presence of inhibitors, cells ceased growth when they ran out of organic N and S sources (Schwalbach et al., 2012).
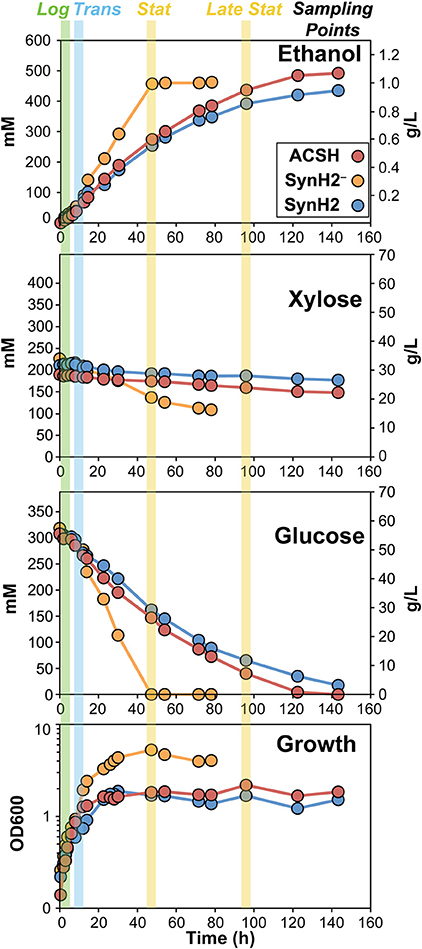
Figure 1. Growth, sugar utilization, and ethanol production of GLBRCE1 in ACSH, SynH2, and SynH2−. GLBRCE1 was cultured under anaerobic conditions at 37°C in a bioreactor in ACSH, SynH2, or SynH2− (SynH2 lacking aromatic inhibitors; Materials and Methods). Cell density measurements (bottom panel), changes in glucose and xylose concentrations in the extracellular medium (middle panels), and ethanol concentrations in the vessel (top panel) were periodically determined and plotted relative to time. Blue, green, and yellow shaded bars represent points at which samples for metabolite, RNA, and protein analyses were collected during exponential, transition, and stationary phases of growth.
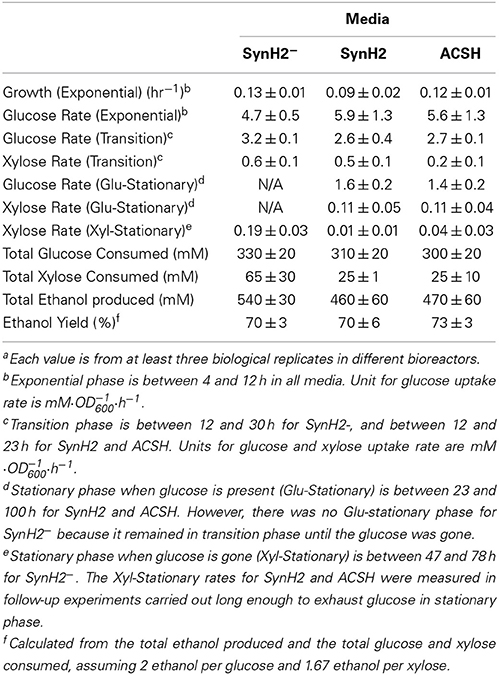
Table 2. Growth, sugar uptake, and ethanol production by GLBRCE1 grown in ACSH and SynH2−, and SynH2a.
After glucose depletion and entry into stationary phase in SynH2−, GLBRCE1 consumed xylose (up to ~50% by the time the experiments were terminated 80–100 h; Figure 1 and Figure S5; Table 2). However, little xylose consumption occurred in the presence of inhibitors or in ACSH, presumably in part because glucose conversion continued during stationary phase to near the end of the experiment. However, even in experiments that exhausted glucose in stationary phase, SynH2 cells and ACSH cells exhibited little or no xylose conversion (Table 2). GLBRCE1 generated slightly more ethanol in SynH2− than in SynH2 or ACSH, consistent with greater sugar consumption, but also generated ethanol much faster than in the inhibitor-containing media (Figure 1 and Figure S5; Table 2). We conclude that LC-derived inhibitors present in SynH2 and in ACSH cause E. coli cells to cease growth before glucose was consumed, decreased the rate of ethanol production, and to lesser extent decreased final amounts of ethanol produced.
GLBRCE1 Gene Expression Patterns are Similar in SynH2 and ACSH
To test the similarity of SynH2 to ACSH and the extent to which LC-derived inhibitors impact ethanologenesis, we next used RNA-seq to compare gene expression patterns of GLBRCE1 grown in the two media relative to cells grown in SynH2− (Materials and Methods; Table 1). We computed normalized gene expression ratios of ACSH cells vs. SynH2− cells and SynH2 cells vs. SynH2− cells, and then plotted these ratios against each other using log10 scales for exponential phase (Figure 2A), transition phase (Figure 2B), and stationary phase (Figure 2C). For simplicity, we refer to these comparisons as the SynH2 and ACSH ratios. The SynH2 and ACSH ratios were highly correlated in all three phases of growth, although were lower in transition and stationary phases (Pearson's r of 0.84, 0.66, and 0.44 in exponential, transition, and stationary, respectively, for genes whose SynH2 and ACSH expression ratios both had corrected p < 0.05; n = 390, 832, and 1030, respectively). Thus, SynH2 is a reasonable mimic of ACSH.
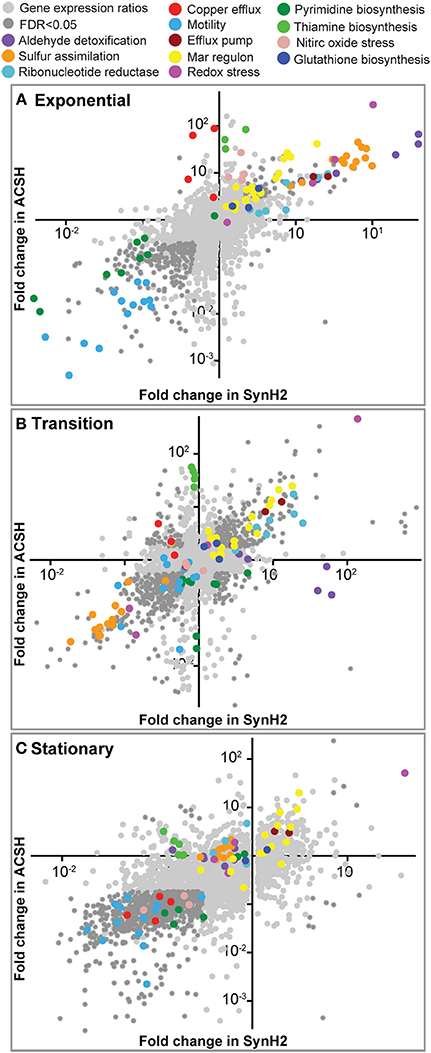
Figure 2. Relative gene expression patterns in SynH2 and ACSH cells relative to SynH2− cells. Scatter plots were prepared with the ACSH/SynH2− gene expression ratios plotted on the y-axis and the SynH2/SynH2− ratios on the x-axis (both on a log10 scale). GLBRCE1 was cultured in a bioreactor anaerobically (Figure 1 and Figure S5); RNAs were prepared from exponential (A), transition (B), or stationary (C) phase cells and subjected to RNA-seq analysis (Materials and Methods). Dark gray dots represent genes for which p = 0.05 for each expression ratio. Sets of genes with related functions that exhibited significant discrepant or parallel changes are color-coded and described in the legend at the top (see also Tables S3, S4, respectively).
We used these data to investigate the gene expression differences between SynH2 and ACSH (Table S3). Several differences likely reflected the absence of some trace carbon sources in SynH2 (e.g., sorbitol, mannitol), their presence in SynH2 at higher concentrations than found in ACSH (e.g., citrate and malate), and the intentional substitution of D-arabinose for L-arabinose. Elevated expression of genes for biosynthesis or transport of some amino acids and cofactors confirmed or suggested that SynH2 contained somewhat higher levels of Trp, Asn, thiamine and possibly lower levels of biotin and Cu2+ (Table S3). Although these discrepancies point to minor or intentional differences that can be used to refine the SynH recipe further, overall we conclude that SynH2 can be used to investigate physiology, regulation, and biofuel synthesis in microbes in a chemically defined, and thus reproducible, media to accurately predict behaviors of cells in real hydrolysates like ACSH that are derived from ammonia-pretreated biomass.
Aromatic Aldehydes in SynH2 are Converted to Alcohols, but Phenolic Carboxylates and Amides are not Metabolized
Before evaluating how patterns of gene expression informed the physiology of GLBRCE1 in SynH2, we first determined the profiles of inhibitors, end-products, and intracellular metabolites during ethanologenesis. The most abundant aldehyde inhibitor, HMF, quickly disappeared below the limit of detection as the cells entered transition phase with concomitant and approximately stoichiometric appearance of the product of HMF reduction, 2,5-bis-HMF (hydroxymethylfurfuryl alcohol; Figure 3A, Table S8). Hydroxymethylfuroic acid did not appear during the fermentation, suggesting that HMF is principally reduced by aldehyde reductases such as YqhD and DkgA, as previously reported for HMF and furfural generated from acid-pretreated biomass (Miller et al., 2009a, 2010; Wang et al., 2013). In contrast, the concentrations of ferulic acid, coumaric acid, feruloyl amide, and coumaroyl amide did not change appreciably over the course of the experiment (Figure 3B, Table S8), suggesting that E. coli either does not encode activities for detoxification of phenolic carboxylates and amides, or that expression of such activities is not induced in SynH2.
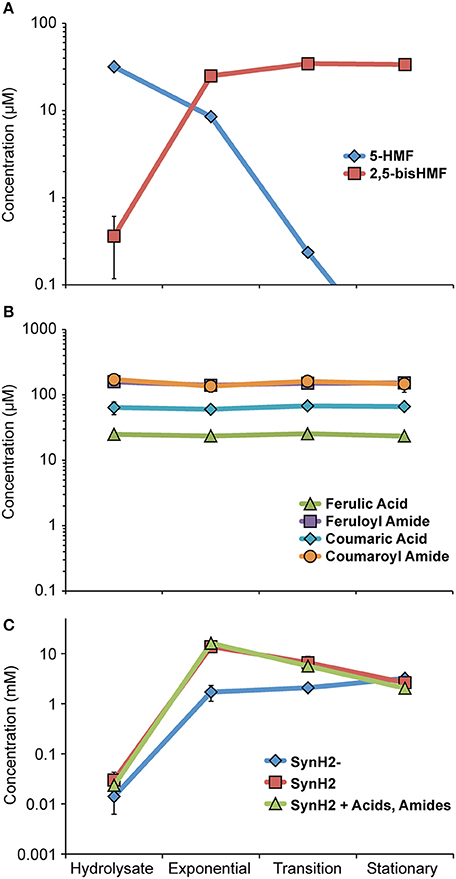
Figure 3. Growth phase-dependent changes in SynH2 aromatic inhibitor levels. GLBRCE1 was cultured under anaerobic conditions in SynH2 in bioreactors. Levels of the major LC-derived inhibitors in the culture medium were determined as described in Materials and Methods. “Hydrolysate” refers to medium immediately prior to inoculation, “Exp,” “Trans,” and “Stat” refers to samples collected during exponential, transition, and stationary phase growth, respectively. (A) Metabolic fate of hydroxymethylfurfural (HMF). Concentrations of HMF and 2,5-bis-HMF (2,5-bis-hydroxymethylfurfuryl alcohol) are represented. (B) Metabolic fates of the major aromatic acids and amides. Concentrations of ferulic acid, feruloyl amide, coumaric acid, and coumaroyl amide are shown. (C) Concentration of acetaldehyde in the culture medium when GLBRCE1 was grown in SynH2, SynH2−, or SynH2 with aromatic aldehydes only omitted.
Although HMF disappeared early in fermentation, acetaldehyde accumulated to >10 mM during exponential and transition phase in both SynH2 and ACSH (Figure 3C, Table S8). Elevated acetaldehyde relative to SynH2− was also observed upon omission of aromatic aldehydes from SynH2, demonstrating that LC-derived phenolic acids and amides alone can cause accumulation of acetaldehyde (Figure 3C). Thus, acetaldehyde accumulation was not simply a consequence of diverting reducing equivalents to detoxification of the aromatic aldehydes like HMF but likely resulted from a broader impact of LC-derived inhibitors on cellular energetics that decreased the pools of NADH available for conversion of acetaldehyde to ethanol.
Lignocellulose-Derived Inhibitors Negatively Impact Carbon and Energy Metabolism, Resulting in Accumulation of Pyruvate and Acetaldehyde
Examination of intracellular metabolites revealed that aromatic inhibitors decreased the levels of metabolites associated with glycolysis and the TCA cycle (Figures 4B,E; Table S1). Strikingly, metabolites associated with cellular energetics and redox state were also decreased in SynH2 cells relative to SynH2− cells (Figures 4A,C,D,F; Table S1). ATP was reduced 30%; the NADH/NAD+ ratio decreased by 63%; and the NADPH/NADP+ ratio decreased 56%. Together, these data indicate that the aromatic inhibitors dramatically decreased cellular energy pools and available reducing equivalents in SynH2 cells. The consequences of energetic depletion were readily apparent with an approximate 100-fold increase in the intracellular levels of pyruvate in SynH2 cells (to ~14 mM), despite the disappearance of pyruvate from the growth medium (Table S1, Figure 4B, and data not shown). The increase in pyruvate and correspondingly in acetaldehyde (Figures 3C, 4B) suggest that the reduced rate of glucose-to-ethanol conversion caused by aromatic inhibitors results from inadequate supplies of NADH to convert acetaldehyde to ethanol.
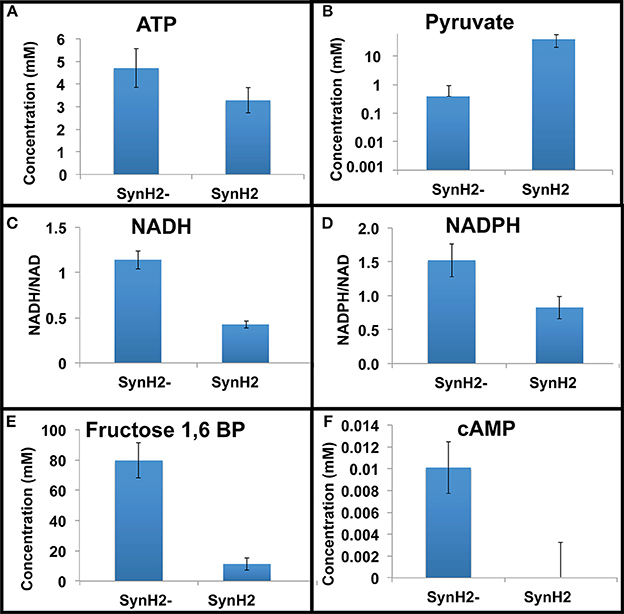
Figure 4. Relative metabolite levels in SynH2 and SynH2− cells. GLBRCE1 was cultured anaerobically in bioreactors in SynH2 and SynH2−. Metabolites were prepared from exponential phase cells and analyzed as described in the Material and Methods. Shown are intracellular concentrations of ATP (A), pyruvate (B), fructose-1,6-bisphosphate (E), and cAMP (F). (C,D) show the ratios of NADH/NAD+ and NADPH/NADP+, respectively.
Transition-phase SynH2 vs. SynH2− cells exhibited similar trends in aromatic-inhibitor-dependent depletion of some glycolytic intermediates, some TCA intermediates, and ATP, along with elevation of pyruvate and acetaldehyde (Table S1; Figure 3C). Stationary phase cells displayed several differences, however. Glycolytic intermediates (glucose 6-phosphate, fructose 6-phosphate, fructose 1,6 diphosphate, and 2-, 3-phosphoglycerate) were approximately equivalent in SynH2 and SynH2− cells, whereas pyruvate concentrations dropped significantly (Table S1). The impact of the inhibitors was largely attributable to the phenolic carboxylate and amides alone, as removal of the aldehydes from SynH2 changed neither the depletion of glycolytic and TCA intermediates nor the elevation of pyruvate and acetaldehyde (data not shown). We conclude that phenolic carboxylates and amides in SynH2 and ACSH have major negative impacts on the rate at which cells grow and consequently can convert glucose to ethanol.
Aromatic Inhibitors Induce Gene Expression Changes Reflecting Energy Stress
Given the major impacts of aromatic inhibitors on ethanologenesis, we next sought to address how these inhibitors impacted gene expression and regulation in E. coli growing in SynH2. To that end, we first identified pathways, transporters, and regulons with similar relative expression patterns in SynH2 and ACSH using both conventional gene set enrichment analysis and custom comparisons of aggregated gene expression ratios (Materials and Methods). These comparisons yielded a curated set of regulons, pathways, and transporters whose expression changed significantly in SynH2 or ACSH relative to SynH2− (aggregate p < 0.05; Table S4).
For many key pathways, transporters, and regulons, similar trends were seen in both SynH2 and ACSH vs. SynH2− (Figure 2 and Table S4). The most upregulated gene sets reflected key impacts of aromatic inhibitors on cellular energetics. Anabolic processes requiring a high NADPH/NADP+ potential were significantly upregulated (e.g., sulfur assimilation and cysteine biosynthesis, glutathione biosynthesis, and ribonucleotide reduction). Additionally, genes encoding efflux of drugs and aromatic carboxylates (e.g., aaeA) and regulons encoding efflux functions (e.g., the rob regulon), were elevated. Curiously, both transport and metabolism of xylose were downregulated in all three growth phases in both media, suggesting that even prior to glucose depletion aromatic inhibitors reduce expression of xylose genes and thus the potential for xylose conversion. Currently the mechanism of this repression is unclear, but it presumably reflects either an indirect impact of altered energy metabolism or an interaction of one or more of the aromatic inhibitors with a regulator that decreases xylose gene expression.
During transition phase, a different set of genes involved in nitrogen assimilation were upregulated in SynH2 cells and ACSH cells relative to SynH2− cells (Table S5). Previously, we found that transition phase corresponded to depletion of amino acid nitrogen sources (e.g., Glu and Gln; Schwalbach et al., 2012). Thus, this pattern of aromatic-inhibitor-induced increase in the expression of nitrogen assimilation genes during transition phase suggests that the reduced energy supply caused by the inhibitors increased difficulty of ATP-dependent assimilation of ammonia. Interestingly, the impact on gene expression appeared to occur earlier in ACSH than in SynH2, which may suggest that availability of organic nitrogen is even more growth limiting in ACSH.
Of particular interest were the patterns of changes in gene expression related to the detoxification pathways for the aromatic inhibitors. Our gene expression analysis revealed inhibitor induction of genes encoding aldehyde detoxification pathways (frmA, frmB, dkgA, and yqhD) that presumably target LC-derived aromatic aldehydes (e.g., HMF and vanillin) and acetaldehyde that accumulates when NADH-dependent reduction to ethanol becomes inefficient (Herring and Blattner, 2004; Gonzalez et al., 2006; Miller et al., 2009b, 2010; Wang et al., 2013) as well as efflux pumps controlled by MarA/SoxS/Rob (e.g., acrA and acrB) and the separate system for aromatic carboxylates (aaeA and aaeB) (Van Dyk et al., 2004). Interestingly, we observed that expression of the aldehyde detoxification genes frmA, frmB, dkgA, and yqhD paralleled the levels of LC-derived aromatic aldehydes and acetaldehyde detected in the media (Figure 3). Initially high-level expression was observed in SynH2 cells, which decreased as the aldehydes were inactivated (Figure 5A). Conversely, expression of these genes increased in SynH2− cells, surpassing the levels in SynH2 cells in stationary phase when the level of acetaldehyde in the SynH2− culture spiked past that in the SynH2 culture. The elevation of frmA and frmB is particularly noteworthy as the only reported substrate for FrmAB is formaldehyde. We speculate that this system, which has not been extensively studied in E. coli, may also act on acetaldehyde. Alternatively, formaldehyde, which we did not assay, may have accumulated in parallel to acetaldehyde.
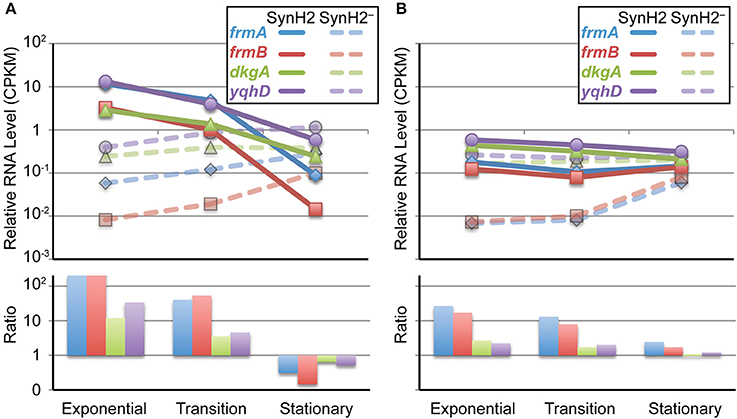
Figure 5. Growth phase-dependent changes in inhibitor-responsive gene expression. Changes in RNA levels for genes that comprise the major regulatory response to aromatic inhibitors in SynH2. Shown are normalized RNA-seq measurements (top panel) from GLBRCE1 grown in SynH2 (solid lines) or SynH2− (dotted lines) or their relative ratios (bottom panel) from exponential, transition, and stationary phases of growth as indicated. (A) Aldehyde detoxification genes (frmA, frmB, dkgA, and yqhC). (B) Genes that encode efflux pumps (aaeA, aaeB, acrA, acrB).
In contrast to the decrease in frmA, frmB, dkgA, and yqhD expression as SynH2 cells entered stationary phase, expression of aaeA, aaeB, acrA, and acrB remained high (Figure 5B). This continued high-level expression is consistent with the persistence of phenolic carboxylates and amides in the SynH2 culture (Figure 3), and presumably reflect the futile cycle of antiporter excretion of these inhibitors to compete with constant leakage back into cells.
Post-Transcriptional Effects of Aromatic Inhibitors were Limited Primarily to Stationary Phase
We next investigated the extent to which the aromatic inhibitors could exert effects on cellular regulation post-transcriptionally rather than via transcriptional regulators by comparing inhibitor-induced changes in protein levels to changes in RNA levels. For this purpose, we used iTRAQ quantitative proteomics to assess changes in protein levels (Material and Methods). We then normalized the log2-fold-changes in protein levels in each of the three growth phases to changes in RNA levels determined by RNA-seq and plotted the normalized values against each other (Figures 6A–C; Tables S6, S7). Most proteome and transcriptome fold-changes fall within a factor of 2 of the diagonal, consistent with concordant changes in mRNA and protein and thus limited post-transcriptional effects of aromatic inhibitors. A small number of RNA-protein pairs exhibited an >2-fold change with p < 0.05. During exponential phase, four proteins were present at elevated levels relative to changes in RNA levels, which actually decreased (RpoS, TnaA, MalE, and GlnH; red circles, Figure 6A; Table S7A), whereas 26 RNAs increased or decreased significantly with little difference in proteins levels (blue circles, Figure 6A; Table S7A). These disparate increases in RNA levels included some of the major transcriptional responses to the inhibitors (S assimilation and the FrmA aldehyde detoxification pathway), and these proteins were present at high levels both with and without inhibitors (Table S7D). Several observations led us to conclude that these discrepancies in protein and RNA levels between SynH2− and SynH2 cells reflect induction of expression in SynH2 cells but carryover of elevated protein levels in the inoculum of SynH2− cells not yet diluted in exponential phase. First, we sampled exponential phase between one and two cell doublings so that proteins elevated in stationary phase in the inoculum might still be present. Second, FrmRAB and S assimilation genes are elevated in stationary SynH2− cells relative to SynH2 cells (Table S7C), likely reflecting the greater accumulation of acetaldehyde in SynH2− cells in stationary phase (Figure 3C). Finally, RpoS and TnaA are markers of stationary phase (Lacour and Landini, 2004) and may reflect elevation of these proteins in SynH stationary cells carried over from the inoculum. In a similar vein, the apparent overrepresentation of PyrBI, GadABC, and MetEF proteins in SynH2 cells could reflect their greater abundance in stationary phase SynH2 cells that were carried over to early exponential phase.
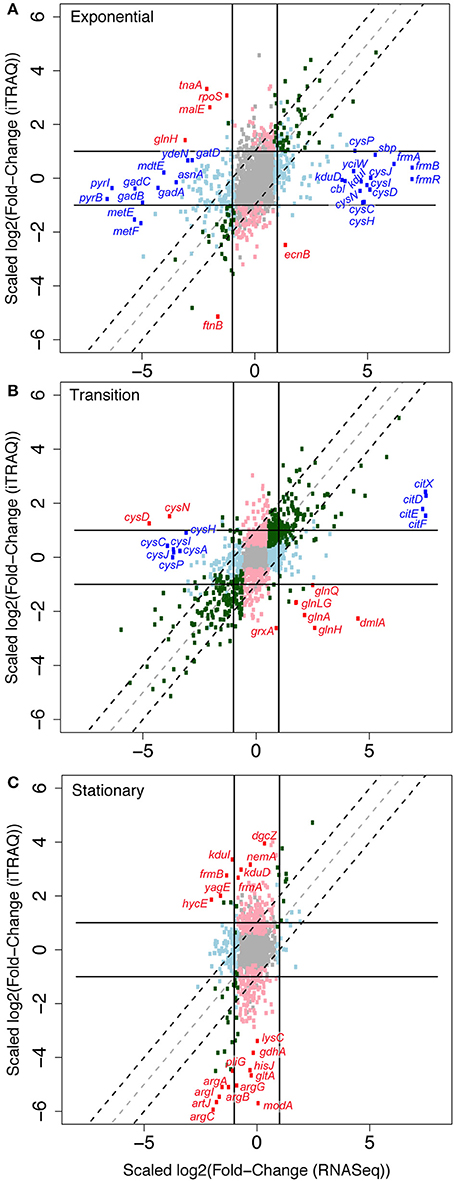
Figure 6. Effects of aromatic inhibitors on protein levels compared to effects on cognate RNA levels. Scatter plot comparing log2-fold RNA ratios (x-axis) to log2-fold protein ratios (y-axis) of GLBRCE1 genes and gene products for cells for grown in SynH2 compared to the reference medium, SynH2−. Cells were collected and proteomic samples prepared from exponential (A), transition (B), and stationary (C) growth phases. The lines indicate boundaries beyond which changes exceed 2-fold. The dotted lines demarcate the area expected for parallel changes in protein and RNA levels. Red, genes for which changes in protein levels were not paralleled by changes in the corresponding RNA and for which the discrepancy had a p ≤ 0.05 (see Table S7). Blue, genes for which changes in RNA levels were not paralleled by changes in the corresponding protein and for which the discrepancy had a p ≤ 0.05. Gray, p > 0.05 for both RNA and protein ratios. Light blue, p ≤ 0.05 for RNA ratio but not for protein ratio. Light pink, p ≤ 0.05 for protein ratio but not for RNA ratio. Green, p ≤ 0.05 for both RNA and protein ratios and effects are parallel.
Supporting this view, transition phase cells in which the inoculum was diluted >5-fold exhibited a higher correlation between protein and RNA levels and only limited evidence of post-transcriptional regulation caused by the aromatic inhibitors (Figure 6B). Three clusters of outliers reflected (i) reduced transcript levels for S assimilation genes in SynH2− without a corresponding drop in protein level (cys genes), (ii) higher levels of glnAGHLQ transcripts in SynH2 cells than SynH2− cells with high protein levels in both, and (iii) high induction of transcripts for the citrate assimilation system (citDEFX) in SynH2 with lesser induction of protein levels. These effects likely reflect adjustment of S assimilation gene expression during transition phase, a greater induction of N assimilation in the more rapidly growing SynH2 cells, and induction of citrate assimilation by the aromatic inhibitors.
The clearest evidence for post-transcriptional regulation caused by the aromatic inhibitors appeared in stationary phase (Figure 6C). A set of proteins involved in arginine, glutamate, lysine and citrate biosynthesis (ArgABCGI, GdhA, LysC, GltA) and periplasmic proteins arginine high-affinity import (ArtJ), histidine high-affinity import (HisJ), molybdate import (ModA), and lysozyme inhibition (PliG) decreased dramatically in SynH2 cells relative to SynH2− cells without corresponding reductions of their transcripts. GdhA, other biosynthetic enzymes, and other periplasmic binding proteins are degraded by the ClpP protease during C or N starvation (Maurizi and Rasulova, 2002; Weichart et al., 2003); Lon protease also has been implicated in proteolysis upon C starvation (Luo et al., 2008). Thus, we suggest that aromatic inhibitors may enhance degradation of proteins involved in N and C metabolism in stationary phase cells. The periplasmic proteins must be degraded as precursors or mediated by an additional effect involving periplasmic proteases.
Discussion
Results of our investigation into the effects of LC-derived inhibitors on E. coli ethanologenesis support several key conclusions that will guide future work. First, a chemically defined mimic of ACSH (SynH2) that contained the major inhibitors found by chemical analysis of ACSH adequately replicated both growth and the rates of glucose and xylose conversion to ethanol by E. coli. SynH2-replication of ACSH required inclusion of osmolytes found in ACSH and established that, at the ratios present in ACSH, phenolic carboxylates and amides, which are not metabolized by E. coli, had a greater overall impact on cell growth than phenolic aldehydes and furfurals, which were metabolized. In both SynH2 and ACSH, E. coli entered a metabolically active stationary phase as cells exhausted organic sources of N and S (e.g., amino acids) and during which the inhibitors greatly reduced xylose conversion. The impact of inhibitors on cellular energetics reduced levels of ATP, NADH, and NADPH and was seen most dramatically for energetically challenging processes requiring NADPH (like SO−24 assimilation and deoxyribonucleotide production), during transition to the stationary phase on ATP-dependent NH3 assimilation, and in elevated pyruvate levels presumably reflecting reduced NADH-dependent flux of pyruvate to ethanol (Figure 7). The direct effects of the inhibitors on cells appear to be principally mediated by transcriptional rather than translational regulators, with the MarA/SoxS/Rob network, AaeR, FrmR, and YqhC being the most prominent players. Although the effect of the inhibitors on transcriptional regulation of the efflux pumps was striking, increased efflux activity itself may perturb cellular metabolism. For example, Dhamdhere and Zgurskaya (2010) have shown that deletion of the AcrAB-TolC complex results in metabolic shutdown and high NADH/NAD+ ratios. By analogy, overexpression of efflux pumps may have the opposite effect (e.g., lowering of NADH/NAD+ ratios), which is consistent with observations in this study. In addition, recent work suggests that the acrAB promoter is upregulated in response to certain cellular metabolites (including those related to cysteine and purine biosynthesis), which are normally effluxed by this pump (Ruiz and Levy, 2014). Therefore, upregulation of AcrAB-TolC may impact homeostatic mechanisms of cellular biosynthetic pathways, resulting in continuous upregulation of pathways that require large amounts of reducing power in the form of NADPH. It is also possible that LC-derived inhibitors perturb metabolism directly in ways that generate additional AcrAB-TolC substrates, potentially increasing energy-consuming efflux further. Given these intricacies, further studies to unravel the mechanistic details of the effects of efflux pump activity on cellular metabolism, as a result of exposure to LC-derived inhibitors, are warranted.
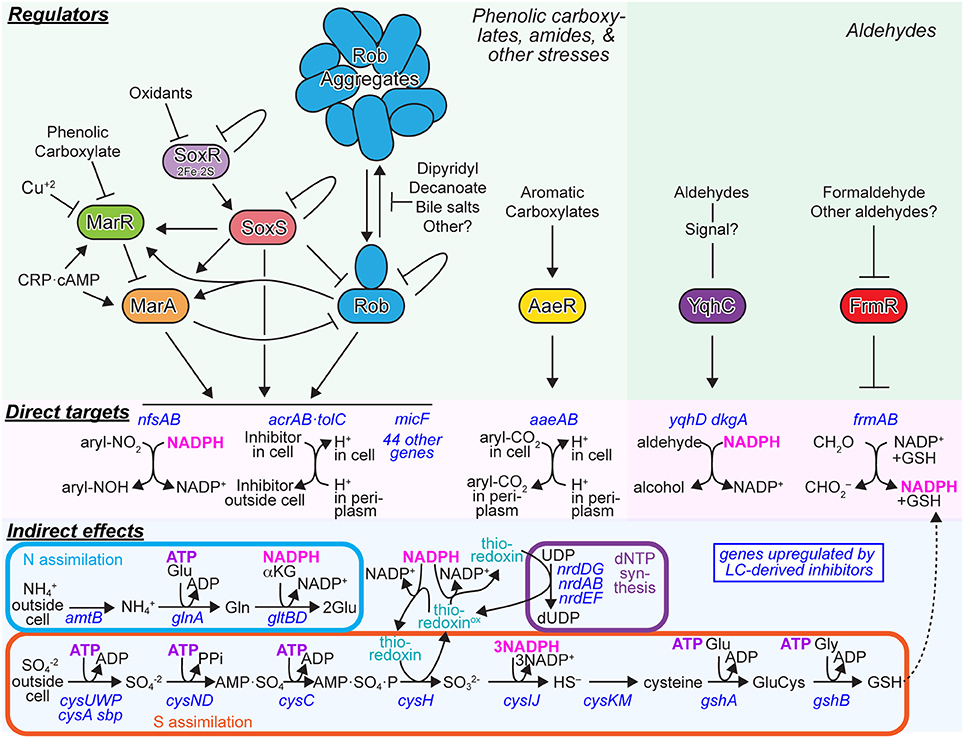
Figure 7. Major Regulatory responses of E. coli to aromatic inhibitors found in ACSH. The major E. coli responses to phenolic carboxylates and amides (left) or responses to aldehydes (right) are depicted. Green panels, regulators and signaling interactions that mediate the regulatory responses. Pink panels, direct targets of the regulators that consume reductant (NADPH) for detoxification reactions or deplete the proton motive force through continuous antiporter efflux of aromatic carboxylates. Blue panels, indirect effects of inhibitors mediated by reductions in ATP and NADPH levels.
The inability of cells to convert xylose in the presence of inhibitors appears to result from a combination of both effects on gene expression and some additional effect on transport or metabolism. The inhibitors lowered xylose gene expression (XylR regulon; xylABFGH) by a factor of 3-5 during all three growth phases (Table S4). This effect was not caused by the previously documented AraC repression (Desai and Rao, 2010), since it persisted in SynH2 when we replaced the AraC effector L-arabinose with D-arabinose, but might reflect lower levels of cAMP caused by the inhibitors (Figure 4); both the xylAB and xylFGH operons are also regulated by CRP·cAMP. Nonetheless, significant levels of XylA, B, and F were detected even in the presence of inhibitors (Table S7D), even though xylose conversion remained inhibited even after glucose depletion (Table 2). Thus, the inability to convert xylose may also reflect either the overall impact of inhibitors on cellular energetics somehow making xylose conversion unfavorable or an effect of xylose transport or metabolism that remains to be discovered. Further studies of the impact of inhibitors on xylose transport and metabolism are warranted. It would be particularly interesting to test SynH formulations designed to compare the conversion efficiencies of xylose, arabinose, and C6 sugars other than glucose.
The central focus of this study was to understand the impact of inhibitors of gene expression regulatory networks. The apparent lack of involvement of post-transcriptional regulation suggests that E. coli mounts a defense against LC-derived inhibitors principally by controlling gene transcription, probably reflecting evolution of specific bacterial responses to LC-derived inhibitors. Although enteric bacteria do not ordinarily encounter industrial lignocellulosic hydrolysates, they likely encounter the same suite of compounds from digested plant material in the mammalian gut. Thus, evolution of specific responses is reasonable. A key question for future studies is whether phenolic amides, not ordinarily present in digested biomass, will also invoke these responses in the absence of carboxylates or aldehydes. We note that the apparent absence of a translational regulatory response in the cellular defense against LC-derived inhibitors does not preclude involvement of either direct or indirect post-transcriptional regulation in fine-tuning the response. Our proteomic measurements would likely not have detected fine-tuning. Additionally, we did detect an apparently indirect induction by inhibitors of protein degradation in stationary phase, possibly in response to C starvation (Figure 6C). Finally, we note that the sRNA micF, a known post-transcriptional regulator, is a constituent of the MarA/SoxS/Rob regulon and was upregulated by inhibitors. Although confidence was insignificant due to poor detection of sRNAs in RNAseq data, the induction of micF was confirmed in a separate study of sRNAs (Ong and Landick, in preparation). Thus, a more focused study of the involvement of sRNAs in responses to LC inhibitors would likely be informative.
MarA/SoxS/Rob is a complex regulon consisting of the three inter-connected primary AraC-class regulators that bind as monomers to 20-bp sites in promoters with highly overlapping specificity and synergistically regulate ~50 genes implicated in resistance to multiple antibiotics and xenobiotics, solvent tolerance, outer membrane permeability, DNA repair, and other functions (Chubiz et al., 2012; Duval and Lister, 2013; Garcia-Bernardo and Dunlop, 2013) (Figure 7). Twenty-three genes, including those encoding the AcrAB·TolC efflux pump, the NfsAB nitroreductases, the micF sRNA, superoxide dismutase, some metabolic enzymes (e.g., Zwf, AcnA, and FumC) and incompletely characterized stress proteins are controlled by all three regulators, whereas other genes are annotated as being controlled by only a subset of the regulators (Duval and Lister, 2013), www.ecocyc.org; (Keseler et al., 2013). MarA and SoxS lack the C-terminal dimerization domain of AraC; this domain is present on Rob and appears to mediate regulation by aggregation that can be reversed by effectors (Griffith et al., 2009). Inputs capable of inducing these genes, either through the MarR and SoxR repressors that control MarA and SoxS, respectively, or by direct effects on Rob include phenolic carboxylates, Cu2+, a variety of organic oxidants, dipyridyl, decanoate, bile salts, Fis, and Crp·cAMP (Martin and Rosner, 1997; Rosner et al., 2002; Rosenberg et al., 2003; Chubiz and Rao, 2010; Duval and Lister, 2013; Hao et al., 2014) (Figure 7). Given these diverse inputs, it seems highly likely that ferulate and coumarate in ACSH induce the MarA/SoxS/Rob regulon via MarR. Indeed, LC-hydrolysate and ferulate induction of MarA has been reported (Lee et al., 2012). Interestingly, Cu2+ recently was shown to induce MarR by oxidation to create MarR disulfide dimer (Hao et al., 2014). Given the elevated levels of Cu2+ in ACSH reflected by induction of Cu2+ efflux (Figure 2; Table S4), induction of MarA/SoxS/Rob in ACSH may result from synergistic effects of Cu2+ and phenolic carboxylates, oxidants that affect SoxR, and yet-to-be-determined compounds that affect Rob. A second response in LC-derived inhibitors appears to be mounted by the LysR-type regulator AaeR, which controls the AaeAB aromatic carboxylate efflux system (Van Dyk et al., 2004) (Figure 7). Both phenolic and aryl carboxylates induce AaeAB through AaeR, but little is known about its substrate specificity or mechanism of activation.
Two distinct regulators, YqhC and FrmR, control synthesis of the YqhD/DkgA NAPDH-dependent aldehyde reductases and the FrmAB formaldehyde oxidase, respectively (Herring and Blattner, 2004; Turner et al., 2011). Even less is known about these regulators, although the DNA-binding properties of YqhC have been determined. In particular, it is unclear how aldehydes cause induction, although the current evidence suggests effects on YqhC are likely to be indirect. Given the central role of the regulators AaeR, YqhC, and FrmR in the cellular response to LC-derived inhibitors, further study of their properties and mechanisms is likely to be profitable. With sufficient understanding and engineering, they could be used as response regulators to engineer cells that respond to LC-inhibitors in ways that maximize microbial conversion of sugars to biofuels.
What types of responses would optimize biofuel synthesis? It appears the naturally evolved responses, namely induction of efflux systems and NADPH-dependent detoxification pathways, may not be optimal for efficient synthesis of biofuels. We infer this conclusion for several reasons. First, our gene expression results reveal that crucial pathways for cellular biosynthesis that are among the most energetically challenging processes in cells, S assimilation, N assimilation, and ribonucleotide reduction, are highly induced by LC-derived inhibitors (Figures 2, 7; Table S4). A reasonable conjecture is that the diversion of energy pools, including NADPH and ATP, to detoxification makes S assimilation, N assimilation, and ribonucleotide reduction difficult, increasing expression of genes for these pathways indirectly. The continued presence of the phenolic carboxylates and amides (Figure 3) likely causes futile cycles of efflux. As both the AcrAB and AaeAB efflux pumps function as proton antiporters (Figure 7), continuous efflux is expected to decrease ATP synthesis by depleting the proton-motive force. Although this response makes sense evolutionarily because it protects DNA from damage by xenobiotics, it does not necessarily aid conversion of sugars to biofuels. Disabling these efflux and detoxification systems, especially during stationary phase when cell growth is no longer necessary, could improve rates of ethanologenesis. Indeed, Ingram and colleagues have shown that disabling the NADPH-dependent YqhD/DkgA enzymes or better yet replacing them with NADH-dependent aldehyde reductases (e.g., FucO) can improve ethanologenesis in furfural-containing hydrolysates of acid-pretreated biomass (Wang et al., 2011a, 2013). That simply deleting yqhD improves ethanologenesis argues that, in at least some cases, it is better to expose cells to LC-derived inhibitors than to spend energy detoxifying the inhibitors.
Some previous efforts to engineer cells for improved biofuel synthesis have focused on overexpression of selected efflux pumps to reduce the toxic effects of biofuel products (Dunlop et al., 2011). Although this strategy may help cells cope with the effects of biofuel products, our results suggest an added potential issue when dealing with real hydrolysates, namely that efflux pumps may also reduce the rates of biofuel yields by futile cycling of LC-derived inhibitors. Thus, effective use of efflux pumps will require careful control of their synthesis (Harrison and Dunlop, 2012). An alternative strategy to cope with LC-derived inhibitors may be to devise metabolic routes to assimilate them into cellular metabolism.
In conclusion, our findings illustrate the utility of using chemically defined mimics of biomass hydrolysates for genome-scale study of microbial biofuel synthesis as a strategy to identify barriers to biofuel synthesis. By identifying the main inhibitors present in ammonia-pretreated biomass hydrolysate and using these inhibitors in a synthetic hydrolysate, we were able to identify the key regulators responsible for the cellular responses that reduced the rate of ethanol production and limited xylose conversion to ethanol. Knowledge of these regulators will enable design of new control circuits to improve microbial biofuel production.
Conflict of Interest Statement
The authors declare that the research was conducted in the absence of any commercial or financial relationships that could be construed as a potential conflict of interest.
Acknowledgments
The authors thank Trey Sato and Jeff Piotrowski for critical reading of the manuscript, Fachuang Lu and John Ralph for advice on synthesis of feruloyl and coumaroyl amide, and Christa Pennacchio and colleagues at the Joint Genome Institute for cDNA library preparation and sequencing. This work was funded by the DOE Great Lakes Bioenergy Research Center (DOE BER Office of Science DE-FC02-07ER64494). Portions of this research were enabled by the DOE GSP under the Pan-omics project. Work was performed in the Environmental Molecular Science Laboratory, a U.S. Department of Energy (DOE) national scientific user facility at Pacific Northwest National Laboratory (PNNL) in Richland, WA. Battelle operates PNNL for the DOE under contract DE-AC05-76RLO01830.
Supplementary Material
The Supplementary Material for this article can be found online at: http://www.frontiersin.org/journal/10.3389/fmicb.2014.00402/abstract
References
Bantscheff, M., Boesche, M., Eberhard, D., Matthieson, T., Sweetman, G., and Kuster, B. (2008). Robust and sensitive iTRAQ quantification on an LTQ Orbitrap mass spectrometer. Mol. Cell. Proteomics 7, 1702–1713. doi: 10.1074/mcp.M800029-MCP200
Booth, I. R., Ferguson, G. P., Miller, S., Li, C., Gunasekera, B., and Kinghorn, S. (2003). Bacterial production of methylglyoxal: a survival strategy or death by misadventure? Biochem. Soc. Trans. 31, 1406–1408. doi: 10.1042/BST0311406
Buescher, J. M., Moco, S., Sauer, U., and Zamboni, N. (2010). Ultrahigh performance liquid chromatography-tandem mass spectrometry method for fast and robust quantification of anionic and aromatic metabolites. Anal. Chem. 82, 4403–4412. doi: 10.1021/ac100101d
Chubiz, L. M., Glekas, G. D., and Rao, C. V. (2012). Transcriptional cross talk within the mar-sox-rob regulon in Escherichia coli is limited to the rob and marRAB operons. J. Bacteriol. 194, 4867–4875. doi: 10.1128/JB.00680-12
Chubiz, L. M., and Rao, C. V. (2010). Aromatic acid metabolites of Escherichia coli K-12 can induce the marRAB operon. J. Bacteriol. 192, 4786–4789. doi: 10.1128/JB.00371-10
Chundawat, S. P., Beckham, G. T., Himmel, M. E., and Dale, B. E. (2011). Deconstruction of lignocellulosic biomass to fuels and chemicals. Annu. Rev. Chem. Biomol. Eng. 2, 121–145. doi: 10.1146/annurev-chembioeng-061010-114205
Dalrymple, B. P., and Swadling, Y. (1997). Expression of a Butyrivibrio fibrisolvens E14 gene (cinB) encoding an enzyme with cinnamoyl ester hydrolase activity is negatively regulated by the product of an adjacent gene (cinR). Microbiology 143, 1203–1210. doi: 10.1099/00221287-143-4-1203
Desai, T. A., and Rao, C. V. (2010). Regulation of arabinose and xylose metabolism in Escherichia coli. Appl. Environ. Microbiol. 76, 1524–1532. doi: 10.1128/AEM.01970-09
Dhamdhere, G., and Zgurskaya, H. I. (2010). Metabolic shutdown in Escherichia coli cells lacking the outer membrane channel TolC. Mol. Microbiol. 77, 743–754. doi: 10.1111/j.1365-2958.2010.07245.x
Dunlop, M. J., Dossani, Z. Y., Szmidt, H. L., Chu, H. C., Lee, T. S., Keasling, J. D., et al. (2011). Engineering microbial biofuel tolerance and export using efflux pumps. Mol. Syst. Biol. 7, 487. doi: 10.1038/msb.2011.21
Duval, V., and Lister, I. M. (2013). MarA, SoxS and Rob of Escherichia coli–Global regulators of multidrug resistance, virulence, and stress response. Int. J. Biotechnol. Wellness Ind. 2, 101–124. doi: 10.6000/1927-3037.2013.02.03.2
Garcia-Bernardo, J., and Dunlop, M. J. (2013). Tunable stochastic pulsing in the Escherichia coli multiple antibiotic resistance network from interlinked positive and negative feedback loops. PLoS Comput. Biol. 9:e1003229. doi: 10.1371/journal.pcbi.1003229
Gonzalez, C. F., Proudfoot, M., Brown, G., Korniyenko, Y., Mori, H., Savchenko, A. V., et al. (2006). Molecular basis of formaldehyde detoxification. Characterization of two S-formylglutathione hydrolases from Escherichia coli, FrmB and YeiG. J. Biol. Chem. 281, 14514–14522. doi: 10.1074/jbc.M600996200
Goodarzi, H., Bennett, B. D., Amini, S., Reaves, M. L., Hottes, A. K., Rabinowitz, J. D., et al. (2010). Regulatory and metabolic rewiring during laboratory evolution of ethanol tolerance in E. coli. Mol. Syst. Biol. 6, 378. doi: 10.1038/msb.2010.33
Griffith, K. L., Fitzpatrick, M. M., Keen, E. F., and Wolf, R. E. (2009). Two functions of the C-terminal domain of Escherichia coli Rob: mediating “sequestration–dispersal” as a novel off–on switch for regulating Rob's activity as a transcription activator and preventing degradation of Rob by Lon protease. J. Mol. Biol. 388, 415–430. doi: 10.1016/j.jmb.2009.03.023
Hao, Z., Lou, H., Zhu, R., Zhu, J., Zhang, D., Zhao, B. S., et al. (2014). The multiple antibiotic resistance regulator MarR is a copper sensor in Escherichia coli. Nat. Chem. Biol. 10, 21–28. doi: 10.1038/nchembio.1380
Harrison, M. E., and Dunlop, M. J. (2012). Synthetic feedback loop model for increasing microbial biofuel production using a biosensor. Front. Microbiol. 3:360. doi: 10.3389/fmicb.2012.00360
Herring, C. D., and Blattner, F. R. (2004). Global transcriptional effects of a suppressor tRNA and the inactivation of the regulator frmR. J. Bacteriol. 186, 6714–6720. doi: 10.1128/JB.186.20.6714-6720.2004
Ingram, L. O., and Buttke, T. M. (1984). Effects of alcohols on micro-organisms. Adv. Microb. Physiol. 25, 253–300.
Jarboe, L. R. (2011). YqhD: a broad-substrate range aldehyde reductase with various applications in production of biorenewable fuels and chemicals. Appl. Microbiol. Biotechnol. 89, 249–257. doi: 10.1007/s00253-010-2912-9
Kelly, R. T., Page, J. S., Luo, Q., Moore, R. J., Orton, D. J., Tang, K., et al. (2006). Chemically etched open tubular and monolithic emitters for nanoelectrospray ionization mass spectrometry. Anal. Chem. 78, 7796–7801. doi: 10.1021/ac061133r
Keseler, I. M., Mackie, A., Peralta-Gil, M., Santos-Zavaleta, A., Gama-Castro, S., Bonavides-Martinez, C., et al. (2013). EcoCyc: fusing model organism databases with systems biology. Nucleic Acids Res. 41, D605–D612. doi: 10.1093/nar/gks1027
Kim, S., Gupta, N., and Pevzner, P. A. (2008). Spectral probabilities and generating functions of tandem mass spectra: a strike against decoy databases. J. Proteome Res. 7, 3354–3363. doi: 10.1021/pr8001244
Klinke, H. B., Thomsen, A. B., and Ahring, B. K. (2004). Inhibition of ethanol-producing yeast and bacteria by degradation products produced during pre-treatment of biomass. Appl. Microbiol. Biotechnol. 66, 10–26. doi: 10.1007/s00253-004-1642-2
Lacour, S., and Landini, P. (2004). SigmaS-dependent gene expression at the onset of stationary phase in Escherichia coli: function of sigmaS-dependent genes and identification of their promoter sequences. J. Bacteriol. 186, 7186–7195. doi: 10.1128/JB.186.21.7186-7195.2004
Langmead, B., Trapnell, C., Pop, M., and Salzberg, S. L. (2009). Ultrafast and memory-efficient alignment of short DNA sequences to the human genome. Genome Biol. 10:R25. doi: 10.1186/gb-2009-10-3-r25
Lau, M. W., and Dale, B. E. (2010). Effect of primary degradation-reaction products from Ammonia Fiber Expansion (AFEX)-treated corn stover on the growth and fermentation of Escherichia coli KO11. Bioresour. Technol. 101, 7849–7855. doi: 10.1016/j.biortech.2010.04.076
Lawford, H. G., and Rousseau, J. D. (1995). Comparative energetics of glucose and xylose metabolism in ethanologenic recombinant Escherichia coli B. Appl. Biochem. Biotechnol. 51–52, 179–195.
Lee, S., Nam, D., Jung, J. Y., Oh, M. K., Sang, B. I., and Mitchell, R. J. (2012). Identification of Escherichia coli biomarkers responsive to various lignin-hydrolysate compounds. Bioresour. Technol. 114, 450–456. doi: 10.1016/j.biortech.2012.02.085
Li, B., and Dewey, C. N. (2011). RSEM: accurate transcript quantification from RNA-Seq data with or without a reference genome. BMC Bioinformatics 12:323. doi: 10.1186/1471-2105-12-323
Liu, Z. L. (2011). Molecular mechanisms of yeast tolerance and in situ detoxification of lignocellulose hydrolysates. Appl. Microbiol. Biotechnol. 90, 809–825. doi: 10.1007/s00253-011-3167-9
Luo, S., McNeill, M., Myers, T. G., Hohman, R. J., and Levine, R. L. (2008). Lon protease promotes survival of Escherichia coli during anaerobic glucose starvation. Arch. Microbiol. 189, 181–185. doi: 10.1007/s00203-007-0304-z
Maiolica, A., Borsotti, D., and Rappsilber, J. (2005). Self-made frits for nanoscale columns in proteomics. Proteomics 5, 3847–3850. doi: 10.1002/pmic.200402010
Martin, R. G., and Rosner, J. L. (1997). Fis, an accessorial factor for transcriptional activation of the mar (multiple antibiotic resistance) promoter of Escherichia coli in the presence of the activator MarA, SoxS, or Rob. J. Bacteriol. 179, 7410–7419.
Marx, C. J., Miller, J. A., Chistoserdova, L., and Lidstrom, M. E. (2004). Multiple formaldehyde oxidation/detoxification pathways in Burkholderia fungorum LB400. J. Bacteriol. 186, 2173–2178. doi: 10.1128/JB.186.7.2173-2178.2004
Maurizi, M. R., and Rasulova, F. (2002). Degradation of L-glutamate dehydrogenase from Escherichia coli: allosteric regulation of enzyme stability. Arch. Biochem. Biophys. 397, 206–216. doi: 10.1006/abbi.2001.2703
Miller, E. N., and Ingram, L. O. (2007). Combined effect of betaine and trehalose on osmotic tolerance of Escherichia coli in mineral salts medium. Biotechnol. Lett. 29, 213–217. doi: 10.1007/s10529-006-9226-0
Miller, E. N., Jarboe, L. R., Turner, P. C., Pharkya, P., Yomano, L. P., York, S. W., et al. (2009a). Furfural inhibits growth by limiting sulfur assimilation in ethanologenic Escherichia coli strain LY180. Appl. Environ. Microbiol. 75, 6132–6141. doi: 10.1128/AEM.01187-09
Miller, E. N., Jarboe, L. R., Yomano, L. P., York, S. W., Shanmugam, K. T., and Ingram, L. O. (2009b). Silencing of NADPH-dependent oxidoreductase genes (yqhD and dkgA) in furfural-resistant ethanologenic Escherichia coli. Appl. Environ. Microbiol. 75, 4315–4323. doi: 10.1128/AEM.00567-09
Miller, E. N., Turner, P. C., Jarboe, L. R., and Ingram, L. O. (2010). Genetic changes that increase 5-hydroxymethyl furfural resistance in ethanol-producing Escherichia coli LY180. Biotechnol. Lett. 32, 661–667. doi: 10.1007/s10529-010-0209-9
Mills, T. Y., Sandoval, N. R., and Gill, R. T. (2009). Cellulosic hydrolysate toxicity and tolerance mechanisms in Escherichia coli. Biotechnol. Biofuels 2:26. doi: 10.1186/1754-6834-2-26
Monroe, M. E., Shaw, J. L., Daly, D. S., Adkins, J. N., and Smith, R. D. (2008). MASIC: a software program for fast quantitation and flexible visualization of chromatographic profiles from detected LC-MS(/MS) features. Comput. Biol. Chem. 32, 215–217. doi: 10.1016/j.compbiolchem.2008.02.006
Neidhardt, F. C., Bloch, P. L., and Smith, D. F. (1974). Culture medium for enterobacteria. J. Bacteriol. 119, 736–747.
Pasa-Tolic, L., Masselon, C., Barry, R. C., Shen, Y., and Smith, R. D. (2004). Proteomic analyses using an accurate mass and time tag strategy. Biotechniques 37, 621–624, 626–633, 636 passim.
Piotrowski, J. S., Zhang, Y., Bates, D. M., Keating, D. H., Sato, T. K., Ong, I. M., et al. (2014). Death by a thousand cuts: the challenges and diverse landscape of lignocellulosic hydrolysate inhibitors. Front. Microbiol. 5:90. doi: 10.3389/fmicb.2014.00090
Purvis, J. E., Yomano, L. P., and Ingram, L. O. (2005). Enhanced trehalose production improves growth of Escherichia coli under osmotic stress. Appl. Environ. Microbiol. 71, 3761–3769. doi: 10.1128/AEM.71.7.3761-3769.2005
Robinson, M. D., McCarthy, D. J., and Smyth, G. K. (2010). edgeR: a Bioconductor package for differential expression analysis of digital gene expression data. Bioinformatics 26, 139–140. doi: 10.1093/bioinformatics/btp616
Rosenberg, E. Y., Bertenthal, D., Nilles, M. L., Bertrand, K. P., and Nikaido, H. (2003). Bile salts and fatty acids induce the expression of Escherichia coli AcrAB multidrug efflux pump through their interaction with Rob regulatory protein. Mol. Microbiol. 48, 1609–1619. doi: 10.1046/j.1365-2958.2003.03531.x
Rosner, J. L., Dangi, B., Gronenborn, A. M., and Martin, R. G. (2002). Posttranscriptional activation of the transcriptional activator Rob by dipyridyl in Escherichia coli. J. Bacteriol. 184, 1407–1416. doi: 10.1128/JB.184.5.1407-1416.2002
Ross, P. L., Huang, Y. N., Marchese, J. N., Williamson, B., Parker, K., Hattan, S., et al. (2004). Multiplexed protein quantitation in Saccharomyces cerevisiae using amine-reactive isobaric tagging reagents. Mol. Cell. Proteomics 3, 1154–1169. doi: 10.1074/mcp.M400129-MCP200
Ruiz, C., and Levy, S. B. (2014). Regulation of acrAB expression by cellular metabolites in Escherichia coli. J. Antimicrob. Chemother. 69, 390–399. doi: 10.1093/jac/dkt352
Schwalbach, M. S., Keating, D. H., Tremaine, M., Marner, W. D., Zhang, Y., Bothfeld, W., et al. (2012). Complex physiology and compound stress responses during fermentation of alkali-pretreated corn stover hydrolysate by an Escherichia coli ethanologen. Appl. Environ. Microbiol. 78, 3442–3457. doi: 10.1128/AEM.07329-11
Sezonov, G., Joseleau-Petit, D., and D'Ari, R. (2007). Escherichia coli physiology in Luria-Bertani broth. J. Bacteriol. 189, 8746–8749. doi: 10.1128/JB.01368-07
Smith, G. K. (2005). “Limma: linear models for microarray data,” in Bioinformatics and Computational Biology Solutions Using R and Bioconductor, eds R. Gentleman, V. Carey, S. Dudoit, R. Irizarry, and W. Huber (New York, NY: Springer), 397–420.
Smyth, G. K. (2004). Linear models and empirical bayes methods for assessing differential expression in microarray experiments. Stat. Appl. Genet. Mol. Biol. 3, Article3. doi: 10.2202/1544-6115.1027
Subramanian, A., Tamayo, P., Mootha, V. K., Mukherjee, S., Ebert, B. L., Gillette, M. A., et al. (2005). Gene set enrichment analysis: a knowledge-based approach for interpreting genome-wide expression profiles. Proc. Natl. Acad. Sci. U.S.A. 102, 15545–15550. doi: 10.1073/pnas.0506580102
Sulavik, M. C., Gambino, L. F., and Miller, P. F. (1995). The MarR repressor of the multiple antibiotic resistance (mar) operon in Escherichia coli: prototypic member of a family of bacterial regulatory proteins involved in sensing phenolic compounds. Mol. Med. 1, 436–446.
Turner, P. C., Miller, E. N., Jarboe, L. R., Baggett, C. L., Shanmugam, K. T., and Ingram, L. O. (2011). YqhC regulates transcription of the adjacent Escherichia coli genes yqhD and dkgA that are involved in furfural tolerance. J. Ind. Microbiol. Biotechnol. 38, 431–439. doi: 10.1007/s10295-010-0787-5
Underwood, S. A., Buszko, M. L., Shanmugam, K. T., and Ingram, L. O. (2004). Lack of protective osmolytes limits final cell density and volumetric productivity of ethanologenic Escherichia coli KO11 during xylose fermentation. Appl. Environ. Microbiol. 70, 2734–2740. doi: 10.1128/AEM.70.5.2734-2740.2004
Van Dyk, T. K., Templeton, L. J., Cantera, K. A., Sharpe, P. L., and Sariaslani, F. S. (2004). Characterization of the Escherichia coli AaeAB efflux pump: a metabolic relief valve? J. Bacteriol. 186, 7196–7204. doi: 10.1128/JB.186.21.7196-7204.2004
Varemo, L., Nielsen, J., and Nookaew, I. (2013). Enriching the gene set analysis of genome-wide data by incorporating directionality of gene expression and combining statistical hypotheses and methods. Nucleic Acids Res. 41, 4378–4391. doi: 10.1093/nar/gkt111
Wang, X., Miller, E. N., Yomano, L. P., Zhang, X., Shanmugam, K. T., and Ingram, L. O. (2011a). Increased furfural tolerance due to overexpression of NADH-dependent oxidoreductase FucO in Escherichia coli strains engineered for the production of ethanol and lactate. Appl. Environ. Microbiol. 77, 5132–5140. doi: 10.1128/AEM.05008-11
Wang, X., Yomano, L. P., Lee, J. Y., York, S. W., Zheng, H., Mullinnix, M. T., et al. (2013). Engineering furfural tolerance in Escherichia coli improves the fermentation of lignocellulosic sugars into renewable chemicals. Proc. Natl. Acad. Sci. U.S.A. 110, 4021–4026. doi: 10.1073/pnas.1217958110
Wang, Y., Yang, F., Gritsenko, M. A., Wang, Y., Clauss, T., Liu, T., et al. (2011b). Reversed-phase chromatography with multiple fraction concatenation strategy for proteome profiling of human MCF10A cells. Proteomics 11, 2019–2026. doi: 10.1002/pmic.201000722
Weichart, D., Querfurth, N., Dreger, M., and Hengge-Aronis, R. (2003). Global role for ClpP-containing proteases in stationary-phase adaptation of Escherichia coli. J. Bacteriol. 185, 115–125. doi: 10.1128/JB.185.1.115-125.2003
Yomano, L. P., York, S. W., and Ingram, L. O. (1998). Isolation and characterization of ethanol-tolerant mutants of Escherichia coli KO11 for fuel ethanol production. J. Ind. Microbiol. Biotechnol. 20, 132–138.
Keywords: Escherichia coli, lignocellulosic hydrolysate, aromatic inhibitors, transcriptomics, RNAseq, proteomics, ethanol, biofuels
Citation: Keating DH, Zhang Y, Ong IM, McIlwain S, Morales EH, Grass JA, Tremaine M, Bothfeld W, Higbee A, Ulbrich A, Balloon AJ, Westphall MS, Aldrich J, Lipton MS, Kim J, Moskvin OV, Bukhman YV, Coon JJ, Kiley PJ, Bates DM and Landick R (2014) Aromatic inhibitors derived from ammonia-pretreated lignocellulose hinder bacterial ethanologenesis by activating regulatory circuits controlling inhibitor efflux and detoxification. Front. Microbiol. 5:402. doi: 10.3389/fmicb.2014.00402
Received: 15 April 2014; Accepted: 17 July 2014;
Published online: 13 August 2014.
Edited by:
Katherine M. Pappas, University of Athens, GreeceReviewed by:
Carl James Yeoman, Montana State University, USAHelen Zgurskaya, University of Oklahoma, USA
Copyright © 2014 Keating, Zhang, Ong, McIlwain, Morales, Grass, Tremaine, Bothfeld, Higbee, Ulbrich, Balloon, Westphall, Aldrich, Lipton, Kim, Moskvin, Bukhman, Coon, Kiley, Bates and Landick. This is an open-access article distributed under the terms of the Creative Commons Attribution License (CC BY). The use, distribution or reproduction in other forums is permitted, provided the original author(s) or licensor are credited and that the original publication in this journal is cited, in accordance with accepted academic practice. No use, distribution or reproduction is permitted which does not comply with these terms.
*Correspondence: Donna M. Bates, Great Lakes Bioenergy Research Center, 4119 Wisconsin Energy Institute, University of Wisconsin - Madison, 1552 University Ave., Madison, WI 53726, USA e-mail: dbates@glbrc.wisc.edu;
Robert Landick, Department of Biochemistry, 5441 Microbial Sciences, 1550 Linden Dr., University of Wisconsin, Madison, WI 53706, USA e-mail: landick@biochem.wisc.edu
†These authors have contributed equally to this work.