 Wen-Chao Li
 Zhe-Jin Zhong
 Pan-Pan Zhu
 En-Ze Deng
 Hui Ding
 Wei Chen
 Hao Lin
- 1Key Laboratory for Neuro-Information of Ministry of Education, Center of Bioinformatics, School of Life Science and Technology, University of Electronic Science and Technology of China, Chengdu, China
- 2Department of Physics, School of Sciences and Center for Genomics and Computational Biology, Hebei United University, Tangshan, China
DNA replication is a highly precise process that is initiated from origins of replication (ORIs) and is regulated by a set of regulatory proteins. The mining of DNA sequence information will be not only beneficial for understanding the regulatory mechanism of replication initiation but also for accurately identifying ORIs. In this study, the GC profile and GC skew were calculated to analyze the compositional bias in the Saccharomyces cerevisiae genome. We found that the GC profile in the region of ORIs is significantly lower than that in the flanking regions. By calculating the information redundancy, an estimation of the correlation of nucleotides, we found that the intensity of adjoining correlation in ORIs is dramatically higher than that in flanking regions. Furthermore, the relationships between ORIs and nucleosomes as well as transcription start sites were investigated. Results showed that ORIs are usually not occupied by nucleosomes. Finally, we calculated the distribution of ORIs in yeast chromosomes and found that most ORIs are in transcription terminal regions. We hope that these results will contribute to the identification of ORIs and the study of DNA replication mechanisms.
Introduction
The well-known replication theory was proposed in 1963 based on a large number of experiments using the sexual system of Escherichia coli (Jacob et al., 1963). DNA replication is an orchestrated process. When a cell enters the S phase of replication, the DNA double helix of this cell is unwound. Then, replication forks are generated to allow the DNA synthesis machinery to copy each DNA strand in a bidirectional manner. In the process of replication, the specific regions that are responsible for the initiation of the replication of the genome are called origin of replication (ORI) regions. These regions are recognized by the origin recognition complex (ORC). The DNA replication process is usually activated only once per cell cycle to avoid amplification and maintain genome integrity (Cayrou et al., 2012).
Although most of bacterial genomes have only a single ORI region (Gao and Zhang, 2007) and some archaea use more than one ORI region to initiate DNA replication (Luo et al., 2014), the fungus, Saccharomyces cerevisiae (S. cerevisiae) has multiple ORIs on its chromosomes to perform complete replication in a reasonable period of time because of the large size of its genomes and the limitation of nucleotide incorporation during DNA synthesis. Therefore, predicting ORIs is more difficult in the S. cerevisiae genome than that in bacterial genomes. Several experiments have revealed that the activity of ORIs in yeast depends on a cis-acting replicator sequence termed autonomous replication sequence (ARS). These regulatory sequences are generally found in AT-rich regions in yeast genome. The ARS generally contains three domains: A, B, and C. An essential ARS consensus sequence (ACS) (T/A)TTTAT(A/G)TTT(T/A) usually appears in the A domain (Wu et al., 2014). The B domain contains a number of short sequence motifs that contribute to origin activity (Dhar et al., 2012). The motifs in the C domain are responsible for the interaction between DNA and regulatory proteins (Crampton et al., 2008). However, these motif sequences are not conserved enough to be used to identify ORIs (Nieduszynski et al., 2006). Thus, the discovery of the hidden intrinsic characteristics at the sequence level is helpful not only for understanding the regulatory mechanism but also for accurately identifying ORIs.
With the accumulation of experimental data (Levitsky et al., 2005; Yamashita et al., 2011; Gao et al., 2012), some researchers have analyzed features of replication. Recently, by analyzing four highly active origins, Chang et al. (2011) revealed that sequences adjacent to the ACS contributed substantially to origin activity and ORC binding. Yin et al. (2009) found that the nucleosome depletion regions are preferentially permissive for replication and proposed that the ORI organization imposed by nucleosome positioning is phylogenetically widespread in eukaryotes. DNA structure may also influence the distribution of ORIs. Chen et al. (2012) found that the DNA bendability and cleavage intensity in ORIs are dramatically lower than those in both upstream and downstream regions of ORIs.
Although some characteristics of ORIs have been described, the available information about ORIs is still far from satisfactory. Therefore, to clarify replication mechanisms, it is still necessary to discover the intrinsic characteristics of ORIs. With this in mind, we performed a series of analyses to investigate the composition bias and correlation of nucleotides in ORIs, the distribution of ORIs in genomes, and the relationships between ORIs and regulatory elements.
Materials and Methods
Datasets
The S. cerevisiae ORIs were collected from OriDB (Siow et al., 2012; http://www.oridb.org/). The confidence of the ORI data has three levels: confirmed, likely, and dubious. To provide a reliable and high-quality dataset, only the 410 experimentally confirmed ORIs were selected and used in the following analysis.
The complete S. cerevisiae genome was downloaded from GenBank (Benson et al., 2013). The 5015 transcription start sites (TSSs) of S. cerevisiae were previously published (Lee et al., 2007). The in vitro nucleosome data and nucleosome data from three growth conditions [ethanol, yeast extract, peptone, and dextrose (YPD) medium, and galactose] were previously reported (Yuan et al., 2005; Lee et al., 2007; Kaplan et al., 2009)
Sequence Composition Analysis
The GC profile represents the variation in GC content along the genomic sequence (Gao and Zhang, 2006), which can be defined by the following equation (Zhang et al., 2005; Xing et al., 2014):
where fi(A), fi(C), fi(G), and fi(T) are the frequencies of adenine(A), cytosine(C), guanine (G), and thymine(T), respectively, in the i-th sliding window along the sequence. The range of values for the GC profile is between 0 and +1. Values ranging from 0 to 0.5 indicate that the GC content in the i-th sliding window is lower than the AT content, while values ranging from 0.5 to 1 indicate that the GC content in the i-th sliding window is higher than the AT content.
GC skew was the first proposed computational method to identify ORIs in bacterial genomes (Lobry, 1996a,b). For a given sequence, the GC skew is defined by the following equation (McLean et al., 1998):
where fi(C) and fi(G) are the frequencies of cytosine(C), and guanine (G) in the i-th sliding window along a sequence, respectively. The range of values for GC skew is between -1 and +1. Values ranging from -1 to 0 indicate that fi(G) < fi(C), and values ranging from 0 to +1 indicate that fi(G) > fi(C).
Information Redundancy
As a genetic language, the nucleic acid sequence can be investigated through an information-theoretic method (Luo et al., 1998). In recent years, informational entropy was widely applied in the recognition and evolution research of DNA sequences (Grosse et al., 2000; Yu and Jiang, 2001; Otu and Sayood, 2003; Xing et al., 2013). The average mutual information profile is an excellent candidate for a species signature (Bauer et al., 2008). Based on these studies, we introduced the k-order information redundancy, which can be defined as follows (Luo et al., 1998):
where pi(k)j is the joint probability of base j occurring after base i at a distance k along the sequence. The term k= 0 indicates the adjacent correlation between two bases. Dk+2 describes the divergence of the sequence from independence and the correlation between nucleotides with the gap of k nucleotides. In general, the larger the Dk+2 value is, the stronger the divergence degree of the sequence from independence is. The H value is the informational entropy and is defined by the following equation
where pa is the probability of base a (a = A, G, C, or T) occurring in the sequence.
Results and Discussion
GC Content Surrounding ORIs
DNA sequence information is the most basic but important genetic information. It also plays an important role in the determination of ORIs in the S. cerevisiae genome. However, the extent to which ORIs are determined in vivo by cis-acting sequence is poorly understood. To investigate the compositional bias of ORIs, we calculated the GC content of 300 bp of each ORI. As a comparison, the GC content of the genome sequence was also calculated by using a window of 300 bp with a step of 300 bp. The mean GC content of ORIs is 0.3168 (SD = 0.23 × 10⁻²), which is significantly lower (P < 2.3 × e-133, Mann–Whitney U-test) than the genome-wide GC content (0.3796; SD = 0.24 × 10⁻²). In other words, ORIs are AT-rich. The high AT content of ORI sequences contributes to the opening of the DNA double helix structure for the initiation of DNA replication.
GC Profile and GC-Skew Surrounding ORI
To investigate the compositional bias, the GC profile and GC skew surrounding ORIs was calculated using a 50 bp sliding window with a step of 1 bp. The average scores of the GC profile and GC-skew are plotted in Figure 1. As illustrated in Figure 1A, the score of the GC profile in the ORI regions was statistically lower than that in the surrounding regions (P < 2.0 × e-86, Mann-Whitney U-test).
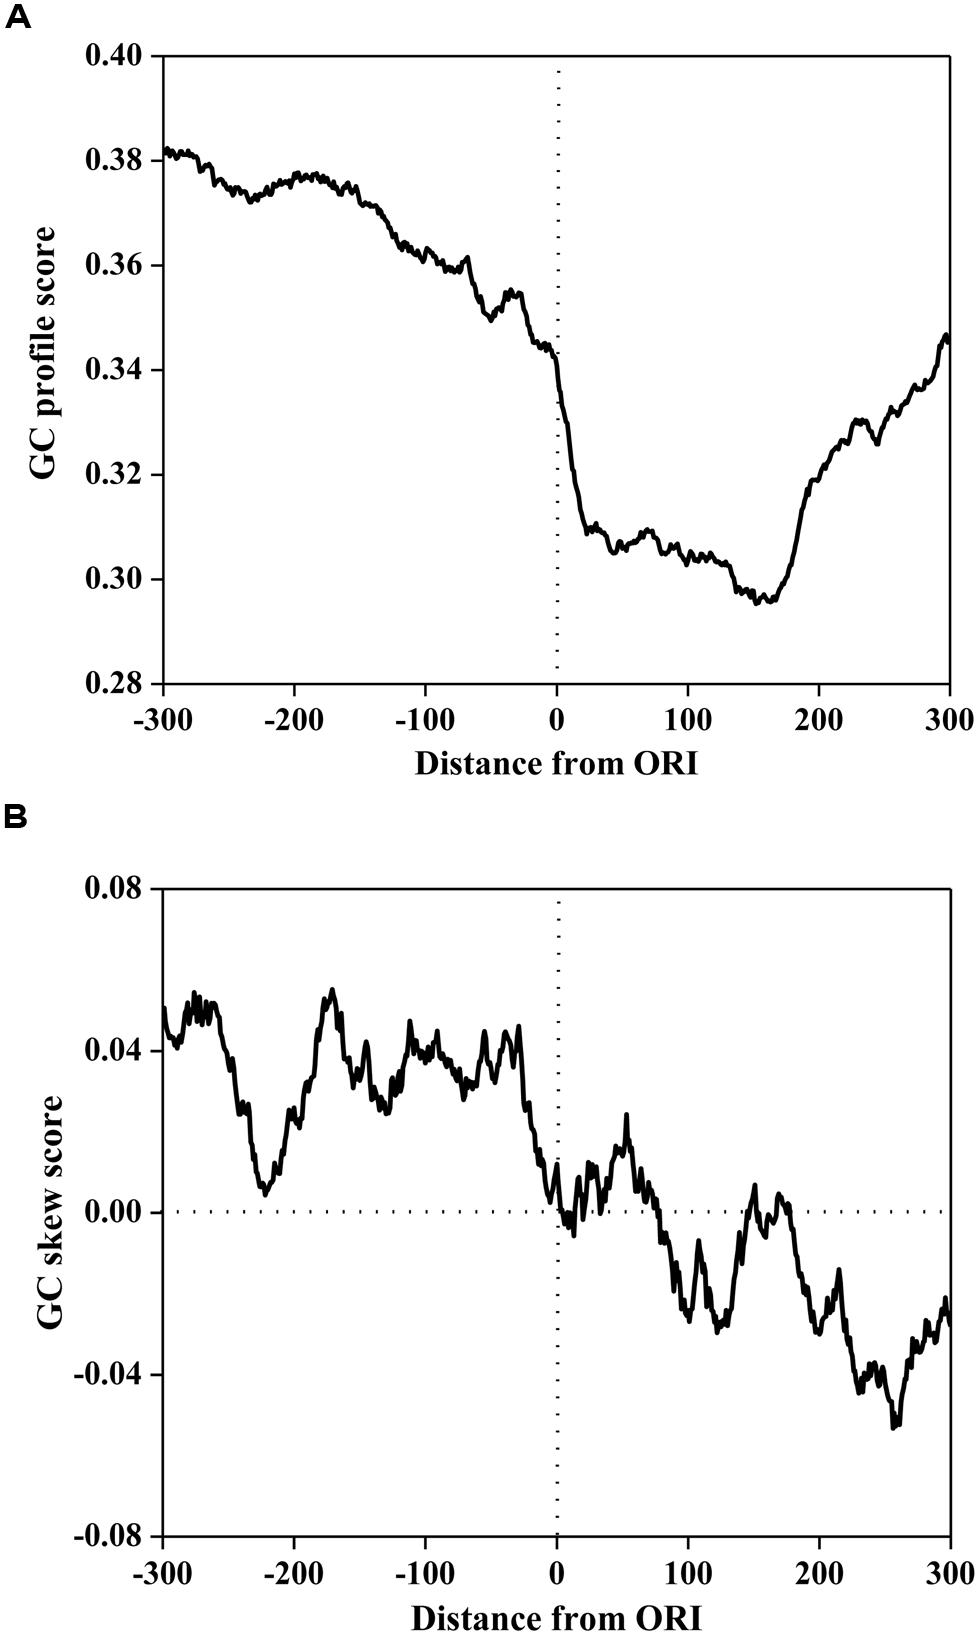
FIGURE 1. The GC profile (A) and the GC skew (B) of origins of replication (in ORIs) and surrounding regions. The profiles are plotted using a 50-bp sliding window with a 1-bp step. The horizontal axis represents the nucleotide position, which ranges from -300 to +300 bp relative to ORIs (denoted as 0). The vertical axis represents the GC content score (A) and GC skew score (B).
To further investigate the sequence mode of ORI sequences, MEME (Multiple Em for Motif Elicitation; Bailey and Elkan, 1994) was used to discover the consensus motifs in ORI sequences. We found that the consensus sequences are all AT-rich motifs. It has been reported that ORIs contain some AT-rich elements for interactions with regulatory proteins (Reeves and Beckerbauer, 2001; Takahashi et al., 2003). Previous research demonstrated that the information encoded in the high AT content can be recognized by the Orc4 subunit of ORC (Mojardin et al., 2013). This can be attributed to the enrichment of the ACS around ORIs in S. cerevisiae, which is an AT-rich motif that contains the binding site for ORC. Recent research also revealed that a conspicuous feature of a replication regulatory protein was the presence of nine AT-hook domains in its amino terminus (Chuang and Kelly, 1999) that were essential for the binding of ORC to ORIs.
However, the GC skew in Figure 1B displays a different trend. The GC skew score in the core ORI regions was statistically lower than that in the upstream regions (P < 2.3 × e-80, Mann-Whitney U-test), but higher than that in the downstream regions (P < 5.0 × e-40, Mann-Whitney U-test). We noticed that the GC skew score conversed from positive to negative at the 0th site corresponding to the DNA replication initiation site. In bacterial genomes, GC skew changes sign at the boundaries of the two replichores, which correspond to the DNA replication origin or terminus (Lobry, 1996a; Necsulea and Lobry, 2007). Thus, our finding implies that the S. cerevisiae genome may have a replication mechanism that is similar to that of bacterial genomes.
Correlation of Nucleotides Surrounding ORIs
Based on Eq. 3, we calculated information redundancies Dk+2 of ORI sequences. The average values are illustrated in Figure 2A. The main maxima for most ORI sequences are located on D2. This result demonstrates that D2 is the maximum among all considered Dk+2 (k= 0, 1, …, 48), indicating that ORI sequences have a short-range dominance of base correlations. Subsequently, we calculated D2 in a 150 bp window with a step of 1 bp for ORI sequences. As shown in Figure 2B, a peak near the ORIs and two valleys flanking the ORIs were observed, suggesting that the ORI sequences have very strong short-range correlations. It has been reported that D2 is correlated with the evolutionary active region (Du et al., 2006). As a special region in the replication process, ORIs have a high probability of deletion, insertion, and mismatch (Umar and Kunkel, 1996). Thus, the evolutionary force reflected by the D2 constraint indicates the diversity of ORI sequences. However, the evolutionary mechanism of fungi ORIs needs further investigation.
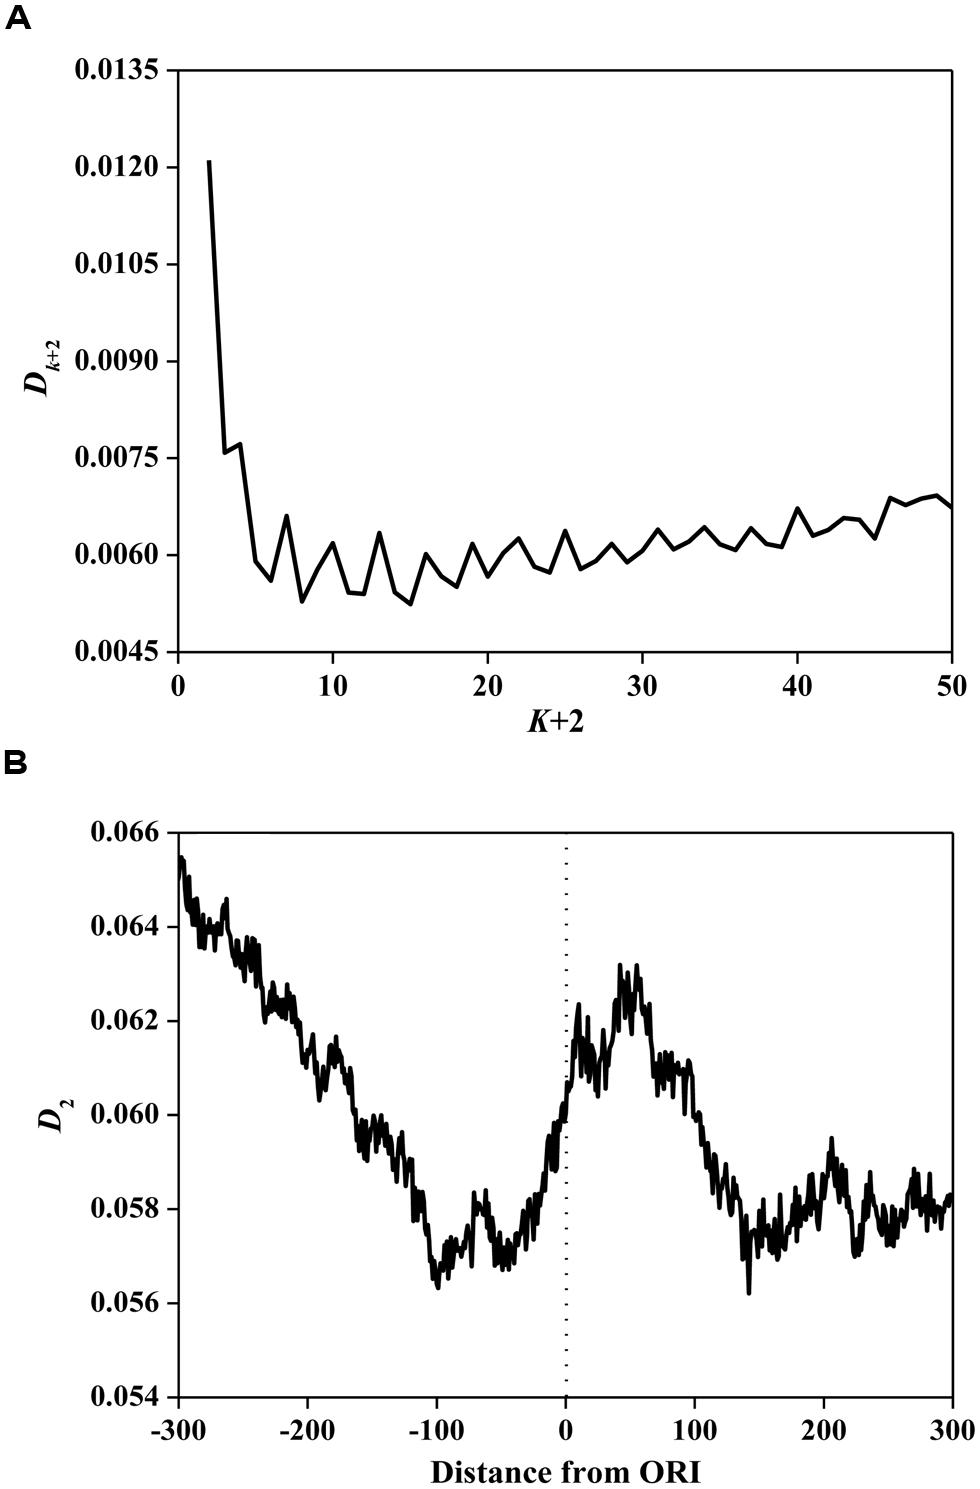
FIGURE 2. (A) Average Dk+2 vs. k+2 for the ORI sequences. The horizontal axis represents the gap of k+2. The vertical axis represents the value of Dk+2. (B) The distribution of D2 surrounding ORIs. The horizontal axis represents the nucleotide position, which ranges from -300 bp to +300 bp relative to ORIs (denoted as 0). The vertical axis represents the value of D2.
Distribution of ORIs in the Genome
It is widely accepted that functional regions are not randomly distributed in the genome (Zhang et al., 2007). Based on this hypothesis, we statistically analyzed the distribution of ORIs in the yeast genome.
First, we investigated the position relationship between ORIs and nucleosomes. Nucleosomes are the elementary units of chromatin organization and are composed of a ∼147 bp stretch of DNA that is tightly wrapped around a histone core (Richmond and Davey, 2003; Segal et al., 2006). Nucleosome positioning affects nearly every cellular process that requires protein access to genomic DNA (Lee et al., 2007; Kaplan et al., 2009). Thus, it is worth studying the nucleosome occupancy around ORIs. To examine the distribution of nucleosomes around ORIs, we selected regions from -1000 to 1000 bp flanking ORIs and then mapped the nucleosomes in these regions. The average nucleosome occupancy scores surrounding ORIs in vitro and in vivo (ethanol, YPD, and galactose) are shown in Figure 3. The nucleosome occupancies around ORIs both in vitro and in vivo display a similar tendency: i.e., the nucleosome occupancy scores in ORIs are significantly lower than those in flanking regions, indicating that ORIs always appear in the nucleosome-free regions. This result can be explained as follows: once wrapped around the histone core, it is difficult for regulatory proteins to access the regions, which makes it difficult to open the DNA double helix (Kass and Wolffe, 1998).
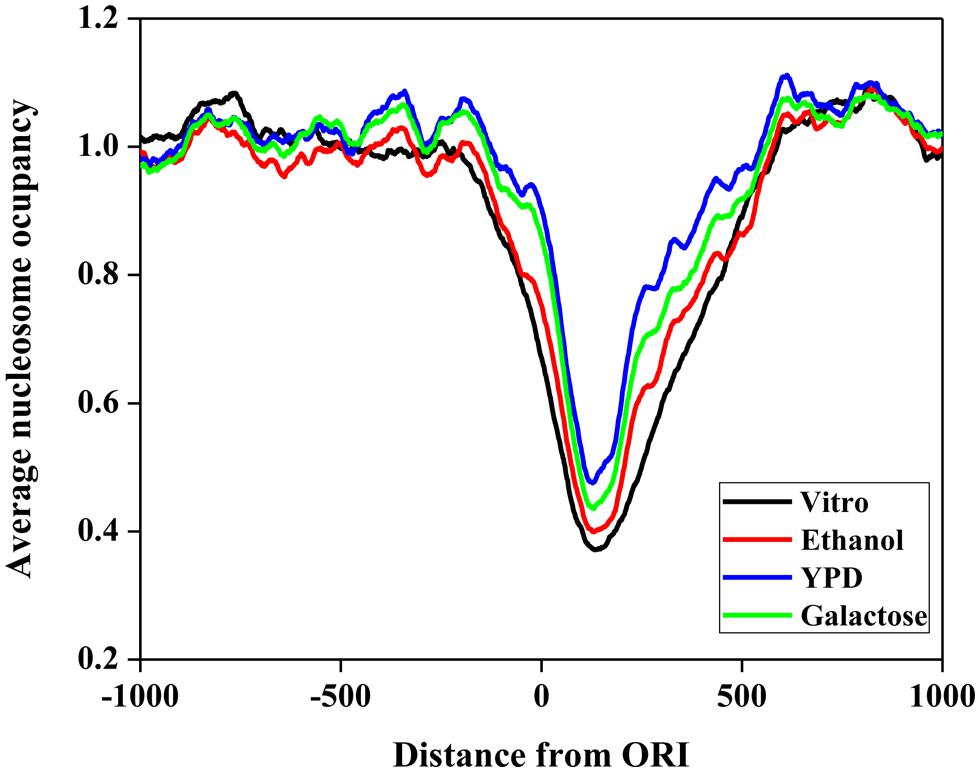
FIGURE 3. Nucleosome occupancy around ORIs. The black curve represents the in vitro data. The red, blue, and green curves represent in vivo experimental maps for three growth conditions (ethanol, yeast extract, peptone, and dextrose medium [YPD] and galactose).
Gene transcription also requires the opening of the DNA double helix. Thus, there are coupling effects between ORIs and promoters. In fact, several studies focused on replication–transcription interactions (Rocha, 2004; Sequeira-Mendes and Gomez, 2012; Helmrich et al., 2013; Lubelsky et al., 2014). Here, the distance between ORIs and TSSs in the yeast genome was calculated. For over 31.46% of cases, the distance between ORI and TSS was less than 500 bp. These promoters are also AT-rich sequences (Lee et al., 2001). Thus, these promoters might share elements with ORIs.
Origins of replications are associated with bias in gene density (Necsulea et al., 2009). To further investigate the relationship between replication and transcription, we analyzed the distribution of ORIs in three kinds of intergenic regions. We obtained 2770 tandem, 1514 divergent, and 1497 convergent intergenic regions based on the orientations of the adjacent gene pair from the GenBank database. The tandem and divergent intergenic regions usually contain promoters; especially, each divergent intergenic region has two promoters for the transcription of two genes, whereas no promoter appears in convergent intergenic regions. By mapping ORIs in these regions, we found that 12.9% of ORIs are located in convergent regions, 25.1% are located in tandem regions, and 12.9% are located in divergent regions. The remaining ORIs (about 46.8%) overlap with coding regions, including 16.3% that are found in the tail of coding regions and 6.6% that are in the head of genes. These results suggest that most ORIs are not biased to transcription start regions, which may guarantee the coordination of replication and transcription.
Prediction of ORIs
The aim of the above statistical analysis was to gain intrinsic observations to understand the replication initiation mechanism and to provide enough information for ORI prediction. Thus, we evaluated the predicted accuracies of the GC profile, GC skew, information redundancy D2, and nucleosome occupancy to discriminate the ORIs from non-ORIs using a support vector machine. Here, 300 bp of each ORI was selected as the positive set, while the 300 bp upstream of ORIs was extracted as the negative set. The 10-fold cross-validated results are recorded in Table 1. It is obvious that the nucleosome occupancy feature can more accurately predict ORIs than GC skew and D2. The comparative accuracy was also obtained with the GC profile. However, these results are still far from satisfactory. The features of GC profile, GC skew, and D2 are based on the nucleotide sequence content, in which little sequence-order effect was considered. In the future, we will consider the sequence-order effect to improve the prediction quality.
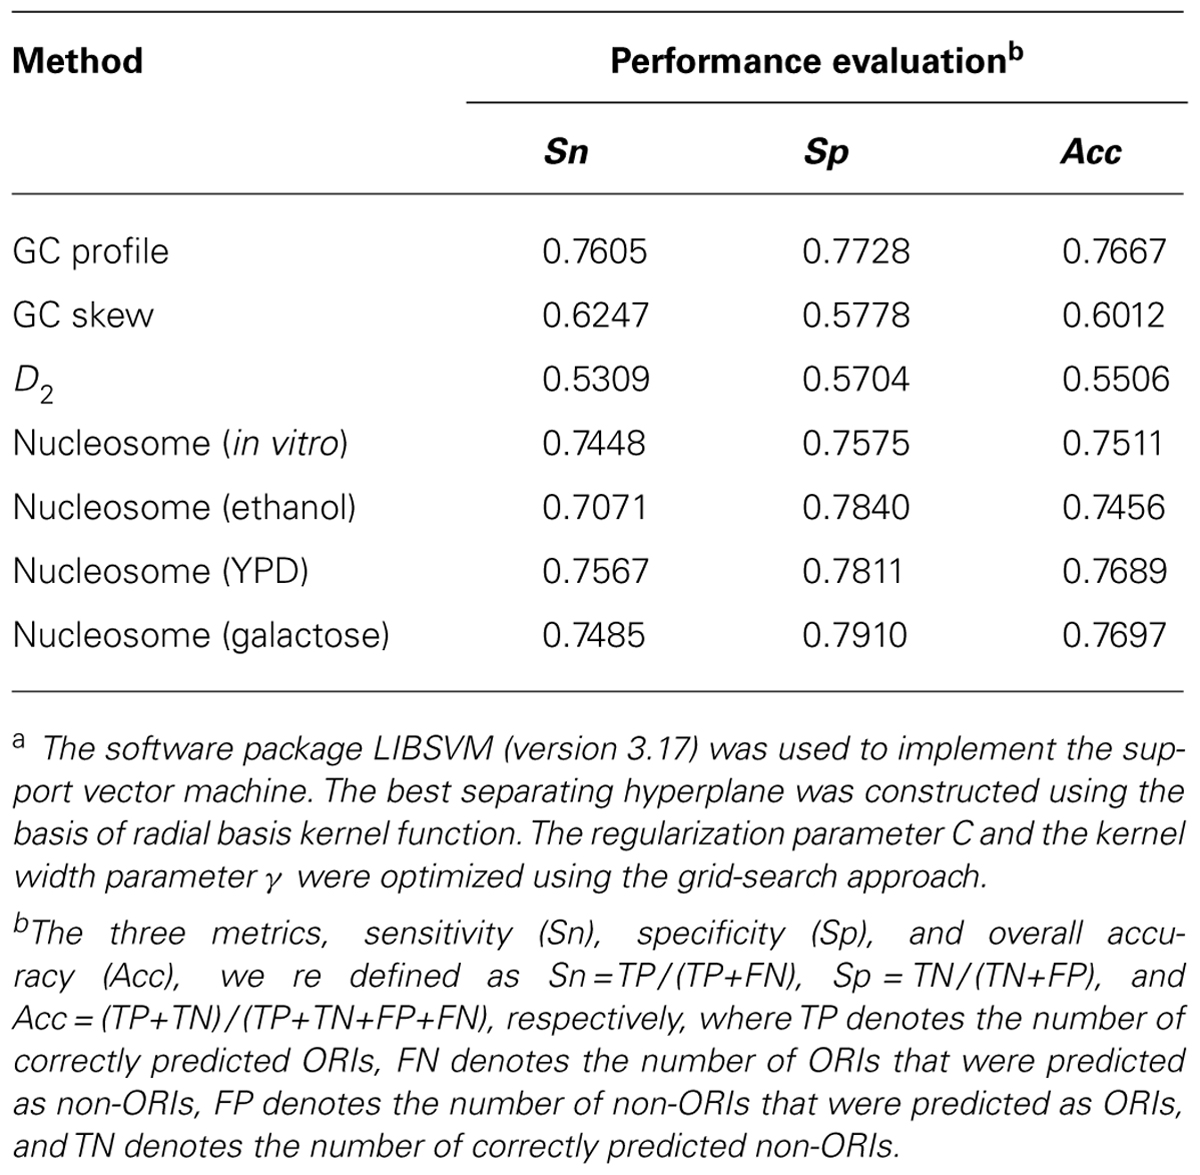
TABLE 1. Predicted results of different parameters using a support vector machinea.
Conclusion
Despite several studies focusing on DNA replication, the mechanism of replication initiation remains elusive. This study focused on the ORIs of S. cerevisiae and systematically analyzed the sequences surrounding ORIs. We found that the sequence around ORIs had a lower GC profile score and a higher nucleotide correlation than the sequence in flanking regions. DNA replication is a highly regulated process that relies on interactions between regulatory proteins and DNA sequences. The AT-rich motif is easily recognized by ORC. By studying the distribution of ORIs in genomes, we found that DNA replication initiation usually occurs in nucleosome-free regions. The short distance between ORIs and TSSs suggested that the expression of genes may be influenced by DNA replication. We expect that the observed properties of ORIs in this work will influence research related to ORIs and provide novel insights into regulatory mechanisms of DNA replication.
Conflict of Interest Statement
The authors declare that the research was conducted in the absence of any commercial or financial relationships that could be construed as a potential conflict of interest.
Acknowledgments
The authors would like to thank the anonymous reviewers for their constructive comments. This work was supported by the National Nature Scientific Foundation of China (No. 61202256, 61301260, and 61100092), the Nature Scientific Foundation of Hebei Province (No. C2013209105), and the Fundamental Research Funds for the Central Universities (No. ZYGX2012J113, ZYGX2013J102).
References
Bailey, T. L., and Elkan, C. (1994). Fitting a mixture model by expectation maximization to discover motifs in biopolymers. Proc. Int. Conf. Intell. Syst. Mol. Biol. 2, 28–36.
Bauer, M., Schuster, S. M., and Sayood, K. (2008). The average mutual information profile as a genomic signature. BMC Bioinformatics 9:48. doi: 10.1186/1471-2105-9-48
Pubmed Abstract | Pubmed Full Text | CrossRef Full Text | Google Scholar
Benson, D. A., Cavanaugh, M., Clark, K., Karsch-Mizrachi, I., Lipman, D. J., Ostell, J.,et al. (2013). GenBank. Nucleic Acids Res. 41, D36–D42. doi: 10.1093/nar/gks1195
Pubmed Abstract | Pubmed Full Text | CrossRef Full Text | Google Scholar
Cayrou, C., Coulombe, P., Puy, A., Rialle, S., Kaplan, N., Segal, E.,et al. (2012). New insights into replication origin characteristics in metazoans. Cell Cycle 11, 658–667. doi: 10.4161/cc.11.4.19097
Pubmed Abstract | Pubmed Full Text | CrossRef Full Text | Google Scholar
Chang, F. J., May, C. D., Hoggard, T., Miller, J., Fox, C. A., and Weinreich, M. (2011). High-resolution analysis of four efficient yeast replication origins reveals new insights into the ORC and putative MCM binding elements. Nucleic Acids Res. 39, 6523–6535. doi: 10.1093/nar/gkr301
Pubmed Abstract | Pubmed Full Text | CrossRef Full Text | Google Scholar
Chen, W., Feng, P., and Lin, H. (2012). Prediction of replication origins by calculating DNA structural properties. FEBS Lett. 586, 934–938. doi: 10.1016/j.febslet.2012.02.034
Pubmed Abstract | Pubmed Full Text | CrossRef Full Text | Google Scholar
Chuang, R. Y., and Kelly, T. J. (1999). The fission yeast homologue of Orc4p binds to replication origin DNA via multiple AT-hooks. Proc. Natl. Acad. Sci. U.S.A. 96, 2656–2661. doi: 10.1073/pnas.96.6.2656
Pubmed Abstract | Pubmed Full Text | CrossRef Full Text | Google Scholar
Crampton, A., Chang, F., Pappas, D. L. Jr., Frisch, R. L., and Weinreich, M. (2008). An ARS element inhibits DNA replication through a SIR2-dependent mechanism. Mol. Cell 30, 156–166. doi: 10.1016/j.molcel.2008.02.019
Pubmed Abstract | Pubmed Full Text | CrossRef Full Text | Google Scholar
Dhar, M. K., Sehgal, S., and Kaul, S. (2012). Structure, replication efficiency and fragility of yeast ARS elements. Res. Microbiol. 163, 243–253. doi: 10.1016/j.resmic.2012.03.003
Pubmed Abstract | Pubmed Full Text | CrossRef Full Text | Google Scholar
Du, D., Xie, T. U., and Li, H. (2006). Evolutional heterogeneity of DNA sequence of the C. elegans along the chromosome. Acta Scientiarum Naturalium Universitatis NeiMongol 37, 516–523.
Gao, F., Luo, H., and Zhang, C. T. (2012). DeOri: a database of eukaryotic DNA replication origins. Bioinformatics 28, 1551–1552. doi: 10.1093/bioinformatics/bts151
Pubmed Abstract | Pubmed Full Text | CrossRef Full Text | Google Scholar
Gao, F., and Zhang, C. T. (2006). GC-Profile: a web-based tool for visualizing and analyzing the variation of GC content in genomic sequences. Nucleic Acids Res. 34, W686–W691. doi: 10.1093/nar/gkl040
Pubmed Abstract | Pubmed Full Text | CrossRef Full Text | Google Scholar
Gao, F., and Zhang, C. T. (2007). DoriC: a database of oriC regions in bacterial genomes. Bioinformatics 23, 1866–1867. doi: 10.1093/bioinformatics/btm255
Pubmed Abstract | Pubmed Full Text | CrossRef Full Text | Google Scholar
Grosse, I., Herzel, H., Buldyrev, S. V., and Stanley, H. E. (2000). Species independence of mutual information in coding and noncoding DNA. Phys. Rev. E Stat. Phys. Plasmas Fluids Relat. Interdiscip. Topics 61, 5624–5629. doi: 10.1103/PhysRevE.61.5624
Pubmed Abstract | Pubmed Full Text | CrossRef Full Text | Google Scholar
Helmrich, A., Ballarino, M., Nudler, E., and Tora, L. (2013). Transcription-replication encounters, consequences and genomic instability. Nat. Struct. Mol. Biol. 20, 412–418. doi: 10.1038/nsmb.2543
Pubmed Abstract | Pubmed Full Text | CrossRef Full Text | Google Scholar
Jacob, F., Brenner, S., and Cuzin, F. (1963). On the regulation of DNA replication in bacteria. Cold Spring Harb. Symp. Quant. Biol. 28, 329–348. doi: 10.1101/sqb.1963.028.01.048
Kaplan, N., Moore, I. K., Fondufe-Mittendorf, Y., Gossett, A. J., Tillo, D., Field, Y.,et al. (2009). The DNA-encoded nucleosome organization of a eukaryotic genome. Nature 458, U362–U129. doi: 10.1038/nature07667
Pubmed Abstract | Pubmed Full Text | CrossRef Full Text | Google Scholar
Kass, S. U., and Wolffe, A. P. (1998). DNA methylation, nucleosomes and the inheritance of chromatin structure and function. Novartis Found. Symp. 214, 22–35.
Lee, M., Yu, S. H., Lee, Y., and Park, J. S. (2001). Characterization of nuclear factors binding to AT-rich element in the rat p53 promoter. J. Cell. Biochem. 80, 580–588. doi: 10.1002/1097-4644(20010315)80:4<580::aid-jcb1012>3.0.co;2-c
Pubmed Abstract | Pubmed Full Text | CrossRef Full Text | Google Scholar
Lee, W., Tillo, D., Bray, N., Morse, R. H., Davis, R. W., Hughes, T. R.,et al. (2007). A high- resolution atlas of nucleosome occupancy in yeast. Nat. Genet. 39, 1235–1244. doi: 10.1038/ng2117
Pubmed Abstract | Pubmed Full Text | CrossRef Full Text | Google Scholar
Levitsky, V. G., Katokhin, A. V., Podkolodnaya, O. A., Furman, D. P., and Kolchanov, N. A. (2005). NPRD: nucleosome positioning region database. Nucleic Acids Res. 33, D67–D70. doi: 10.1093/nar/gki049
Pubmed Abstract | Pubmed Full Text | CrossRef Full Text | Google Scholar
Lobry, J. R. (1996a). Asymmetric substitution patterns in the two DNA strands of bacteria. Mol. Biol. Evol. 13, 660–665. doi: 10.1093/oxfordjournals.molbev.a025626
Pubmed Abstract | Pubmed Full Text | CrossRef Full Text | Google Scholar
Lobry, J. R. (1996b). Origin of replication of Mycoplasma genitalium. Science 272, 745–746. doi: 10.1126/science.272.5262.745
Lubelsky, Y., Prinz, J. A., Denapoli, L., Li, Y. L., Belsky, J. A., and Macalpine, D. M. (2014). DNA replication and transcription programs respond to the same chromatin cues. Genome Res. 24, 1102–1114. doi: 10.1101/gr.160010.113
Pubmed Abstract | Pubmed Full Text | CrossRef Full Text | Google Scholar
Luo, H., Zhang, C. T., and Gao, F. (2014). Ori-Finder 2, an integrated tool to predict replication origins in the archaeal genomes. Front. Microbiol. 5:482. doi: 10.3389/fmicb.2014.00482
Pubmed Abstract | Pubmed Full Text | CrossRef Full Text | Google Scholar
Luo, L., Lee, W., Jia, L., Ji, F., and Tsai, L. (1998). Statistical correlation of nucleotides in a DNA sequence. Phys. Rev. E 58, 861–871. doi: 10.1103/PhysRevE.58.861
McLean, M. J., Wolfe, K. H., and Devine, K. M. (1998). Base composition skews, replication orientation, and gene orientation in 12 prokaryote genomes. J. Mol. Evol. 47, 691–696. doi: 10.1007/PL00006428
Pubmed Abstract | Pubmed Full Text | CrossRef Full Text | Google Scholar
Mojardin, L., Vazquez, E., and Antequera, F. (2013). Specification of DNA replication origins and genomic base composition in fission yeasts. J. Mol. Biol. 425, 4706–4713. doi: 10.1016/j.jmb.2013.09.023
Pubmed Abstract | Pubmed Full Text | CrossRef Full Text | Google Scholar
Necsulea, A., Guillet, C., Cadoret, J. C., Prioleau, M. N., and Duret, L. (2009). The relationship between DNA replication and human genome organization. Mol. Biol. Evol. 26, 729–741. doi: 10.1093/molbev/msn303
Pubmed Abstract | Pubmed Full Text | CrossRef Full Text | Google Scholar
Necsulea, A., and Lobry, J. R. (2007). A new method for assessing the effect of replication on DNA base composition asymmetry. Mol. Biol. Evol. 24, 2169–2179. doi: 10.1093/molbev/msm148
Pubmed Abstract | Pubmed Full Text | CrossRef Full Text | Google Scholar
Nieduszynski, C. A., Knox, Y., and Donaldson, A. D. (2006). Genome-wide identification of replication origins in yeast by comparative genomics. Genes Dev. 20, 1874–1879. doi: 10.1101/gad.385306
Pubmed Abstract | Pubmed Full Text | CrossRef Full Text | Google Scholar
Otu, H. H., and Sayood, K. (2003). A divide-and-conquer approach to fragment assembly. Bioinformatics 19, 22–29. doi: 10.1093/bioinformatics/19.1.22
Reeves, R., and Beckerbauer, L. (2001). HMGI/Y proteins: flexible regulators of transcription and chromatin structure. Biochim. Biophys. Acta 1519, 13–29. doi: 10.1016/s0167-4781(01)00215-9
Pubmed Abstract | Pubmed Full Text | CrossRef Full Text | Google Scholar
Richmond, T. J., and Davey, C. A. (2003). The structure of DNA in the nucleosome core. Nature 423, 145–150. doi: 10.1038/nature01595
Pubmed Abstract | Pubmed Full Text | CrossRef Full Text | Google Scholar
Rocha, E. P. C. (2004). The replication-related organization of bacterial genomes. Microbiology 150, 1609–1627. doi: 10.1099/mic.0.26974-0
Pubmed Abstract | Pubmed Full Text | CrossRef Full Text | Google Scholar
Segal, E., Fondufe-Mittendorf, Y., Chen, L., Thastrom, A., Field, Y., Moore, I. K.,et al. (2006). A genomic code for nucleosome positioning. Nature 442, 772–778. doi: 10.1038/nature04979
Pubmed Abstract | Pubmed Full Text | CrossRef Full Text | Google Scholar
Sequeira-Mendes, J., and Gomez, M. (2012). On the opportunistic nature of transcription and replication initiation in the metazoan genome. Bioessays 34, 119–125. doi: 10.1002/bies.201100126
Pubmed Abstract | Pubmed Full Text | CrossRef Full Text | Google Scholar
Siow, C. C., Nieduszynska, S. R., Muller, C. A., and Nieduszynski, C. A. (2012). OriDB, the DNA replication origin database updated and extended. Nucleic Acids Res. 40, D682–D686. doi: 10.1093/nar/gkr1091
Pubmed Abstract | Pubmed Full Text | CrossRef Full Text | Google Scholar
Takahashi, T., Ohara, E., Nishitani, H., and Masukata, H. (2003). Multiple ORC-binding sites are required for efficient MCM loading and origin firing in fission yeast. EMBO J. 22, 964–974. doi: 10.1093/emboj/cdg079
Pubmed Abstract | Pubmed Full Text | CrossRef Full Text | Google Scholar
Umar, A., and Kunkel, T. A. (1996). DNA-replication fidelity, mismatch repair and genome instability in cancer cells. Eur. J. Biochem. 238, 297–307. doi: 10.1111/j.1432-1033.1996.0297z.x
Wu, L., Liu, Y., and Kong, D. (2014). Mechanism of chromosomal DNA replication initiation and replication fork stabilization in eukaryotes. Sci. China Life Sci. 57, 482–487. doi: 10.1007/s11427-014-4631-4
Pubmed Abstract | Pubmed Full Text | CrossRef Full Text | Google Scholar
Xing, Y. Q., Liu, G. Q., Zhao, X. J., and Cai, L. (2013). An analysis and prediction of nucleosome positioning based on information content. Chromosome Res. 21, 63–74. doi: 10.1007/s10577-013-9338-z
Pubmed Abstract | Pubmed Full Text | CrossRef Full Text | Google Scholar
Xing, Y. Q., Liu, G. Q., Zhao, X. J., Zhao, H. Y., and Cai, L. (2014). Genome-wide characterization and prediction of Arabidopsis thaliana replication origins. Biosystems 124C, 1–6. doi: 10.1016/j.biosystems.2014.07.001
Pubmed Abstract | Pubmed Full Text | CrossRef Full Text | Google Scholar
Yamashita, R., Sathira, N. P., Kanai, A., Tanimoto, K., Arauchi, T., Tanaka, Y.,et al. (2011). Genome-wide characterization of transcriptional start sites in humans by integrative transcriptome analysis. Genome Res. 21, 775–789. doi: 10.1101/gr.110254.110
Pubmed Abstract | Pubmed Full Text | CrossRef Full Text | Google Scholar
Yin, S. Y., Deng, W. J., Hu, L. D., and Kong, X. Y. (2009). The impact of nucleosome positioning on the organization of replication origins in eukaryotes. Biochem. Biophys. Res. Commun. 385, 363–368. doi: 10.1016/j.bbrc.2009.05.072
Pubmed Abstract | Pubmed Full Text | CrossRef Full Text | Google Scholar
Yu, Z. G., and Jiang, P. (2001). Distance, correlation and mutual information among portraits of organisms based on complete genomes. Phys. Lett. A 286, 34–46. doi: 10.1016/S0375-9601(01)00336-X
Yuan, G. C., Liu, Y. J., Dion, M. F., Slack, M. D., Wu, L. F., Altschuler, S. J.,et al. (2005). Genome-scale identification of nucleosome positions in S. cerevisiae. Science 309, 626–630. doi: 10.1126/science.1112178
Pubmed Abstract | Pubmed Full Text | CrossRef Full Text | Google Scholar
Zhang, C. T., Gao, F., and Zhang, R. (2005). Segmentation algorithm for DNA sequences. Phys. Rev. E Stat. Nonlin. Soft Matter Phys. 72, 041917. doi: 10.1103/PhysRevE.72.041917
Zhang, Z. D., Paccanaro, A., Fu, Y., Weissman, S., Weng, Z., Chang, J.,et al. (2007). Statistical analysis of the genomic distribution and correlation of regulatory elements in the ENCODE regions. Genome Res. 17, 787–797. doi: 10.1101/gr.5573107
Pubmed Abstract | Pubmed Full Text | CrossRef Full Text | Google Scholar
Keywords: Saccharomyces cerevisiae, origin of replication, GC profile, GC skew, information redundancy, distribution of ORIs
Citation: Li W-C, Zhong Z-J, Zhu P-P, Deng E-Z, Ding H, Chen W and Lin H (2014) Sequence analysis of origins of replication in the Saccharomyces cerevisiae genomes. Front. Microbiol. 5:574. doi: 10.3389/fmicb.2014.00574
Received: 05 September 2014; Accepted: 11 October 2014;
Published online: 18 November 2014.
Edited by:
Feng Gao, Tianjin University, ChinaReviewed by:
Dong Wang, Harbin Medical University, ChinaLu Cai, Inner Mongolia University of Science and Technology, China
Copyright © 2014 Li, Zhong, Zhu, Deng, Ding, Chen and Lin. This is an open-access article distributed under the terms of the Creative Commons Attribution License (CC BY). The use, distribution or reproduction in other forums is permitted, provided the original author(s) or licensor are credited and that the original publication in this journal is cited, in accordance with accepted academic practice. No use, distribution or reproduction is permitted which does not comply with these terms.
*Correspondence: Hui Ding and Hao Lin, Key Laboratory for Neuro-Information of Ministry of Education, Center of Bioinformatics, School of Life Science and Technology, University of Electronic Science and Technology of China, No. 4 Section 2 North Jianshe Road, Chengdu 610054, Sichuan, China e-mail: hding@uestc.edu.cn; hlin@uestc.edu.cn; Wei Chen, Department of Physics, School of Sciences and Center for Genomics and Computational Biology, Hebei United University, Tangshan 063000, Hebei, China e-mail: greatchen@heuu.edu.cn