 Tasha M. Santiago-Rodriguez
 Mayuri Naidu
 Marcus B. Jones
 Melissa Ly
 David T. Pride
- 1Department of Pathology, University of California, San Diego, CA, USA
- 2J. Craig Venter Institute, Rockville, MD, USA
- 3Department of Medicine, University of California, San Diego, CA, USA
Many pathogenic bacteria have bacteriophage and other mobile genetic elements whose activity during human infections has not been evaluated. We investigated the gene expression patterns in human subjects with invasive Methicillin Resistant Staphylococcus aureus (MRSA) infections to determine the gene expression of bacteriophage and other mobile genetic elements. We developed an ex vivo technique that involved direct inoculation of blood from subjects with invasive bloodstream infections into culture media to reduce any potential laboratory adaptation. We compared ex vivo to in vitro profiles from 10 human subjects to determine MRSA gene expression in blood. Using RNA sequencing, we found that there were distinct and significant differences between ex vivo and in vitro MRSA gene expression profiles. Among the major differences between ex vivo and in vitro gene expression were virulence/disease/defense and mobile elements. While transposons were expressed at higher levels ex vivo, lysogenic bacteriophage had significantly higher in vitro expression. Five subjects had MRSA with bacteriophage that were inhibited by the presence of blood in the media, supporting that the lysogeny state was preferred in human blood. Some of the phage produced also had reduced infectivity, further supporting that phage were inhibited by blood. By comparing the gene expression cultured in media with and without the blood of patients, we gain insights into the specific adaptations made by MRSA and its bacteriophage to life in the human bloodstream.
Introduction
Staphylococcus aureus is a pathogen that is also considered normal human flora, and often takes advantage of breaks in protective skin barriers to cause disease (Chaffin et al., 2012). While S. aureus strains were primarily treatable with beta-lactam antibiotics in the past, their widespread use has resulted in the emergence of Methicillin-Resistant S. aureus (MRSA) strains. MRSA can be acquired in hospital- or community-based settings, but many of the Community-Acquired MRSA (CA-MRSA) strains have replaced more traditional Hospital-Acquired (HA-MRSA) strains in both environments (Shopsin et al., 2003; Popovich et al., 2008; Kennedy et al., 2010). CA-MRSA generally has been responsible for many invasive soft tissue infections, and has several virulence factors including Panton-Valentine leukocidin (PVL), which are thought to contribute greatly to its pathogenesis. PVL, which is not regularly detected in Hospital Acquired (HA)-MRSA strains, have been associated with epidemics of several CA-MRSA strains in the United States (Pan et al., 2003; Vandenesch et al., 2003). Virulence factors are of particular interest in invasive bloodstream infections, and many are derived from mobile genetic elements, including plasmids, bacteriophage, transposons, and pathogenicity islands (Bae et al., 2006; Baba et al., 2008; Diep et al., 2008b).
There usually are bacteriophage integrated into the genomes of S. aureus isolates, with most of them belong to the phage family Siphoviridae (Canchaya et al., 2003; Feng et al., 2008). These phage are of intermediate size (generally around 40 to 45 kb) and often carry toxins that may contribute to pathogenesis (Brussow et al., 2004). Some phage carry the immune modulator staphylokinase, which is responsible for host tissue destruction. Others encode toxins such as PVL, or superantigens involved in toxic shock syndrome, necrotizing fasciitis, and food poisoning (Deghorain and Van Melderen, 2012). These phage likely impact staphylococcal pathogenesis through lysogenic conversions, where the virulence functions they carry are expressed during infection in humans. The expression of these phage may directly reflect their contributions to pathogenesis, but has not been thoroughly examined during human bloodstream infections.
The expression of genes involved in the pathogenicity of CA-MRSA has been mainly studied in vitro (Cui et al., 2005; Lindsay et al., 2006; Stevens et al., 2007; Pohl et al., 2009). Few studies have compared the in vivo and in vitro gene expression of MRSA, and generally have been restricted to animal models (Diep et al., 2008a,b; Chaffin et al., 2012), which may not fully reflect the adaptive behavior of the pathogen in humans. Other ex vivo strategies have grown a single, lab-adapted MRSA strain in the presence of healthy human donor blood to characterize virulence genes that may be overexpressed (Malachowa and Deleo, 2011; Malachowa et al., 2011). No studies, however, have studied MRSA across human subjects with varying degrees of illnesses to understand whether the behavior of MRSA and their mobile genetic elements is reproducible across different human subjects. It is of substantial importance to understand the contributions of phage and other mobile genetic elements to MRSA pathogenesis during human infections and their potential for spread to others.
The primary tool for analysis of global patterns of gene expression in microbes is transcriptomics. While some have studied transcriptomics in MRSA utilizing quantitative PCR (Sabersheikh and Saunders, 2004), or microarray analysis (Witney et al., 2005; Lindsay et al., 2006), RNA sequencing provides a tool for characterization of patterns of gene expression that does not require a priori information about the pathogen being studied (Wilhelm and Landry, 2009). Thus, gene expression patterns from RNA sequencing can be used to thoroughly characterize novel MRSA strains. RNA sequencing technology has not been employed to characterize global changes in S. aureus gene expression in humans with invasive bloodstream infections. Here, we report the RNA sequencing expression profiles of MRSA strains grown in the presence of blood from 10 human subjects with invasive bloodstream infections and characterize differences observed in the expression of bacteriophage and other mobile genetic elements by comparing expression profiles with and without human blood.
Results
Human Subjects and RNA Enrichment
We sampled blood from 10 human subjects with invasive bloodstream MRSA infections (Table 1 and Supplemental Table 1), and cultured each to further our understanding of the gene expression of MRSA in the human bloodstream. We utilized an ex vivo technique that involved direct inoculation at the bedside of blood from human subjects with invasive bloodstream infections into culture media that bypassed the need for a separate in vitro culture step; thus, the isolates from each subject were characterized directly from blood with minimal opportunity for gene expression changes that might accompany laboratory adaptation. The cohort of subjects in this study included many that were critically-ill (Table 1), which significantly contrasts with a prior study characterizing a single lab-adapted MRSA strain cultured in the presence of blood from healthy donors (Malachowa et al., 2011). For comparison, we performed a separate isolation of each MRSA strain, and cultured each in vitro to help decipher comparatively those genes whose expression might be induced through exposure to the human bloodstream. Samples 21MRA and 23MRA were isolated from the same individual 48 h apart, and were utilized to help determine whether results would be consistent within individual subjects over time. All ex vivo and in vitro MRSA isolates were grown to log phase (Supplemental Figure 1), and total RNA was isolated from each subject/MRSA isolate under both growth conditions. Because the ex vivo samples were cultured in the presence of blood from each human subject, we enriched to remove any RNA that may have been derived from the human host. The resulting RNA was sequenced from all 10 subjects for a total of 6,213,492 ex vivo reads (mean of 564,863 ± 79,540 per subject) and 4,568,420 in vitro reads (mean of 415,310 ± 10,582 per subject) (Table 2). The inclusion of the enrichment step substantially reduced the presence of human RNA, as exemplified by the relatively low percentage of RNA identified that was homologous to human DNA (mean 1.22 ± 0.55%; range from 0.17% to 6.26%). All sequence reads homologous to human DNA were removed prior to further analysis.
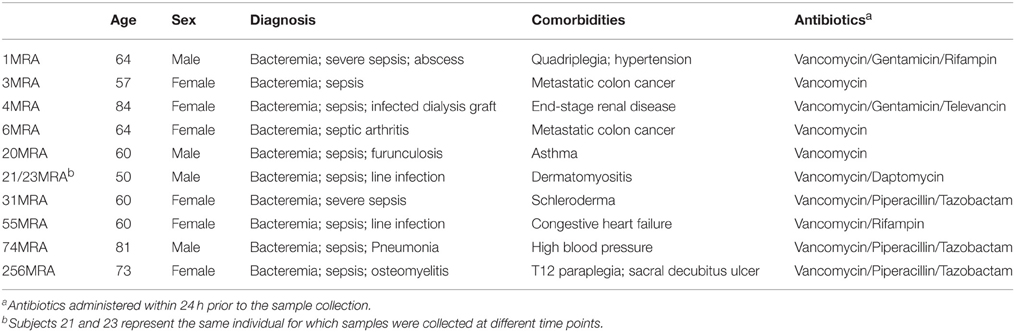
Table 1. Study subjects.
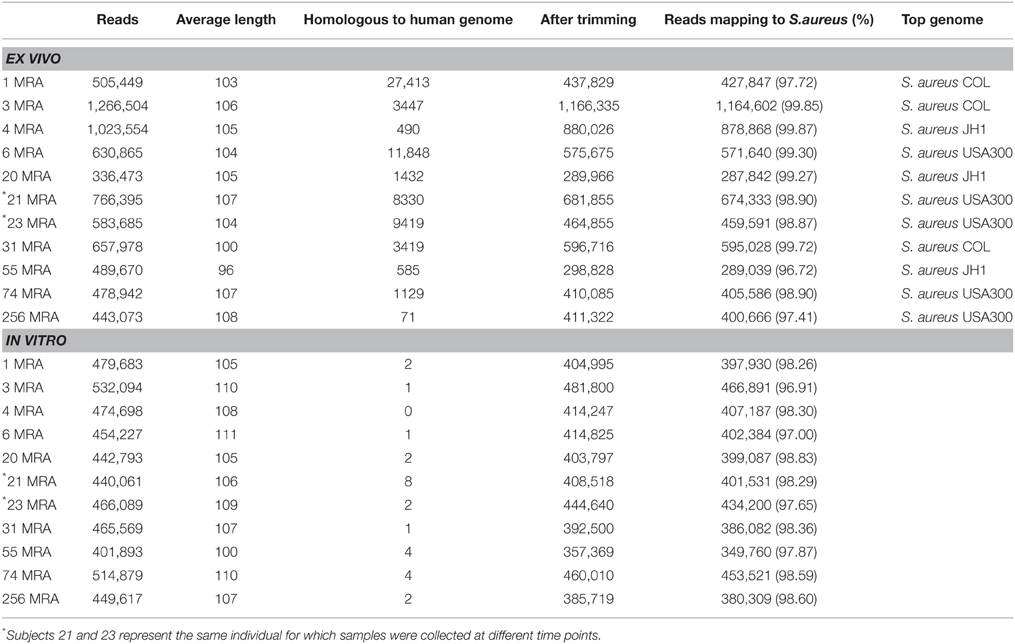
Table 2. RNA sequences from all subjects.
Identification of Staphylococcal Sequence Reads
We mapped the sequence reads from each subject to a database of known staphylococcal genomes (available at ftp://ftp.ncbi.nlm.nih.gov/genomes/Bacteria/) to determine whether we could identify gene sequences from the Staphylococcus genome that were expressed upon exposure to human blood. We found that the vast majority of the ex vivo sequenced reads mapped to known staphylococcal genomes (mean 98.78 ± 0.32%), with a similar proportion of the in vitro sequenced reads (98.06 ± 0.19%) also mapping to known staphylococcal genomes. That a similar percentage of ex vivo and in vitro sequenced reads mapped to staphylococcal genomes, indicates the enrichment process was highly specific for bacterial RNA. Four of the 10 subjects likely harbored MRSA USA300 type strains based on their high percentage of mapping reads, while the other six subjects harbored strains that mapped to more traditional HA-MRSA strain types. Both samples 21MRA and 23MRA mapped to USA300 strains, indicating that this strain type was identical over the 48 h between samplings in that individual subject.
Ex Vivo vs. In Vitro MRSA Gene Expression Profiles
We examined the overall gene expression from each subject both ex vivo and in vitro to determine whether there were global differences in gene expression that might signal adaptations to human blood. We found that there was a significant difference in the proportion of MRSA genes expressed, with far fewer genes expressed ex vivo (47.88 ± 5.39% ex vivo vs. 60.82 ± 1.07% in vitro; p = 0.028) (Figure 1A). As demonstrated by heatmap, many subjects had relatively limited global gene expression profiles ex vivo when compared to their in vitro counterparts (Figure 1B). Samples 21MRA and 23MRA from the same subject demonstrated similar but not identical patterns of gene expression. Overall, MRSA strains had patterns of gene expression that were reflective of either their ex vivo or in vitro environment (Figure 1B), suggesting that the limited patterns of gene expression ex vivo directly reflected adaptations to human blood. These data also were supported by principal coordinates analysis, which showed that much less heterogeneity amongst the in vitro-derived specimens than was observed for the ex vivo specimens (Figure 2).
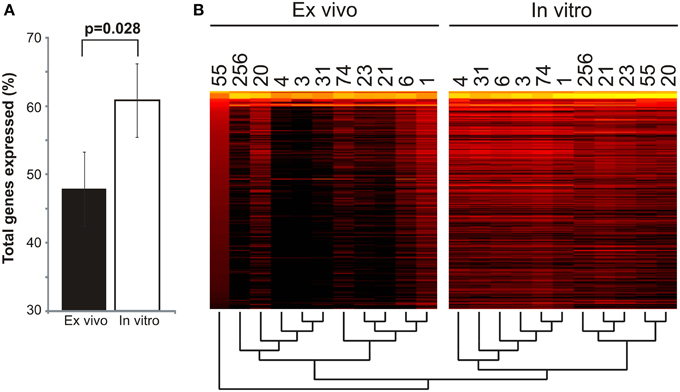
Figure 1. Global gene expression of Staphylococcus aureus cultured in blood from human subjects (ex vivo) and in vitro. (A)—mean percentage (± standard error) of total genes expressed ex vivo and in vitro. (B) —heatmap of gene expression profiles ex vivo and in vitro for all subjects. Each column represents an individual subject, and each row represent each individual S. aureus gene. The most highly expressed genes are shown in yellow, while genes that are not expressed (RPKM value of 0) are shown in black. A dendrogram representing the hierarchical clustering of each subject is shown below the heatmap.
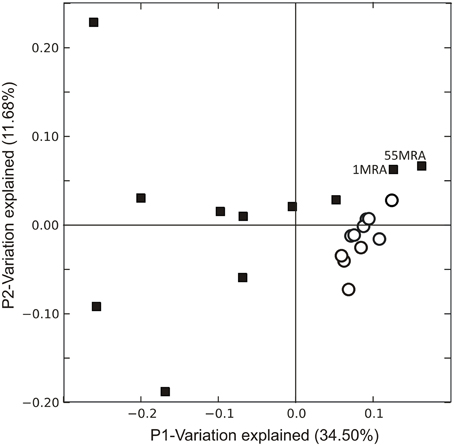
Figure 2. Principal coordinates analysis of Staphylococcus aureus transcriptomes ex vivo (black squares) and in vitro (white circles). Beta diversity was determined using binary Sorensen distances based on RPKM values, and was used as input for the principal coordinates analysis.
Subsystem Specific Gene Expression in MRSA
We compared MRSA subsystem gene expression profiles to determine whether there were specific differences attributable to culture in media with human blood. There were significant differences (p = 0.05) in ex vivo and in vitro gene expression in numerous subsystems, including virulence/disease/defense, and mobile genetic elements among other subsystems identified (Supplemental Figure 2). In 9 of the 10 subjects studied, there was higher ex vivo expression of mobile elements than in vitro (Supplemental Figure 3), and significantly greater expression of prophage genes in vitro than ex vivo (Figure 3). Expression of beta lactamases involved in resistance to beta lactam antibiotics also was significantly increased on transposons (Tn552; p = 0.007) and on plasmids (p = 0.003). We found no significant differences in expression of the mecA penicillin binding protein gene, which also encodes resistance to beta lactam antibiotics.
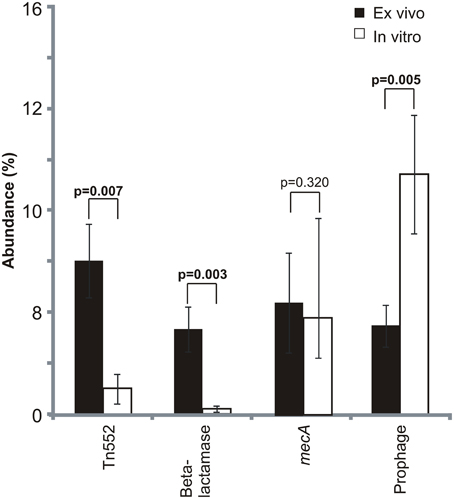
Figure 3. Mean percentage (± standard deviation) of mobile element gene expression devoted to specific elements. Mobile genetic element relative abundances were determined based on the proportion of each selected mobile element to the total mobile genetic element RPKM values. Mobile genetic elements were determined based on homologies to gene categories in the SEED database. p-values are shown above each mobile element. Ex vivo gene expression is represented by black bars and in vitro is represented by white bars.
We also examined the expression of virulence subsystems in MRSA ex vivo and in vitro to determine the impact of culture in media with human blood on MRSA virulence gene expression. We found that in seven of the 10 subjects studied, virulence gene expression was higher in vitro than ex vivo (Supplemental Figure 4), which suggests that human blood may have inhibitory effects on the expression of certain virulence genes. Despite the generally lower expression of virulence genes, some were more highly expressed ex vivo, including Staphylococcus aureus pathogenicity islands (SAPIs) and cytolysins (Supplemental Figure 5A). SAPIs are highly diverse phage-related chromosomal islands that insert into the genome at distinct sites (Novick and Subedi, 2007), while cytolysins generally are involved in the lysis of neutrophils (Queck et al., 2009). Only five of the MRSA isolates encoded PVL (lukS/F-PV), which was more highly expressed ex vivo. although the difference was not statistically significant (p = 0.120) (Supplemental Figure 5B).
Because of the high expression of beta lactamases despite the absence of beta lactam therapy in most subjects, we focused on the potential response of MRSA to other antibiotics. Each subject had been treated with vancomycin (a glycopeptide antibiotic that disrupts the cell wall of MRSA through the prevention of cross-linking at terminal d-alanine moieties). We found no significant difference in the expression of ddl, which encodes d-alanine moieties (Supplemental Figure 5B). tcaA also is involved in the response to glycopeptide antibiotics (Srinivasan et al., 2002), and was more highly expressed in all study subjects ex vivo, although the difference was not statistically significant (p = 0.101).
Prophage Expression Inhibited by Culture in Media with Blood
Because of the significantly higher expression of mobile genetic elements ex vivo (Supplemental Figure 3), and the greater expression of prophage genes in vitro (Figure 3), we investigated whether there may be specific differences identified in bacteriophage gene expression in vitro and ex vivo. There were significant differences in the expression of phage repressors, which were significantly more highly expressed ex vivo (p = 0.039) (Figure 4). Similarly, we also found high expression of phage anti-repressors in vitro, although those differences were not statistically significant (p = 0.238). The higher expression of repressors and antirepressors ex vivo and in vitro, respectively, suggests that there were specific interactions with human blood that resulted in inhibition of prophage progression to lytic gene expression.
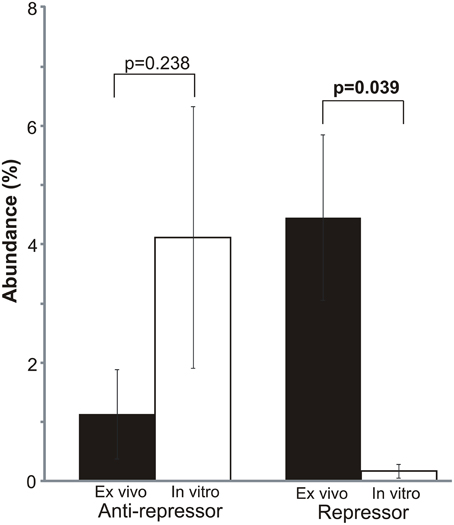
Figure 4. Mean percentage (± standard deviation) of mobile element gene expression devoted to bacteriophage repressors and anti-repressors. Repressor/antirepressor relative abundances were determined based on the proportion of each repressor/antirepressor to the total mobile genetic element RPKM values. Mobile genetic elements were determined based on homologies to gene categories in the SEED database. p-values are shown above each element. Ex vivo gene expression is represented by black bars and in vitro is represented by white bars.
To test whether culture in media with human blood was inhibitory to prophage expression, we stimulated prophage using mitomycin C in each of the 11 isolated MRSA strains. We found that 6 of the 11 strains produced viable phage in Brain Heart Infusion broth (BHI) in the presence of mitomycin C (including strains 3MRA, 20MRA, 21MRA, 23MRA, 74MRA, and 256MRA); however, the production of phage was inhibited in all six strains by the presence of human blood in culture media (Figure 5A). Interestingly, there was spontaneous induction of phage in strains 3MRA and 20MRA, but the number of phage were two to three logs lower than were produced in the presence of mitomycin C. We also tested whether the reduction in phage identified in the presence of blood may be related to inhibition of phage infectivity rather than a decrease in phage production. We found that for both 3MRA and 23MRA there was a decrease in observed PFUs by 1.5 to 2 logs, indicating that infectivity was diminished in the presence of blood (Figure 5B). Because phage adsorption has previously been shown to be inhibited by immunoglobulins (Martin and White, 1968; Nordstrom et al., 1974), it is likely that diminished adsorption was responsible for the decrease in infectivity. The fact that infectivity was only partially inhibited (Figure 5B) suggests the lack of PFUs produced in culture with blood (Figure 5A) cannot be completely explained by inhibition of adsorption. These data are highly suggestive that expression and adsorption of these phage are inhibited by life in the human bloodstream.
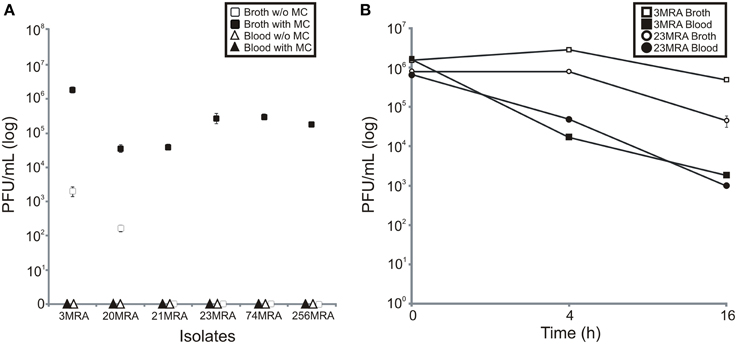
Figure 5. Production of phage from MRSA strains in the presence of human blood, or BHI broth with and without mitomycin C (A), and inhibition of infectivity of phage produced in human blood or BHI broth (B). Mean plaque forming units (log) (± standard deviation) from three separate experiments is demonstrated. In (A), BHI broth with and without mitomycin C are represented by black and white squares, respectively, and blood with and without mitomycin C are represented by black and white triangles, respectively. In (B), phage 3MRA in the presence of BHI broth and blood is represented by white and black squares, respectively, and phage 23MRA in the presence of BHI broth and blood is represented by white and black circles, respectively. Standard deviation bars are demonstrated on each panel.
Identification of Inhibited Prophage
We sequenced the phage from subjects 3MRA and 23MRA to determine which specific phage were inhibited in culture media with blood. We isolated phage 3MRA and 23MRA starting from single plaques, then purified and sequenced the DNA directly from the virions. We produced a total of 241,857 reads for phage 3MRA, of which 234,536 (97%) assembled into a single 42,141bp contig with 1177X average coverage (Figure 6A). We also sequenced 216,080 reads for phage 23MRA, of which 197,211 (91%) assembled into a single 43,114bp contig with 961X average coverage (Figure 6B). Based on BLASTN analysis, there were no nearly identical matches for phage 3MRA, but it was similar and shared synteny with S. aureus siphoviruses phiETA and phiETA3 (Figure 7A). Phage 23MRA was virtually identical to a prophage found in the genome of S. aureus USA300 TCH1516, which also is closely related to S. aureus siphoviruses phage 77, and phiETA2 (Figure 7B). Genome alignments shows that phage 23MRA has much greater similarity to Phage 77 than to phiETA2. Each phage sequenced had homologs to structural genes (head, tail, and portal), replication machinery (polymerases), integration genes (integrases), lysis and packaging machinery (lysins and terminases), genes that control transcription (repressors/anti-repressors), and virulence genes (toxin-antitoxin, complement inhibitor, chemotaxis inhibitor, and staphylokinase). All ORFs identified in phage 3MRA and 23MRA phage had homologs to staphylococcal phage genes or genes previously identified in staphylococcal genomes. These data specifically identify prophage whose expression is inhibited by culture in media with blood, and the profound similarity between these phage and many previously identified staphylococcal prophage suggests that they may also be inhibited by human blood.
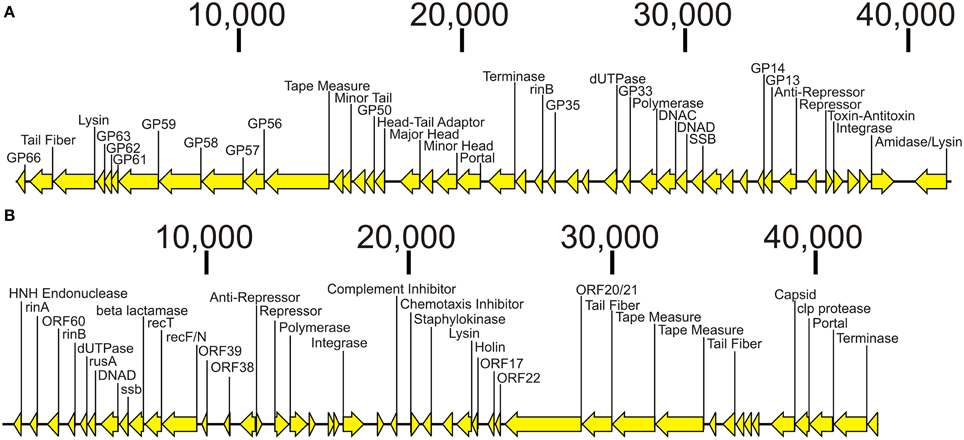
Figure 6. Diagram of bacteriophage genomes sequenced from the virions from Subjects 3MRA (A) and 23MRA (B). Putative ORFs and their direction are indicated by the arrows. ORFs that had significant homologs (BLASTP E-score <10−5) are indicated by the text above each arrow. In (A), those ORFs that had synteny with Staphylococcus phage PhiETA2 are labeled GP66, GP63, GP62, GP61, GP59, GP58, GP57, GP56, GP50, GP35, GP33, GP14, and GP13. In (B), those ORFs that had synteny with Staphylococcus phage PhiPVL are labeled ORF60, ORF39, ORF38, ORF22, ORF21, ORF22, and ORF17. Putative functions for each ORF are labeled when available. The length of each contig is denoted at the top of each panel.
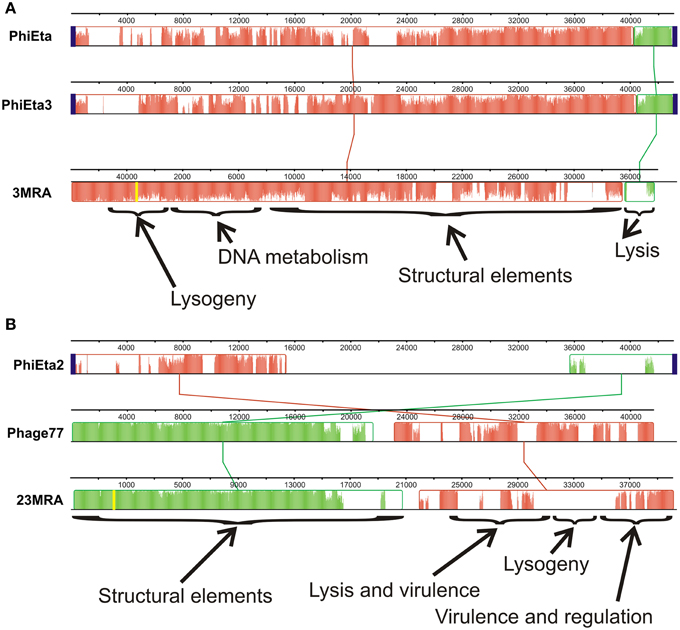
Figure 7. Alignments of phage 3MRA (A) and phage 23MRA (B) with various other known staphylococcal phage. The boxes represent segments of each phage that are relatively well conserved amongst the aligned phage and the lines between the boxes represent the relative position of conserved segments of each phage in the different genomes. Diagonal lines represent potential genome rearrangements. Relative locations in the genomes of each phage are demonstrated by the nucleotide numbers above each phage. The yellow lines represent the sites of the first nucleotide in the assembled 3MRA and 23MRA phage contigs. Some phage segments shown by the arrows contain conserved genes representing structural elements, DNA metabolism, lysis, lysogeny, virulence, and regulation. The height of the colors across each box represents the average conservation in that phage segment across the phage examined. attP sites, which represent the sites on phage genomes where they integrate into their host genomes, are represented by blue boxes. attP sequences were not determined for phage 3MRA and 23MRA.
Discussion
Staphylococcus aureus is highly prevalent and responsible for substantial morbidity and mortality. Its epidemiology has shifted, resulting in methicillin-resistant strains having similar prevalence to methicillin-sensitive strains in clinical settings. Because studies generally identify single MRSA genotypes from sterile site infections (Young et al., 2004), most MRSA infections are believed to be caused by single rather than multiple different genotypes. There was no evidence based on the MRSA culture data and susceptibility patterns of mixed infections in the 10 subjects studied. While much is known about its pathogenicity, the in vivo gene expression of MRSA and its lysogenic phage have yet to be thoroughly examined in humans. Our technique for characterizing MRSA ex vivo gene expression was unique in that it involved examining the gene expression of MRSA cultured directly from the blood of different human subjects with bloodstream infections without any separate in vitro culture steps, followed by comparisons with in vitro growth to identify differences that might be attributable to life in the human bloodstream. While not technically an in vivo technique because of the separate culture step, we identified numerous differences between ex vivo and in vitro MRSA gene expression profiles, with the lysogenic phage providing the most notable differences. Although the group of subjects we studied was relatively heterogeneous in their underlying comorbidities, each had invasive MRSA bloodstream infections. The heterogeneity in their comorbidities and individualized medical therapies may be responsible for the variability observed in gene expression from each subject (Figure 1). Because it took approximately 72 h to identify those subjects who had MRSA bloodstream infections, most of the subjects enrolled in this study had either cleared their bacteremia or were deceased by the time a diagnosis was made. This severely limited our ability to obtain further specimens to test biological replicates. Because some of the subjects were critically ill and treated with complex antibiotic combinations (Table 1), the features of their immune responses and antibiotic regimens would be difficult to replicate in vitro, which further adds to the uniqueness of this cohort and the responses of the MRSA isolates studied. The differences in MRSA gene expression profiles observed cannot be solely attributed to antibiotics, as there were different gene expression profiles observed in subjects treated with the same antibiotic regimens.
We were highly interested in the expression of mobile genetic elements (including phage, plasmids, and transposons) associated with bacterial infections in the human bloodstream, as they may be the primary means by which new gene functions are transmitted in nature. Beta lactamases expressed on mobile elements ex vivo were significantly overexpressed compared to in vitro (Figure 3), suggesting that their expression may be part of the organism's stress response to human blood. Because most of the subjects studied were not treated with beta lactam antibiotics, the regulation of these beta lactamases likely is independent of beta lactam therapy. While beta lactamases were more highly expressed ex vivo, mecA expression was stable under each growth condition. Because the MecA penicillin binding protein is involved in the normal processing of the MRSA cell wall, its expression might not be expected to be substantially altered when cultured in media with human blood.
While there has been some prior analysis of the effect of human blood on prophage (Gaidelyte et al., 2007), our ex vivo data strongly suggest that repression of certain prophage is characteristic of MRSA invasive bloodstream infections. This was supported by the higher ex vivo expression of repressor genes (Figure 4), which are essential for the inhibition of the phage lytic genes. An inverse effect was noted in vitro, where the higher expression of anti-repressor genes was indicative of the expression of the phage lytic module. We were unable to place the MRSA genomes into lineage groups (Lindsay et al., 2006; McCarthy and Lindsay, 2010) based on the presence/absence of mobile genetic elements because the heterogeneity in gene expression and the potential for prior horizontal gene transfers (McCarthy et al., 2012a,b) could have led to erroneous results. There also was altered expression of site-specific recombinases in this cohort, but their potential dual roles in integration and excision complicates their interpretation (Hanssen and Ericson Sollid, 2006; Malachowa and Deleo, 2010).
In addition to altered phage expression in response to blood in culture media, we found that infectivity of the phage also was diminished, likely through inhibition of adsorption (Figure 5) (Martin and White, 1968; Nordstrom et al., 1974). These results suggest that the transport and adsorption of phage particles, as well as the transmission of phage-encoded genes, may be restricted during MRSA bloodstream infections in humans. We also identified certain phage that were specifically inhibited by culture in media with human blood (Figure 6), and their strong similarities to prophage found in other MRSA isolates (Figure 7) suggests that they also may be inhibited by blood. Not all MRSA isolates had produced phage particles that we could detect using acceptor strain RN10950. We also utilized strain RN4220 (a restriction deficient S. aureus strain cured of three prophage) (Novick, 1967), but were unable to detect phage from the other MRSA isolates. Our study differs significantly from a prior study documenting the effects of human blood on staphylococcal phage. In that study, the authors concentrated specifically on phage that were expressed during culture in media with human blood (Gaidelyte et al., 2007), whereas our study identifies those phage that were inhibited by culture with human blood. Also, in contrast to that study, our data on these specific MRSA phage shows that infectivity was diminished in the presence of blood (Figure 5).
The production of viable phage from prophage in the MRSA genomes in this study directly supported the RNA sequencing data. We observed a substantial over-expression of phage repressors ex vivo (Figure 4), which correlated directly with the inhibition of phage production in human blood (Figure 5). Although most MRSA isolates in our study carried integrases, which often indicate the presence of prophage, not all strains produced viable prophage that we could detect with our acceptor strains. This suggests that some of our MRSA strains carried prophage remnants and/or cryptic prophage rather than viable prophage (Canchaya et al., 2003; Casjens, 2003). With the exception of isolate 6MRA, most CA-MRSA strains produced viable phage, compared to only one HA-MRSA strain (3MRA). The phage we identified (Figure 6) had virulence genes such as staphylokinase (involved in tissue destruction), toxin/antitoxin systems (may be involved in defense, drug tolerance, programmed cell death, and growth control) (Nolle et al., 2013), and genes for an immune escape complex (involved in immune evasion) (Goerke et al., 2006), which suggests that these phage may play several different roles in MRSA pathogenesis.
Conclusions
While some studies have profiled S. aureus in vitro behavior (Renzoni et al., 2006; Sass et al., 2008) and gene expression profiles in mouse models (Allard et al., 2006; Chaffin et al., 2012), the gene expression of their bacteriophage and other mobile genetic elements have not been examined in vivo. While our ex vivo model includes a separate culture step, the blood culturing step was absolutely necessary to first identify those human subjects that had invasive bloodstream infections. The benefit of the model was that we could isolate each strain in vitro, and thus discern differences in bacteriophage and mobile genetic elements gene expression profiles between ex vivo and in vitro that may have represented adaptation to life in the human bloodstream. The expression of mobile genetic elements was amongst the most significant differences between gene expression profiles ex vivo and in vitro, and these differences identified may have consequences for the human host. From the over-expression of beta lactamases on plasmids and transposons ex vivo, to the repression of prophage expression and adsorption during culture in media with human blood, differences in the expression of mobile genetic elements were characteristic of the MRSA ex vivo response. As we continue to study the behavior of human pathogens, ex vivo studies such as this provide further insights into the gene expression patterns in pathogens and their viruses as they adapt to life in the human host.
Materials and Methods
Ethics Statement
Human subject involvement in this study was approved by the University of California, San Diego Administrative Panel on Human Subjects in Medical Research. The study was certified as category 4 exempt, which includes research involving the collection or study of existing data, documents, records, pathological specimens, or diagnostic specimens, if the information is recorded in such a manner that subjects cannot be identified, directly or through identifiers linked to the subjects.
Human Subjects and Culture Conditions
We sampled blood from 10 human subjects with invasive bloodstream infections (Table 1). Samples 21MRA and 23MRA were taken from the same subject approximately 48 h apart for a total of 11 different samples from 10 subjects. From each subject, 8–10 mL of blood was inoculated directly at bedside into 30 ml of media in BD Bactec Plus aerobic culture vials (BD Diagnostic Systems, Sparks, MD) and incubated for approximately 4–8 h until positive by fluorescent detection using the Bactec FX system (Zadroga et al., 2013). Positive cultures were gram stained, grown on sheep blood agar plates, and subjected to a coagulase test for a presumptive identification of Staphylococcus aureus. Identification and susceptibility testing was performed using the BD Phoenix system (Stefaniuk et al., 2003) to confirm the presence of MRSA in the bloodstream of each subject. Susceptibilities were based on MIC (minimum inhibitory concentration) breakpoints using Clinical and Laboratory Standards Institute guidelines (CLSI, 2012). Each isolate was assayed for susceptibility to antibiotics cefazolin, clindamycin, daptomycin, linezolid, oxacillin, rifampin, trimethoprim/sulfamethoxazole, and vancomycin. Clindamycin susceptibility was verified by D-test (Woods, 2009). A minimum of 3 mL of each positive sample in the standard aerobic culture vial was immediately processed in the ex vivo arm of this study. For the in vitro growth conditions, each identified MRSA strain was grown on blood agar plates, and reconstituted in tryptic soy broth at an OD600 of 0.1. One milliliter of this suspension was diluted in 7 ml of sterile normal saline and inoculated into the BD Bactec Plus aerobic culture vials and incubated for approximately 3–6 h until positive by fluorescent detection using the Bactec FX system. One milliliter of this suspension was immediately processed in the in vitro arm of this study.
MRSA Growth Conditions
OD600 values for each isolate grown in the BD Bactec Plus aerobic vials was determined at the time of fluorescence detection (approximately 3.5 to 4.5 h, depending on the isolate). To determine the growth phase at the time of fluorescence detection, MRSA isolates were grown for 16 h in BD Bactec Plus aerobic broth and reconstituted to an OD600 of 0.1. Cultures were then incubated at 35°C in BD Bactec Plus aerobic broth with gentle agitation and OD600 values for each isolate was determined at 15 min intervals over a 24 h period to construct growth curves. CFU/mL for each isolate under in vitro conditions were determined by plating 100 μL of serial dilutions onto BHI agar plates and incubated at 35°C for 16 h. Because the presence of the blood prohibited us from using direct comparisons of OD600 values between the ex vivo and in vitro cultures, we determined the CFU/mL counts from each subject ex vivo to estimate the growth phase at the time of fluorescence detection by plating 100 μL of serial dilutions on BHI agar plates. All ex vivo and in vitro cultures were found to be in early to mid log phase at the time of detection. Two volumes of RNA protect (Qiagen, Valencia, CA) was added directly to the cultures, and they were pelleted and stored at −20°C until RNA extraction.
RNA Extraction, Enrichment, and Sequencing
RNA from both the ex vivo and in vitro samples were processed identically from all subjects and MRSA isolates. Total RNA was extracted using the Mirvana kit (Life Technologies, Grand Island, NY), with the inclusion of a bead-beating step for 20 min with Lysing-Matrix B (MP Bio, Santa Ana, CA). Total RNA then was enriched for microbial RNA using MicrobEnrich (Life Technologies), and further enriched for mRNA using MicrobExpress (Life Technologies) and MegaClear (Life Technologies), which are designed to remove ribosomal RNAs. Enriched RNA then was prepared for sequencing through the construction of cDNA libraries using the Ion Total RNA-Seq kit (Life Technologies), and subjected to successive rounds of Ampure bead purification (Beckman-Coulter, Brea, CA) to remove small cDNAs. Libraries were quantified using an Agilent Bioanalyzer HS DNA Kit (Agilent, Santa Clara, CA) and then were sequenced on a 314 chips using an Ion Torrent Personal Genome Machine (Rothberg et al., 2011), producing an average of 559,129 reads per subject of mean length 106 nucleotides. All sequence data produced in this study are available in the MG-Rast database (metagenomics.anl.gov/) under the project name “MRSA_RNAseq_Study” or project #2278.
Processing of RNA Sequences
Sequencing reads were trimmed according to modified Phred quality scores of 0.5 using CLC Genomics Workbench 4.65 (CLC bio USA, Cambridge, MA). The remaining reads were further processed for quality control by removing reads with substantial length variation (reads <50 nucleotides or >200 nucleotides), or reads where ≥25% of the length was due to homopolymers tracts. Each transcriptome was screened for contaminating human nucleic acids using BLASTN analysis (E-score <10−5) against the human reference database available at ftp://ftp.ncbi.nlm.nih.gov/genomes/H_sapiens/. Any reads homologous to human sequences were removed prior to further analysis. Both in vitro and ex vivo reads from each subject were mapped to a database of staphylococcal genomes (available at ftp://ftp.ncbi.nlm.nih.gov/genomes/Bacteria/) to determine the percentage of reads that mapped to Staphylococcus and to which individual strains they mapped best. Reads from each subject mapped best to known MRSA genomes in all subjects under each growth condition (Table 2).
Analysis of Transcriptomes
Each ex vivo and in vitro transcriptome were mapped against USA300 MRSA strain FPR3757 using CLC Genomics Workbench 4.65. RPKM (reads per kilobase per million) values were determined based on the read mappings, and values were normalized for each subject and growth condition. A heatmap demonstrating the distribution of gene expression based on normalized RPKM values was generated using CLC Genomics Workbench 4.65. Virtually identical heatmaps also were generated when reads were mapped against genomes of other MRSA strains including COL, JH1, Mu50, TCH1516, and Newman. RPKM values also were used as input for principal coordinates analysis, and were performed based on binary Sorensen distances using Qiime (Caporaso et al., 2010).
Analysis of gene expression from different subsystems in MRSA were determined by blastX analysis of the SEED database using MG-Rast (E-score <10−5) (Meyer et al., 2008). Mobile genetic element and virulence gene expression was determined based on the proportion of each selected mobile element or virulence gene to the total mobile genetic element or virulence gene RPKM values. Subsystems such as mobile genetic elements and virulence genes were determined based on homologies to genes designated to those functions in the SEED database (Meyer et al., 2008). Statistical significance was determined by comparing the means for all subjects for all subsystems between the ex vivo and in vitro subject groups by two-tailed t-tests using Microsoft Excel 2007 (Microsoft Corp., Redman, WA). Analysis of the expression differences between in vitro and ex vivo groups for individual genes also were determined by comparisons of means. The data for each individual gene were compared between MG-Rast and the normalized RPKM values obtained from CLC Genomics Workbench 4.65 to verify that they produced similar results.
Prophage Stimulation and Sequencing
Each MRSA strain was grown in BHI broth (Becton, Dickinson, MD, USA) for approximately 3 h at 37°C with shaking at 200 rpm to an OD600 of 0.5. The average number of cells was similar between each MRSA strain (1.84 ± 0.45 × 10⁸ Colony Forming Units (CFU)/mL). Each strain then was centrifuged for 10 min at 10,000 rpm, pellets re-suspended in 500 μL of BHI broth or human blood (Novick, 1963), and mitomycin C added to a final concentration of 2 μg/mL. The human blood used was drawn into heparin tubes (BD Diagnostic Systems, Sparks, MD) from healthy donors. MRSA cultures without the addition of mitomycin C were used as experimental controls and were without evidence of any prophage production, with the exception of isolates 3MRA and 20MRA. Each was left for 16 h at 32°C with shaking at 50 rpm. To determine the number of phage produced, cultures were centrifuged for 5 min at 14, 000 rpm to remove cellular debris, and filtered through 0.2 μm pore membrane filters (25 mm, Whatman GE Healthcare Life Sciences). Supernatants were cultured for the presence of any residual bacteria, and no bacteria could be cultured from any. We tested the supernatants for the presence of viable phage using the double layer method (Novick, 1991). Briefly, S. aureus strain RN10950 (S. aureus Newman strain with all four prophage deleted) (Bae et al., 2006) was grown for 4 h at 37°C with shaking at 200 rpm to an OD600 of 1.0. Then, 100 μL of S. aureus RN10950 and 100 μL of the phage supernatants were added to 3 mL of phage top agar and poured onto phage bottom agar plates (Novick, 1991). Plates were incubated at 32°C for 16 h and viral plaques were enumerated and reported as Plaque Forming Units (PFU)/mL.
To determine if blood may inhibit phage infectivity, phage 3MRA and 23MRA were added to 1 mL of BHI or fresh human blood and incubated at 32°C with shaking at 50 rpm to maintain the conditions used in induction experiments. Aliquots were collected at 0, 4, and 16 h to determine the infectivity of phage. Blood cells were removed prior to plating phage by centrifugation at 14,000 rpm for 5 min and filtered through 0.45 μm filters. The phage in BHI also was centrifuged and filtered for consistency. S. aureus strain RN10950 was grown for 4 h at 37°C with shaking at 200 rpm to an OD600 of 1.0. Then, 100 μL of RN10950 and 100 μL of BHI or blood containing the seeded phage were serially diluted and added to 3 mL of phage top agar and poured onto phage bottom agar plates. Plates were incubated at 32°C for 16 h and viral plaques were enumerated and reported as PFU/mL. All experiments were performed in triplicate.
Phage were isolated as previously described (Santiago-Rodriguez et al., 2010). Briefly, viral plaques were retrieved using a sterile pipette and placed in 500 μL of 1× PBS. The plug was dislodged using a sterile pipette and centrifuged at 14,000 rpm for 5 min. The supernatant was collected and further propagated by adding 100 μL of the phage supernatant and 100 μL (OD600 of 1.0) of S. aureus RN10950 to 3 mL of top agar. The mixture was poured onto phage bottom agar plates and incubated at 32°C for 24 h. The top agar was collected and centrifuged at 7500 rpm for 15 min. The supernatant was collected and filtered sequentially through 0.45 μm filters and 0.22 μm filters. The propagation step was repeated until complete lysis was observed. Supernatants then were purified on a cesium chloride gradient according to previously described protocols for isolation of viruses (Pride et al., 2012). Only the fraction with a density corresponding to most known bacteriophage (Murphy et al., 1995) was retained, further purified on Amicon YM-100 protein purification columns (Millipore, Inc., Bellerica, MA), treated with DNase I, and subjected to lysis and DNA purification using the Qiagen UltraSens virus kit (Qiagen, Valencia, CA). Resulting DNA was fragmented to roughly 200 to 400 bp using a Bioruptor (Diagenode, Denville, NJ), and utilized as input to create libraries using the Ion Plus Fragment Library Kit according to manufacturer's instructions. Libraries then were sequenced using a 314 chip on an Ion Torrent Personal Genome Machine (PGM; Life Technologies, Grand Island, NY) (Rothberg et al., 2011) producing an average read length of approximately 216 bp for each sample. Sequence reads were trimmed according to modified Phred scores of 0.5 using CLC Genomics Workbench 4.65 (CLC bio USA, Cambridge, MA). Any low complexity reads (where >25% of the length were due to homopolymer tracts), reads with substantial length variation (<50 nucleotides or >300 nucleotides), or reads with ambiguous characters also were removed prior to further analysis. Remaining reads were assembled using CLC Genomics Workbench 4.65 based on 98% identity with a minimum of 50% read overlap, which are more stringent than criteria developed to discriminate between highly related viruses (Breitbart et al., 2002). The consensus sequence for each assembled phage was constructed according to majority rule. Viral contigs were analyzed using FGenesV (Softberry Inc, Mount Kisco, NY) for ORF prediction, and individual ORFs analyzed using BLASTP analysis against the NCBI non-redundant database (Escore <10−5). Alignments of phage genomes were performed with progressiveMauve using the default settings (Darling et al., 2010). Sequences of each Staphylococcus phage are available in Genbank under accession numbers KJ452291 and KJ452292. The reverse complements of these phage genome sequences were utilized in the genome alignments.
Author Contributions
Conceived and designed experiments: DTP and MBJ. Performed the experiments TSR, MN, and ML. Analyzed the data: DTP, TSR, and MBJ. Wrote the manuscript: DTP and TSR. All authors have read and approved this manuscript.
Conflict of Interest Statement
The authors declare that the research was conducted in the absence of any commercial or financial relationships that could be construed as a potential conflict of interest.
Acknowledgments
Supported by the Burroughs Wellcome Fund, and the UNCF-Merck Science Initiative to DTP. We thank Sharon Reed, Lizanne Keays, Jane Harrington, and Lars Eckman for their contribution to this work. Strain RN10950 was donated by Dr. Richard Novick.
Supplementary Material
The Supplementary Material for this article can be found online at: http://www.frontiersin.org/journal/10.3389/fmicb.2015.00216/abstract
Supplemental Figure 1. Growth curves for MRSA isolates. Each isolate is shown in separate panels with their respective OD600 measurements at 15 min intervals on the y-axis and the time over a period of 24 h period shown on the x-axis. The time of fluorescence detection under in vitro (blue circles) and ex vivo (red circles) conditions are shown for each subject in each panel.
Supplemental Figure 2. Mean percentage (± standard deviation) of all gene expression from each subsystem in Staphylococcus aureus transcriptomes ex vivo and in vitro. The upper panel shows subsystems that were significantly different between ex vivo and in vitro samples, and the lower panel shows subsystems that were not significantly different. p-values are shown to the right of each subsystem. Ex vivo gene expression is represented by black bars and in vitro is represented by white bars.
Supplemental Figure 3. Abundance (%) of mobile element gene expression in Staphylococcus aureus transcriptomes for all subjects. Specimens 21MRA and 23MRA are from the same subject 48 h apart.
Supplemental Figure 4. Abundance (%) of virulence gene expression in Staphylococcus aureus transcriptomes for all subjects. Ex vivo gene expression is represented by black bars and in vitro is represented by white bars. Specimens 21MRA and 23MRA are from the same subject 48 h apart.
Supplemental Figure 5. Mean percentage (± standard deviation) of the virulence subsystem devoted to individual elements. p-values are shown above each virulence factor. Ex vivo gene expression is represented by black bars and in vitro is represented by white bars. (A) shows Staphylococcal Pathogenicity Islands (SaPIs) and cytolysins, and (B) shows tcaA (teicoplanin-resistance), ddl (involved in cell wall synthesis) and lukS-PV and lukF-PV (encoding Panton-Valentine leukocidin).
References
Allard, M., Moisan, H., Brouillette, E., Gervais, A. L., Jacques, M., Lacasse, P., et al. (2006). Transcriptional modulation of some Staphylococcus aureus iron-regulated genes during growth in vitro and in a tissue cage model in vivo. Microbes Infect. 8, 1679–1690. doi: 10.1016/j.micinf.2006.01.022
PubMed Abstract | Full Text | CrossRef Full Text | Google Scholar
Baba, T., Bae, T., Schneewind, O., Takeuchi, F., and Hiramatsu, K. (2008). Genome sequence of Staphylococcus aureus strain Newman and comparative analysis of staphylococcal genomes: polymorphism and evolution of two major pathogenicity islands. J. Bacteriol. 190, 300–310. doi: 10.1128/JB.01000-07
PubMed Abstract | Full Text | CrossRef Full Text | Google Scholar
Bae, T., Baba, T., Hiramatsu, K., and Schneewind, O. (2006). Prophages of Staphylococcus aureus Newman and their contribution to virulence. Mol. Microbiol. 62, 1035–1047. doi: 10.1111/j.1365-2958.2006.05441.x
PubMed Abstract | Full Text | CrossRef Full Text | Google Scholar
Breitbart, M., Salamon, P., Andresen, B., Mahaffy, J. M., Segall, A. M., Mead, D., et al. (2002). Genomic analysis of uncultured marine viral communities. Proc. Natl. Acad. Sci. U.S.A. 99, 14250–14255. doi: 10.1073/pnas.202488399
PubMed Abstract | Full Text | CrossRef Full Text | Google Scholar
Brussow, H., Canchaya, C., and Hardt, W. D. (2004). Phages and the evolution of bacterial pathogens: from genomic rearrangements to lysogenic conversion. Microbiol. Mol. Biol. Rev. 68, 560–602. doi: 10.1128/MMBR.68.3.560-602.2004
PubMed Abstract | Full Text | CrossRef Full Text | Google Scholar
Canchaya, C., Proux, C., Fournous, G., Bruttin, A., and Brussow, H. (2003). Prophage genomics. Microbiol. Mol. Biol. Rev. 67, 238–276. doi: 10.1128/MMBR.67.2.238-276.2003
PubMed Abstract | Full Text | CrossRef Full Text | Google Scholar
Caporaso, J. G., Kuczynski, J., Stombaugh, J., Bittinger, K., Bushman, F. D., Costello, E. K., et al. (2010). QIIME allows analysis of high-throughput community sequencing data. Nat. Meth. 7, 335–336. doi: 10.1038/nmeth.f.303
PubMed Abstract | Full Text | CrossRef Full Text | Google Scholar
Casjens, S. (2003). Prophages and bacterial genomics: what have we learned so far? Mol. Microbiol. 49, 277–300. doi: 10.1046/j.1365-2958.2003.03580.x
PubMed Abstract | Full Text | CrossRef Full Text | Google Scholar
Chaffin, D. O., Taylor, D., Skerrett, S. J., and Rubens, C. E. (2012). Changes in the Staphylococcus aureus transcriptome during early adaptation to the lung. PLoS ONE 7:e41329. doi: 10.1371/journal.pone.0041329
PubMed Abstract | Full Text | CrossRef Full Text | Google Scholar
CLSI, (2012). “Performance Standards for Antimicrobial Susceptibility Testing; Twenty-Second Informational Supplement,” in CLSI Document M100-S22, ed D. M. Wilhelm (Wayne, PA: Clinical and Laboratory Standards Institute), 110–115.
Cui, L., Lian, J. Q., Neoh, H. M., Reyes, E., and Hiramatsu, K. (2005). DNA microarray-based identification of genes associated with glycopeptide resistance in Staphylococcus aureus. Antimicrob. Agents Chemother. 49, 3404–3413. doi: 10.1128/AAC.49.8.3404-3413.2005
PubMed Abstract | Full Text | CrossRef Full Text | Google Scholar
Darling, A. E., Mau, B., and Perna, N. T. (2010). progressiveMauve: multiple genome alignment with gene gain, loss and rearrangement. PLoS ONE 5:e11147. doi: 10.1371/journal.pone.0011147
PubMed Abstract | Full Text | CrossRef Full Text | Google Scholar
Deghorain, M., and Van Melderen, L. (2012). The Staphylococci phages family: an overview. Viruses 4, 3316–3335. doi: 10.3390/v4123316
PubMed Abstract | Full Text | CrossRef Full Text | Google Scholar
Diep, B. A., Palazzolo-Ballance, A. M., Tattevin, P., Basuino, L., Braughton, K. R., Whitney, A. R., et al. (2008a). Contribution of Panton-Valentine leukocidin in community-associated methicillin-resistant Staphylococcus aureus pathogenesis. PLoS ONE 3:e3198. doi: 10.1371/journal.pone.0003198
PubMed Abstract | Full Text | CrossRef Full Text | Google Scholar
Diep, B. A., Stone, G. G., Basuino, L., Graber, C. J., Miller, A., Des Etages, S. A., et al. (2008b). The arginine catabolic mobile element and staphylococcal chromosomal cassette mec linkage: convergence of virulence and resistance in the USA300 clone of methicillin-resistant Staphylococcus aureus. J. Infect. Dis. 197, 1523–1530. doi: 10.1086/587907
PubMed Abstract | Full Text | CrossRef Full Text | Google Scholar
Feng, Y., Chen, C. J., Su, L. H., Hu, S., Yu, J., and Chiu, C. H. (2008). Evolution and pathogenesis of Staphylococcus aureus: lessons learned from genotyping and comparative genomics. FEMS Microbiol. Rev. 32, 23–37. doi: 10.1111/j.1574-6976.2007.00086.x
PubMed Abstract | Full Text | CrossRef Full Text | Google Scholar
Gaidelyte, A., Vaara, M., and Bamford, D. H. (2007). Bacteria, phages and septicemia. PLoS ONE 2:e1145. doi: 10.1371/journal.pone.0001145
PubMed Abstract | Full Text | CrossRef Full Text | Google Scholar
Goerke, C., Wirtz, C., Fluckiger, U., and Wolz, C. (2006). Extensive phage dynamics in Staphylococcus aureus contributes to adaptation to the human host during infection. Mol. Microbiol. 61, 1673–1685. doi: 10.1111/j.1365-2958.2006.05354.x
PubMed Abstract | Full Text | CrossRef Full Text | Google Scholar
Hanssen, A. M., and Ericson Sollid, J. U. (2006). SCCmec in staphylococci: genes on the move. FEMS Immunol. Med. Microbiol. 46, 8–20. doi: 10.1111/j.1574-695X.2005.00009.x
PubMed Abstract | Full Text | CrossRef Full Text | Google Scholar
Kennedy, L. A., Gill, J. A., Schultz, M. E., Irmler, M., and Gordin, F. M. (2010). Inside-out: the changing epidemiology of methicillin-resistant Staphylococcus aureus. Infect. Control Hosp. Epidemiol. 31, 983–985. doi: 10.1086/655837
PubMed Abstract | Full Text | CrossRef Full Text | Google Scholar
Lindsay, J. A., Moore, C. E., Day, N. P., Peacock, S. J., Witney, A. A., Stabler, R. A., et al. (2006). Microarrays reveal that each of the ten dominant lineages of Staphylococcus aureus has a unique combination of surface-associated and regulatory genes. J. Bacteriol. 188, 669–676. doi: 10.1128/JB.188.2.669-676.2006
PubMed Abstract | Full Text | CrossRef Full Text | Google Scholar
Malachowa, N., and Deleo, F. R. (2010). Mobile genetic elements of Staphylococcus aureus. Cell Mol. Life Sci. 67, 3057–3071. doi: 10.1007/s00018-010-0389-4
PubMed Abstract | Full Text | CrossRef Full Text | Google Scholar
Malachowa, N., and Deleo, F. R. (2011). Staphylococcus aureus survival in human blood. Virulence 2, 567–569. doi: 10.4161/viru.2.6.17732
PubMed Abstract | Full Text | CrossRef Full Text | Google Scholar
Malachowa, N., Whitney, A. R., Kobayashi, S. D., Sturdevant, D. E., Kennedy, A. D., Braughton, K. R., et al. (2011). Global changes in Staphylococcus aureus gene expression in human blood. PLoS ONE 6:e18617. doi: 10.1371/journal.pone.0018617
PubMed Abstract | Full Text | CrossRef Full Text | Google Scholar
Martin, R. R., and White, A. (1968). Prevention of staphylococcal bacteriophage activity by antigen A precipitins in human sera. J. Bacteriol. 95, 2177–2181.
McCarthy, A. J., Breathnach, A. S., and Lindsay, J. A. (2012a). Detection of mobile-genetic-element variation between colonizing and infecting hospital-associated methicillin-resistant Staphylococcus aureus isolates. J. Clin. Microbiol. 50, 1073–1075. doi: 10.1128/JCM.05938-11
PubMed Abstract | Full Text | CrossRef Full Text | Google Scholar
McCarthy, A. J., and Lindsay, J. A. (2010). Genetic variation in Staphylococcus aureus surface and immune evasion genes is lineage associated: implications for vaccine design and host-pathogen interactions. BMC Microbiol. 10:173. doi: 10.1186/1471-2180-10-173
PubMed Abstract | Full Text | CrossRef Full Text | Google Scholar
McCarthy, A. J., Witney, A. A., and Lindsay, J. A. (2012b). Staphylococcus aureus temperate bacteriophage: carriage and horizontal gene transfer is lineage associated. Front. Cell Infect. Microbiol. 2:6. doi: 10.3389/fcimb.2012.00006
Meyer, F., Paarmann, D., D'Souza, M., Olson, R., Glass, E. M., Kubal, M., et al. (2008). The metagenomics RAST server - a public resource for the automatic phylogenetic and functional analysis of metagenomes. BMC Bioinformatics 9:386. doi: 10.1186/1471-2105-9-386
PubMed Abstract | Full Text | CrossRef Full Text | Google Scholar
Murphy, F. A., Fauquet, C. M., Bishop, D. H. L., Ghabrial, S. A., Jarvis, A. W., et al. (1995). Virus Taxonomy: Sizth Report of the International Committee on Taxonomy of Viruses. Vol. Suppl. 10. New York, NY: Springer-Verlag.
Nolle, N., Schuster, C. F., and Bertram, R. (2013). Two paralogous yefM-yoeB loci from Staphylococcus equorum encode functional toxin-antitoxin systems. Microbiology 159, 1575–1585. doi: 10.1099/mic.0.068049-0
PubMed Abstract | Full Text | CrossRef Full Text | Google Scholar
Nordstrom, K., Forsgren, A., and Cox, P. (1974). Prevention of bacteriophage adsorption to Staphylococcus aureus by immunoglobulin G. J. Virol. 14, 203–206.
Novick, R. (1967). Properties of a cryptic high-frequency transducing phage in Staphylococcus aureus. Virology 33, 155–166. doi: 10.1016/0042-6822(67)90105-5
PubMed Abstract | Full Text | CrossRef Full Text | Google Scholar
Novick, R. P., and Subedi, A. (2007). The SaPIs: mobile pathogenicity islands of Staphylococcus. Chem. Immunol. Allergy 93, 42–57. doi: 10.1159/000100857
PubMed Abstract | Full Text | CrossRef Full Text | Google Scholar
Novick, R. P. (1963). Analysis by transduction of mutations affecting Penicillinase formation in Staphylococcus Aureus. J. Gen. Microbiol. 33, 121–136. doi: 10.1099/00221287-33-1-121
PubMed Abstract | Full Text | CrossRef Full Text | Google Scholar
Novick, R. P. (1991). Genetic systems in staphylococci. Methods Enzymol. 204, 587–636. doi: 10.1016/0076-6879(91)04029-N
PubMed Abstract | Full Text | CrossRef Full Text | Google Scholar
Pan, E. S., Diep, B. A., Carleton, H. A., Charlebois, E. D., Sensabaugh, G. F., Haller, B. L., et al. (2003). Increasing prevalence of methicillin-resistant Staphylococcus aureus infection in California jails. Clin. Infect. Dis. 15, 1384–1388. doi: 10.1086/379019
PubMed Abstract | Full Text | CrossRef Full Text | Google Scholar
Pohl, K., Francois, P., Stenz, L., Schlink, F., Geiger, T., Herbert, S., et al. (2009). CodY in Staphylococcus aureus: a regulatory link between metabolism and virulence gene expression. J. Bacteriol. 191, 2953–2963. doi: 10.1128/JB.01492-08
PubMed Abstract | Full Text | CrossRef Full Text | Google Scholar
Popovich, K. J., Weinstein, R. A., and Hota, B. (2008). Are community-associated methicillin-resistant Staphylococcus aureus (MRSA) strains replacing traditional nosocomial MRSA strains? Clin. Infect. Dis. 46, 787–794. doi: 10.1086/528716
PubMed Abstract | Full Text | CrossRef Full Text | Google Scholar
Pride, D. T., Salzman, J., Haynes, M., Rohwer, F., Davis-Long, C., White, R. A., et al. (2012). Evidence of a robust resident bacteriophage population revealed through analysis of the human salivary virome. ISME J. 6, 915–926. doi: 10.1038/ismej.2011.169
PubMed Abstract | Full Text | CrossRef Full Text | Google Scholar
Queck, S. Y., Khan, B. A., Wang, R., Bach, T. H., Kretschmer, D., Chen, L., et al. (2009). Mobile genetic element-encoded cytolysin connects virulence to methicillin resistance in MRSA. PLoS Pathog 5:e1000533. doi: 10.1371/journal.ppat.1000533
PubMed Abstract | Full Text | CrossRef Full Text | Google Scholar
Renzoni, A., Barras, C., Francois, P., Charbonnier, Y., Huggler, E., Garzoni, C., et al. (2006). Transcriptomic and functional analysis of an autolysis-deficient, teicoplanin-resistant derivative of methicillin-resistant Staphylococcus aureus. Antimicrob. Agents Chemother. 50, 3048–3061. doi: 10.1128/AAC.00113-06
PubMed Abstract | Full Text | CrossRef Full Text | Google Scholar
Rothberg, J. M., Hinz, W., Rearick, T. M., Schultz, J., Mileski, W., Davey, M., et al. (2011). An integrated semiconductor device enabling non-optical genome sequencing. Nature 475, 348–352. doi: 10.1038/nature10242
PubMed Abstract | Full Text | CrossRef Full Text | Google Scholar
Sabersheikh, S., and Saunders, N. A. (2004). Quantification of virulence-associated gene transcripts in epidemic methicillin resistant Staphylococcus aureus by real-time PCR. Mol. Cell Probes. 18, 23–31. doi: 10.1016/j.mcp.2003.07.009
PubMed Abstract | Full Text | CrossRef Full Text | Google Scholar
Santiago-Rodriguez, T. M., Davila, C., Gonzalez, J., Bonilla, N., Marcos, P., Urdaneta, M., et al. (2010). Characterization of Enterococcus faecalis-infecting phages (enterophages) as markers of human fecal pollution in recreational waters. Water Res. 44, 4716–4725. doi: 10.1016/j.watres.2010.07.078
PubMed Abstract | Full Text | CrossRef Full Text | Google Scholar
Sass, P., Jansen, A., Szekat, C., Sass, V., Sahl, H. G., and Bierbaum, G. (2008). The lantibiotic mersacidin is a strong inducer of the cell wall stress response of Staphylococcus aureus. BMC Microbiol. 8:186. doi: 10.1186/1471-2180-8-186
PubMed Abstract | Full Text | CrossRef Full Text | Google Scholar
Shopsin, B., Herring, S., and Kreiswirth, B. N. (2003). Hospital-acquired and community-derived: the future of MRSA? Clin. Infect. Dis. 37, 151–152; author reply 152. doi: 10.1086/375608
PubMed Abstract | Full Text | CrossRef Full Text | Google Scholar
Srinivasan, A., Dick, J. D., and Perl, T. M. (2002). Vancomycin resistance in staphylococci. Clin. Microbiol. Rev. 15, 430–438. doi: 10.1128/CMR.15.3.430-438.2002
PubMed Abstract | Full Text | CrossRef Full Text | Google Scholar
Stefaniuk, E., Baraniak, A., Gniadkowski, M., and Hryniewicz, W. (2003). Evaluation of the BD Phoenix automated identification and susceptibility testing system in clinical microbiology laboratory practice. Eur. J. Clin. Microbiol. Infect. Dis. 22, 479–485. doi: 10.1007/s10096-003-0962-y
PubMed Abstract | Full Text | CrossRef Full Text | Google Scholar
Stevens, D. L., Ma, Y., Salmi, D. B., McIndoo, E., Wallace, R. J., and Bryant, A. E. (2007). Impact of antibiotics on expression of virulence-associated exotoxin genes in methicillin-sensitive and methicillin-resistant Staphylococcus aureus. J. Infect. Dis. 195, 202–211. doi: 10.1086/510396
PubMed Abstract | Full Text | CrossRef Full Text | Google Scholar
Vandenesch, F., Naimi, T., Enright, M. C., Lina, G., Nimmo, G. R., Heffernan, H., et al. (2003). Community-acquired methicillin-resistant Staphylococcus aureus carrying Panton-Valentine leukocidin genes: worldwide emergence. Emerg. Infect. Dis. 9, 978–984. doi: 10.3201/eid0908.030089
PubMed Abstract | Full Text | CrossRef Full Text | Google Scholar
Wilhelm, B. T., and Landry, J. R. (2009). RNA-Seq-quantitative measurement of expression through massively parallel RNA-sequencing. Methods 48, 249–257. doi: 10.1016/j.ymeth.2009.03.016
PubMed Abstract | Full Text | CrossRef Full Text | Google Scholar
Witney, A. A., Marsden, G. L., Holden, M. T., Stabler, R. A., Husain, S. E., Vass, J. K., et al. (2005). Design, validation, and application of a seven-strain Staphylococcus aureus PCR product microarray for comparative genomics. Appl. Environ. Microbiol. 71, 7504–7514. doi: 10.1128/AEM.71.11.7504-7514.2005
PubMed Abstract | Full Text | CrossRef Full Text | Google Scholar
Woods, C. R. (2009). Macrolide-inducible resistance to clindamycin and the D-test. Pediatr. Infect. Dis. J. 28, 1115–1118. doi: 10.1097/INF.0b013e3181c35cc5
PubMed Abstract | Full Text | CrossRef Full Text | Google Scholar
Young, L. S., Perdreau-Remington, F., and Winston, L. G. (2004). Clinical, epidemiologic, and molecular evaluation of a clonal outbreak of methicillin-resistant Staphylococcus aureus infection. Clin. Infect. Dis. 38, 1075–1083. doi: 10.1086/382361
PubMed Abstract | Full Text | CrossRef Full Text | Google Scholar
Keywords: Staphylococcus aureus, transcriptome, RNA Seq, human microbiome, bacteriophage, prophage, mobile genetic element
Citation: Santiago-Rodriguez TM, Naidu M, Jones MB, Ly M and Pride DT (2015) Identification of staphylococcal phage with reduced transcription in human blood through transcriptome sequencing. Front. Microbiol. 6:216. doi: 10.3389/fmicb.2015.00216
Received: 21 November 2014; Accepted: 03 March 2015;
Published: 24 March 2015.
Edited by:
Katrine L. Whiteson, University of California, USAReviewed by:
Theo Dreher, Oregon State University, USABeatriz Martínez, Consejo Superior de Investigaciones Científicas, Spain
Jodi A. Lindsay, St George's, University of London, UK
Copyright © 2015 Santiago-Rodriguez, Naidu, Jones, Ly and Pride. This is an open-access article distributed under the terms of the Creative Commons Attribution License (CC BY). The use, distribution or reproduction in other forums is permitted, provided the original author(s) or licensor are credited and that the original publication in this journal is cited, in accordance with accepted academic practice. No use, distribution or reproduction is permitted which does not comply with these terms.
*Correspondence: David T. Pride, Department of Pathology, University of California, San Diego, 9500 Gilman Drive, MC 0612, La Jolla, San Diego, CA 92093-0612, USA dpride@ucsd.edu