 Jatta Saarenheimo
 Marja Annika Tiirola
 Antti J. Rissanen
- Department of Biological and Environmental Science, University of Jyväskylä, Jyväskylä, Finland
Denitrification is an important microbial process in aquatic ecosystems that can reduce the effects of eutrophication. Here, quantification and pyrosequencing of nirS, nirK, and nosZ genes encoding for nitrite and nitrous oxide reductases was performed in sediment samples from four boreal lakes to determine the structure and seasonal stability of denitrifying microbial populations. Sediment quality and nitrate concentrations were linked to the quantity and diversity of denitrification genes, the abundance of denitrifying populations (nirS and nosZ genes) correlated with coupled nitrification-denitrification (Dn), and the denitrification of the overlying water NO3- (Dw) correlated with the nirS/nirK ratio. The number of core nirS, nirK, and nosZ operational taxonomical units (OTUs) was low (6, 7, and 3, respectively), and most of these core OTUs were shared among the lakes. Dominant nirK sequences matched best with those of the order Rhizobiales, which was one of the main bacterial orders present in the sediment microbiomes, whereas the dominant nirS sequences were affiliated with the order Burkholderiales. Over half of the nosZ sequences belonged to a single OTU of the order Burkholderiales, but coupled nitrification–denitrification rate correlated with another dominant nosZ OTU assigned to the order Rhodospirillales. The study indicates that a few core proteobacterial clusters may drive denitrification in boreal lake sediments, as the same Alpha- and Betaproteobacteria denitrifier clusters were present in different lakes and seasons.
Introduction
Denitrification is an important microbial process that removes excess nitrogen from aquatic ecosystems. This dissimilatory process reduces nitrate (NO3-) to nitrogen gas (N2) through intermediates of nitrite (NO2-), nitric oxide (NO) and greenhouse gas nitrous oxide (N2O), which is produced in the truncated denitrification pathway. Lakes are ‘hot spots’ of nitrogen removal, significantly reducing the N loading from land before it reaches vulnerable coastal ecosystems (Lepistö et al., 2006; Seitzinger et al., 2006). A meta-analysis focusing on denitrification in various aquatic environments (oceans, coastal ecosystems, estuaries, lakes and rivers) showed that nitrate concentration was the most important factor controlling the denitrification process (Piña-Ochoa and Álvarez-Conbelas, 2006). Nitrate also controls the key bacterial processes, e.g., organic matter degradation and biogeochemical cycling of various elements (Martins et al., 2011; Cheng et al., 2014), by modifying the microbial community composition (Zhang et al., 2015). The dominant phylogenetic groups in lake ecosystems are Proteobacteria, Nitrospira, Actinobacteria, Acidobacteria, and Verrucomicrobia (Newton et al., 2011; Zhang et al., 2015).
In addition to nitrate, other environmental factors have also been shown to control denitrification rates. For example, fresh carbon and oxygen cycles on a seasonal and diurnal basis were positively related to denitrification in a stream ecosystem (Tatariw et al., 2013). Besides environmental factors, denitrification activity can be linked to variations in denitrification genes. The denitrification pathway consists of four enzymatically catalyzed reductive steps that different microbes including bacteria (Zumft, 1997), archaea (Philippot, 2002) and fungi (Shoun et al., 1992; Tanimoto et al., 1992) perform. Production of the first gaseous product (NO) is catalyzed by one of two possible nitrite reductases (nir): cytochrome cd1 heme type reductase encoded by the nirS gene or copper-oxidoreductase encoded by nirK (Zumft, 1997). The nirS and nirK reductases are functionally equivalent, but structurally divergent. The enzymes are mutually exclusive in cultivated strains (Jones and Hallin, 2010). Although the abundance of these genes, like nirS and nirK, has been uncoupled to in situ denitrification rates in many soil studies (Dandie et al., 2008; Cuhel et al., 2010), the abundance of the genes, especially nirS, has been shown to correlate with potential denitrification rates (Hallin et al., 2009; Enwall et al., 2010; Graham et al., 2010). The distribution of nirS and nirK-containing denitrifiers is environment-specific (Junier et al., 2008; Jones and Hallin, 2010; Kim et al., 2011) and the relationship between nirS and nirK denitrifiers is thought to be controlled by dissolved oxygen regimes, with nirS favoring lower redox conditions (Knapp et al., 2009; Graham et al., 2010; Tatariw et al., 2013).
Most of the known nitrite reductase sequences are derived from bacteria of the phylum Proteobacteria (Jones et al., 2008), where Alpha-, Beta-, and Gammaproteobacteria are typical classes of denitrifiers (Vila-Costa et al., 2014; Yu et al., 2014). Linking the functional genes community composition and denitrification processes has been used to better understand the role of microbial control. Sequencing nirS genes from salt marsh sediments showed a high degree of endemic operational taxonomical units (OTUs) present in single samples (Bowen et al., 2013), whereas nirS, nirK, and nosZ communities in acidic peat soils (Palmer et al., 2012) and nirS and nirK communities in rice paddy fields (Yoshida et al., 2009) were mostly dominated by a few core OTUs. Such information from other aquatic systems, such as lakes, is lacking. However, as salinity is a very important factor shaping the structure of denitrifier communities (Jones and Hallin, 2010), one could predict that also other freshwater systems than peatlands and rice fields show similar patterns, i.e., are dominated by a few core OTUs. In addition, it is still unclear, whether the community composition or gene abundances can be used to predict the prevailing process rates in aquatic ecosystem. To our knowledge, no previous study of freshwater systems combines process measurements with analysis of both the abundance and alpha- and beta- diversity of nitrite – reducers and nitrous oxide – reducers. Thus, possible links between community structure and denitrification rates might have been previously unnoticed.
Here, we hypothesized that denitrifier community of lake ecosystems is dominated by a few core OTUs, i.e., by a low number of different bacterial groups. In addition, we hypothesized that the abundance and/or diversity of at least one of the denitrification genes (nirS, nirK, and nosZ) predicts denitrification rates in lakes. The study was conducted at an inter-lake scale, covering four boreal lakes in Southern Finland with varying nitrate concentrations and across a depth gradient within a single lake (Lake Ormajärvi) with a temporal (four seasons) resolution. Besides our recent DGGE study of nirK genes (Rissanen et al., 2013), to our knowledge, correlations of nirS, nirK, and nosZ genes and denitrification rates have not been analyzed from boreal lake sediments, which are important filters of anthropogenic nitrogen loads. Molecular analysis was performed by quantitative PCR (qPCR) and 454-pyrosequencing. All background environmental data and denitrification rates were previously collected (Rissanen et al., 2011, 2013), with the isotope pairing technique (IPT) that allows division of the intrinsic denitrification rates to coupled nitrification–denitrification and denitrification of the NO3- in overlying water (Dw).
Materials and Methods
Sample and Data Collection
The study lakes, Ormajärvi, Pääjärvi, Suolijärvi, and Lehee, represent typical small to medium sized boreal lakes with mean depths ranging from 1 to 15 m and trophic status ranging from mesotrophic to eutrophic. Rissanen et al. (2011, 2013) gives a full description of the study lakes, sample collection, DNA extraction and measurement of environmental factors and denitrification rates (Supplementary Table S1). Briefly, for the intra-lake scale component, surface sediment samples (down to a depth of 1 cm) were collected from shallow littoral (1 m), deep littoral (3 m) and profundal sites (8 m) of Ormajärvi during four seasons (early-summer, mid-summer, autumn, and winter) in 2006–2007 (Rissanen et al., 2011). At each sampling event, three sediment cores were taken from every depth (36 samples total). For the inter-lake scale study, samples (down to a depth of 2 cm) were collected from profundal sites of Pääjärvi (10 and 12 m), Suolijärvi (10 m) and Lehee (3.3 m) during summer and autumn in 2007 (Rissanen et al., 2013) and were analyzed together with the profundal samples of Ormajärvi (Supplementary Table S1). From lakes Pääjärvi, Suolijärvi, and Lehee, three sediment cores were taken during both sampling occasions (six samples from each lake). Concurrently collected environmental data included organic content [loss on ignition (LOI)] and sediment porosity as well as temperature, [O2], [NO3- + NO2-], [NH4+], and [PO43-] from water above the sediment surface (∼10 cm for O2 and T; ∼2–3 cm for nutrients). Sediment denitrification rate variables (N2 production rate) were measured using IPT calculations (Nielsen, 1992) through incubations with 15NO3- – label as the production of 29N2 and 30N2 and included Dn (natural coupled nitrification–denitrification), Dw (denitrification of the natural NO3- in the water above the sediment) and Den (denitrification of the natural NO3-, i.e., Dn + Dw), herein referred to as total denitrification. IPT samples were measured with a mass spectrometer (Europa Scientific, Roboprep-G-Plus, and Tracermass) at the National Environmental Research Institute in Silkeborg, Denmark.
qPCR of nirS, nirK, and nosZ
The abundance of nirS, nirK, and nosZ genes were measured with qPCR using the partial 16S rRNA gene as a reference gene. For the Lake Ormajärvi depth transect, altogether 36 samples were analyzed. For the inter-lake scale study, sample replicates from Pääjärvi, Suolijärvi, and Lehee were pooled after DNA extraction and the final set, therefore, consisted of two samples from each Pääjärvi, Suolijärvi, and Lehee, and three samples from Ormajärvi. Primer pairs used were nirSCd3aF/nirSR3cd (Kandeler et al., 2006) for nirS, nirK876/nirK1040 (Henry et al., 2004) for nirK, nosZ2F/nosZ2R (Henry et al., 2006) for nosZ and 27f/338r (Lane, 1991, and Universal primer) for 16S rRNA gene. Amplification of qPCR and fluorescent data collection was conducted with a Bio-Rad CFX96 thermal cycler (Bio-Rad Laboratories) following the same protocol as in Saarenheimo et al. (2015). No template inhibition was observed, when qPCR linearity was tested from original, 10- and 100-fold template dilution series. Efficiencies for PCR reactions were 87.5% for nirS, 92.3% for nirK, 89.9% for nosZ, and 91.6% for 16S rRNA.
454-Pyrosequencing
The community structure, richness, and diversity of organisms harboring 16S rRNA, nirS, nirK, and nosZ genes were studied using 454-pyrosequencing. This analysis was done from eight profundal samples, including early summer, mid-summer, and autumn samples from Ormajärvi, early-summer and autumn samples from Suolijärvi and Lehee and autumn sample from Pääjärvi (Supplementary Table S1). PCR was conducted with primer pairs 27F/519R (Lane, 1991 and Turner et al., 1999) for 16S rRNA, nirScd3aF/nirSR3cd (Kandeler et al., 2006) for nirS, F1aCu/R3Cu (Hallin and Lindgren, 1999) for nirK and nosZF/nosZ1622R (Kloos et al., 2001 and Throbäck et al., 2004) for nosZ. In the PCR reaction, 2 μl of nucleic acid extract (∼10 ng) was used as a template in a 23 μl PCR mixture containing 0.2 mM of dNTPs, 0.3 μM of each primer, 1x Biotools reaction buffer, 0.6 mg ml-1 BSA and 0.6 U Biotools polymerase. PCR amplification was performed in a C1000 Touch Thermal Cycler (Bio-Rad Laboratories) with an initial denaturation step at 95°C for 5 min and 35 cycles of amplification (94°C for 30 s, 53°C for 1 min, 72°C for 3 min). Barcodes that were five-base long were incorporated between the 454-Titanium adapter and the forward (nirS, nirK, and nosZ) or reverse (16S rRNA gene) primer to distinguish each sample in the mixed reaction. PCR products were purified with Agencourt AMPure XP purification system (Beckman Coulter, Danvers, MA, USA). PCR was done from three replicate samples (three replicate sampling cores) from each sampling event and PCR products of the replicates were pooled in equal amounts before sequencing. Finally, eight samples per each gene were sequenced (Supplementary Table S1). Sequencing was done with Titanium chemistry using a 454 GS-FLX system (454 Life Sciences, Branford, CT, USA) at the Institute of Biotechnology hosted by Helsinki University.
Barcodes and primer sequences, as well as sequences containing ambiguous nucleotides and homopolymers longer than eight nucleotides were removed from all 454 – pyrosequencing libraries using Mothur (Schloss et al., 2009). 16S rRNA gene sequences (average length = 259 bp) were de-noised with the PyroNoise – tool (Quince et al., 2009) and assigned taxonomies with the naïve Bayesian classifier – tool (based on Greengenes taxonomy, bootstrap value cut off = 80%; Wang et al., 2007) in Mothur. Sequences classified as archaea, chloroplast, mitochondria, and eukaryota were removed. Furthermore, chimeric sequences, denoted using Mothur’s implementation of Uchime (Edgar et al., 2011), were removed. Finally, 16S rRNA gene sequences were aligned in Mothur using Silva reference alignment. Protein-coding (nirS, nirK, and nosZ) nucleotide sequences were edited to a fixed length of 285 bp and translated into amino acid sequences, and sequences with ambiguous amino acid residues and stop codons were removed. Amino acid sequences were aligned using HMMER3 – aligner tool at FunGene (Functional gene pipeline and repository) website1 Sequences that were partially or completely unaligned were removed, and random samples of these unaligned sequences were compared to databases using blastp (Altschul et al., 1997) to assure that they did not represent real nirS/nirK/nosZ sequences. Subsequently, sequences were realigned. The respective nucleic acid sequences were checked and cleared for chimeras as explained above for 16S rRNA gene analysis. After this polishing, the final dataset contained a total of 14689, 6556, 6815, and 4735 sequences of 16S rRNA, nirS, nirK, and nosZ gene amplicons, respectively, corresponding to 346–2906 sequences per sample for each gene.
16S rRNA gene sequences were clustered (average neighbor method) into OTUs at the 97% similarity level and OTUs were assigned consensus taxonomies (Greengenes taxonomy, cutoff = 80%) in Mothur. For nirS, nirK, and nosZ, protein distance matrix (positions with gaps excluded, Kimura’s method of multiple substitutions) was calculated in ClustalX 2.0.12 (Larkin et al., 2007) and was used to cluster (average neighbor method) amino acid sequences into OTUs at the 90% similarity level in Mothur. In addition, Mothur was used to calculate number of OTUs, diversity (inverted Simpson’s diversity index), richness (Chao 1 richness estimate) and coverage (Good’s coverage), an estimate of the proportion of amplified gene amplicons represented by sequence libraries for each sample. To account for the effect of variable library sizes (variable number of sequences), these values were calculated as averages from 10000 subsamples sampled to the size of the smallest sample, which was 413, 346, and 377 sequences for nirS, nirK, and nosZ, respectively. To remove the possible effect of rare OTUs in multivariate analyses (see section Statistical analysis), OTUs with ≤8 sequences were removed (thus those OTUs with on average less than 1 sequence per sample were filtered out), leading to removal of 4, 6, and 3% of sequences and 58, 72, and 68% of OTUs for nirK, nirS, and nosZ, respectively, followed by subsampling of each sample to the size of the smallest sample. Nucleotide sequences of nirS, nirK, and nosZ genes were assigned taxonomies by finding the best hit from in-house databases using kmer searching in Mothur. Retrieval of sequences for these databases were done from EMBLALL-database (via SRS-server LION2) using search query “description = gene name (i.e., nirS, nirK, or nosZ) BUTNOT un,” which excluded hits from uncultured and unidentified microbes, followed by manual selection to remove duplicate sequences. Thereafter, OTUs were assigned to consensus taxonomies using Mothur (cutoff = 60%). OTUs with relative abundance >1% was used to draw a network with, where the lakes and OTUs were clustered using the spring-embedded algorithm implemented in the Cytoscape3 (version 3.2) (Saito et al., 2012). Seasonal changes in the core nirS, nirK, and nosZ OTUs in lake Ormajärvi was visualized with SigmaPlot Version 12.5. The qPCR data was used to calculate the proportion of core OTUs (nirS, nirK, and nosZ) of the whole bacterial community: qPCR abundance × OTU relative abundance. The 454-pyrosequencing data was deposited to the NCBI’s Sequence Read Archive (Accession number: Bioproject PRJNA268909 and PRJNA282004).
Statistical Analysis
Correlations among environmental parameters, denitrification rates, functional gene abundances, combined qPCR × OTU relative abundance, inverted Simpson’s index, Chao1 richness estimate and the number of sequences in the dominant OTUs (OTUs with relative abundance >4% across all libraries) were analyzed using Spearman’s rank correlation in PASW 18.0 (PASW Statistics 18, Release Version 18.0.0, SPSS 2009). The seasonal changes in nirS/nirK ratio in Ormajärvi were analyzed with Kruskal–Wallis one-way analysis of variance with PASW 18.0. Multivariate analyses of the nirS, nirK, and nosZ community structure were based on Bray–Curtis dissimilarities calculated among samples using number of sequences in OTUs. The data was assessed graphically using non-metric multidimensional scaling (NMS) constrained to 2 ordination axes. Furthermore, UPGMA – clustering with bootstrapping (1000 replicates) was done to validate the differences among samples. The relationship between community structure and environmental factors was analyzed using a distance-based linear model (DISTLM) procedure (Anderson, 2001; McArdle and Anderson, 2001). The relationship between community structure (Bray–Curtis distances) and denitrification rates (Euclidean distances) was studied using Mantel’s test. Variables correlating significantly with the community structure were then separately correlated (Pearson) with both of the NMS axes, and the R2 values of these correlations were displayed as vectors radiating from the center of the plot (McCune and Grace, 2002). NMS and Mantel’s test were performed using PC-ORD version 6.0 (PC-ORD. Multivariate analysis of ecological data. MjM Software, Gleneden Beach, Oregon, USA; McCune and Mefford, 2011), UPGMA – clustering was done using PAST version 3.06 (Hammer et al., 2001) and DISTLM was conducted using FORTRAN program by Anderson (2004).
Results
Inter-Lake Scale
Quantitative PCR analysis showed that nirS, nirK, and nosZ were present at all sampling sites and at every time point (varying between 4.3–8.2, 2.6–9.5, and 1.7–5.1% relative to 16S rRNA, respectively), nirS or nirK being the most abundant and nosZ the least abundant at all sampling sites. The highest abundances of each gene were observed in Pääjärvi during the summer season (nirS 8.2, nirK 9.5, and nosZ 5.1% relative to 16S rRNA; Figure 1), when the highest nitrate concentration was measured (76.02 μmol l-1, Supplementary Table S1). The nirS and nosZ gene abundances correlated positively with nitrate concentration in the water above the sediment. There was a negative correlation between porosity and the abundance of all genes, and between LOI and nirS and nosZ gene abundances (Table 1). The nirS/nirK ratio was on average 1.3 (±0.5). Thus, nirS was slightly more abundant than nirK in our study lakes. Although the total denitrification rates (Den) and gene abundances were uncoupled, denitrification of the overlying water NO3- (Dw) correlated with the nirS/nirK ratio and coupled nitrification–denitrification (Dn) was higher with increased nirS and nosZ abundances (Table 1; Figure 1).
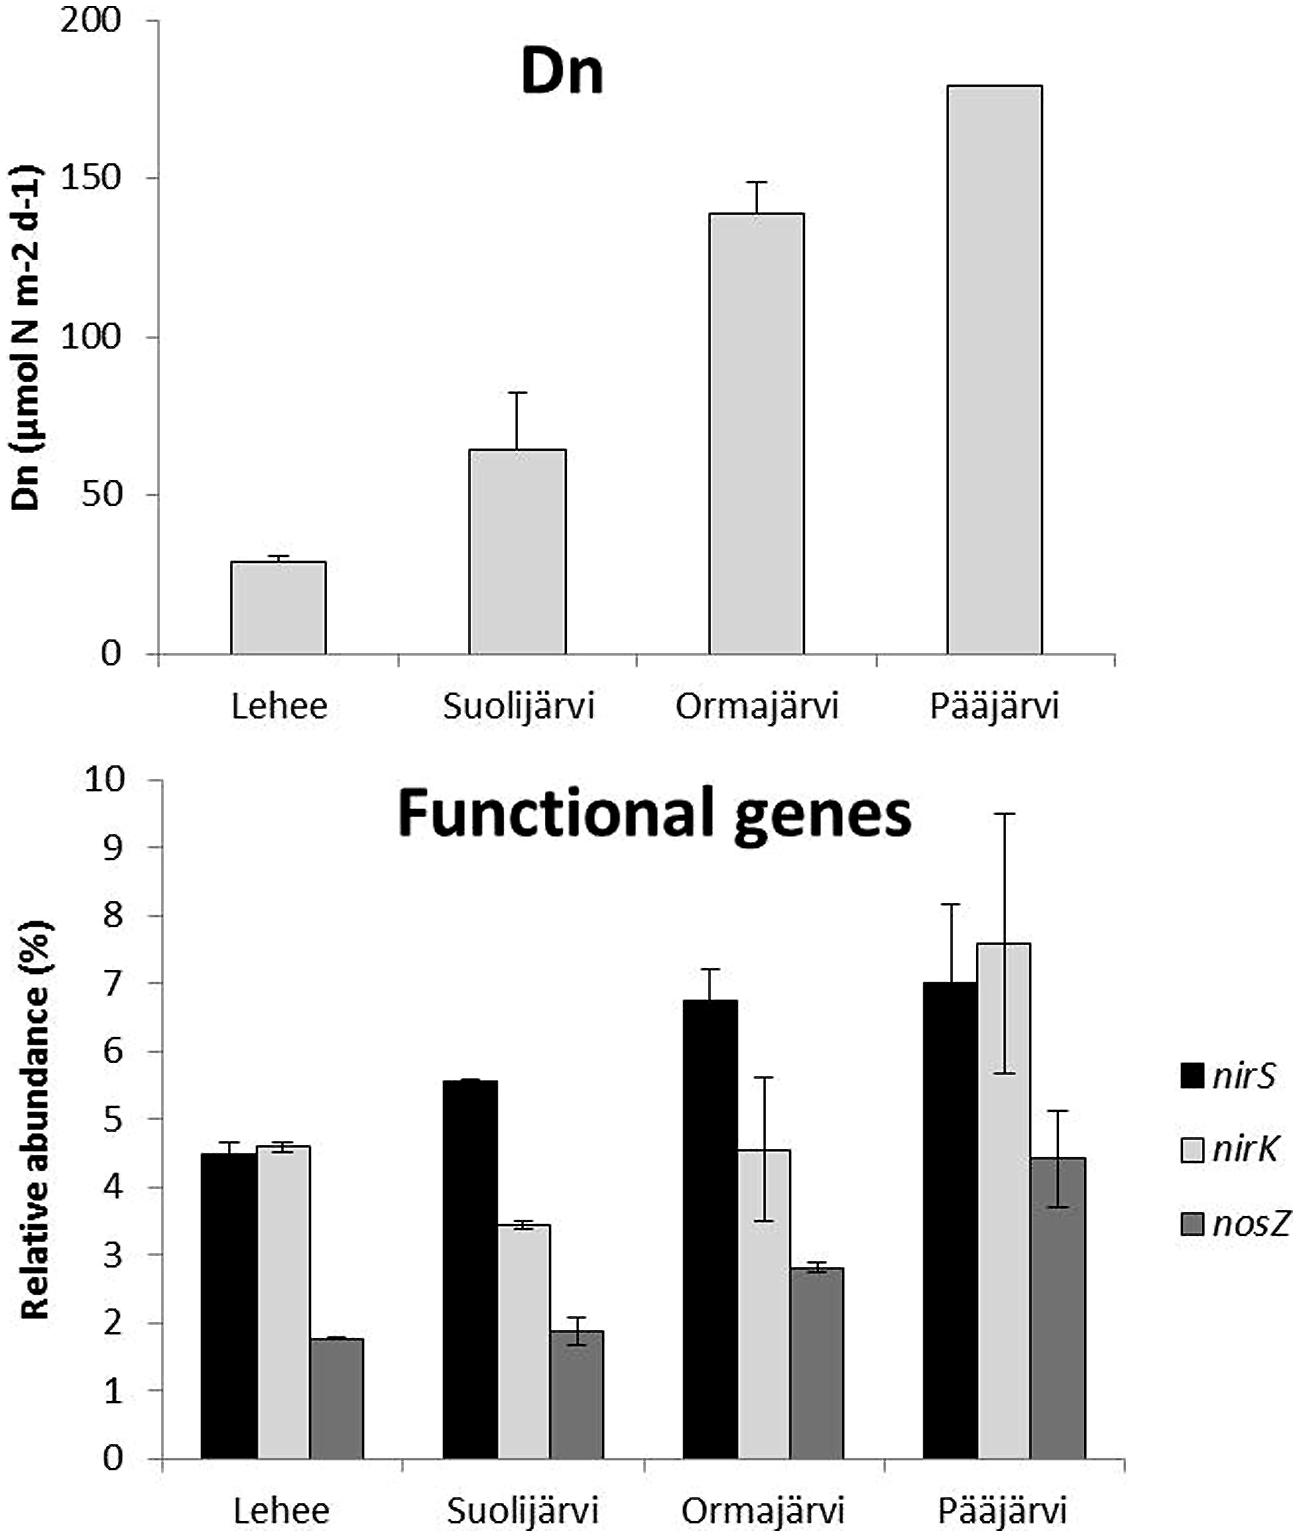
FIGURE 1. Natural coupled nitrification–denitrification process rates (Dn) and average relative abundance of nirS, nirK, and nosZ genes (% of the total 16S rRNA gene abundance) in profundal sediments of four study lakes (n = 2 for Lehee, Suolijärvi, and, Pääjärvi and n = 3 for Ormajärvi).
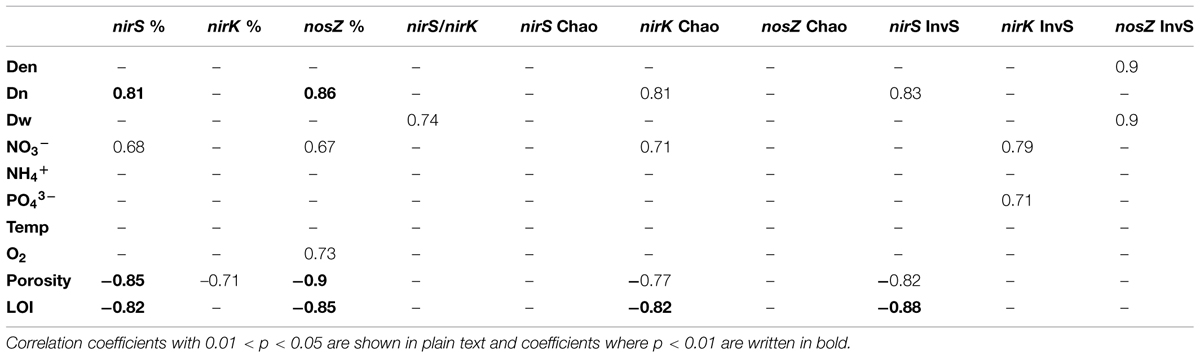
TABLE 1. Correlations of functional gene relative abundances (% of total 16S rRNA), inverted Simpson’s diversity index, Chao1 richness estimator with environmental parameters and measured denitrification rates (Den, total denitrification, Dn, coupled nitrification–denitrification, Dw, denitrification of the NO3- of sediment overlying water) in the inter-lake dataset (n = 9).
Altogether, there were 388, 435, and 147 OTUs (at 90% sequence similarity level) in nirS, nirK, and nosZ libraries, respectively. Good’s coverage values, 0.91–0.95, 0.92–1.00, and 0.96–0.98, for nirS, nirK, and nosZ, respectively, indicated that the libraries were adequately large. Inverted Simpson’s diversity index values varied between 9.2–14.3, 5.3–20.0, and 2.5–4.6 for nirS, nirK, and nosZ, respectively. Chao richness estimates varied between 81.5–142.9, 28.0–94.5, and 27.0–64.1 for nirS, nirK, and nosZ, respectively. The nirK diversity was positively correlated with nitrate and phosphate concentrations and nirS diversity was positively correlated with Dn and negatively correlated with sediment LOI and porosity (Table 1). Correlation between total denitrification rates and gene diversities was only seen with nosZ (Table 1). NirK richness correlated positively with nitrate and Dn, and negatively with porosity and LOI, no other correlations among environmental factors and richness were seen (Table 1).
As visualized by the NMS analysis (Figure 2), nirS, nirK, and nosZ communities of the study lakes were distinct. The NMS axis1 explained most of the variation in all nirS, nirK, and nosZ communities (94.8, 84.8, and 68.6%, respectively; Figure 2). The highest disparity was between denitrifier communities in Pääjärvi and Lehee, which had the highest and lowest nitrate concentrations measured (Figure 2, Supplementary Table S1, Supplementary Figure S2). Bootstrapped cluster analysis also suggested significant differences in denitrifier communities among lakes (Supplementary Figure S2). Of the process measures only coupled nitrification–denitrification (Dn) was correlated with the community structures of each nirS-, nirK-, and nosZ-containing communities (Mantel’s test: r = 0.71 and p = 0.002, r = 0.57 and p = 0.001, r = 0.83 and p = 0.001, respectively). The environmental factors that correlated with community structures were nitrate concentration, porosity and LOI for all genes and phosphate for nirK (Figure 2). Environmental parameters affected the NMS community dispersion in the same direction for all genes, with nitrate and Dn affecting in the opposite direction compared to LOI and porosity (Figure 2). Overall the pattern for all three genes is quite similar. In addition, there was high negative inter-correlation between nitrate concentrations and LOI (r = -0.76 and p = 0.02) and positive correlation between LOI and porosity (r = 0.91 and p = 0.002).
FIGURE 2. Non-metric multidimensional scaling (NMS) analysis of environmental factors affecting denitrifier communities in the inter-lake study. Variables correlating significantly (p < 0.05) with community structure in DISTLM (environmental factors) or Mantel’s test analysis (process rates) are shown by the vectors.
Abundant OTUs (>1% of sequences) were mostly shared among lakes (Figure 3). There was only one nirK OTU that was unique to Pääjärvi and one nirS OTU that was unique to Ormajärvi, while all other OTUs were found in at least two lakes (Figure 3). OTU based network analysis showed that lakes Ormajärvi, Suolijärvi, and Lehee had more similar communities and shared more OTUs compared to Pääjärvi (Figure 3), which can be partly explained by the fact that those three lakes form a connected lake chain. In addition, some OTUs were found only in Pääjärvi and Ormajärvi, where higher nitrate concentrations were found (Figure 3).
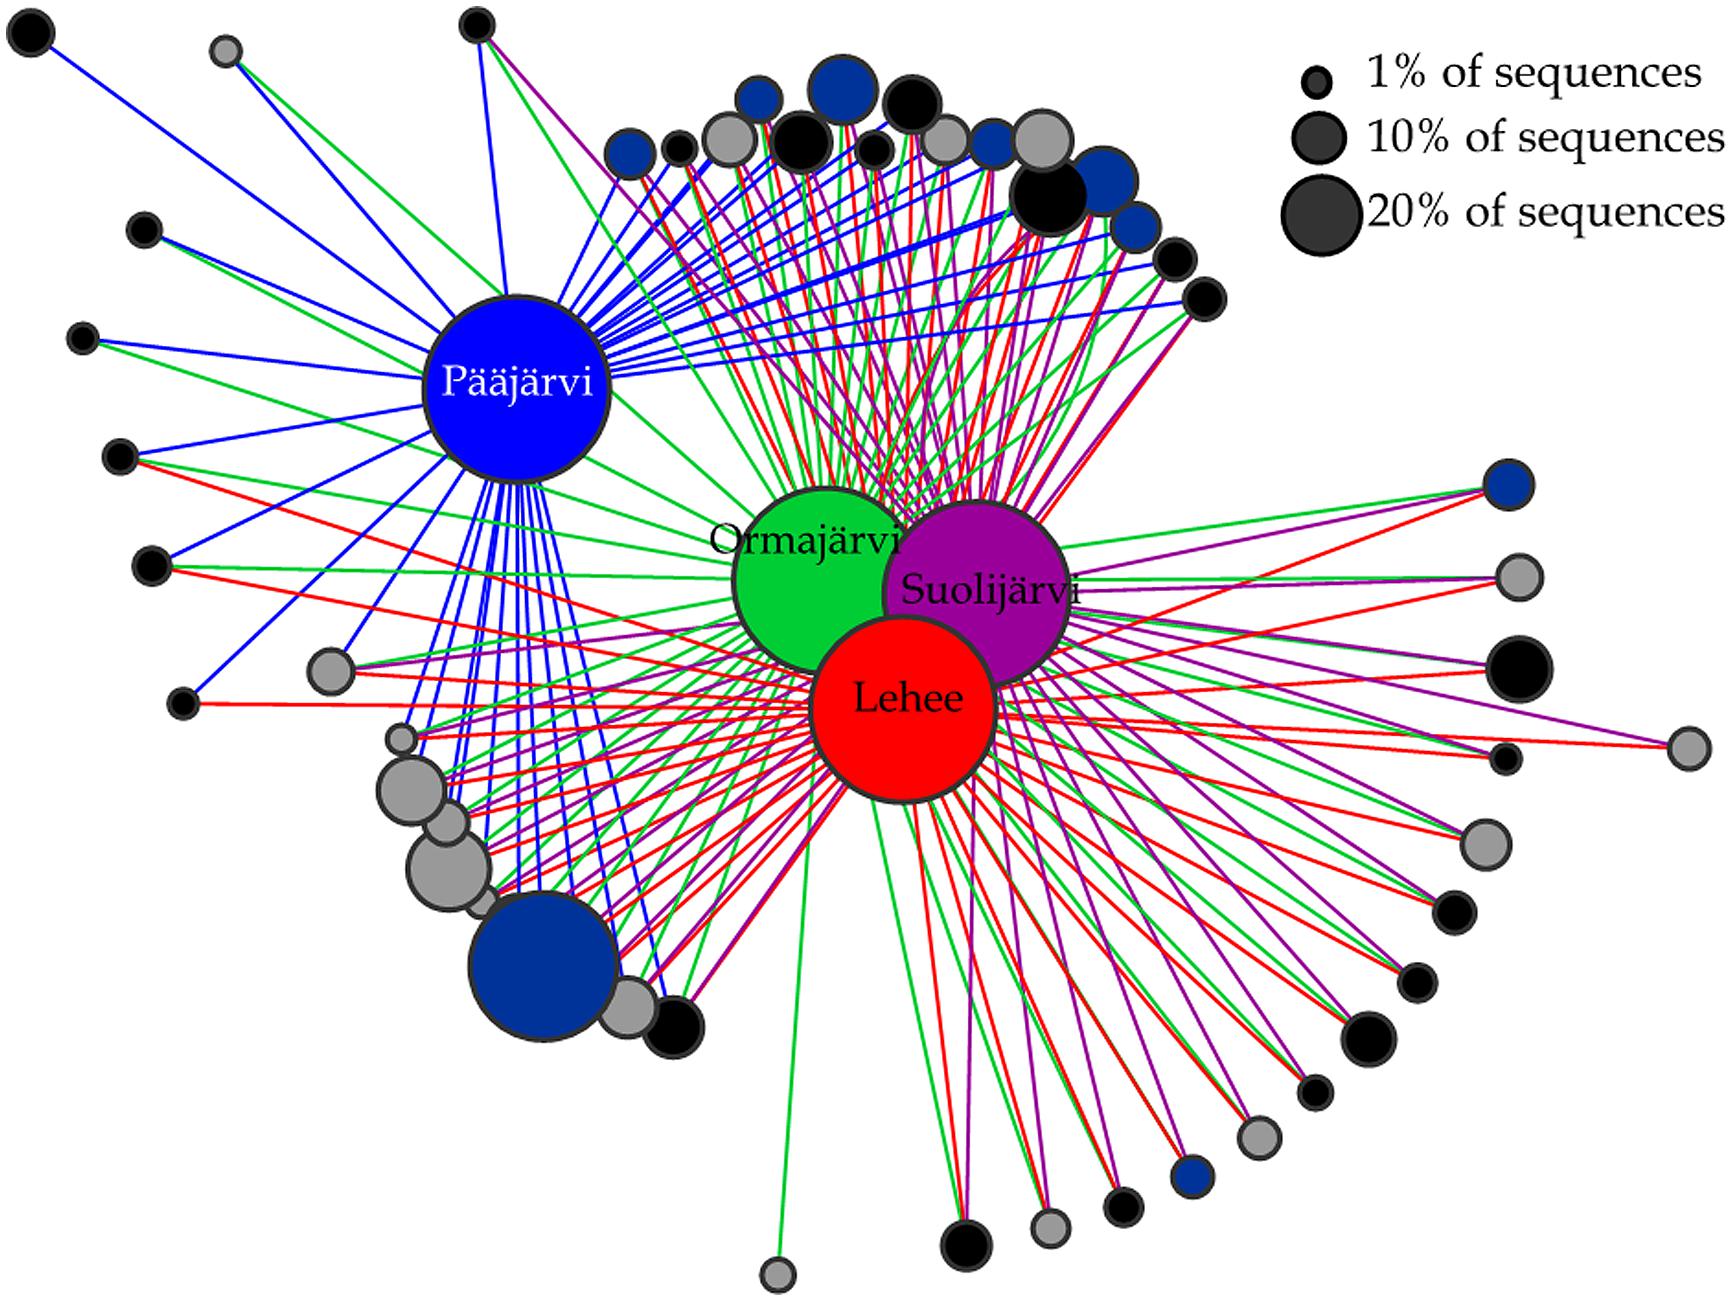
FIGURE 3. Operational taxonomical unit (OTU)-based network analysis of nirS (black circles), nirK (gray circles), and nosZ (dark blue circles) sequences from lakes Pääjärvi, Ormajärvi, Suolijärvi, and Lehee. OTUs comprising more than 1% frequency are included in the figure. Node size corresponds to the relative abundance of OTUs.
The dominant core OTUs (with higher than 4% frequency) for nirS, nirK, and nosZ included only 6, 7, and 3 OTUs, while covering 57.5, 61.0, and 77.4% of all nirS, nirK, and nosZ sequences, respectively (Supplementary Table S2). Combined qPCR proportions and OTU relative abundances showed that the abundance of these core OTUs was 0.12–1.1% when compared to 16S rRNA gene abundance in the sediment samples (Supplementary Table S2). All 6 core nirS OTUs matched Betaproteobacteria order Burkholderiales, genus Rubrivivax sequences with 67–99% confidence level (Figure 4, Supplementary Table S2). Genus Rubrivivax was also the closest match for most of the dominant nirS OTUs that had 1–4% frequency. All the core nirK OTUs and all OTUs with >1% frequency matched sequences of Alphaproteobacteria order Rhizobiales, genus Ochrobactrum with a confirmed 100% confidence level (Figure 4, Supplementary Table S2). The three core nosZ OTUs belonged to Betaproteobacteria order Burkholderiales (genus Achromobacter but only 67% confidence level, 53.0% of sequences) and to Alphaproteobacteria order Rhizobiales (genus Ochrobactrum, 12.8%) and Rhodospirillales (genus Azospirillum, 11.6%; Figure 4, Supplementary Table S2). The core OTUs of nirS, nirK, and nosZ showed different correlations patterns where nitrate and sediment properties LOI and porosity were found to be important (Supplementary Table S2). From the process rate measurements only coupled nitrification–denitrification showed strong positive correlation with one nirS OTU assigned to Burkholderiales and nosZ OTU belonging to Rhodospirillales (Supplementary Table S2). The combined qPCR abundance × OTU relative abundance data showed somewhat similar correlations as the relative core OTU data (Supplementary Table S3). Overall, it is interesting that phosphate correlated only with nirK OTUs, both when observing core OTUs and the combined qPCR × OTU data, and not with any nirS or nosZ OTUs (Supplementary Tables S2 and S3).
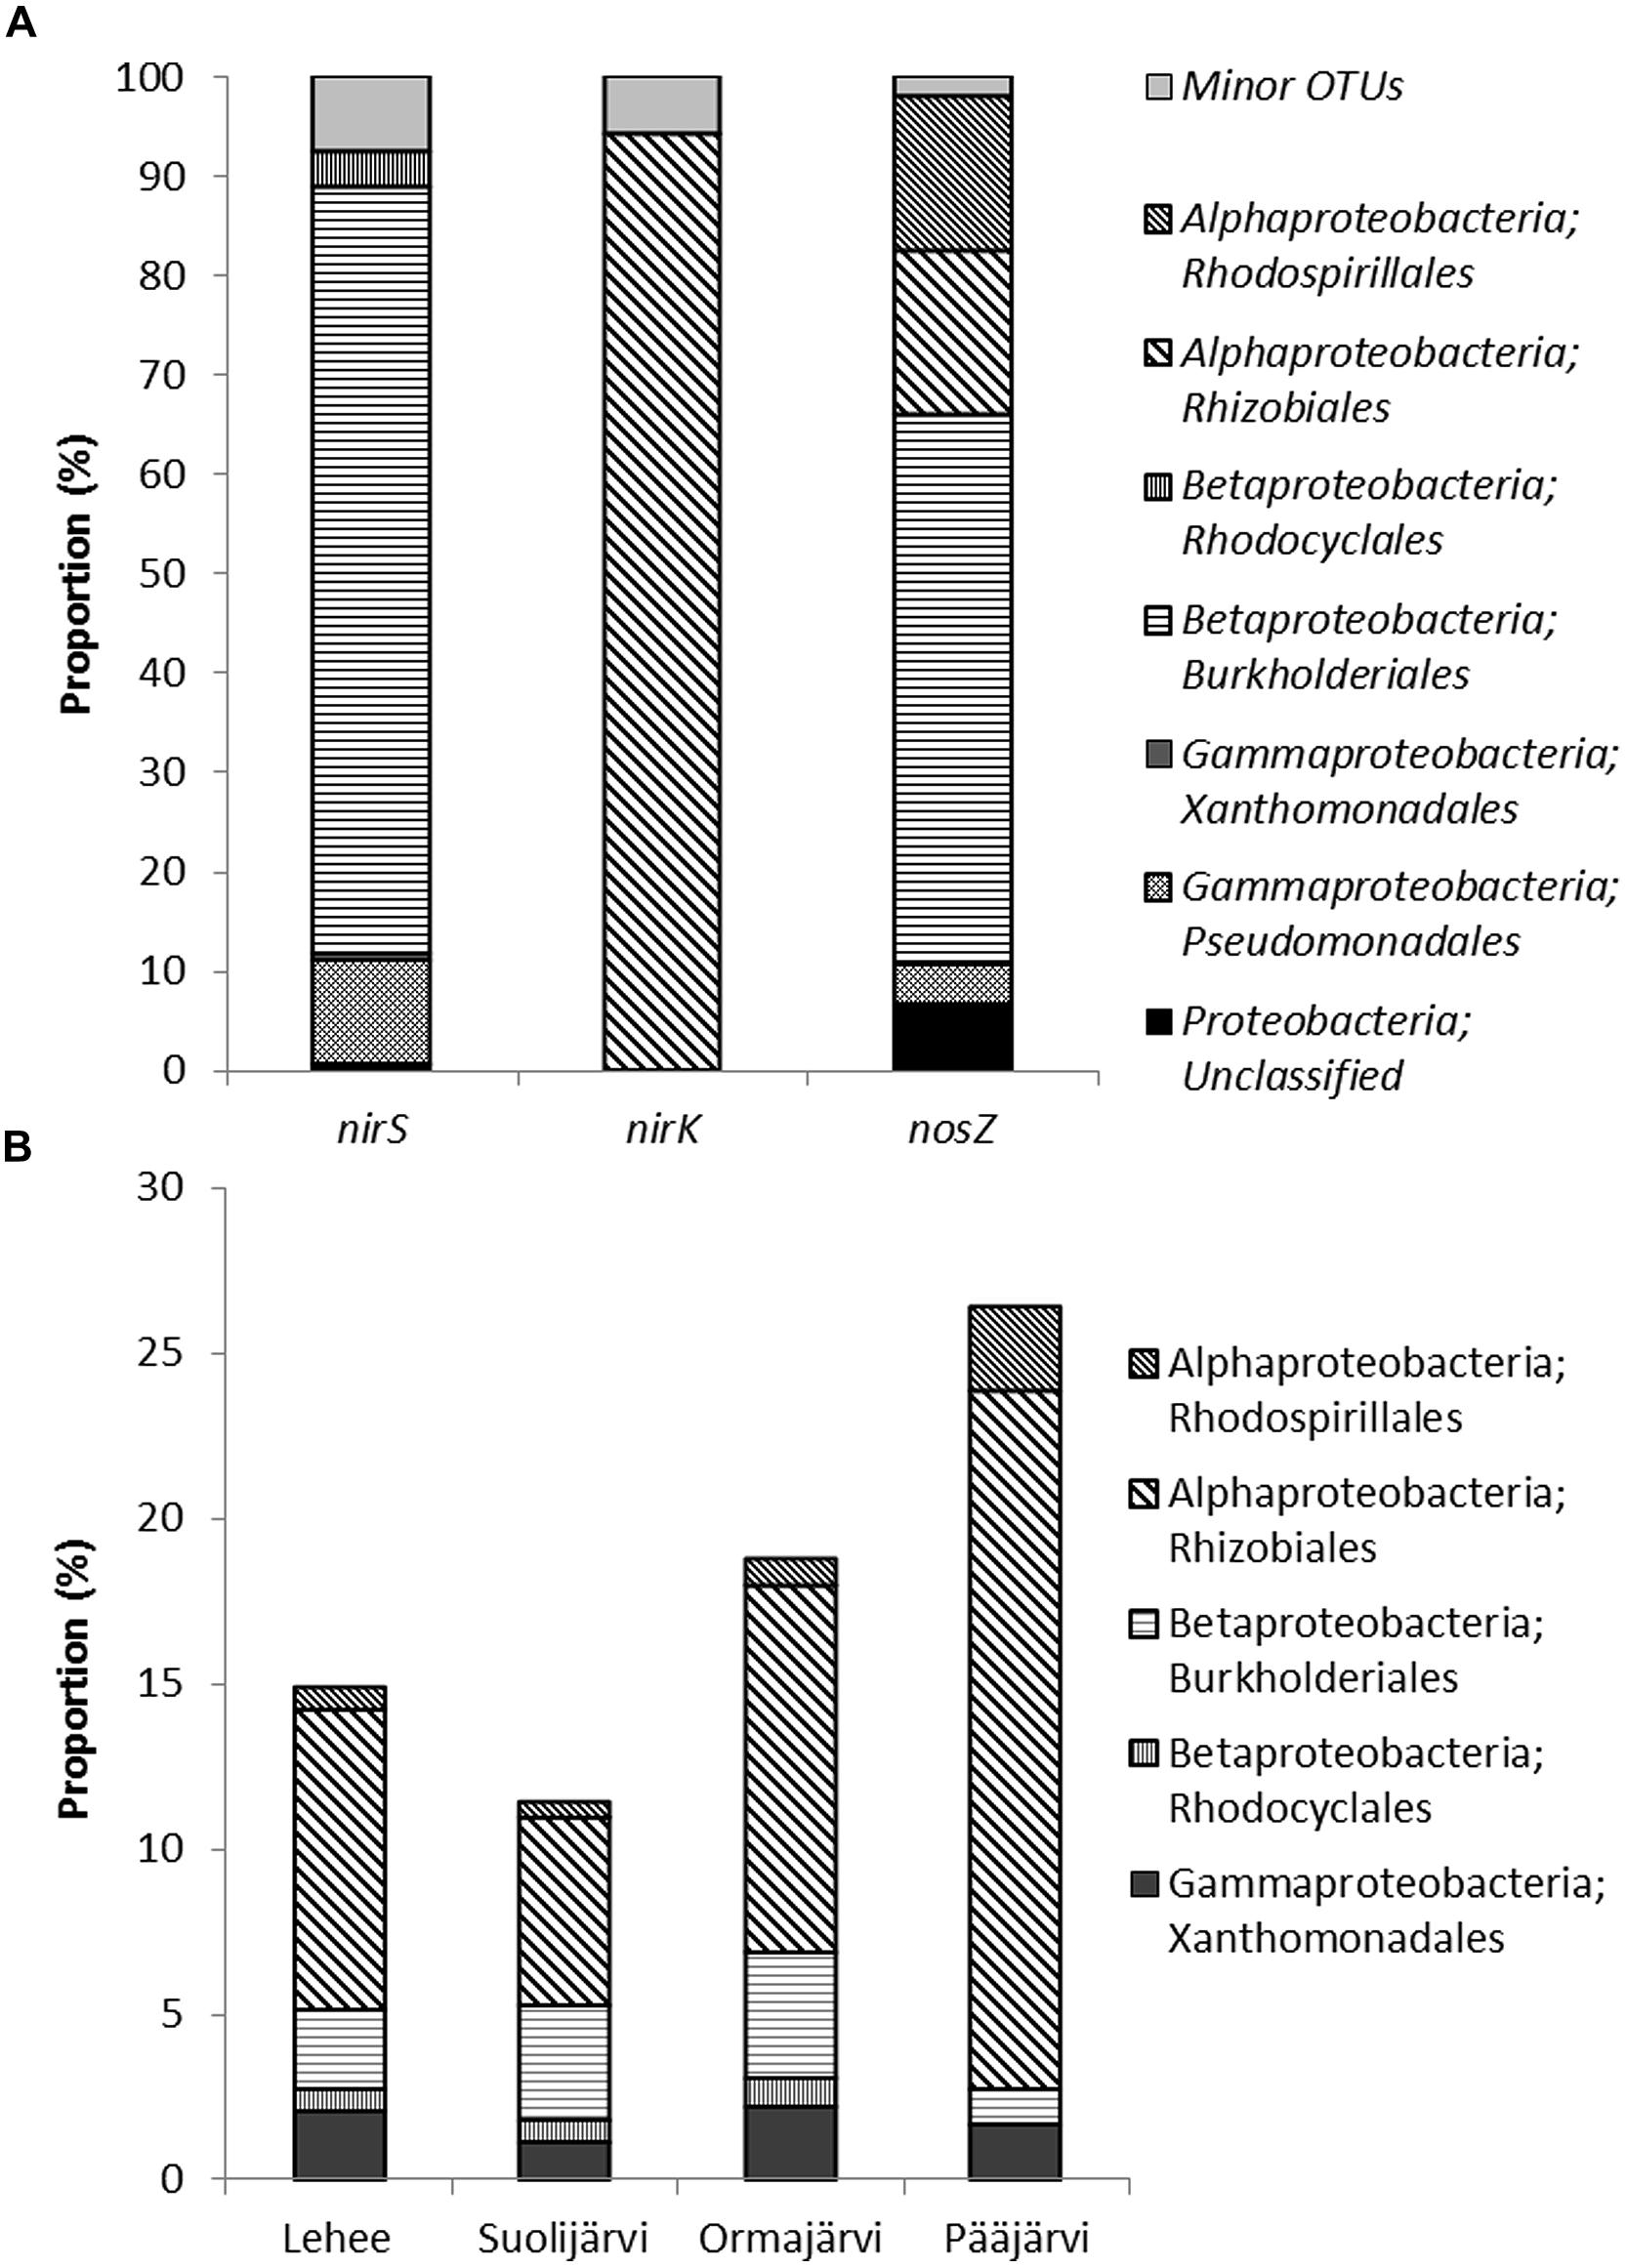
FIGURE 4. Assignment of nirS, nirK, and nosZ sequences (OTUs that comprise more than 1% of sequences) to taxonomic groups (A), and the proportion of these groups in the 16S rRNA data set (B) from the 454-pyrosequencing of 8 lake sediment samples. Minor OTUs in (A) are OTUs that comprise less than 1 % of sequences.
The sediment 16S rRNA based phylogenetic classification showed that the sediment microbial communities were dominated by Proteobacteria (33–39% of all sequences). The other main phylogenetic groups were Chloroflexi (21–24% of all sequences), Actinobacteria (9–14%), Nitrospirae (8-12 %), Acidobacteria (4–6%), Verrucomicrobia (3–4%), Gemmatimonadetes (1–2%), and Bacteroidetes (1–3%), (Supplementary Figure S1). The same orders of Alpha- and Betaproteobacteria were found as was based on the functional gene classification (Figure 4, Supplementary Figure S1) in all four study lakes. On average the order Rhizobiales covered 11% of the 16S rRNA community (Figure 4) and the calculated proportion of denitrifying Rhizobiales was 2.9% (calculated from the combined qPCR*OTU abundance). The order Burkholderiales was only covering on average 2.7% of the 16S rRNA community, whereas the calculated proportion of denitrifiers was higher 3.8%.
Lake Ormajärvi Depth Transect
Average relative abundances of nirS, nirK, and nosZ were 7.9% (±2.2%), 5.7% (±2.8%), and 2.8% (±0.9%), respectively, following a similar pattern as found at the inter-lake scale, with nirS slightly more abundant than nirK, and nosZ being least abundant in all samples (Supplementary Figure S3). NirS, nirK, and nosZ abundances correlated positively with nitrate (r = 0.44 and p = 0.007, r = 0.36 and p = 0.034, and r = 0.66 and p < 0.001, respectively). In addition, nirS and nosZ had a negative correlation with temperature (r = -0.44 and p = 0.007 and r = -0.49 and p = 0.002, respectively) and nosZ gene abundances further correlated positively with LOI and porosity (r = 0.51 and p = 0.002 and r = 0.48 and p = 0.003, respectively). At the intra-lake scale, we could not see any correlation between measured process rates and gene abundances (p > 0.05).
Along the depth transect in Lake Ormajärvi, the nirS/nirK ratio decreased as autumn and winter approached (Supplementary Figure S4). This stemmed from the increase in relative abundance of nirK, whereas the proportion of nirS remained stable. Environmental parameters were not linked to the changes in the nirS/nirK ratio (Spearman correlations, p > 0.05), but season was shown to be an important factor affecting this ratio (Kruskal–Wallis H = 16.16 and p = 0.001). In the pairwise comparisons, the early summer nirS/nirK ratio differed significantly from autumn and winter ratios (p = 0.004 and p = 0.01, respectively). When studying the seasonal effect at different depths, season correlated with the nirS/nirK ratio at the Littoral 1 m site and at the Profundal 8 m site (H = 9.97 and p = 0.019, H = 9.67 and p = 0.027, respectively), whereas the deep Littoral (3 m) site did not show the same pattern in the nirS/nirK ratio (Supplementary Figure S4). The community composition did not differ between seasons at the Profundal 8 m site (Figure 5), but the OTUs (more abundant than 0.5% of all sequences) of nirS, nirK, and nosZ were observed at all times (early-summer, mid-summer, and autumn). However, none of the OTUs were present only during early-summer and autumn, whereas some OTUs were only detected in early- and mid-summer, or at mid-summer and autumn (Figure 5).
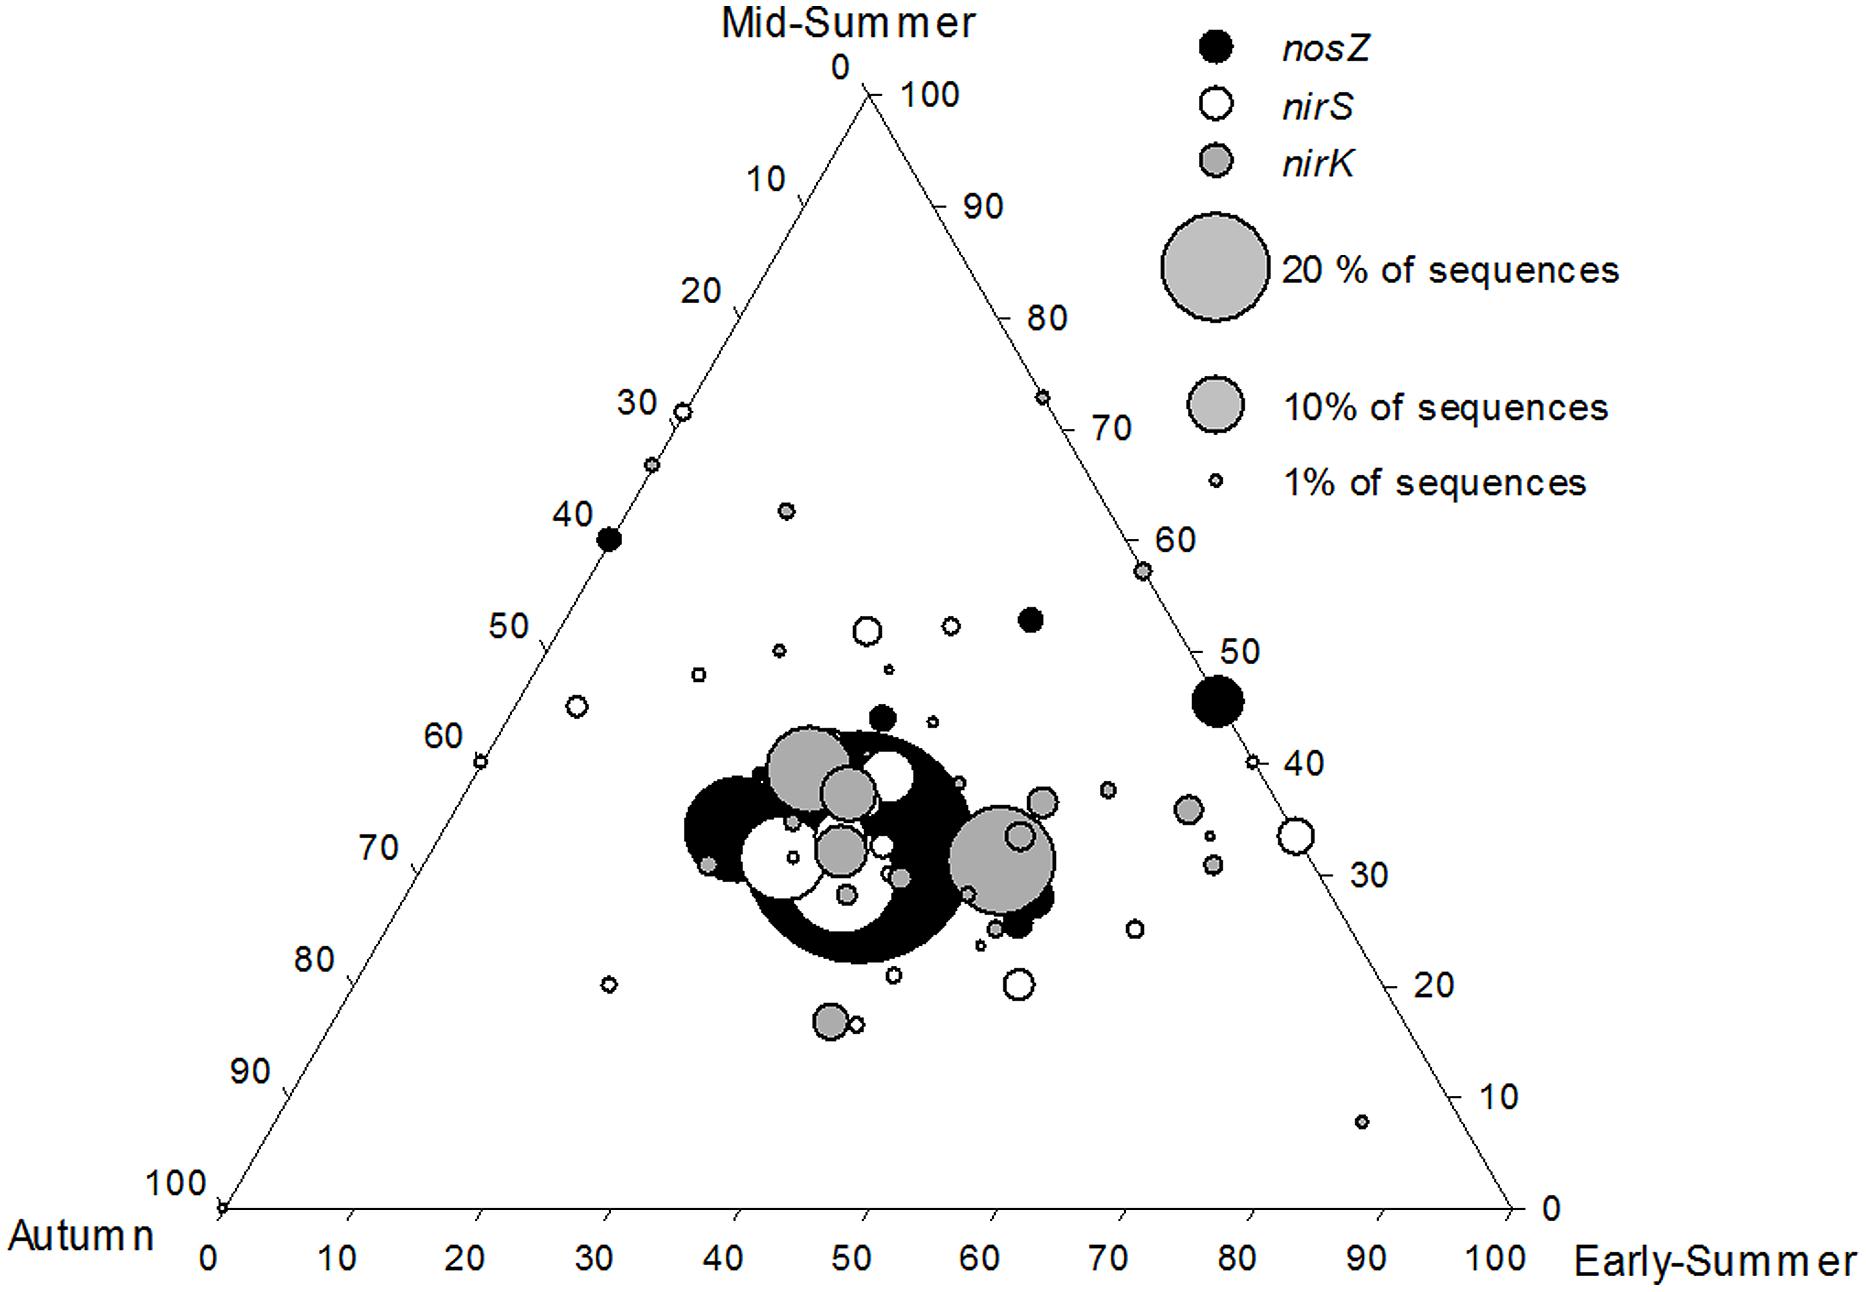
FIGURE 5. Ternary plot showing that core nirS, nirK, and nosZ OTUs were equally abundant during the three seasons (early-summer, mid-summer, and autumn) at the profundal site (8 m) of Lake Ormajärvi, placing OTU symbols in the middle of the plot. OTUs comprising more than 1% frequency are included. Node size corresponds to the relative abundance of OTUs.
Discussion
Freshwater sediments account for about 20% of total global denitrification (Seitzinger et al., 2006), with this process mainly taking place below the oxic–anoxic interface. Our earlier study with the IPT technique showed a tight connection between hypolimnetic nitrate concentration and total denitrification (Den) in sediment, as well as a relationship between nitrate and the two components of denitrification (Dn and Dw) in boreal lake ecosystems (Rissanen et al., 2013). The results of this study showed that nitrate concentration and coupled nitrification–denitrification were also connected to the relative abundance (nirS and nosZ), beta-diversity (nirS, nirK, and nosZ) and richness (nirK) of denitrifiers. However, against our hypothesis, the total denitrification rate could not be predicted by the abundance or community structure of denitrifiers.
The two functionally equivalent nitrite reductases (nirS and nirK) have different responses to environmental factors (Junier et al., 2008; Jones and Hallin, 2010), which was also seen in some small differences in our dataset. Phosphate concentrations were negatively correlated with nirK OTUs, whereas the nitrate concentration could only explain the nirS gene abundance. Earlier reported oxygen control on nirS and nirK, where nirS is thought to favor lower redox conditions (Tatariw et al., 2013) was not observed here. In our lake sediments, nirS was slightly more abundant than nirK (the nirS/nirK ratio was 1.3) and the relative abundance of these genes was at the same level as reported in previous studies (Ducey et al., 2011; Saarenheimo et al., 2015). However, the relative abundance of denitrifying genes may be higher, as prokaryotes can have more than one 16S rRNA operons, as many as 15 copies (Klappenbach et al., 2001). These numbers are comparable to the relative abundances reported, for example, in an anaerobic wastewater lagoon (1.3% for nirS, 5.3% for nirK and 0.3% for nosZ gene) by Ducey et al. (2011). Here and elsewhere, reported nosZ genes have been lower than the sum of nirS and nirK, but it has to be remembered that traditional nosZ primers may cover only part of the nosZ populations. Recent studies have revealed a new nosZ clade, which is not amplified with traditional primers (Sanford et al., 2012; Jones et al., 2013). We recently elucidated the role of this new nosZ clade in lake sediments (Saarenheimo et al., 2015) and it is not in the scope of this study.
Sediment properties (LOI and porosity) were negatively correlated with the relative abundance of functional genes (especially nirS and nosZ) and affected the structure of the microbial communities, which is consistent with results from the Jiazhou Bay (China) sediment study, in which silt content shaped nirS communities (Dang et al., 2009). The negative correlation between LOI of sediment and NO3- concentration of the overlying water suggests that in lakes with lower LOI, higher mineral matter content may promote nitrification, which releases NO3- to the overlying water and promotes denitrification as well as certain nirS and nosZ communities. The abundance of denitrifying populations (nirS and nosZ genes) also correlated with coupled nitrification–denitrification (Dn), which is actually the dominating component of denitrification in boreal lakes, where nitrate concentrations in the overlying water are relatively low (Rissanen et al., 2013). A tight correlation between nitrification and denitrification has been suggested by Seitzinger et al. (2006), and was further supported by the coupling between nir genes and amoA genes (responsible for nitrification) in epilithic biofilms (Vila-Costa et al., 2014). In addition the relatively high proportion of genus Nitrospira in the sediment sequences, which is connected to nitrite–oxidation step in nitrification (Bock and Koops, 1992), further supports the findings and indicates the importance for further studies on understanding the role of nitrification in boreal lake sediment.
As hypothesized, denitrifier community consisted dominantly by a low number of core nir and nos OTUs. This suggests that denitrification was actually driven by a selected group of bacteria, which was shared between the study lakes, even though nitrate and oxygen concentrations varied. The same core denitrifier groups were found at different lakes and seasons indicating that the process can be driven by only a few proteobacterial groups. However, the total nirS, nirK, and nosZ communities were distinct in each lake, suggesting that the less-dominant OTUs were spatially unique, as has previously been shown in aquatic ecosystems (Junier et al., 2008; Kim et al., 2011). This may indicate that less abundant OTUs were more affected by nitrate concentrations and sediment properties, which modified community patterns in each lake. Geographic location and water quality played a role, as physically connected lake systems had more similar communities. A fertilization study in a salt marsh also showed that higher nutrient concentrations can increase the number of unique denitrifier OTUs (Bowen et al., 2013).
The results of the main phylogenetic groups found from the boreal lake sediments are in concurrence with previous findings from lake sediments (13 lakes in China; Zhang et al., 2015) and from lake water column (69 published studies across different continents; Newton et al., 2011), where in addition to Nitrospira other main groups were Proteobacteria, Chloroflexi, and Actinobacteria. The most abundant nirS, nirK, and nosZ sequences all matched sequences of the phylum Proteobacteria. These taxonomic divisions followed the same patterns that have been previously reported for denitrifiers (Jones et al., 2008; Vila-Costa et al., 2014), where the most abundant nirS sequences matched Betaproteobacteria and all of the most abundant nirK sequences matched Alphaproteobacteria. Interestingly, Yoshida et al. (2009) reported that the same microbial orders (nirS – Burkholderiales and Rhodocyclales, nirK – Rhizobiales) found in our study lakes dominate rice paddy field soils. This may either be a general phenomenon or due to the use of the exact same primer pair in the PCR analysis. All core nirS OTUs were closest to sequences of the genus Rubrivivax. Rubrivivax gelatinosum is a facultative photoheterotrophic bacterium harboring both nirS and nosZ genes, but lacking nitrate reductase. Therefore, it can reduce NO2- to N2 gas, but cannot use NO3- as a substrate for the denitrification pathway (Nagashima et al., 2012). Thus, it depends on NO2- supplied by denitrifiers and other NO3- – reducers, which might underlie the positive correlation between NO3- and nirS abundance: with higher availability of NO3-, a relatively higher proportion of NO2- produced in NO3- – reduction could be available. However, NO2- is also produced by nitrifiers (NH4+ – oxidizers), which might underlie the positive correlation between Dn and nirS abundance. All relevant nirK sequences (with >1% frequency) were taxonomically closest to the genus Ochrobactrum, which contains species with both the nitrogen-fixation and denitrification pathways (Lee and Park, 2009). The co-occurrence of denitrification and nitrogen fixation has been previously reported in aquatic systems (Halm et al., 2009; Fernandez et al., 2011).
Many microbes harboring nir genes (especially nirK genes) have truncated denitrification pathways and are, thus, lacking the nosZ gene that is responsible for the last reduction step in denitrification (Jones et al., 2008). Here, the single most abundant nosZ OTU covered 53% of sequences, which would suggest a unique group of nitrous oxide reducers in boreal lakes. This OTU was taxonomically affiliated with Burkholderiales, but to a different group than the dominant nirS sequences. However, organisms carrying dominant nirS and nosZ genes may possibly be the same, despite being split taxonomically, as uncertainties in taxonomic classification and possible horizontal gene transfer complicates the analysis of functional genes (Jones et al., 2008). Furthermore, all the PCR based methods may suffer from primer biases, which we cannot rule out in this study. It was very recently shown that both commonly used nirS and nirK primer pairs selected for this study would underestimate the phenotypic diversity of denitrifiers, especially Gram-positive denitrifiers (Verbaendert et al., 2014), whereas proteobacterial species are favored (Penton et al., 2013; Verbaendert et al., 2014). However, the observed high abundance of denitrifying genes in qPCR and the dominance of Proteobacteria in the 16S rRNA sequence libraries suggest that a substantial proportion of the potential denitrifiers were targeted with the primers selected here. At least, these primers would target the most relevant proteobacterial denitrifiers (Jones et al., 2008; Green et al., 2010), and thus provide a solid foundation for future studies.
Denitrification rates have been shown to vary between different seasons (e.g., Ahlgren et al., 1994; Rissanen et al., 2011) and higher temperatures are known to increase the process rates (Saunders and Kalff, 2001). In our study at the intra-lake scale, gene abundances varied between different seasons. The nirS/nirK ratio was significantly higher during early-summer compared to autumn and winter due to increasing nirK abundance. The opposite temporal abundance patterns was reported in a soil study by Dandie et al. (2008), where the abundance of nirK-carrying denitrifiers declined during the study period from early-summer to autumn. However, in both studies, the actual denitrification rates were mostly controlled by nitrogen availability, and were uncoupled from the denitrifier community abundance. The ternary plot of nirS, nirK, and nosZ communities (Figure 5) shows the seasonal stability in the relative frequencies of core OTUs, indicated by the largest symbols positioned in the middle of the plot. This is in accordance with results of replicated nirK – DGGE data (n = 3 per each season) of the same samples (Rissanen et al., 2011). Thus, the results show that the core community composition remains stable even if the total abundance changes during the season
Conclusion
This study suggests that total denitrification was dependent on short-term environmental factors, as denitrifying genes did not explain the total process rates. However, both the abundance and diversity of denitrifying genes was linked to the mineral content of the sediment, as well as to nitrification–denitrification and further to nitrate concentration in the overlying water. Although potential primer biases and uncertainties in the taxonomic assignment of functional genes complicates interpretation, the dominant nirS, nirK, and nosZ sequences were all assigned to Proteobacteria, consisting of only a few core OTUs that were widely present in the study lakes. Core nirS sequences were affiliated to Rubrivivax, which lacks nitrate reductase and needs external nitrite for denitrification. Whether the lack of upstream genes in some nir populations explains seasonal and spatial distributions of nirS and nirK genes in lake sediments needs to be further studied.
Conflict of Interest Statement
The authors declare that the research was conducted in the absence of any commercial or financial relationships that could be construed as a potential conflict of interest.
Acknowledgments
We want to thank ENSTE graduate school for funding of JS, Lammi Biological Station for providing the sampling facilities, Anne Ojala and Lauri Arvola for taking part in the referred papers, Anna Taskinen for helping with the DNA extractions and Kimmo Mattila for helping with bioinformatics. The work was partially supported by the funding of Maj and Tor Nessling foundation, Academy of Finland projects 260797 and ERC consolidator project Micro-RIP for MT
Supplementary Material
The Supplementary Material for this article can be found online at: http://journal.frontiersin.org/article/10.3389/fmicb.2015.00674
Footnotes
References
Ahlgren, I., Sörensson, F., Waara, T., and Vrede, K. (1994). Nitrogen budgets in relation to microbial transformations in lakes. Ambio 23, 367–377.
Altschul, S. F., Madden, T. L., Schöffer, A. A., Zhang, J., Zhang, Z., Miller, W., et al. (1997). Gapped BLAST and PSI–BLAST:a new generation of protein database search programs. Nucleic Acids Res. 25, 3389–3402. doi: 10.1093/nar/25.17.3389
Anderson, M. J. (2001). A new method for non-parametric multivariate analysis of variance. Aust. Ecol. 26, 32–46.
Anderson, M. J. (2004). DISTLM v.5:a FORTRAN Computer Program to Calculate a Distance Based Multivariate Analysis for a Linear Model. Department of Statistics, University of Auckland, Auckland.
Bock, E., and Koops, H. P. (1992). “The genus Nitrobacter and related genera, p. 2302–2309,” in The Prokaryotes, 2nd Edn, eds A. Balows, H. G. Trüper, M. Dworkin, W. Harder, and K.-H. Schleifer (New York, NY: Springer-Verlag).
Bowen, J. L., Byrnes, J. E. K., Weisman, D., and Colaneri, C. (2013). Functional gene pyrosequencing and network analysis:an approach to examine the response of denitrifying bacteria to increased nitrogen supply in salt marsh sediments. Front. Microbiol. 4:342. doi: 10.3389/fmicb.2013.00342
Cheng, W., Zhang, J., Wang, Z., Wang, M., and Xie, S. (2014). Bacterial communities in sediments of a drinking water reservoir. Ann. Microbiol. 64, 875–878. doi: 10.1007/s13213-013-0712-z
Cuhel, J., Simek, M., Laughlin, R. J., Bru, D., Chéneby, D., Watson, C. J., et al. (2010). Insights into the effect of soil pH on N2O and N2 emissions and denitrifier community size and activity. Appl. Environ. Microbiol. 76, 1870–1878. doi: 10.1128/AEM.02484-09
Dandie, C. E., Burton, D. L., Zebarth, B. J., Henderson, S. L., Trevors, J. T., and Goyer, C. (2008). Changes in bacterial denitrifier community abundance over time in an agricultural field and their relationship with denitrification activity. Appl. Environ. Microbiol. 74, 5997–6005. doi: 10.1128/AEM.00441-08
Dang, H., Wang, C., Li, J., Li, T., Tian, F., Jin, W., et al. (2009). Diversity and distribution of dediment nirS-encoding bacterial assemblages in response to environmental gradients in the eutrophied Jiaozhou bay, China. Microb. Ecol. 58, 161–169. doi: 10.1007/s00248-008-9469-5
Ducey, T. F., Shriner, A., and Hunt, P. G. (2011). Nitrification and denitrification gene abundances in swine wastewater anaerobic lagoons. J. Environ. Qual. 40, 610–619. doi: 10.2134/jeq2010.0387
Edgar, R. C., Haas, B. J., Clemente, J. C., Quince, C., and Knight, R. (2011). UCHIME improves sensitivity and speed of chimera detection. Bioinformatics 27, 2194–2200. doi: 10.1093/bioinformatics/btr381
Enwall, K., Throbäck, I. N., Stenberg, M., Soderstrom, M., and Hallin, S. (2010). Soil resources influence spatial patterns of denitrifying communities at scales compatible with land management. Appl. Environ. Microbiol. 76, 2243–2250. doi: 10.1128/AEM.02197-09
Fernandez, C., Farías, L., and Ulloa, O. (2011). Nitrogen fixation in denitrified marine waters. PLoS ONE 6:e20529. doi: 10.1371/journal.pone.0020539
Graham, D. W., Trippett, C., Dodds, W. K., O’Brien, J. M., Banner, E. B., Head, I. M., et al. (2010). Correlations between in situ denitrification activity and nir-gene abundances in pristine and impacted prairie streams. Environ. Pollut. 158, 3225–3229. doi: 10.1016/j.envpol.2010.07.010
Green, S. J., Prakash, O., Gihring, T. M., Akob, D. M., Jasrotia, P., Jardine, P. M., et al. (2010). Denitrifying bacteria isolated from terrestrial subsurface sediments exposed to mixed-waste contamination. Appl. Environ. Microbiol. 76, 3244–3254. doi: 10.1128/AEM.03069-09
Hallin, S., Jones, C. M., Schloter, M., and Philippot, L. (2009). Relationship between N-cycling communities and ecosystem functioning in a 50-year-old fertilization experiment. ISME J. 3, 597–605. doi: 10.1038/ismej.2008.128
Hallin, S., and Lindgren, P.-E. (1999). PCR detection of genes encoding nitrite reductase in denitrifying bacteria. Appl. Environ. Microbiol. 65, 1652–1657.
Halm, H., Musat, N., Lam, P., Langlois, R., Musat, F., Peduzzi, S., et al. (2009). Co-occurrence of denitrification and nitrogen fixation in a meromictic lake, Lago Cadagno (Switzerland). Environ. Microbiol. 11, 1948–1958. doi: 10.1111/j.1462-2920.2009.01917.x
Hammer,Ø., Harper, D. A. T., and Ryan, P. D. (2001). PAST: paleontological statistics software package for education and data analysis. Palaeontol. Electron. 4:9.
Henry, S., Baudoin, E., López-Gutiérrez, J. C., Martin-Laurent, F., Brauman, A., and Philippot, L. (2004). Quantification of denitrifying bacteria in soils by nirK gene targeted real–time PCR. J. Microbiol. Methods 59, 327–335. doi: 10.1016/j.mimet.2004.07.002
Henry, S., Bru, D., Stres, B., Hallet, S., and Philippot, L. (2006). Quantitative detection of the nosZ gene, encoding nitrous oxide reductase, and comparison of the abundance of 16S rRNA, narG, nirK, and nosZ genes in soils. Appl. Environ. Micorbiol. 72, 5181–5189. doi: 10.1128/AEM.00231-06
Jones, C. M., Graft, D. R., Bru, D., Philippot, L., and Hallin, S. (2013). The unaccounted yet abundant nitrous oxide-reducing microbial community: a potential nitrous oxide sink. ISME J. 7, 417–426. doi: 10.1038/ismej.2012.125
Jones, C. M., and Hallin, S. (2010). Ecological and evolutionary factors underlying global and local assembly of denitrifier communities. ISME J. 4, 633–641. doi: 10.1038/ismej.2009.152
Jones, C. M., Stres, B., Rosenquist, M., and Hallin, S. (2008). Phylogenetic analysis of nitrite, nitric oxide, and nitrous oxide respiratory enzymes reveal a complex evolutionary history for denitrification. Mol. Biol. Evol. 625, 1955–1966. doi: 10.1093/molbev/msn146
Junier, P., Kim, O., Witzel, K., Imhoff, J. F., and Hadas, O. (2008). Habitat partitioning of denitrifying bacterial communities carrying nirS or nirK genes in the stratified water column of Lake Kinneret, Israel. Aquat. Microb. Ecol. 51, 129–140. doi: 10.3354/ame01186
Kandeler, E., Deiglmayr, K., Tscherko, D., Bru, D., and Philippot, L. (2006). Abundance of narG, nirS, nirK, and nosZ genes of denitrifying bacteria during primary successions of a glacier foreland. Appl. Environ. Microbiol. 72, 5957–5962. doi: 10.1128/AEM.00439-06
Kim, O.-S., Imhoff, J. F., Witzel, K.-P., and Junier, P. (2011). Distribution of denitrifying bacterial communities in the stratified water column and sediment-water interface in two freshwater lakes and the Baltic Sea. Aquat. Ecol. 45, 99–112. doi: 10.1007/s10452-010-9335-7
Klappenbach, J. A., Saxman, P. R., Cole, J. R., and Schmidt, T. M. (2001). rrndb:the ribosomal RNA operon copy number database. Nucleic Acids Res. 29, 181–184. doi: 10.1093/nar/29.1.181
Kloos, K., Mergel, A., Rosch, C., and Bothe, H. (2001). Denitrification within the genus Azospirillum and other associative bacteria. Aust. J. Plant Physiol. 28, 991–998.
Knapp, C., Dodds, W. K., Wilson, K. C., O’Brien, J. M., and Graham, D. W. (2009). Spatial heterogeneity of denitrification genes in a highly homogeneous urban stream. Environ. Sci. Technol. 43, 4273–4279. doi: 10.1021/es9001407
Lane, D. J. (1991). “16S/23S rRNA sequencing,” in Nucleic Acid Techniques in Bacterial Systematic, eds E. Stackebrandt and M. Goodfellow (New York, NY: John Wiley and Sons), 115–175.
Larkin, M. A., Blackshields, G., Brown, N. P., Chenna, R., McGettigan, P. A., McWilliam, H., et al. (2007). Clustal W and Clustal X version 2.0. Bioinformatics 23, 2947–2948. doi: 10.1093/bioinformatics/btm404
Lee, W. J., and Park, D. H. (2009). Electrochemical activation of nitrate reduction to nitrogen by Ochrobactrum sp. G3-1 using a noncompartmented electrochemical bioreactor. J. Microbiol. Biotechnol. 19, 836–844.
Lepistö, A., Granlund, K., Kortelainen, P., and Räike, A. (2006). Nitrogen in river basins: sources, retention in the surface waters and peatlands, and fluxes to estuaries in Finland. Sci. Total Environ. 365, 538–259. doi: 10.1016/j.scitotenv.2006.02.053
Martins, G., Terada, A., Ribeiro, D. C., Corral, A. M., Brito, A. G., Smets, B. F., et al. (2011). Structure and activity of lacustrine sediment bacteria involved in nutrient and iron cycles. FEMS Microbiol. Ecol. 77, 666–679. doi: 10.1111/j.1574-6941.2011.01145.x
McArdle, B. H., and Anderson, M. J. (2001). Fitting multivariate models to community data:a comment on distance-based redundancy analysis. Ecology 82, 290–297. doi: 10.1890/0012-9658(2001)082[0290:FMMTCD]2.0.CO;2
McCune, B., and Grace, J. B. (2002). Analysis of Ecological Communities. Corvallis: MjM software design.
McCune, B., and Mefford, M. J. (2011). PC-ORD. Multivariate Analysis of Ecological Data. Version 6. Gleneden Beach, OR: MjM Software.
Nagashima, S., Kamimura, A., Shimizua, T., Nakamura-Isaki, S., Aono, E., Sakamoto, K., et al. (2012). Complete genome sequence of phototrophic betaproteobacterium Rubrivivax gelatinosus IL144. J. Bacteriol. 194, 3541–3542. doi: 10.1128/JB.00511-12
Newton, R. J., Jones, S. E., Eiler, A., McMahon, K. D., and Bertilsson, S. (2011). A guide to the natural history of freshwater lake bacteria. Microbiol. Mol. Biol. Rev. 75, 14–49. doi: 10.1128/MMBR.00028-10
Nielsen, L. P. (1992). Denitrification in sediment determined from nitrogen isotope paring. FEMS Microbiol. Lett. 86, 357–362. doi: 10.1111/j.1574-6968.1992.tb04828.x
Palmer, K., Biasi, C., and Horn, M. A. (2012). Contrasting denitrifier communities relate to contrasting N2O emission patterns from acidic peat soils in arctic tundra. ISME J. 6, 1058–1077. doi: 10.1038/ismej.2011.172
Penton, C. R., Johnson, T. A., Quensen J. F. III, Iwai, S., Cole, J. R., and Tiedje, J. M. (2013). Functional genes to assess nitrogen cycling and aromatic hydrocarbon degradation: primers and processing matter. Front. Microbiol. 4:279. doi: 10.3389/fmicb.2013.00279
Philippot, L. (2002). Denitrifying genes in bacterial and Archaeal genomes. Biochim. Biophys. Acta 1577, 355–376. doi: 10.1016/S0167-4781(02)00420-7
Piña-Ochoa, E., and Álvarez-Conbelas, M. (2006). Denitrification in aquatic environments:a cross-system analysis. Biogeochemistry 81, 111–130. doi: 10.1007/s10533-006-9033-7
Quince, C., Lanzén, A., Curtis, T. P., Davenport, R. J., Hall, N., Head, I. M., et al. (2009). Accurate determination of microbial diversity from 454 pyrosequencing data. Nat. Methods 6, 639–641. doi: 10.1038/nmeth.1361
Rissanen, A. J., Tiirola, M., Hietanen, S., and Ojala, A. (2013). Interlake variation and environmental controls of denitrification across different geographical scales. Aquat. Microb. Ecol. 69, 1–16. doi: 10.3354/ame01619
Rissanen, A. J., Tiirola, M., and Ojala, A. (2011). Spatial and temporal variation in denitrification and in the denitrifier community in a boreal lake. Aquat. Microb. Ecol. 64, 27–40. doi: 10.3354/ame01506
Saarenheimo, J., Rissanen, A. J., Arvola, L., Nykänen, H., Lehmann, M. F., and Tiirola, M. (2015). Genetic and environmental controls on nitrous oxide accumulation in lakes. PLoS ONE 10:e0121201. doi: 10.1371/journal.pone.0121201
Saito, R., Smoot, M. E., Ono, K., Ruscheinski, J., Wang, P. L., Lotia, S., et al. (2012). A travel guide to Cytospcape plugins. Nat. Methods 9, 1069–1076. doi: 10.1038/nmeth.2212
Sanford, R. A., Wagner, D. D., Wu, Q., Chee-Sanford, J. C., Thomas, S. H., Cruz-Garcia, C., et al. (2012). Unexpected nondenitrifier nitrous oxide reductase gene diversity and abundance in soils. Proc. Natl. Acad. Sci. U.S.A. 109, 19709–19714. doi: 10.1073/pnas.1211238109
Saunders, D. L., and Kalff, J. (2001). Denitrification rates in the sediments of Lake Memphremagog, Canada-USA. Water Res. 35, 1897–1904. doi: 10.1016/S0043-1354(00)00479-6
Schloss, P. D., Westcott, S. L., Ryabin, T., Hall, J. R., Hartmann, M., Hollister, E. N., et al. (2009). Introducing mothur:open-source, platform-independent, community-supported software for describing and comparing microbial communities. Appl. Environ. Microbiol. 75, 7537–7541. doi: 10.1128/AEM.01541-09
Seitzinger, S., Harrison, J. A., Böhlke, J. K., Bouwmann, A. F., Lowrance, R., Peterson, B., et al. (2006). Denitrification across landscapes and waterscapes:a synthesis. Ecol. Appl. 16, 2064–2090. doi: 10.1890/1051-0761(2006)016[2064:DALAWA]2.0.CO;2
Shoun, H., Kim, D. H., Uchiyama, H., and Sugiyama, J. (1992). Denitrification by fungi. FEMS Microbiol. Lett. 94, 277–281. doi: 10.1111/j.1574-6968.1992.tb05331.x
Tanimoto, T., Hatano, K. I., Kim, D. H., Uchiyama, H., and Shoun, H. (1992). Co-denitrification by the denitrifying system of the fungus Fusarium oxysporum. FEMS Microbiol. Lett. 93, 177–180. doi: 10.1111/j.1574-6968.1992.tb05086.x
Tatariw, C., Chapman, E. L., Sponseller, R. A., Mortazavi, B., and Edmonds, J. W. (2013). Denitrification in a large river:consideration of geomorphic controls on microbial activity and community structure. Ecology 94, 2249–2262. doi: 10.1890/12-1765.1
Throbäck, I. N., Enwall, K., Jarvis, A., and Hallin, S. (2004). Reassessing PCR primers targeting nirS, nirK and nosZ genes for community surveys of denitrifying bacteria with DGGE. FEMS Microbiol. Ecol. 49, 401–417. doi: 10.1016/j.femsec.2004.04.011
Turner, S., Pryer, K. M., Miao, V. P. W., and Palmer, J. D. (1999). Investigating deep phylogenetic relationships among cyanobacteria and plastids by small subunit rRNA sequence analysis. J. Eukaryot. Microbiol. 46, 327–338. doi: 10.1111/j.1550-7408.1999.tb04612.x
Verbaendert, I., Hoefman, S., Boeckx, P., Boon, N., and De Vos, P. (2014). Primers for overlooked nirK, qnorB, and nosZ genes of thermophilic gram-positive denitrifiers. FEMS Microbiol. Ecol. 89, 162–180. doi: 10.1111/1574-6941.12346
Vila-Costa, M., Bartrons, M., Catalan, J., and Casamayor, E. O. (2014). Nitrogen-cycling genes in epilithic biofilms of oligotrophic high-altitude lakes (Central Pyrenees, Spain). Microb. Ecol. 68, 60–69. doi: 10.1007/s00248-014-0417-2
Wang, Q., Garrity, G. M., Tiedje, J. M., and Cole, J. R. (2007). Naïve Bayesian classifier for rapid assignment of rRNA sequences into the new bacterial taxonomy. Appl. Environ. Microbiol. 73, 5261–5267. doi: 10.1128/AEM.00062-07
Yoshida, M., Ishii, S., Otsuka, S., and Senoo, K. (2009). Temporal shifts in diversity and quantity of nirS and nirK in a rice paddy field soil. Soil Biol. Biochem. 41, 2044–2051. doi: 10.1016/j.soilbio.2009.07.012
Yu, Z., Yang, J., and Liu, L. (2014). Denitrifier community in the oxygen minimum zone of a subtropical deep reservoir. PLoS ONE 9:e92055. doi: 10.1371/journal.pone.0092055
Zhang, J., Yang, Y., Zhao, L., Li, Y., Xie, S., and Liu, Y. (2015). Distribution of sediment bacterial and archaeal communities in plateau frehswater lakes. Appl. Microbiol. Biotechnol. 99, 3291–3302. doi: 10.1007/s00253-014-6262-x
Keywords: community composition, denitrification, nirS, nirK, nosZ, qPCR
Citation: Saarenheimo J, Tiirola M and Rissanen AJ (2015) Functional gene pyrosequencing reveals core proteobacterial denitrifiers in boreal lakes. Front. Microbiol. 6:674. doi: 10.3389/fmicb.2015.00674
Received: 05 May 2015; Accepted: 19 June 2015;
Published: 01 July 2015.
Edited by:
George S. Bullerjahn, Bowling Green State University, USAReviewed by:
Anne Bernhard, Connecticut College, USASonja Kristine Fagervold, University of Paris, France
Copyright © 2015 Saarenheimo, Tiirola and Rissanen. This is an open-access article distributed under the terms of the Creative Commons Attribution License (CC BY). The use, distribution or reproduction in other forums is permitted, provided the original author(s) or licensor are credited and that the original publication in this journal is cited, in accordance with accepted academic practice. No use, distribution or reproduction is permitted which does not comply with these terms.
*Correspondence: Jatta Saarenheimo, Department of Biological and Environmental Science, University of Jyväskylä, P. O. Box 35, 40014 Jyväskylä, Finland, jatta.saarenheimo@jyu.fi