 Kristof Brenzinger
 Peter Dörsch
 Gesche Braker
- 1Department of Biogeochemistry, Max Planck Institute for Terrestrial Microbiology, Marburg, Germany
- 2Department of Environmental Sciences, Norwegian University of Life Sciences, Ås, Norway
- 3University of Kiel, Kiel, Germany
Soil pH is a strong regulator for activity as well as for size and composition of denitrifier communities. Low pH not only lowers overall denitrification rates but also influences denitrification kinetics and gaseous product stoichiometry. N2O reductase is particularly sensitive to low pH which seems to impair its activity post-transcriptionally, leading to higher net N2O production. Little is known about how complex soil denitrifier communities respond to pH change and whether their ability to maintain denitrification over a wider pH range relies on phenotypic redundancy. In the present study, we followed the abundance and composition of an overall and transcriptionally active denitrifier community extracted from a farmed organic soil in Sweden (pHH2O = 7.1) when exposed to pH 5.4 and drifting back to pH 6.6. The soil was previously shown to retain much of its functioning (low N2O/N2 ratios) over a wide pH range, suggesting a high functional versatility of the underlying community. We found that denitrifier community composition, abundance and transcription changed throughout incubation concomitant with pH change in the medium, allowing for complete reduction of nitrate to N2 with little accumulation of intermediates. When exposed to pH 5.4, the denitrifier community was able to grow but reduced N2O to N2 only when near-neutral pH was reestablished by the alkalizing metabolic activity of an acid-tolerant part of the community. The genotypes proliferating under these conditions differed from those dominant in the control experiment run at neutral pH. Denitrifiers of the nirS-type appeared to be severely suppressed by low pH and nirK-type and nosZ-containing denitrifiers showed strongly reduced transcriptional activity and growth, even after restoration of neutral pH. Our study suggests that low pH episodes alter transcriptionally active populations which shape denitrifier communities and determine their gas kinetics.
Introduction
Soil N2O emissions from denitrification depend on environmental conditions that control the rates of denitrification and the N2O/N2 product ratio. Important soil and chemical factors are oxygen availability (as affected by soil moisture and respiration), temperature, nitrate availability and pH (Wijler and Delwiche, 1954; Nömmik, 1956; Firestone, 1982). Among these factors, soil pH is one of the most crucial ones, because it does not only affect overall denitrification rates, but more importantly seems to directly control the N2O/(N2O + N2) ratio of denitrification, and hence N2O emission rates from soils (Šimek and Cooper, 2002; Liu et al., 2010; Bakken et al., 2012). Denitrification rates increase with higher pH, whereas N2O/(N2O + N2) ratios decrease (Wijler and Delwiche, 1954; Nömmik, 1956; Dörsch et al., 2012). Direct inhibition of N2O reduction by low pH was demonstrated in laboratory experiments with Paracoccus denitrificans (Bergaust et al., 2010) and with soils from a long-term liming experiment in Norway (Liu et al., 2010) and may explain the negative correlation between soil pH and N2O emission found in certain field studies (e.g., Weslien et al., 2009; Van den Heuvel et al., 2011).
It is well known that pH also affects the composition and size of denitrifier communities in soil. Acidic soils harbor smaller and less diverse 16S rRNA and denitrification gene pools than neutral soils (Fierer and Jackson, 2006; Čuhel et al., 2010; Braker et al., 2012). Acidity seems to be particularly detrimental to nirS-type denitrifiers, resulting in a strong decrease of nirS/16S rRNA gene ratios (Čuhel et al., 2010). Whether pH-induced changes in taxonomic denitrifier community composition translate into functional differences is unclear. Several studies have linked potential denitrification rates or kinetics to size and composition of denitrifier communities in soils differing in pH (Cavigelli and Robertson, 2001; Bru et al., 2010; Dandie et al., 2011; Braker et al., 2012), suggesting that pH controls soil denitrification and its product stoichiometry via taxonomic differences. In some cases, the relative abundance of marker genes for N2O-reducers (nosZ) vs. N2O-producers (nirS, nirK, norB) explained the (N2O)/(N2O + N2) product ratio (Morales et al., 2010; Philippot et al., 2011; Billings and Tiemann, 2014), but this correlation seems to depend on habitat and environmental conditions (Morales et al., 2010; Philippot et al., 2011; Deslippe et al., 2014). In a recent study, Jones et al. (2014) proposed that soil pH controls the abundance of nitrite reductase genes as well as the abundance of the newly discovered nosZ Type II clade in soils with relevance to the soil's ability to reduce N2O.
The direct effect of low pH on the transcription of denitrification genes has been studied in pure culture (Bergaust et al., 2010), soils (Liu et al., 2010) and cells extracted from soil (Liu et al., 2014). In general, low pH resulted in low numbers of transcripts encoding nitrite reductases (nirS and nirK) and N2O reductase (nosZ) (Bergaust et al., 2010; Liu et al., 2010), but the nosZ/nirK transcript ratio did not change. Interestingly, transcription of nirS seemed to be more suppressed by acidity than of nirK (Liu et al., 2010), but it is unclear how this affects N2O emissions. The underlying molecular mechanisms for direct pH control on N2O emissions are not fully resolved, but post-transcriptional impairment of nitrous oxide reductase (N2OR) by pH < 6.1 has been suggested (Liu et al., 2014).
Together, this raises three basic questions: (i) is the ability of a soil denitrifier community to reduce N2O to N2 entirely controlled by pH-impairment of N2OR? (ii) do communities harbor organisms which can thrive over a wider pH range without losing N2O reductase activity? or (iii) are communities functionally redundant in that they contain distinct members with similar phenotypes adapted to different pH? In the present study, we approached these questions in a model community obtained by extracting microbial cells from a soil with neutral pH. The extracted cells were incubated in pH adjusted batch experiments and we followed the dynamics of denitrifying communities through the analysis of functional genes nirK, nirS, and nosZ and their gene expression while monitoring gas kinetics at high resolution. The community was extracted from a farmed organic soil in Sweden (SWE, native pH 7.1) which had been previously found to retain much of its functioning (low N2O/N2 ratios) in pH manipulation experiments (pH 5.4/7.1) (Dörsch et al., 2012). This finding was attributed to a species-rich denitrifier community, and hence to high functional diversity (Braker et al., 2012). Here, we revisited the pH manipulation experiment of Dörsch et al. (2012) and followed functional gene abundance and diversity of the overall denitrifier community (ODC) and the transcriptionally active denitrifier community (TADC) throughout anoxic growth, covering a transient pH range from 5.4 to 7.1. We hypothesized that the inherent alkalization ensuing anoxic growth of denitrifiers induces a succession of taxonomically distinct but, in terms of pH adaptation, functionally redundant denitrifier populations, thus supporting complete denitrification to N2 over a wide pH range. Since gene expression does not necessarily result in functional enzymes at low pH (e.g., Bergaust et al., 2010), we compared shifts in transcripts to those in DNA over time, hypothesizing that only taxa expressing functional enzymes would propagate in the growing culture. In this way we assessed whether sustained function (here: complete denitrification to N2) would be linked to structural changes in the underlying community.
Materials and Methods
Soil Sample
The soil was originally sampled from a Terric Histosol (FAO) in Sweden and has been used in several studies exploring functional characteristics of denitrification (Holtan-Hartwig et al., 2000, 2002; Dörsch and Bakken, 2004; Klemedtsson et al., 2009; Dörsch et al., 2012) and underlying denitrifier communities (Braker et al., 2012). The neutral pH of the organic soil is due to inclusion of lacustrine limestone from a former lake bottom. Detailed soil characteristics are given in Dörsch et al. (2012). By the time of the present study, the soil had been stored moist at 4°C for 15 years.
Cell Extraction and Incubation Conditions
Cell extraction was performed as described previously (Dörsch et al., 2012) with the following modification: Instead of two portions of 50 g soils, four portions were used to recover a higher total cell number. Pellets with extracted cells were resuspended in a total volume of 75 mL filter-sterilized bi-distilled water and stirred aerobically for 0.5–1 h to inactivate any existing denitrification enzyme prior to inoculation into a He-washed hypoxic mineral medium (0.7 μM O2; see below).
The mineral media contained (L−1): 200 mg KH2PO4, 20 mg CaCl2, 40 mg MgSO4, 3.8 mg Fe-NaEDTA, 0.056 mg LiCl, 0.111 mg CuSO4, 0.056 mg SnCl2, 0.778 mg MnCl2, 0.111 mg NiSO4, 0.111 mg Co(NO3)2, 0.111 mg TiO2, 0.056 mg KI, 0.056 mg KBr, 0.1 mg NaMoO4. The medium was buffered with 25 mM HEPES (N-2-hydroxyethylpiperazine-N′-2-ethane-sulfonic acid) and was supplemented with 3 mM of the electron acceptor KNO3 and 3 mM Na-glutamate as carbon and nitrogen source. The medium had an initial pH of 5.1. Two aliquots of sterile autoclaved medium were adjusted to pH 5.4 and pH 7.1, respectively, by adding 1 N NaOH to the medium. Two sets (15 each) of 120 mL-flasks were filled with 43 ml of medium of either pH 5.4 or pH 7.1, resulting in 30 sample flasks in total. Additional flasks were used as blanks without adding cells extracted from the soil. The serum flasks were crimp sealed with butyl septa and made near-anoxic (~0.7 μM O2) by six cycles of evacuation and He-filling using an automated manifold while stirring the suspension with magnetic stirrers at 500 rpm (Molstad et al., 2007).
Incubation, Gas Analyses, and Sampling
Denitrification activity was measured directly after inoculation with the cells by denitrification product accumulation. Thirty serum flasks, three blanks, three calibration standards, and two flasks for NO−2 measurements were placed on a submersible magnetic stirring board (Variomag HP 15; H + P Labortechnik GmbH, Oberschleissheim, Germany) in a 15°C water bath. The water bath is an integrated part of an automated incubation system for the quantification of O2 consumption and CO2, NO, N2O and N2 production in denitrifying cultures similar to that described by Molstad et al. (2007). After temperature equilibration, excess He was released by piercing the bottles with a syringe without plunger filled with 2 ml bi-destilled water to avoid entry of air. The bottles were inoculated with 2 mL of cell suspension, yielding approximate cell numbers of 2 × 10⁹ cells per flask (4 × 10⁷ mL−1). The headspace concentrations of O2, CO2, NO, N2O, and N2 were monitored every 5 h as described by Molstad et al. (2007) and Dörsch et al. (2012).
The incubation experiments were terminated after 210 h when NO−3-N added to flasks was recovered as N2-N. After 0, 12, 26, 48, 70, 96, and 206 h, two to three sample flasks of each pH treatment were sacrificed. Cell densities were determined by spectrophotometry (OD600) and NO−2 concentrations were measured by a spectrometer according to the international standard ISO 6777-1984 (E). The remaining suspension was centrifuged at 4°C and 8.400 × g and the cell pellet was immediately frozen in liquid nitrogen and stored at −80°C until further use. At each time point the pH in the supernatant was determined.
Extraction of Nucleic Acids
DNA and RNA were extracted from the frozen cell pellets (−80°C) collected at each sampling point. For this, one or two frozen cell pellets were resuspended in 400 μL sterile water (Sigma-Aldrich, Taufkirchen, Germany). Nucleic acids were extracted using a modified SDS-based protocol (Bürgmann et al., 2003; Pratscher et al., 2011). In brief, the cells were disrupted in a FastPrep beat-beating system and nucleic acids were recovered from the supernatant using a phenol/chloroform/isoamyl alcohol extraction. Subsequently the nucleic acids were precipitated with polyethylene glycol (PEG) 6000 solution and redissolved in 100 μL of sterile (0.1 μm filtered) nuclease-free (DNase-, RNase-free) and protease-free bi-distilled water (Sigma-Aldrich). An aliquot of 20 μL was stored at −20°C for further DNA-based molecular analyses. The remaining 80 μL were treated with RNase-free DNase (Qiagen, Hilden, Germany) for removal of DNA. RNA was purified using the RNeasy Mini Kit (Qiagen), precipitated with 96% EtOH and resuspended in 15 μL nuclease-free water (Sigma-Aldrich) to increase the RNA concentration and stored at −80°C. The integrity of the RNA was checked on a 1.5% w/v agarose gel (Biozym Scientific GmbH, Hessisch Oldendorf, Germany) and the concentration was determined by a NanoDrop1000 instrument (Thermo Fisher Scientific, Dreieich, Germany). The RNA was reverse transcribed with random hexamer primers (Roche, Mannheim, Germany) and M-MLV reverse transcriptase (Promega, Mannheim, Germany).
Analysis of the Composition of nirK, nirS, and nosZ Genes and Transcripts
The composition of the denitrifier community was determined by terminal restriction fragment length polymorphism (T-RFLP). The nitrite reductase genes nirK and nirS as well as the nitrous oxide reductase gene nosZ were amplified from cDNA and DNA using the primer pairs nirK1F-nirK5R (~516 bp), nirS1F-nirS6R (~890 bp), and Nos661F-Nos1773R (~1131 bp) and conditions described previously (Braker et al., 1998, 2000; Scala and Kerkhof, 1998). Details on primers and procedures are given in Table S1. These primers were chosen to allow for comparison of the results obtained in this study to previous ones (Braker et al., 2012), although different primers to target these genes have been published more recently (e.g., Green et al., 2010; Verbaendert et al., 2014). The forward nirS and nosZ primer and the reverse nirK primer were 5′-6-carboxyfluorescein labeled. The quantity and quality of the PCR product were analyzed by electrophoresis on a 1.5% w/v agarose gel after staining the gel with 3 × GelRed Nucleic Acid Stain (Biotium, Hayward, CA, USA). PCR products of the expected size were recovered from the gel using the DNA Wizard® SV Gel-and-PCR-Clean-up system (Promega). The PCR products of nirK, nirS and nosZ were digested using the restriction enzymes FastDigest HaeIII, FastDigest MspI, and FastDigest HinP1I (Thermo Fisher Scientific), respectively, following the manufacturer's specifications. The purified fluorescently labeled restriction fragments were separated on an ABI PRISM 3100 Genetic Analyzer sequencer (Applera Deutschland GmbH, Darmstadt, Germany) and the lengths of fluorescently labeled terminal restriction fragments (T-RFs) were determined by comparison with the internal standard using GeneMapper software (Applied Biosystems). Peaks with fluorescence of >1% of the total fluorescence of a sample and >30 bp length were analyzed by aligning fragments to the internal DNA fragment length standard (X-Rhodamine MapMarker® 30–1000 bp; BioVentures, Murfreesboro, TN). Reproducibility of patterns was confirmed for repeated T-RFLP analysis using the same DNA extracts. A difference of less than two base pairs in estimated length between different profiles was the basis for considering fragments identical. Peak heights from different samples were normalized to identical total fluorescence units by an iterative normalization procedure (Dunbar et al., 2001).
Quantitative Analysis of nirK, nirS, and nosZ Genes and Transcripts
The abundance of nirK, nirS, and nosZ genes and transcripts in the sample flasks was determined by qPCR using primers qnirK876-qnirK1040, qCd3af-qR3cd, and nosZ2F-nosZ2R (Henry et al., 2004, 2006; Kandeler et al., 2006). Details on primers and procedures are given in Table S1. The reaction mixture contained 12.5 μL SyberGreen Jump-Start ReadyMix, 0.5 μM of each primer, 3–4.0 mM MgCl2, 1.0 μL template cDNA or DNA and 200 ng BSA mL−1 was added. All qPCR assays were performed in an iCycler (Applied Biosystem, Carlsbad CA, USA). Standard curves were obtained using serial 10-fold dilutions of a known amount of plasmid DNA containing the respective fragment of the nirK-, nirS-, and nosZ-gene. Negative controls were always run with water instead of cDNA or DNA. PCR efficiencies for all assays were between 80 and 97% with r2-values between 0.971 and 0.995.
Statistical Analyses
All statistical analyses and graphics were done using R version 3.0.1 (R Development Core Team, 2013). Significant differences of nirK, nirS, nosZ, bacterial 16S rRNA gene and transcript abundance as well as the calculated ratios were assessed using ANOVA (P < 0.05). All quantitative data were log-transformed prior to analysis to satisfy the assumptions of homoscedasticity and normally distributed residuals. The community composition changes in the overall and transcriptionally active denitrifier community by T-RFLP were analyzed using non-metric multidimensional scaling (NMDS) and overall differences were tested by ANOSIM (P < 0.05). Additionally, differences in the composition of transcriptionally active and overall denitrifier communities (ODC) at a given time point were tested by ANOSIM (P < 0.05). An ANOSIM R value near +1 means that there is dissimilarity between the groups, while an R-value near 0 indicates no significant dissimilarity between the groups (Clarke, 1993). NMDS analyses were performed with the Bray-Curtis similarity index (including presence and relative abundance of T-RF) which iteratively tries to plot the rank order of similarity of communities in a way that community point distances are exactly expressed on a two-dimensional sheet. The reliability of the test was calculated by a stress-value. Stress >0.05 provides an excellent representation in reduced dimensions, >0.1 very good, >0.2 good, and stress >0.3 provides a poor representation. All community composition data were Hellinger-transformed before analysis, in order to reach normal distribution. ANOSIM, ANOVA, and NMDS were done using package vegan version 2.0-5 (Oksanen et al., 2012).
Results and Discussion
Denitrification Kinetics and Shifts in Abundance and Composition of TADC and ODC at Native pH 7.1
At native pH 7.1, residual O2 after He-washing was depleted and all nitrate was stoichiometrically converted to N2 within 96 h of incubation (Figures 1A,B). Net accumulation of gaseous denitrification intermediates was low (< 0.2% of initially present NO−3-N). Transcriptional activation of functional genes (Figure 2A) and proliferation of denitrifiers containing nirK and nosZ (Figures 3A,C) started instantly after the cells were transferred to the hypoxic medium. A maximum of relative transcription and community size was reached after 96 h (Figures 3A,C), ~40 h after the start of exponential product accumulation (CO2, N2) (Figures 1A,B). The maximum relative transcriptional activity (cDNA/DNA ratio) was low with 0.077 for nirK (Figure 3A) and 0.002 nosZ (Figure 3C), but efficiently translated into denitrifier growth (Figures 3A,C). The strongest growth occurred for nosZ-containing denitrifiers (16,500-fold) while denitrifiers of the nirK-type grew 400-fold (Table S2). In contrast, growth of nirS-type denitrifiers showed a lag-phase of 49 h (Figure 2A, Table S2) after which they were transcriptionally activated (cDNA/DNA ratio of 0.11, Table S3) and increased in abundance, albeit only 50-fold (Figure 3B). Ratios (nosZ/[nirK + nirS]) of >50 after 96 h indicated a tendency of enhanced growth of nosZ-type denitrifiers compared to nitrite reducers (Figure 4, Table S4) which may explain the efficient conversion of N2O to N2 (Philippot et al., 2011). However, PCR-based analyses of genes and transcripts may be biased. The primers used do for instance neither target nirK genotypes from Rhodanobacter species (Green et al., 2010) nor thermophilic Gram-positive denitrifiers (Verbaendert et al., 2014). The recently postulated nosZ clade II (Sanford et al., 2012; Jones et al., 2013) was also not analyzed in this study. Hence, nosZ/(nirK + nirS) ratios and their response to pH must be taken with caution.
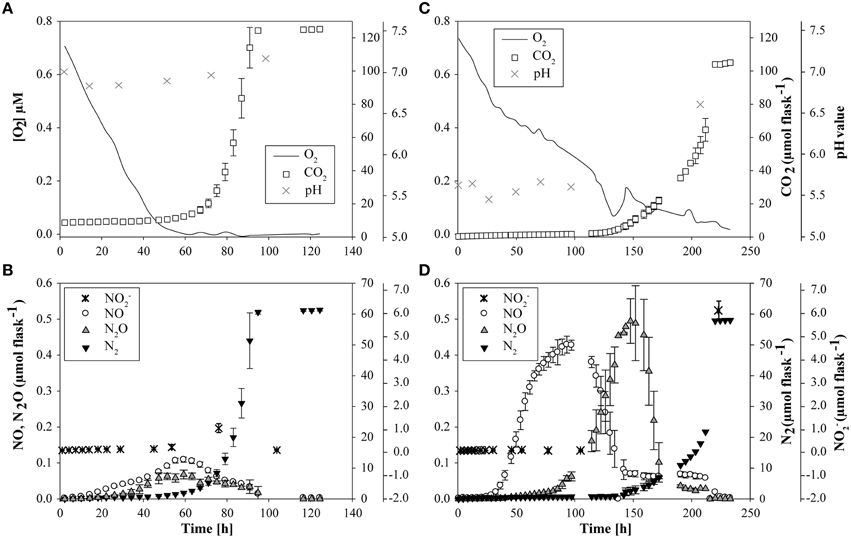
Figure 1. Accumulation of O2, CO2, NO, N2O, N2, NO−2 and changes in pH value in suspensions of cells extracted from a soil from Sweden at initially pH 7.1 (left panels) and at initially pH 5.4 (right panels) during incubation (0–206 h). (A) O2, CO2 concentration and pH value at pH 7.1; (B) NO−2, NO, N2O and N2 concentration at pH 7.1; (C) O2, CO2 concentration and pH value at pH 5.4; (D) NO−2, NO, N2O and N2 concentration at pH 5.4.
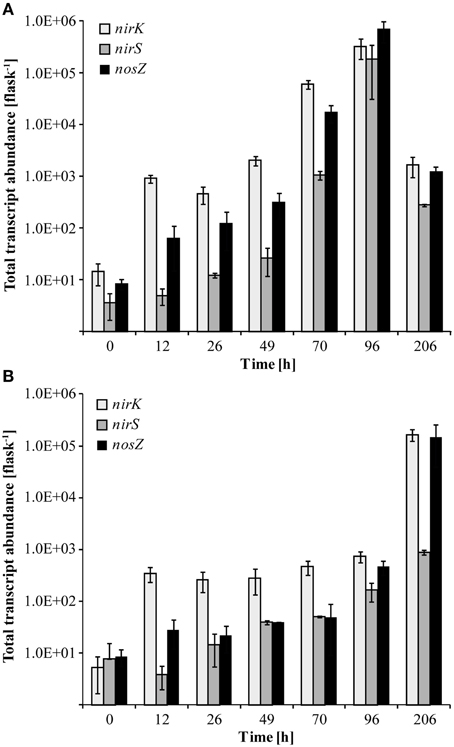
Figure 2. Transcript abundance of functional marker genes for denitrification (nirK, nirS, and nosZ) quantified by qPCR. (A) Transcript copy numbers of the incubation at pH 7.1; (B) Transcript copy numbers of the incubation at pH 5.4 (Mean ± SD, n = 3).
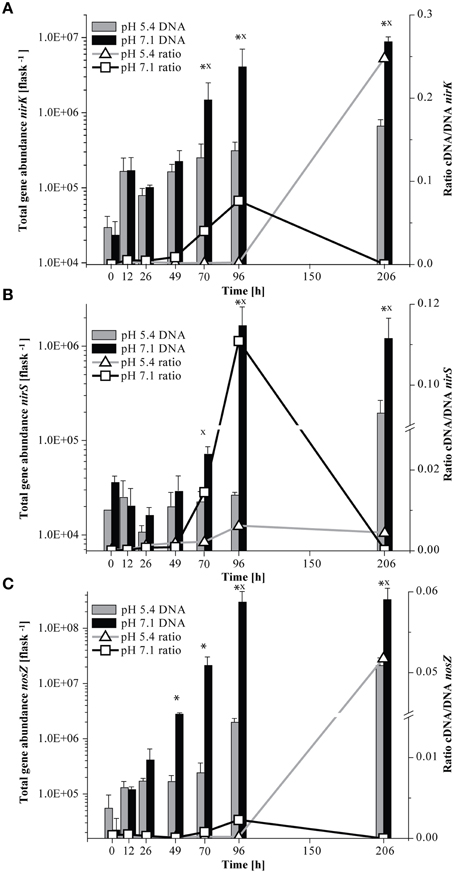
Figure 3. Abundance of functional marker genes for denitrification (nirK, nirS, and nosZ) quantified by qPCR and ratio of cDNA/DNA copy numbers. Left axis, total gene abundance and right axis, ratio of cDNA/DNA copy numbers. Bars indicate the total gene copy numbers and the line the cDNA/DNA ratio. An asterisk indicates significant differences in gene abundance, x indicates significant differences in the ratio of cDNA/DNA copy numbers between incubation at pH 5.4 and pH 7.1 at a given time point (ANOVA: P < 0.05). (A) nirK; (B) nirS; (C) nosZ (Mean±SD, n = 3).
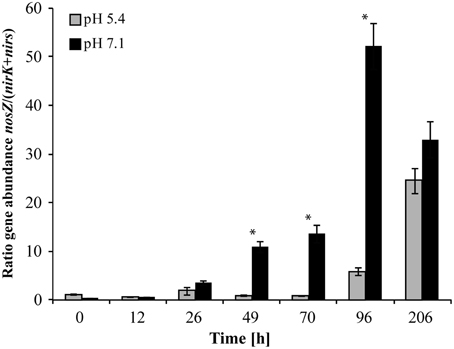
Figure 4. Ratio of nosZ/(nirK + nirS) gene copy numbers. An asterisk indicates significant differences in ratios between incubation at pH 5.4 and pH 7.1 at a given time point (ANOVA: P < 0.05). (Mean ± SD, n = 3).
Community composition data indicated selective transcriptional activity, followed by growth of only a few organisms (Figures S1A, S2A, S3A). Terminal restriction fragments (T-RFs) of 229 bp (representing nirK most closely related to nirK of Alcaligenes xylosoxidans) and of 37 bp length (38 bp in silico representing nosZ most closely related to nosZ of Pseudomonas denitrificans, Ps. stutzeri, and Ps. aeruginosa), (Table S5) which were of little abundance in or absent from the inocula, respectively, dominated the transcriptionally active nirK- and nosZ-containing denitrifier communities (Figures S1A, S3A). For nirS, a genotype most closely related to nirS of Ps. migulae (105-bp T-RF) was transcriptionally activated and proliferated that was not even detectable in the initial community (Figure S2A). Still, the composition of the transcriptionally active (TADC) and the overall denitrifier community (ODC) converged throughout the first 96 h of incubation as indicated by multi-dimensional scaling of T-RFs (Figures 5A–C; ANOSIM26–49h: P < 0.05; R between 0.423 and 0.873; ANOSIM70–96h: P>0.05; R between 0.142 and 0.275). The shifts in denitrifier community composition and the decrease in denitrifier diversity (Shannon index, Figures S1A–S3A) did not result in impairment of function, i.e., gaseous intermediates were efficiently taken up and reduced to N2 (Figures 1A,B). This suggests that it was not the microbial diversity per se that mediated the community's functioning, but the specific metabolic capacities of the dominating denitrifying taxa. Transcription of denitrification genes decreased after all nitrogen oxides were depleted (Figure 2A) and the number of transcripts relative to gene copies became very low (Figures 3A–C). Hence, the increase in diversity and shift in cDNA composition observed for nirK and nosZ-containing denitrifiers at 206 h was presumably the result of transcript degradation following starvation (Figures S1A, S3A).
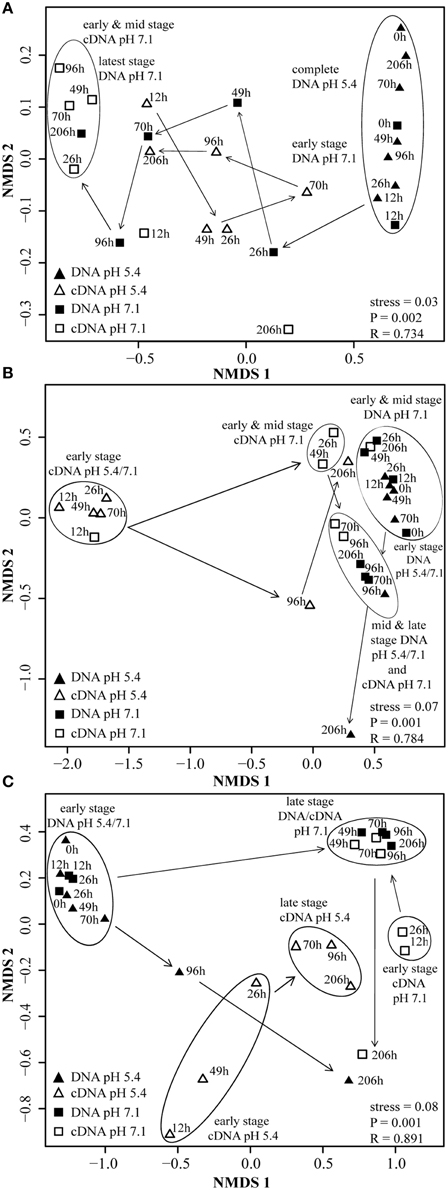
Figure 5. NMDS plots of denitrifier communities based on cDNA- and DNA-derived T-RFLP analysis of nirK, nirS, and nosZ from three pooled samples. Data points represent averaged results of three replicate T-RFLP analyses. Community similarity was calculated by using the statistical program R and the Bray–Curtis similarity measurement, which includes presence and relative abundance of T-RF. Clusters and arrows were inserted manually to highlight clustering and community development. Significant differences in the composition of denitrifier communities at given time points were determined by ANOSIM (P < 0.05). (A) nirK; (B) nirS; (C) nosZ.
Denitrification Kinetics and Shifts in Abundance and Composition of TADC and ODC When Exposed to Low pH
Response of Denitrification to Incubation at Acid pH
Exposing the extracted cells to pH 5.4 showed that most of the functionality in denitrification (low accumulation of denitrification intermediates) was retained (Figure 1D). This was reported earlier for the denitrifying community of this soil (Dörsch et al., 2012). However, denitrification kinetics were clearly influenced by the initially low pH. Respiration activity (measured as CO2 accumulation) at pH 5.4 was lower as compared to pH 7.1 (Figure 1C) and NO and N2O accumulation started approximately 15 h later (Figure 1D). Net production of NO and N2O was four- and nine-fold higher, respectively, than at neutral pH and due to slower denitrification kinetics, the reduction of intermediates occurred sequentially. This is in line with previous studies, finding clear pH effects on the accumulation of intermediates in denitrification (Bergaust et al., 2010; Liu et al., 2010, 2014). For instance, transient accumulation of N2O by P. denitrificans growing at pH 6.0 was 1500-fold higher than at neutral pH (Bergaust et al., 2010). Liu et al. (2010) found that the production of N2 declined to zero with decreasing pH when comparing soils from a long-term liming experiment with in situ pH ranging from pH 4.0 to 8.0. Cells extracted from one of the neutral soils and incubated at pH levels between 7.6 and 5.7 for up to 120 h showed a peculiar pH threshold of 6.1, below which no functional N2O-reductase was produced (Liu et al., 2014). In our study, nitrate was stoichiometrically converted to N2 with less than 1% net N2O-N accumulation when incubated at initially pH 5.4 (Figure 1D). However, complete N conversion coincided with a pH shift in the medium (from 5.4 to 6.6) which occurred between 150 and 206 h of incubation (Figures 1C,D). This shift was most likely driven by the strongly increasing denitrification activity during this period. Denitrification is an alkalizing reductive process, consuming 6 moles H+ per mol NO−3 reduced to N2. CO2 production was clearly coupled to total N-gas production and came to a halt when all N-oxides were reduced to N2 (Figure 1C). This suggests that respiratory processes other than denitrification were absent and that the pH-threshold for N2O reduction in the medium was overcome by growing denitrifiers which consumed [H+] (Figure 1C). This suggestion is further supported by the dominance (>90%) of phylotypes closely related to known denitrifiers at the end of the incubation (Table S6). These findings, together with the transient accumulation of NO at pH 5.4, led us to the conclusion that acid tolerant denitrifiers present in the native community must have been metabolically active at pH 5.4, illustrating the high functional versatility of this community with respect to pH.
Response of nirK and nosZ-containing Denitrifier Communities to Incubation at Low pH
We studied how the denitrifier community responded to incubation at initially low pH in terms of growth and transcriptional activation of the denitrification genes nirK, nirS, and nosZ. Unfortunately, although functional data were collected for the period when the pH shift occurred, due to limitations in the number of samples that could be processed, no community data are available for the period of rapid pH shift. In general, incubation at low pH retarded the transcriptional activation of the functional marker genes (compare Figure 2A and Figure 2B, Table S2). As long as the pH remained stable at about 5.4 (until 96 h), copy numbers of nirK and nosZ cDNA increased in a range similar to the initial phase of the incubation at pH 7.1 (until 49 h). Moreover, transcriptional activation of nirK and nosZ at pH 5.4 translated into growth of the communities albeit to a lesser extent than at neutral pH (Figures 3A,C). During the pH shift to 6.6 (96–206 h), presumably concomitant with the exponential accumulation of the N2, transcript abundances increased reaching their highest densities at the end of the incubation (Figure 2B). However, the increase in denitrifier density was only 11-fold at most and hence less than at pH 7.1 (Table S2). Hence, although the relative transcriptional activity (ratio of cDNA/DNA copies) of nirK and nosZ exceeded levels at pH 7.1, transcription seemed not to translate into growth as efficiently.
Development of Transcriptionally Active and Overall nirK-type Denitrifier Communities When Exposed to Low pH
Contrary to the incubation at pH 7.1, the composition of the growing ODC in the initially acid incubation changed only marginally and thus differed significantly between the two pH treatments at the end of the experiment. While the development of the ODC at the native pH of the soil (7.1) reflected the composition of the TADC within the first 96 h (see above), this was not the case with initially acidic pH (Figure 5A, Figure S1B). Here, TADC patterns clustered separate (ANOSIM: P < 0.05; R between 0.742 and 0.841) from those of the ODC throughout the experiment due to the continuous predominance of the terminal restriction fragment (T-RF) of 229 bp length in the TADC which was of constantly low relative abundance in the ODC (Figure S1B). Thus, we conclude that transcriptional activation of the respective genotypes did not translate into denitrification activity and specific growth of these denitrifiers, suggesting regulation at the post-translational level. Such effects were previously suggested for nosZ gene expression in P. denitrificans by Bergaust et al. (2010) and confirmed by Liu et al. (2010, 2014) for soils and extracted cells. Bergaust et al. (2010) hypothesized that low pH (6.0) impairs the assembly of N2O-reductase in P. denitrificans, leading to a dysfunctional enzyme and hence accumulation of N2O.
Development of the Transcriptionally Active and Overall nosZ-containing Denitrifier Communities When Exposed to Low pH
Incubation at initially pH 5.4 altered the nosZ-TADC as well as the nosZ-ODC but they remained significantly different (Figure 5C; ANOSIM: P < 0.05; R between 0.712 and 0.831). During the first phase of the incubation (up to 70 h) at low pH, growth was small. However, N2O-reducers present at very low abundance in the native community seemed to be functional. T-RFLP analysis revealed that after a lag phase of 26 and 70 h, T-RFs of 37 and 40 bp, respectively, that were present at undetectable levels in the ODC, became transcriptionally activated and increased in relative abundance (Figure S3B). After 96 h of incubation, the initial community started to be outcompeted by transcriptionally active nosZ-containing organisms. While N2O-reducers (40 bp T-RF) were transcriptionally active in the low pH incubation only and started proliferating in the ODC toward the end of the incubation, the T-RF of 37 bp was detected at both pH levels and even dominated the community at neutral pH. Existence of acid-tolerant denitrifiers containing nosZ was previously demonstrated for a nutrient poor acidic fen by Palmer et al. (2010) and a riparian ecosystem (Van den Heuvel et al., 2011). Similar to pH 7.1, we observed a tendency of enhanced growth of nosZ-containing denitrifiers compared to nitrite reducers as reflected by a nosZ/(nirK + nirS) ratio >25 after 206 h (Figure 4, Table S4) when N2O was effectively reduced.
Transcriptional Activity and Development of Transcriptionally Active and Overall nirS-type Denitrifier Communities When Exposed to Low pH
Transcription of nirS was not significantly inhibited by low pH and cDNA copy numbers increased slowly until 96 h (Figure 2B). The response in transcription of the community to incubation resembled that during the first 49 h at neutral pH (Figure 2A). When the pH started to shift back to near neutral (pH 6.6) and vigorous proliferation occurred (as judged from N gas kinetics), transcription of nirS was further enhanced but the high absolute and relative transcription levels observed for nirK and nosZ were never reached (Figures 2B, 3B). This contrasts a recently published study with cells extracted from soil (Liu et al., 2014). Liu et al. (2014) observed constantly lower nirK and slightly increasing nirS and nosZ transcript numbers during incubation at pH 5.7 and 6.1, as compared to pH 7.6 where transcripts of all three denitrification genes increased equally. However, in that study, starting conditions were different; the community had a native pH of 6.1 and was preincubated under oxic conditions for several hours. Our findings also contrast other results of Liu et al. (2014), who found stable, pH-independent cDNA/DNA ratios for nirS and nosZ, whereas for nirK the ratio declined due to efficient growth of the nirK-type denitrifier community but constant level of transcription at higher pH. We observed persistently reduced relative nirS transcription at low pH compared to pH 7.1 and the growth of nirS-type denitrifiers was severely inhibited by low pH during the first 96 h of incubation (Figure 3). A previous pure culture study found that already at slightly acidic pH of 6.8, the nirS-type denitrifier P. denitrificans was unable to build up a functional denitrification pathway (Baumann et al., 1997). Although the nitrite reductase gene was properly induced, the enzyme could not be detected at sufficient amounts in the culture indicating that either translation was inhibited, or once synthesized, nitrite reductase was inactivated, possibly by high concentrations of nitrous acid (HNO2). In our study, incubation at low pH did not increase NO−2 until 96 h (Figure 1D), and accumulation of NO was moderate within the nano-molar range (1 μmol NO in the bottle ~ 730 nM in liquid). Moreover, Baumann et al. (1997) demonstrated that a functional nitrite reductase assembled at pH 7.5 was still active if the culture was shifted to acidic pH. The cells exhibited a reduced overall denitrification activity, but neither nitrite nor any other denitrification intermediate accumulated which is in agreement with our findings (Figure 1D). Despite the low levels of transcription, the nirS TADC shifted but only after 96 h of incubation and surprisingly, the ODC changed at the same time, although DNA copy numbers did not increase which cannot be explained. Only with the pH upshift between 96 and 206 h, a slight growth (one order of magnitude) occurred but the community developed distinctly from the TADC (Figure 5B; ANOSIM: P < 0.05; R between 0.671 and 0.912). Since the initial abundance of nirK- and nirS-type denitrifiers in the soil and hence in the inocula was equal, our results indicate a greater robustness of nirK-type vs. nirS-type denitrifier communities to acidity.
Concluding Discussion
In this study of a model community, we linked transcriptional activation of denitrification genes (nirK, nirS, and nosZ) and growth of the communities to conversion of nitrogen oxides to N2. We found a pronounced succession of TADC and ODC in batch incubations even at neutral pH, suggesting a strong selective pressure on the extracted community. Exposure to low pH (5.4) resulted in (i) sequential and slightly enhanced transient accumulation of denitrification intermediates (NO, N2O), (ii) lower and/or retarded transcriptional activation of denitrification genes, together with selective activation of genotypes represented by certain T-RFs and (iii) impaired translation into functional enzymes, with consequences for growth of denitrifier communities. However, since only < 1% of added N accumulated as N2O and NO at low pH, and growth of nitrite- (nirK-type) and N2O-reducers was observed, we conclude that acid-tolerant denitrifier species maintained the functionality of the community as a whole although full conversion of nitrate to N2 required extended incubation periods. Experiments altering soil pH in situ or in laboratory experiments have repeatedly confirmed that denitrification rates and denitrifying enzyme activity are lower in acidic than in neutral or slightly alkaline soils (Šimek and Cooper, 2002).
Overall, our results show that different mechanisms may determine the response to low pH of a soil denitrifier community adapted to neutral pH:
(i) Activity and proliferation of nirK- and nosZ- but not of nirS-containing denitrifiers seemed to drive reduction of nitrogen oxides which in turn increased pH. Albeit not at the transcriptional level, growth of nirS-type denitrifiers was severely inhibited at low pH and occurred only during or after pH upshift. Acid pH has been repeatedly shown to impair nitrite and particularly N2O reduction in certain denitrifiers (e.g., P. denitrificans) (Baumann et al., 1997; Bergaust et al., 2010), in soils (Liu et al., 2014) and in cells extracted from soils (Liu et al., 2010), presumably by impairing the assembly of denitrification enzymes post-transcriptionally (Baumann et al., 1997; Bergaust et al., 2010). Here, we could show that expression of nirK in some denitrifiers may be affected as well.
(ii) These effects, however, might be compensated by acid-tolerant or acidophilic denitrifier species able to grow and actively denitrify at low pH. Denitrifiers of the nirK-type present in the native community of the soil seemed to tolerate a broad range of pH levels as the composition of the growing community remained unaltered during the incubation at low pH.
(iii) Low pH prompted growth of nosZ-containing denitrifiers of minor abundance in the native community that were acid-tolerant or even acidophilic. At low pH these nosZ-containing denitrifiers seem capable of functionally substituting N2O-reducers that were more prevalent in the native community. This agrees well with the functional redundancy hypothesis that distinct species perform similar roles in communities and ecosystems at different environmental conditions, and may therefore be substitutable with little impact on ecosystem processes (Rosenfeld, 2002).
Previous studies have shown that pH-dependent responses in denitrification product ratios in soils were related to the size and composition of the underlying denitrifier communities (Čuhel et al., 2010; Braker et al., 2012). Large variations have been found in the specific activity of e.g., nitrite reductases (50-fold) even between strains of the same species (Ka et al., 1997). The higher susceptibility of nirS-type denitrifiers to environmental stressors (e.g., low pH, low C-content) has been repeatedly reported in other studies (Bárta et al., 2010; Čuhel et al., 2010; He et al., 2010). The abundance of nirS was also most strongly affected when the pH of a grassland was lowered experimentally for about one year resulting in a high nosZ/nirS ratio while the nosZ/nirK ratio remained unaffected (Čuhel et al., 2010). Hence, long-term exposure to low pH in the natural environment will shape soil microbial communities and predetermine a dominance of either nirK or nirS (Chen et al., 2015). This strongly suggests that taxonomic composition matters for the capability of a soil denitrifier community to effectively denitrify. On the other hand, bulk soil pH is unlikely to be homogeneous in structured soils, probably providing a range of pH habitats distributed throughout the soil matrix. Thus, the occurrence of e.g., N2O reduction in acidic soils can be explained by denitrification activity in neutral microsites as proposed by Liu et al. (2014) or by acid-tolerant denitrifiers being present in neutral soils. Consequently, soil denitrifier communities might be comprised of taxa differing in pH sensitivity, which jointly emulate the kinetic response of a soil to pH change.
Conflict of Interest Statement
The authors declare that the research was conducted in the absence of any commercial or financial relationships that could be construed as a potential conflict of interest.
Acknowledgments
This work has been funded by the Max Planck Society. We are thankful to S. Brenzinger for valuable comments on the manuscript.
Supplementary Material
The Supplementary Material for this article can be found online at: http://journal.frontiersin.org/article/10.3389/fmicb.2015.00961
References
Bakken, L. R., Bergaust, L., Liu, B., and Frostegård, A. (2012). Regulation of denitrification at the cellular level: a clue to the understanding of N2O emissions from soils. Philos. Trans. R. Soc. Lond. B Biol. Sci. 367, 1226–1234. doi: 10.1098/rstb.2011.0321
Bárta, J., Melichová, T., Vaněìk, D., Picek, T., and Šantrůčková, H. (2010). Effect of pH and dissolved organic matter on the abundance of nirK and nirS denitrifiers in spruce forest soil. Biogeochemistry 101, 123–132. doi: 10.1007/s10533-010-9430-9
Baumann, B., van der Meer, J. R., Snozzi, M., and Zehnder, A. J. (1997). Inhibition of denitrification activity but not of mRNA induction in Paracoccus denitrificans by nitrite at a suboptimal pH. Antonie Van Leeuwenhoek 72, 183–189. doi: 10.1023/A:1000342125891
Bergaust, L., Mao, Y., Bakken, L. R., and Frostegård, Å. (2010). Denitrification response patterns during the transition to anoxic respiration and posttranscriptional effects of suboptimal pH on nitrogen oxide reductase in Paracoccus denitrificans. Appl. Environ. Microbiol. 76, 6387–6396. doi: 10.1128/AEM.00608-10
Billings, S. A., and Tiemann, L. K. (2014). Warming-induced enhancement of soil N2O efflux linked to distinct response times of genes driving N2O production and consumption. Biogeochemistry 119, 371–386. doi: 10.1007/s10533-014-9973-2
Braker, G., Dörsch, P., and Bakken, L. R. (2012). Genetic characterization of denitrifier communities with contrasting intrinsic functional traits. FEMS Microbiol. Ecol. 79, 542–554. doi: 10.1111/j.1574-6941.2011.01237.x
Braker, G., Fesefeldt, A., and Witzel, K. P. (1998). Development of PCR primer systems for amplification of nitrite reductase genes (nirK and nirS) to detect denitrifying bacteria in environmental samples. Appl. Environ. Microbiol. 64, 3769–3775.
Braker, G., Zhou, J., Wu, L., Devol, A. H., and Tiedje, J. M. (2000). Nitrite reductase genes (nirK and nirS) as functional markers to investigate diversity of denitrifying bacteria in Pacific Northwest marine sediment communities. Appl. Environ. Microbiol. 66, 2096–2104. doi: 10.1128/AEM.66.5.2096-2104.2000
Bru, D., Ramette, A., Saby, N. P. A., Dequiedt, S., Ranjard, L., Jolivet, C., et al. (2010). Determinants of the distribution of nitrogen-cycling microbial communities at the landscape scale. ISME J. 5, 532–542. doi: 10.1038/ismej.2010.130
Bürgmann, H., Widmer, F., Sigler, W. V., and Zeyer, J. (2003). mRNA extraction and reverse transcription-PCR protocol for detection of nifH gene expression by Azotobacter vinelandii in soil. Appl. Environ. Microbiol. 69, 1928–1935. doi: 10.1128/AEM.69.4.1928-1935.2003
Cavigelli, M. A., and Robertson, G. P. (2001). Role of denitrifier diversity in rates of nitrous oxide consumption in a terrestrial ecosystem. Soil Biol. Biochem. 33, 297–310. doi: 10.1016/S0038-0717(00)00141-3
Chen, H., Mothapo, N. V., and Shi, W. (2015). Soil moisture and pH control relative contributions of fungi and bacteria to N2O production. Microb. Ecol. 69, 180–191. doi: 10.1007/s00248-014-0488-0
Clarke, K. R. (1993). Non-parametric multivariate analyses of changes in community structure. Aust. J. Ecol. 18, 117–143. doi: 10.1111/j.1442-9993.1993.tb00438.x
Čuhel, J., Šimek, M., Laughlin, R. J., Bru, D., Chèneby, D., Watson, C. J., et al. (2010). Insights into the effect of soil pH on N2O and N2 emissions and denitrifier community size and activity. Appl. Environ. Microbiol. 76, 1870–1878. doi: 10.1128/AEM.02484-09
Dandie, C. E., Wertz, S., Leclair, C. L., Goyer, C., Burton, D. L., Patten, C. L., et al. (2011). Abundance, diversity and functional gene expression of denitrifier communities in adjacent riparian and agricultural zones. FEMS Microbiol. Ecol. 77, 69–82. doi: 10.1111/j.1574-6941.2011.01084.x
Deslippe, J. R., Jamali, H., Jha, N., and Saggar, S. (2014). Denitrifier community size, structure and activity along a gradient of pasture to riparian soils. Soil Biol. Biochem. 71, 48–60. doi: 10.1016/j.soilbio.2014.01.007
Dörsch, P., and Bakken, L. R. (2004). Low-temperature response of denitrification: comparison of soils. Eurasian Soil Sci. 37, 102–106.
Dörsch, P., Braker, G., and Bakken, L. R. (2012). Community-specific pH response of denitrification: experiments with cells extracted from organic soils. FEMS Microbiol. Ecol. 79, 530–541. doi: 10.1111/j.1574-6941.2011.01233.x
Dunbar, J., Ticknor, L. O., and Kuske, C. R. (2001). Phylogenetic specificity and reproducibility and new method for analysis of terminal restriction fragment profiles of 16S rRNA genes from bacterial communities. Appl. Environ. Microbiol. 67, 190–197. doi: 10.1128/AEM.67.1.190-197.2001
Fierer, N., and Jackson, R. B. (2006). The diversity and biogeography of soil bacterial communities. Proc. Natl. Acad. Sci. U.S.A. 103, 626–631. doi: 10.1073/pnas.0507535103
Green, S. J., Prakash, O., Gihring, T. M., Akob, D. M., Jasrotia, P., Jardine, P. M., et al. (2010). Denitrifying bacteria isolated from terrestrial subsurface sediments exposed to mixed-waste contamination. Appl. Environ. Microbiol. 76, 3244–3254. doi: 10.1128/AEM.03069-09
He, Z., Xu, M., Deng, Y., Kang, S., Kellogg, L., Wu, L., et al. (2010). Metagenomic analysis reveals a marked divergence in the structure of belowground microbial communities at elevated CO2. Ecol. Lett. 13, 564–575. doi: 10.1111/j.1461-0248.2010.01453.x
Henry, S., Baudoin, E., López-Gutiérrez, J. C., Martin-Laurent, F., Brauman, A., and Philippot, L. (2004). Quantification of denitrifying bacteria in soils by nirK gene targeted real-time PCR. J. Microbiol. Methods 59, 327–335. doi: 10.1016/j.mimet.2004.07.002
Henry, S., Bru, D., Stres, B., Hallet, S., and Philippot, L. (2006). Quantitative detection of the nosZ gene, encoding nitrous oxide reductase, and comparison of the abundances of 16S rRNA, narG, nirK, and nosZ genes in soils. Appl. Environ. Microbiol. 72, 5181–5189. doi: 10.1128/AEM.00231-06
Holtan-Hartwig, L., Dörsch, P., and Bakken, L. R. (2000). Comparison of denitrifying communities in organic soils: kinetics of NO−3 and N2O reduction. Soil Biol. Biochem. 32, 833–843 doi: 10.1016/S0038-0717(99)00213-8
Holtan-Hartwig, L., Dörsch, P., and Bakken, L. R. (2002). Low temperature control of soil denitrifying communities: kinetics of N2O production and reduction. Soil Biol. Biochem. 34, 1797–1806. doi: 10.1016/S0038-0717(02)00169-4
Jones, C. M., Graf, D. R. H., Bru, D., Philippot, L., and Hallin, S. (2013). The unaccounted yet abundant nitrous oxide-reducing microbial community: a potential nitrous oxide sink. ISME J. 7, 417–426. doi: 10.1038/ismej.2012.125
Jones, C. M., Spor, A., Brennan, F. P., Breuil, M. C., Bru, D., Lemanceau, P., et al. (2014). Recently identified microbial guild mediates soil N2O sink capacity. Nat. Clim. Change 4, 801–805. doi: 10.1038/nclimate2301
Ka, J. O., Urbance, J., Ye, R. W., Ahn, T. Y., and Tiedje, J. M. (1997). Diversity of oxygen and N-oxide regulation of nitrite reductases in denitrifying bacteria. FEMS Microbiol. Lett. 156, 55–60. doi: 10.1016/S0378-1097(97)00404-7
Kandeler, E., Deiglmayr, K., Tscherko, D., Bru, D., and Philippot, L. (2006). Abundance of narG, nirS, nirK, and nosZ genes of denitrifying bacteria during primary successions of a glacier foreland. Appl. Environ. Microbiol. 72, 5957–5962. doi: 10.1128/AEM.00439-06
Klemedtsson, K. Å., Weslien, P., and Klemedtsson, L. (2009). Methane and nitrous oxide fluxes from a farmed Swedish Histosol. Eur. J. Soil Sci. 60, 321–331. doi: 10.1111/j.1365-2389.2009.01124.x
Liu, B., Frostegård, Å., and Bakken, L. R. (2014). Impaired reduction of N2O to N2 in acid soils is due to a posttranscriptional interference with the expression of nosZ. mBio 5:e01383-14. doi: 10.1128/mBio.01383-14
Liu, B., Mørkved, P. T., Frostegård, A., and Bakken, L. R. (2010). Denitrification gene pools, transcription and kinetics of NO, N2O and N2 production as affected by soil pH. FEMS Microbiol. Ecol. 72, 407–417. doi: 10.1111/j.1574-6941.2010.00856.x
Molstad, L., Dörsch, P., and Bakken, L. R. (2007). Robotized incubation system for monitoring gases (O2, NO, N2O, N2) in denitrifying cultures. J. Microbiol. Methods 71, 202–211. doi: 10.1016/j.mimet.2007.08.011
Morales, S. E., Cosart, T., and Holben, W. E. (2010). Bacterial gene abundances as indicators of greenhouse gas emission in soils. ISME J. 4, 799–808. doi: 10.1038/ismej.2010.8
Nömmik, H. (1956). Investigations on denitrification in soil. Acta Agric. Scand. 6, 195–228. doi: 10.1080/00015125609433269
Oksanen, J., Blanchet, G. F., Kindt, R., Legendre, R., Minchin, P. R., O'Hara, R. B., et al. (2012). vegan: Community Ecology Package version 2.0–5. Available online at: http://cran.r-project.org/web/packages/vegan/index.html
Palmer, K., Drake, H. L., and Horn, M. A. (2010). Association of novel and highly diverse acid-tolerant denitrifiers with N2O fluxes of an acidic fen. Appl. Environ. Microbiol. 76, 1125–1134. doi: 10.1128/AEM.02256-09
Philippot, L., Andert, J., Jones, C. M., Bru, D., and Hallin, S. (2011). Importance of denitrifiers lacking the genes encoding the nitrous oxide reductase for N2O emissions from soil. Glob. Chang. Biol. 17, 1497–1504. doi: 10.1111/j.1365-2486.2010.02334.x
Pratscher, J., Dumont, M. G., and Conrad, R. (2011). Ammonia oxidation coupled to CO2 fixation by archaea and bacteria in an agricultural soil. Proc. Natl. Acad. Sci. U.S.A. 108, 4170–4175. doi: 10.1073/pnas.1010981108
R Development Core Team. (2013). R: A Language and Environment for Statistical Computing. Vienna: R Foundation for Statistical Computing. Available online at: http://www.R-project.org/
Rosenfeld, J. S. (2002). Functional redundancy in ecology and conservation. Oikos 98, 156–162. doi: 10.1034/j.1600-0706.2002.980116.x
Sanford, R. A., Wagner, D. D., Wu, Q., Chee-Sanford, J. C., Thomas, S. H., Cruz-García, C., et al. (2012). Unexpected nondenitrifier nitrous oxide reductase gene diversity and abundance in soils. Proc. Natl. Acad. Sci. USA 109, 19709–19714. doi: 10.1073/pnas.1211238109
Scala, D. J., and Kerkhof, L. J. (1998). Nitrous oxide reductase (nosZ) gene-specific PCR primers for detection of denitrifiers and three nosZ genes from marine sediments. FEMS Microbiol. Lett. 162, 61–68. doi: 10.1111/j.1574-6968.1998.tb12979.x
Šimek, M., and Cooper, J. E. (2002). The influence of soil pH on denitrification: progress towards the understanding of this interaction over the last 50 years. Eur. J. Soil Sci. 53, 345–354. doi: 10.1046/j.1365-2389.2002.00461.x
Van den Heuvel, R. N., Bakker, S. E., Jetten, M. S. M., and Hefting, M. M. (2011). Decreased N2O reduction by low soil pH causes high N2O emissions in a riparian ecosystem. Geobiology 9, 294–300. doi: 10.1111/j.1472-4669.2011.00276.x
Verbaendert, I., Hoefman, S., Boeckx, P., Boon, N., and De Vos, P. (2014). Primers for overlooked nirK, qnorB, and nosZ genes of thermophilic Gram-positive denitrifiers. FEMS Microbiol. Ecol. 89, 162–180. doi: 10.1111/1574-6941.12346
Weslien, P., Kasimir Klemedtsson, Å., Börjesson, G., and Klemedtsson, L. (2009). Strong pH influence on N2O and CH4 fluxes from forested organic soils. Eur. J. Soil Sci. 60, 311–320. doi: 10.1111/j.1365-2389.2009.01123.x
Keywords: pH, N2O, denitrification, nosZ, nirK, nirS, transcriptionally active, extracted cells
Citation: Brenzinger K, Dörsch P and Braker G (2015) pH-driven shifts in overall and transcriptionally active denitrifiers control gaseous product stoichiometry in growth experiments with extracted bacteria from soil. Front. Microbiol. 6:961. doi: 10.3389/fmicb.2015.00961
Received: 13 February 2015; Accepted: 31 August 2015;
Published: 24 September 2015.
Edited by:
Marcus A. Horn, University of Bayreuth, GermanyReviewed by:
Angela Kent, University of Illinois at Urbana-Champaign, USAStefan J. Green, University of Illinois at Chicago, USA
Copyright © 2015 Brenzinger, Dörsch and Braker. This is an open-access article distributed under the terms of the Creative Commons Attribution License (CC BY). The use, distribution or reproduction in other forums is permitted, provided the original author(s) or licensor are credited and that the original publication in this journal is cited, in accordance with accepted academic practice. No use, distribution or reproduction is permitted which does not comply with these terms.
*Correspondence: Gesche Braker, Kiel University, Christian-Albrechts-Platz 4, 24118 Kiel, Germany, gbraker@uv.uni-kiel.de