 Joanna Szczepaniak
 Marcin Łukaszewicz
 Anna Krasowska
- Faculty of Biotechnology, University of Wroclaw, Wroclaw, Poland
We present a fluorometric method for determining ABC transporter activity in the pathogenic fungus C. albicans during different growth phases and in response to glucose. The carbocyanine dye diS-C3(3) was previously used to monitor plasma membrane potentials and test the influence of surface-active compounds in membrane polarization. We used diS-C3(3) to show changes in fluorescence kinetics that reflect changes in the activity of ABC transporters in C. albicans growth. Cdr1-GFP fluorescence, revealed that Cdr1p relocates to the inside of the cell after the early-log growth phase. Addition of glucose to the cell suspension resulted in Cdr1p transporter expression in the CDR2-knockout strain. We confirmed the diS-C3(3) results by standard RT-PCR and Western blotting.
Introduction
Candida albicans normally occurs as a relatively harmless organism in the human microbiome (Koh, 2013); however, C. albicans infection can be triggered by various perturbations in homeostasis, such as compromised immune defense or breaks in the epithelium–blood barriers due to injury or surgery. Interestingly, the risk of infection is also increased in diabetic patients (Perlroth et al., 2007), possibly due to the dramatic effects of glucose on C. albicans’ metabolism (Brown et al., 2014) that increase virulence and drug resistance (Rodaki et al., 2009; Ene et al., 2012; Mandal et al., 2014). Moreover, Mandal et al. (2014) found that glucose selectively interacts with commonly used antifungal agents by forming complexes via hydrogen bonding, which, in turn, lowers their efficacy. The growing number of C. albicans strains resistant to pharmaceuticals is decreasing the already low number of drugs available to treat candidiasis. Due to C. albicans’ multiple mechanisms to adapt to and resist drugs, new experimental approaches must be developed to define the in vivo and/or real-time behaviors of individual cells (Brown et al., 2014). Many of C. albicans’ adaptations and resistance mechanisms are related to the supramolecular structure formed by the cell wall and plasma membrane. Active transport through the plasma membrane is driven by transporters powered by high energy compounds, such as ATP, and/or membrane potential (Cannon et al., 2009). Thus, it is very important to develop methods to directly monitor drug transporters and plasma membrane-related activity in C. albicans.
Candida albicans’ drug transporters were previously investigated via heterologous expression in Saccharomyces cerevisiae, but growing evidence indicates that C. albicans’ metabolism is different from that of S. cerevisiae, especially in terms of major transcriptional modifications and resistance to osmotic stress and antifungal drugs (Garreau et al., 2000; Gasch et al., 2000; Ene et al., 2012; Szczepaniak et al., 2015). Glucose, for example, enhances oxidative stress resistance in C. albicans but decreases stress resistance in S. cerevisiae (Garreau et al., 2000; Gasch et al., 2000). Therefore, it is very important to account for many factors when looking for new, efficient treatment strategies of candidiasis.
We developed a fluorescence method that allows in vivo real-time monitoring of the activity of C. albicans’ drug efflux pumps, Cdr1p, and Cdr2p, using a 3,3′-dipropylthiadicarbocyanine (diS-C3(3)) probe (Szczepaniak et al., 2015). The method is based on the property of diS-C3(3) to increase AAAmax after binding to cell constituents (mostly proteins); since the maximum fluorescence wavelength of the bound probe is about 10 nm higher than that of the free probe in solution, it allows us to observe its accumulation in cells and thereby monitor the actions of the probe-expelling pumps. This method also allows us to examine membrane potential differences in S. cerevisiae based on the changes of the fluorescence spectra of diS-C3(3) from equilibrium (Plášek et al., 2012). In this work, we used diS-C3(3) to assess the scope of C. albicans ABC transporter activity in response to membrane potential changes and glucose.
Materials and Methods
Strains and Growth Media
The C. albicans strains used in this study (Table 1) were generous gifts from D. Sanglard (Lausanne, Switzerland). All strains were grown at 28°C on YPD medium with 2% glucose, 1% Bacto peptone (Difco), and 1% yeast extract (Difco) with shaking at 120 rpm. Solid medium was supplemented with 2% agar.
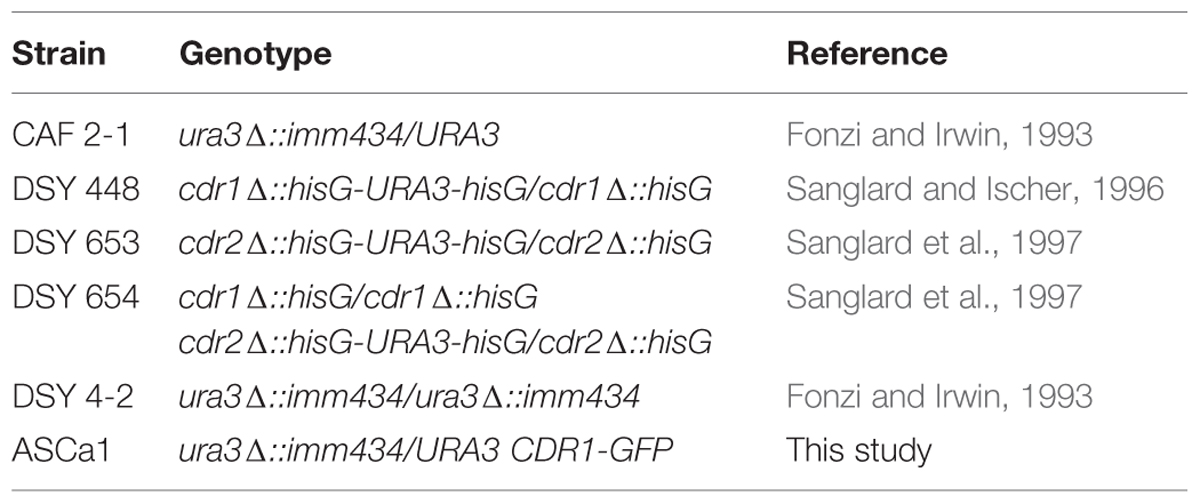
TABLE 1. Candida albicans strains used in this study.
Strain Construction
Strain ASCa1 was constructed by integration of the CDR1-GFP-URA3 cassette into the chromosomal locus of CDR1 in the CAF 4-2 strain, as described by Gerami-Nejad et al. (2001). CDR1-specific sequences were added to universal primers to generate primers AS001 and AS003. We used primers AS003 and AS004 to verify integration into the chromosomal locus of CDR1 (Table 2).
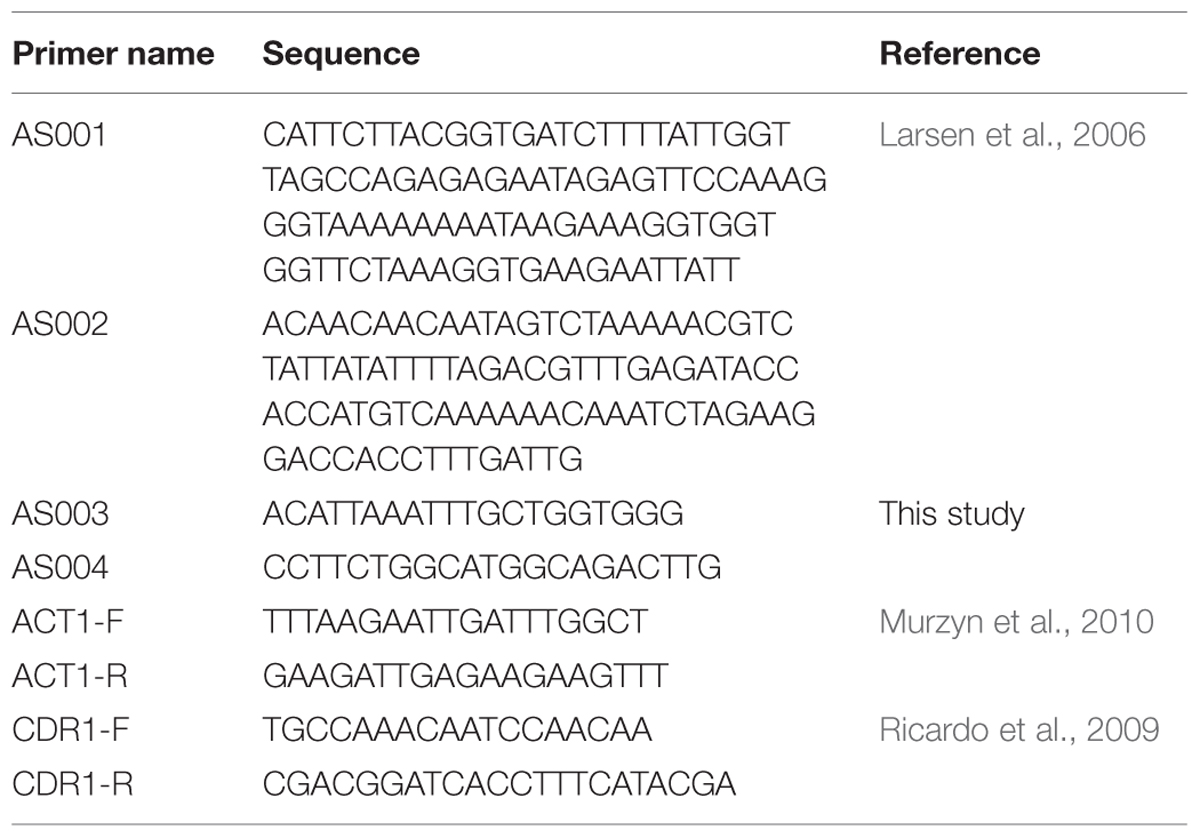
TABLE 2. Primers used in this study.
Sample Preparation
Cells were prepared according to the method of Gásková et al. (1998), with modifications. One hundred and fifty microliter of overnight, stationary culture were added to 20 ml of fresh YPD medium and incubated at 28°C with shaking at 120 rpm for 10, 14, or 24 h. The cells were then harvested by centrifuging at 110 × g for 3 min, washing twice with deionised water, and resuspending in citrate-phosphate (CP) buffer (pH 6.0) at OD600 = 0.1.
DiS-C3(3) Uptake into Cells
Samples (3 ml, OD600 = 0.1) were labeled with diS-C3(3) at a final concentration of 5×10⁻⁸ M at room temperature. Fluorescence spectra were measured every 4 min for 120 min, with gentle stirring before each measurement, on a Fluorescence Spectrophotometer (HITACHI F-4500) equipped with a xenon lamp. The excitation wavelength was 531 nm and the fluorescence range was 560–590 nm. Scattered light was eliminated by an amber glass filter with a cut-off wavelength of 540 nm. If indicated, glucose was added at a final concentration of 2%.
Microscopy Studies
Strains were grown for 24 h in YPD medium at 28°C with shaking at 120 rpm. At indicated times, aliquots of cell culture were pelleted by centrifuging, washed in deionised water, and 4 μl of samples were visualized with a ZEISS AXIO IMAGER.A2.
Real-time PCR
The assay was prepared from samples (5 ml, OD600 = 0.4) after staining with 2×10⁻⁷ M diS-C3(3) probe for 40, 72, or 96 min, with 2% glucose added after 60 min if indicated. Aliquots of cell suspensions were pelleted by centrifuging at 2260 × g for 5 min. Cells were resuspended in lysis buffer (1 M sorbitol, 0.1 M EDTA, 1% β-mercaptoethanol, 2.5 mg/ml zymolyase), incubated at 37°C for 30 min, and centrifuged at 2834 × g. Total RNA was extracted using a Total RNA Mini kit (A&A Biotechnology) according to the manufacturer’s instructions. The purity and concentration of RNA samples were determined from A260/A280 readings and RNA integrity was checked by electrophoresis. Samples were treated with DNAse I (Fermentas) to remove genomic DNA contamination. The cDNA was synthesized using 0.5 μg RNA with a High-Capacity cDNA Reverse Transcription Kit (Applied Biosystems). Real-time PCR reactions with performed with a DyNAmo HS SYBR Green qPCR Kit (Thermo Scientific) and a 7500 Real-Time PCR System (Applied Biosystems). Gene-specific primers for actin (ACT1-F and ACT1-R) and CDR1 (CDR1-F and CDR1-R) were used. The thermal cycling conditions consisted of the initial step at 50°C for 2 min, then 95°C for 10 min, followed by 35 cycles at 95°C for 20 s, 45°C for 20 s, and 72°C for 30 s. The gene expression level of the wild-type strain at 40 min of incubation, relative to that of the other time points, was calculated using the formula 2-ΔΔCT.
Western Blotting
The assay was performed according to the method of Hiller et al. (2006), with modifications. Crude protein extract was prepared from samples (5 ml, OD600 = 0.4) after staining with 2×10⁻⁷ M diS-C3(3) probe for 10, 40, 72, or 96 min, with 2% glucose added after 60 min if indicated. Aliquots of cell suspensions were pelleted by centrifuging at 2260 × g for 5 min and resuspended in 1 ml of deionised water. Cells were lysed by the addition of 150 μl of 1.85 M NaOH-7.5% β-mercaptoethanol and incubated on ice for 10 min. Proteins were precipitated by the addition of 150 μl of 50% trichloroacetic acid and incubated on ice for 10 min. Samples were then centrifuged at 10,000 × g for 5 min at 4°C, washed in 1 ml of 1 M Tris-HCl (pH 8.0), and resuspended in 20 μl sample buffer (40 mM Tris-HCl, 8 M urea, 5% SDS, 0.1 mM EDTA, 1% β-mercaptoethanol, 0.1 mg/ml bromophenol blue), followed by incubation at 37°C for 30 min. Five microliter of protein extract were loaded in a 10% sodium dodecyl sulfate-polyacrylamide gel and electrophoresed in a Mini-PROTEAN II electrophoresis cell (Bio-Rad). After the electrophoresis, the samples were transferred onto a nitrocellulose membrane using a Mini-PROTEAN Tetra System electrophoresis cell (Bio-Rad). The membranes were stained with Ponceau S to check for equal loading of the gels. Immunodetection of Cdr1p was performed using a polyclonal rabbit anti-Cdr1p antiserum (a generous gift from D. Sanglard, Lausanne, Switzerland) and horseradish peroxidase-conjugated anti-rabbit antiserum as a secondary antibody. Signals were detected using an ECL kit from PerkinElmer according to the manufacturer’s instructions.
Results and Discussion
Membrane Potential, as Measured by diS-C3(3) Fluorescence, is a Factor in ABC Transporter Activity During Phases of C. albicans Growth
As indicated by Plášek et al. (2012) and Plášek and Gášková (2013), diS-C3(3) is a suitable probe to monitor real-time changes in plasma membrane potential; here, we are the first to describe this use in C. albicans. To monitor the changes we measured the fluorescence AAAmax in the strain without ABC transporters to remove their effect on probe efflux. Probe accumulation took only 30 min in the early log-phase but took 60 and 50 min, respectively, to accumulate after 14 and 24 h in culture (Figure 1). As cultures age, the cells and the structure and function of their membranes change. The kinetics of diS-C3(3) fluorescence (Figure 1) reflect changes in the membrane potential of cells in different phases of growth. An age-induced reduction in membrane potential correlates with decreased polarization (Kumar et al., 2015). Cell membrane depolarisation can cause lateral redistribution of membrane proteins (Grossmann et al., 2007). Kumar et al. (2015) found that membrane fluidity contributes to drug diffusion and resistance. Higher membrane fluidity can lead to incorrect localization of the Cdr1p pump and thus lack of Cdr1p activity. The C. albicans strain with CDR1 overexpression and drug resistance had a more rigid membrane than the drug-sensitive strain; this rigidity increased until the late-log phase of growth. On the other hand, the wild-type C. albicans SC5314 increased the fluidity of its membrane during growth. In the C. albicans mutants with deletion of a key component required during the biogenesis of mitochondria, decreases in the cellular ergosterol level and mis-sorting of Cdr1p into vacuoles were observed (Thomas et al., 2013). Similar effects were observed in the S. cerevisiae strain expressing C. albicans CDR1 with deletions in the genes involved in ergosterol synthesis (Pasrija et al., 2008). Mukhopadhyay et al. (2004) found that Cdr1p dislocated from the cell membrane after incubating Saccharomyces cells with filipin, which interacts with the 3-hydroxyl group of membrane sterols. In this study, we observe that the Cdr1p pump fused with GFP is located in the plasma membrane in the early logarithmic phase (Figure 1A). Starting from the 14 h late log-phase, the movement of Cdr1p from the membrane to inside the cells becomes noticeable; strong fluorescence can be observed there in the stationary phase of growth (Figures 1B,C), although we do not see drop in pumps activity.
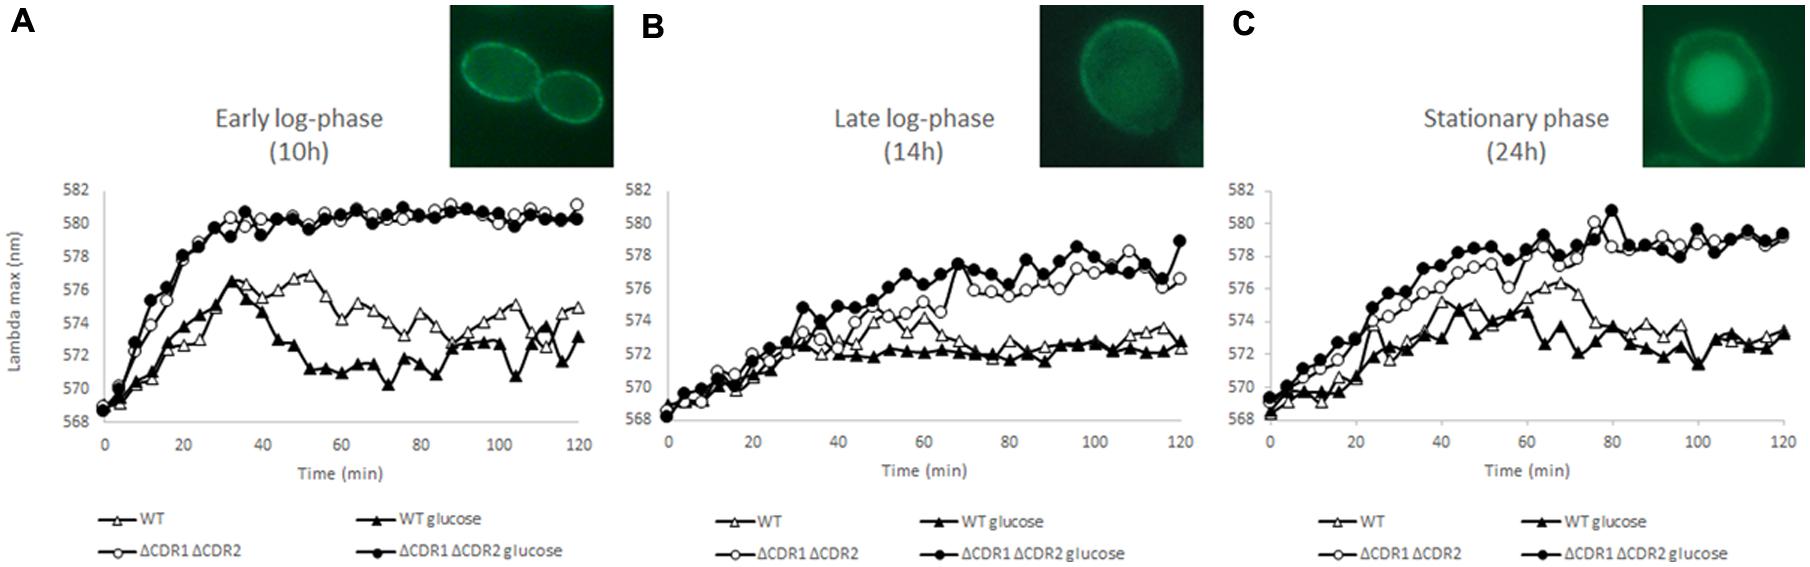
FIGURE 1. DiS-C3(3) fluorescence staining of wild-type and CDR1Δ CDR2Δ strains during early log-phase (A), late log-phase (B), and stationary phase (C). 2% glucose was added at the start of the experiment (n = 3). Pictures: Cdr1-GFP localization during (A–C).
Glucose Causes de Novo Synthesis of Cdr1p in CDR2Δ
The most important factor in the activity of ABC transporters is ATP energy. C. albicans is a Crabtree-negative yeast and retains respiratory activity during growth at high glucose concentrations. Cdr1p and Cdr2p are up-regulated in the presence of glucose and this process probably increases resistance to azoles (Rodaki et al., 2009). To see if diS-C3(3) export can be facilitated by glucose we added it at the beginning of the experiment. In the early log-phase of growth (Figure 1A) glucose promotes dye efflux but this effect fades in further stages of culture (14 h late-log and 24 h stationary phase; Figures 1B,C). Interestingly the most marked change could be observed in cdr2Δ strain (Figure 2B). In the experiment without glucose CDR1 pump was inactive (Figure 2B) and the difference in AAAmax between it and after the addition of glucose was more pronounced than in the strain with both pumps (Figures 2A,B). This fact indicates that Cdr2p actively participates in removing diS-C3(3) from the fungal cells.
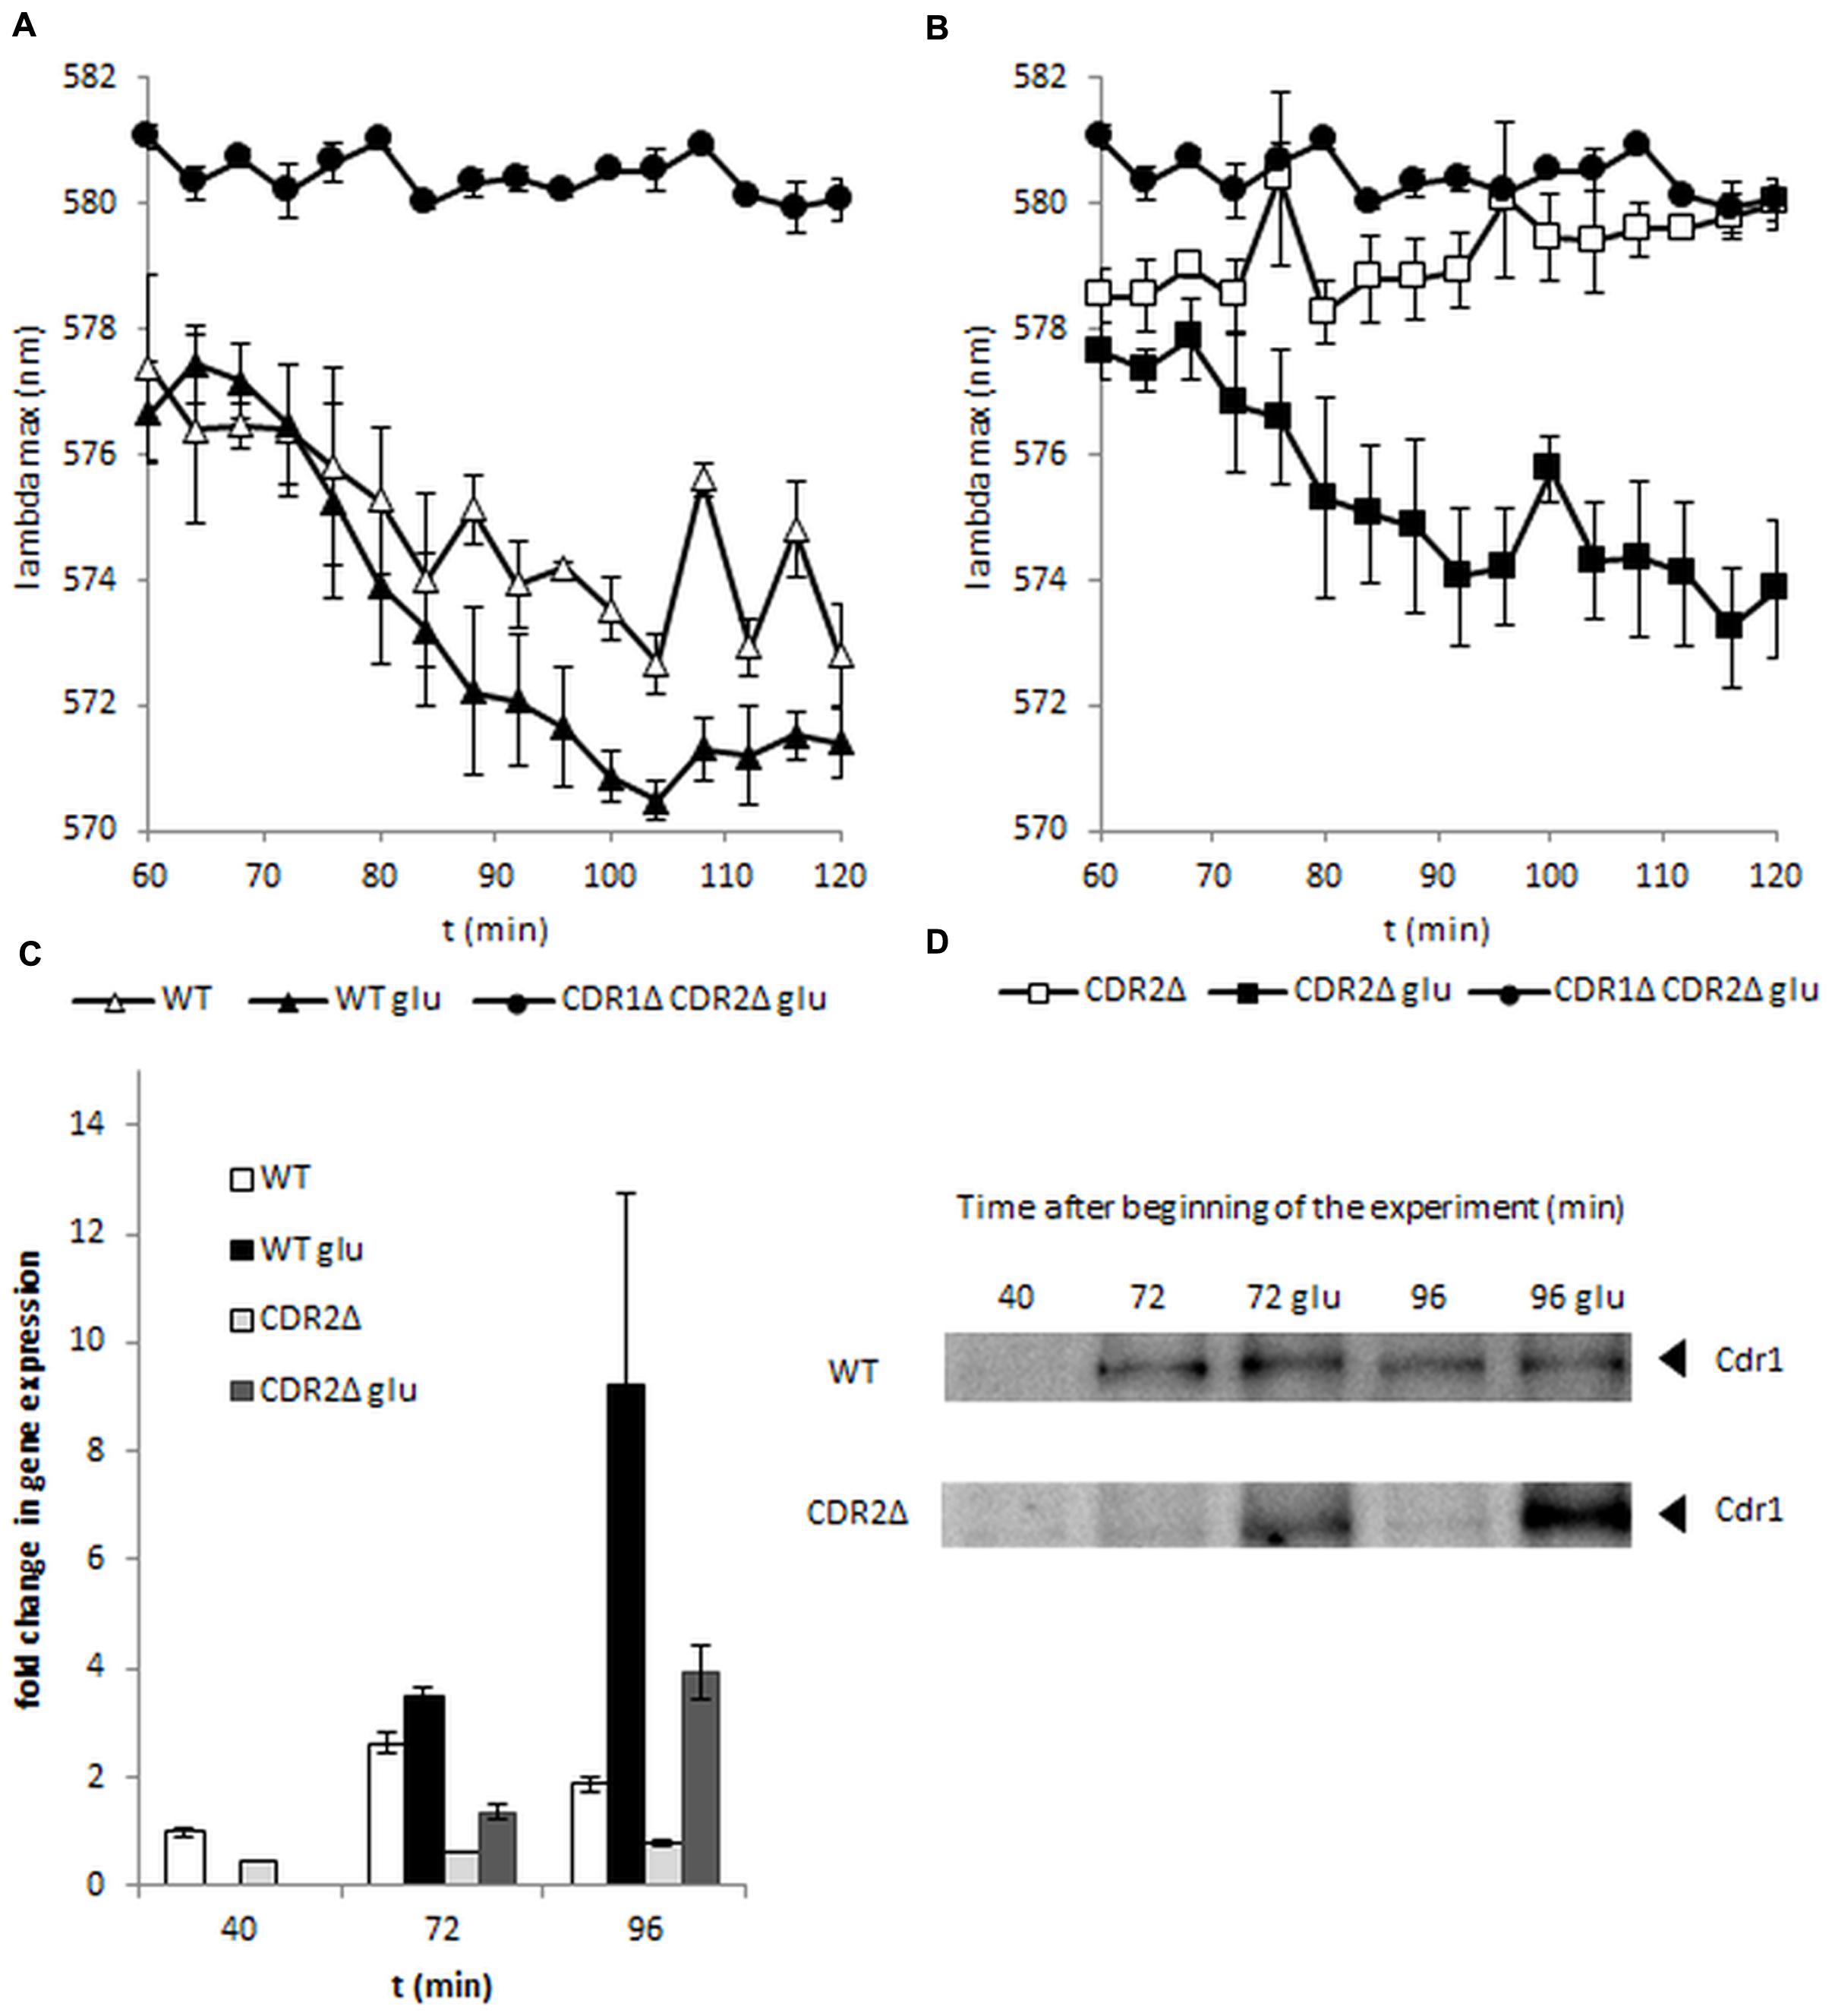
FIGURE 2. DiS-C3(3) fluorescence staining of wild-type (A) and CDR2Δ (B) strains during early log-phase. Glucose was added after 60 min of staining. (C) Expression of CDR1 during the experiment. Samples were taken at 40, 72, or 96 min from the beginning of the experiment. (D) Cdr1 protein levels during the experiment. Samples were taken at 40, 72, or 96 min from the beginning of the experiment (n = 3).
We used standard molecular methods to assess if the increased activity of Cdr1 under the influence of glucose was due to pump activation or pump overexpression. As shown in Figure 2D, western blot showed high levels of Cdr1 protein after induction of glucose in a strain lacking Cdr2p, whereas Cdr1p was observed at very low levels in control conditions (Figure 2D). In contrast, in the wild-type strain, Cdr1p was detected after 72 min but the level of this protein appeared to be the same, regardless of whether glucose was added (Figure 2D); this was reflected in both strains’ diS-C3(3) efflux. As shown in Figure 2C, cdr2Δ expresses CDR1 continuously at a very low level. Glucose addition in cdr2Δ causes a twofold increase in CDR1 expression after 12 min and fourfold increase after 36 min. Interestingly, under the same conditions in the wild-type strain, CDR1 transcript level change is not detectable at 12 min after addition of glucose; after 36 min we observe a fivefold increase in transcript which do not correlate with protein level at this time point. This delayed response of wild-type strain to glucose may be a natural lag in between the gene expression and protein levels. Although cdr2Δ faster reaction could be a result of this strain need to complement deleted CDR2. Both gene expression and Western blotting suggested that glucose caused de novo synthesis of the Cdr1 pump in C. albicans cdr2Δ.
ABC transporter upregulation in C. albicans can be caused by antifungal drugs (Henry et al., 1999; Coste et al., 2004; Schneider and Morschhäuser, 2015), antibiotics (Vogel et al., 2008), or human steroid hormones (Larsen et al., 2006; Banerjee et al., 2007). C. albicans is a human pathogen; environmental glucose may be another sign that yeast cells have entered the bloodstream and to adapt express a virulence phenotype. One of the virulence factors of C. albicans, its ability to form hyphal forms, can be triggered by addition of serum to cultures at 37°C (Hudson et al., 2004). The active component starting this process is glucose; changes in C. albicans transcriptome, including CDR1 and CDR2 (Rodaki et al., 2009), start as early as 30 min after the addition of no more than 0.01% glucose – a concentration much lower than that in human serum (0.06–0.1%). Our results using diS-C3(3) also suggest that activation of Cdr1p under the influence of glucose results in overexpression of this pump, especially in case where CDR2 is deleted.
Conclusion
In this study, we showed that the diS-C3(3) carbocyanine probe can be used as a multipurpose fluorescent assay.
• DiS-C3(3) can be used to assess both membrane polarization and ABC transporter activity in C. albicans.
• Increase of the export diS-C3(3) by glucose depends on growth phase and is the strongest at the beginning of the log-phase.
• In case of cdr2Δ strain observed increase in diS-C3(3) export is caused de novo synthesis of Cdr1p.
Author Contributions
JS execution of experiments; ML conceptual work; AK conceptual work and and writing publication.
Funding
This work was supported by Wroclaw Centre of Biotechnology, programme: The Leading National Research Centre (KNOW) for years 2014–2018.
Conflict of Interest Statement
The authors declare that the research was conducted in the absence of any commercial or financial relationships that could be construed as a potential conflict of interest.
Acknowledgments
We thank Prof. Dominique Sanglard for kindly providing C. albicans strains and antibodies and Prof. Cheryl Gale and Fungal Genetics Stock Center for GFP plasmid.
References
Banerjee, D., Martin, N., Nandi, S., Shukla, S., Dominguez, A., Mukhopadhyay, G., et al. (2007). A genome-wide steroid response study of the major human fungal pathogen Candida albicans. Mycopathologia 164, 1–17. doi: 10.1007/s11046-007-9025-8.
Brown, A. J. P., Brown, G. D., Netea, M. G., and Gow, N. A. R. (2014). Metabolism impacts upon Candida immunogenicity and pathogenicity at multiple levels. Trends Microbiol. 22, 614–622. doi: 10.1016/j.tim.2014.07.001
Cannon, R. D., Lamping, E., Holmes, A. R., Niimi, K., Baret, P. V., Keniya, M. V., et al. (2009). Efflux-mediated antifungal drug resistance. Clin. Microbiol. Rev. 22, 291–321. doi: 10.1128/CMR.00051-58
Coste, A. T., Karababa, M., Bille, J., and Sanglard, D. (2004). TAC1, transcriptional activator of CDR genes, is a new transcription factor involved in the regulation of Candida albicans ABC Transporters CDR1 and CDR2 †. Eukaryot Cell 3, 1639–1652. doi: 10.1128/EC.3.6.1639
Ene, I. V., Adya, A. K., Wehmeier, S., Brand, A. C., Maccallum, D. M., Gow, N. A. R., et al. (2012). Host carbon sources modulate cell wall architecture, drug resistance and virulence in a fungal pathogen. Cell. Microbiol. 14, 1319–1335. doi: 10.1111/j.1462-5822.2012.01813.x
Fonzi, W., and Irwin, M. (1993). Isogenic strain construction and gene mapping in Candida albicans. Genetics 134, 717–728.
Garreau, H., Hasan, R. N., Renault, G., Estruch, F., Boy-Marcotte, E., and Jacquet, M. (2000). Hyperphosphorylation of Msn2p and Msn4p in response to heat shock and the diauxic shift is inhibited by cAMP in Saccharomyces cerevisiae. Microbiology 146, 2113–2120. doi: 10.1099/00221287-146-9-2113
Gasch, A. P., Spellman, P. T., Kao, C. M., Carmel-Harel, O., Eisen, M. B., Storz, G., et al. (2000). Genomic expression programs in the response of yeast cells to environmental changes. Mol. Biol. Cell 11, 4241–4257. doi: 10.1091/mbc.11.12.4241
Gásková, D., Brodská, B., Herman, P., Vecer, J., Malínský, J., Sigler, K., et al. (1998). Fluorescent probing of membrane potential in walled cells: diS-C3(3) assay in Saccharomyces cerevisiae. Yeast 14, 1189–97. doi: 10.1002/(SICI)1097-0061(19980930)14:13<1189::AID-YEA320>3.0.CO;2-K
Gerami-Nejad, M., Berman, J., and Gale, C. A. (2001). Cassettes for PCR-mediated construction of green, yellow, and cyan fluorescent protein fusions in Candida albicans. Yeast 18, 859–864. doi: 10.1002/yea.738
Grossmann, G., Opekarová, M., Malinsky, J., Weig-Meckl, I., and Tanner, W. (2007). Membrane potential governs lateral segregation of plasma membrane proteins and lipids in yeast. EMBO J. 26, 1–8. doi: 10.1038/sj.emboj.7601466
Henry, K. W., Cruz, M. C., Katiyar, S. K., and Edlind, T. D. (1999). Antagonism of azole activity against Candida albicans following induction of multidrug resistance genes by selected antimicrobial agents. Antimicrob. Agents Chemother. 43, 1968–1974.
Hiller, D., Sanglard, D., and Morschhäuser, J. (2006). Overexpression of the MDR1 gene is sufficient to confer increased resistance to toxic compounds in Candida albicans. Antimicrob. Agents Chemother. 50, 1365–1371. doi: 10.1128/AAC.50.4.1365-1371.2006
Hudson, D. A., Sciascia, Q. L., Sanders, R. J., Norris, G. E., Edwards, P. J. B., Sullivan, P. A., et al. (2004). Identification of the dialysable serum inducer of germ-tube formation in Candida albicans. Microbiology 150, 3041–3049. doi: 10.1099/mic.0.27121-27120
Koh, A. Y. (2013). Gastrointestinal colonization of fungi. Curr. Fungal Infect. Rep. 7, 144–151. doi: 10.1007/s12281-013-0133-2
Kumar, A., Radhakrishnan, V. S., Singh, R., Kumar, M., Mishra, N. N., and Prasad, T. (2015). “A clinical resistant isolate of opportunistic fungal pathogen, Candida albicans revealed more rigid membrane than its isogenic sensitive isolate,” in Multidisciplinary Approaches for Studying and Combating Microbial Pathogens, ed. A. Méndez-Vilas (Boca Raton, FL: BrownWalker Press), 1–7.
Larsen, B., Anderson, S., Brockman, A., Essmann, M., and Schmidt, M. (2006). Key physiological differences in Candida albicans CDR1 induction by steroid hormones and antifungal drugs. Yeast 23, 795–802.
Mandal, S. M., Mahata, D., Migliolo, L., Parekh, A., Addy, P. S., Mandal, M., et al. (2014). Glucose directly promotes antifungal resistance in the fungal pathogen Candida spp. J. Biol. Chem. 289, 25468–25473. doi: 10.1074/jbc.C114.571778
Mukhopadhyay, K., Prasad, T., Saini, P., Pucadyil, J., Chattopadhyay, A., Prasad, R., et al. (2004). Membrane sphingolipid-ergosterol interactions are important determinants of multidrug resistance in Candida albicans membrane sphingolipid-ergosterol interactions are important determinants of multidrug resistance in Candida albicans. Antimicrob. Agents Chemother. 48, 1778–1787. doi: 10.1128/AAC.48.5.1778
Murzyn, A., Krasowska, A., Stefanowicz, P., Dziadkowiec, D., and Łukaszewicz, M. (2010). Capric acid secreted by S. boulardii inhibits C. albicans filamentous growth, adhesion and biofilm formation. PLoS ONE 5:e12050. doi: 10.1371/journal.pone.0012050
Pasrija, R., Panwar, S. L., and Prasad, R. (2008). Multidrug transporters CaCdr1p and CaMdr1p of Candida albicans display different lipid specificities: both ergosterol and sphingolipids are essential for targeting of CaCdr1p to membrane rafts. Antimicrob. Agents Chemother. 52, 694–704. doi: 10.1128/AAC.00861-867
Perlroth, J., Choi, B., and Spellberg, B. (2007). Nosocomial fungal infections: epidemiology, diagnosis, and treatment. Med. Mycol. 45, 321–346. doi: 10.1080/13693780701218689
Plášek, J., and Gášková, D. (2013). Complementary methods of processing diS-C3(3) fluorescence spectra used for monitoring the plasma membrane potential of yeast: their pros and cons. J. Fluoresc. 24, 1–7. doi: 10.1007/s10895-013-1323-6
Plášek, J., Gášková, D., Lichtenberg-Fraté, H., Ludwig, J., and Höfer, M. (2012). Monitoring of real changes of plasma membrane potential by diS-C3(3) fluorescence in yeast cell suspensions. J. Bioenerg. Biomembr. 44, 559–569. doi: 10.1007/s10863-012-9458-8
Ricardo, E., Costa-de-Oliveira, S., Dias, A. S., Guerra, J., Rodrigues, A. G., and Pina-Vaz, C. (2009). Ibuprofen reverts antifungal resistance on Candida albicans showing overexpression of CDR genes. FEMS Yeast Res. 9, 618–625. doi: 10.1111/j.1567-1364.2009.00504.x
Rodaki, A., Bohovych, I. M., Enjalbert, B., Young, T., Odds, F. C., Gow, N. A. R., et al. (2009). Glucose promotes stress resistance in the fungal pathogen Candida albicans. Mol. Biol. Cell 20, 4845–4855. doi: 10.1091/mbc.E09-01-0002
Sanglard, D., and Ischer, F. (1996). Susceptibilities of Candida albicans multidrug transporter mutants to various antifungal agents and other metabolic inhibitors. Antimicrob. Agents Chemother. 40, 2300–2305.
Sanglard, D., Ischer, F., Monod, M., and Bille, J. (1997). Cloning of Candida albicans genes conferring resistance to azole antifungal agents: characterization of CDR2, a new multidrug ABC transporter gene. Microbiology 143, 405–416. doi: 10.1099/00221287-143-2-405
Schneider, S., and Morschhäuser, J. (2015). Induction of Candida albicans drug resistance genes by hybrid zinc cluster transcription factors. Antimicrob. Agents Chemother. 59, 558–569. doi: 10.1128/AAC.04448-4414
Szczepaniak, J., Łukaszewicz, M., and Krasowska, A. (2015). Detection of inhibitors of Candida albicans Cdr transporters using a diS-C3(3) fluorescence. Front. Microbiol. 6:176. doi: 10.3389/fmicb.2015.00176
Thomas, E., Roman, E., Claypool, S., Manzoor, N., Pla, J., and Panwar, S. L. (2013). Mitochondria influence CDR1 efflux pump activity, Hog1-mediated oxidative stress pathway, iron homeostasis, and ergosterol levels in Candida albicans. Antimicrob. Agents Chemother. 57, 5580–5599. doi: 10.1128/AAC.00889-813
Keywords: diS-C3(3) fluorescence, protein localization imaging, kinetics of efflux pump activity, Candida albicans, CDR
Citation: Szczepaniak J, Łukaszewicz M and Krasowska A (2015) Estimation of Candida albicans ABC Transporter Behavior in Real-Time via Fluorescence. Front. Microbiol. 6:1382. doi: 10.3389/fmicb.2015.01382
Received: 07 October 2015; Accepted: 20 November 2015;
Published: 09 December 2015.
Edited by:
Luis R. Martinez, New York Institute of Technology College of Osteopathic Medicine, USAReviewed by:
Joseph M. Bliss, Women & Infants Hospital of Rhode Island, USAIan A Cleary, University of Tennessee at Martin, USA
Copyright © 2015 Szczepaniak, Łukaszewicz and Krasowska. This is an open-access article distributed under the terms of the Creative Commons Attribution License (CC BY). The use, distribution or reproduction in other forums is permitted, provided the original author(s) or licensor are credited and that the original publication in this journal is cited, in accordance with accepted academic practice. No use, distribution or reproduction is permitted which does not comply with these terms.
*Correspondence: Anna Krasowska, anna.krasowska@uwr.edu.pl