 Peng Zhang1†
 Haihong Hao2*†
 Jun Li1
 Ijaz Ahmad1
 Guyue Cheng2Dongmei Chen2Yanfei Tao2Lingli Huang2Yulian Wang2Menghong Dai2Zhenli Liu2,3Zonghui Yuan1,2,3*
- 1National Reference Laboratory of Veterinary Drug Residues and MAO Key Laboratory for Detection of Veterinary Drug Residues, Huazhong Agricultural University, Wuhan, China
- 2MOA Laboratory for Risk Assessment of Quality and Safety of Livestock and Poultry Products, Huazhong Agricultural University, Wuhan, China
- 3Hubei Collaborative Innovation Center for Animal Nutrition and Feed Safety, Huazhong Agricultural University, Wuhan, China
The aim of this study was to establish antimicrobial susceptibility breakpoints for tilmicosin against Haemophilus parasuis, which is an important pathogen of respiratory tract infections. The minimum inhibitory concentrations (MICs) of 103 H. parasuis isolates were determined by the agar dilution method. The wild type (WT) distribution and epidemiologic cutoff value (ECV) were evaluated by statistical analysis. The new bronchoaveolar lavage was used to establish intrapulmonary pharmacokinetic (PK) model in swine. The pharmacokinetic (PK) parameters of tilmicosin, both in pulmonary epithelial lining fluid (PELF) and in plasma, were determined using high performance liquid chromatography method and WinNonlin software. The pharmacodynamic cutoff (COPD) was calculated using Monte Carlo simulation. Our results showed that 100% of WT isolates were covered when the ECV was set at 16 μg/mL. The tilmicosin had concentration-dependent activity against H. parasuis. The PK data indicated that tilmicosin concentrations in PELF was rapidly increased to high levels at 4 h and kept stable until 48 h after drug administration, while the tilmicosin concentration in plasma reached maximum levels at 4 h and continued to decrease during 4–72 h. Using Monte Carlo simulation, COPD was defined as 1 μg/mL. Conclusively, the ECV and COPD of tilmicosin against H. parasuis were established for the first time based on the MIC distribution and PK-PD analysis in the target tissue, respectively. These values are of great importance for detection of tilmicosin-resistant H. parasuis and for effective treatment of clinical intrapulmonary infection caused by H. parasuis.
Introduction
Haemophilus parasuis, a Gram-negative bacterium of the Pasteurella group of organisms, is a respiratory pathogens of pigs (Fu et al., 2013; Luan et al., 2013). It is mainly responsible for Glässer’s disease, which is characterized by polyserositis, arthritis, and meningitis (Guo et al., 2011; Mullins et al., 2013; Moleres et al., 2015) and has caused large economic losses in the worldwide pig industry in recent years (Vilalta et al., 2012; Zehr et al., 2012).
Tilmicosin is a macrolide antibiotic for veterinary use, which is semi-synthesized by tylosin hydrolysate. Similar to other macrolides, this drug has a long half-life and maintains high concentrations both in lung and milk. Tilmicosin has high-activity against respiratory pathogens such as Pasteurella multocida, Actinobacillus pleuropneumoniae, and H. parasuis (DeRosa et al., 2000). In addition, the antimicrobial activity of tilmicosin is much better than that of tylosin (Ayling et al., 2000). Therefore, tilmicosin has broad clinical application for treatment of respiratory diseases in animals (Frank et al., 2000; Naccari et al., 2001; Fittipaldi et al., 2005).
Establishing the antimicrobial susceptibility breakpoint sets the basis for antimicrobial susceptibility testing and antimicrobial resistance surveillance. Although breakpoints of tilmicosin against P. multocida and A. pleuropneumoniae are available in Clinical and Laboratory Standards Institute (CLSI) standards, a breakpoint of tilmicosin against H. parasuis has not yet been established.
An appropriate antimicrobial susceptibility breakpoint is established by the interpretation of four main types of data (Turnidge and Paterson, 2007): (i) MIC distributions; (ii) resistance markers; (iii) PK/PD data of the target subjects; (iv) clinical data of wild type (WT) isolates which has no reported detectable resistance mechanisms (Turnidge et al., 2006). The statistical analysis are used in setting breakpoints (Turnidge et al., 2006; Kronvall, 2010; Meletiadis et al., 2012). Without clinical data, an epidemiologic cutoff value (ECV) could be used to discriminate WT strains from isolates with resistance mechanisms (Espinel-Ingroff et al., 2010). However, a susceptibility breakpoint solely based on ECV could not predict the clinical outcome. In the absence of a clinical cutoff, the Pharmacokinetic/Pharmacodynamic cutoff (COPD) is associated with clinical efficacy, as both PK/PD data and WT distribution are included for setting COPD.
The plasma concentration of the drug is responsible for pharmacological effect. Several studies have shown that the drug concentrations in the target sites were directly correlated with clinical efficacy (Barbour et al., 2010). In addition, bronchoaveolar lavage (BAL) has frequently been used to establish an intrapulmonary PK model, especially for macrolides (Conte et al., 2000b, 2004). In the case of animals, the problem of long sampling intervals makes plasma concentrations incomparable with pulmonary epithelial lining fluid (PELF) concentrations (Villarino et al., 2013).
The purpose of this study was to establish the ECV and COPD of tilmicosin against H. parasuis, in addition to an intrapulmonary PK model of tilmicosin in pigs.
Materials and Methods
Organisms
From March to May 2014, a total of 103 H. parasuis strains were donated by State Key Laboratory of Agricultural Microbiology at Huazhong Agricultural University and National Reference Laboratory of Veterinary Drug Residues at South China Agricultural University. These strains were isolated from the lungs of swine in 10 provinces of China. All of the bacterial isolates were confirmed by polymerase chain reaction (PCR). Prior to testing, each isolate was subcultured at least twice on tryptic soy agar (TSA) containing 5% fetal calf serum (FCS) and 10 μg/mL nicotinamide adenine dinucleotide (NAD) to ensure viability and purity.
Antimicrobial Susceptibility Determination
Susceptibility testing was performed by the agar dilution method according to the CLSI M07-A9 standard with some modification based on the characteristics of H. parasuis. A 2 μL H. parasuis suspension (108 CFU/mL) was inoculated onto TSA-FCS-NAD agar plates containing twofold dilutions (0.015~32 μg/mL) of tilmicosin (Dr. Ehrenstorfer Standards, Augsburg, Germany). Plates were incubated at 37°C in an atmosphere containing 5% CO2 for 36 h. Enterococcus faecalis (ATCC 29212) was used as the quality control (QC) strain to ensure the credibility of MICs tested.
Definition of Wild Type Cutoff (COWT) or Epidemiologic Cutoff (ECV)
A microorganism is defined as WT for a species by the absence of resistance mechanisms to target drug (Turnidge et al., 2006; Turnidge and Paterson, 2007). The ECV, or COWT is used to separate bacterial populations on the basis of MIC distributions (Turnidge and Paterson, 2007; Espinel-Ingroff et al., 2010; Canton et al., 2012). Ideally, at least 95% of WT isolates should be encompassed into the ECV (Pfaller et al., 2009, 2010, 2011). The ECV was calculated following the method described by Turnidge (Turnidge et al., 2006). Briefly, Normality testing of the WT distribution was conducted with Sigmastat software v.3.5, non-linear regression was used to fit log2-transformed MICs with Graphpad Prism v.5.01, NORMINV and NORDIST functions were employed to set the WT distribution cutoffs.
Determination of Possible Resistance Mechanism
The molecular mechanism involved in macrolide resistance in H. parasuis is unclear, however, mutations in the 23S rRNA that is commonly associated with macrolide-resistance may occur in H. parasuis. Therefore, PCR amplification (Hao et al., 2013) with the primers 23S-F (5′-ACGGTCCTAAGGTAGCGAAAT-3′) and 23S-R (5′-CATCAAATGTTAAAGGGTGGTA-3′) was used to screen mutations in the 23S rRNA gene in H. parasuis.
In vitro Time Killing Test
According to the determined MIC of H. parasuis SH0165, agar plates were prepared with concentrations of tilmicosin (Dr. Ehrenstorfer standards, Augsburg, Germany)) ranging from 1/4 to 32 MIC. A total of 0.1 mL of inoculum was plated and bacterial counts were performed at 0, 1, 2, 4, 8, 12, and 24 h.
Animals
Fourteen 10-weeks-old healthy crossbred (Duroc × Large white × Landrace) pigs weighing 28–33 kg were purchased from Huazhong Agricultural University pig breeding farm. Prior to experiments, pigs were raised 7 days to acclimate. Two pigs were used for establishment of high performance liquid chromatography (HPLC) method, another 12 pigs were used for pharmacokinetics (PK) study.
All the animal experiments were approved by the Animal Ethics Committee of Huazhong Agricultural University (hzauch 2014-003) and the Animal Care Center, Hubei Science and Technology Agency in China (SYXK 2013–0044). All efforts were used to reduce the pain and adverse effect of the animals.
PK Study Design
The 12 pigs were randomly divided into two groups. Tilmicosin was orally administrated to six pigs in each group at a single-dose of 40 mg/kg/bw. This dose was designed based on the clinical outcome of 400 mg/kg feed (about 40 mg/kg/bw) for treatment of H. parasuis in pigs (MacInnes et al., 2003). In Group A, blood (2 mL) samples from animals were obtained at 0, 0.5, 0.75, 1, 2, 3, 4, 5, 6, 8, 12, 24, 36, 48, 72, and 96 h after administration. In Group B, PELF samples were collected at 0, 0.5, 2, 4, 6, 8, 12, 24, 36, 48, 72, and 96 h post-drug administration.
Anesthesia Scheme and Bronchoaveolar Lavage (BAL)
Atropine (0.05 mg/kg), ketamine (5 mg/kg), and propofol (3 mg/kg) were given intramuscularly and intravenously 30 min before drug administration.
Standardized BAL was performed as previously described (Yamazaki et al., 2003; Choi et al., 2012; Lee et al., 2015), with an electronic fiberoptic bronchoscope (Kangmei GU-180VET) inserted in the right middle lung lobe. Then, 50 mL of normal saline was instilled into the lobe, and was aspirated into a 50 mL centrifugal tube after 20 s.
Specimen Handling
Plasma was separated from blood by centrifugation at 3000 × g for 10 min and was kept at -70°C until assay. The PELF was centrifuged at 400 × g for 10 min and stored at -70°C until analysis.
Tilmicosin Assay Using High Performance Liquid Chromatography (HPLC)
Quantitation analysis of tilmicosin in PELF and plasma were conducted using HPLC. A C18 reverse-phase column (250 mm × 4.6 mm i.d., 5 μm; Agilent) was used to perform HPLC at 30°C. The detection wavelength was 285 nm. The mobile phase consisted of 5 mM ammonium formate added with 0.1% formic acid (phase A) and acetonitrile (phase B; 73:27, v/v).
Plasma (0.5 mL) was extracted with dichloromethane (2.5 mL) twice. After centrifugation, supernatant was evaporated and resuspended in the mobile phase (0.5 mL). PELF (0.5 mL) was extracted with acetonitrile (2 mL), and then centrifuged, evaporated and resuspended in a same manner.
The limit of determination (LOD) was 0.02 μg/mL and the limit of quantification (LOQ) was 0.05 μg/mL both in plasma and PELF. Standard curves were linear from 0.05 to 10 μg/mL both in plasma (R2 = 0.9998) and PELF (R2 = 0.9999). The inter-day variation for determination in plasma ranged from 0.78 to 1.14% and PELF 0.14 to 0.78%, respectively. The recovery of tilmicosin in plasma ranged from 93.67 ± 1.06% to 97.16 ± 1.00% and in PELF from 98.49 ± 0.77 to 99.44 ± 014%.
Quantitation of PELF Volume
The urea dilution method was used to determine the volume of PELF as described previously (Conte et al., 2000a; Kiem and Schentag, 2007). The concentration of urea in plasma and PELF were determined by the urease-glutamate dehydrogenase enzymatic method with an automatic biochemical analyzer (SYNCHRON CX4 PRO; Beckman) at the National Reference Laboratory of Veterinary Drug Residues (Wuhan, China).
Pharmacokinetics Analysis
Statistical analysis was conducted by using WinNonlin v. 5.2.1. Plasma concentration data was analyzed with a two-compartment model and PELF non-compartment model according to the characteristics of concentration-time data.
Monte Carlo Simulation and COPD
Crystal Ball v7.2.2 was used to perform Monte Carlo simulation. The mean value and standard deviation of AUC24 of PELF were embedded in the function. The distribution of pharmacokinetic parameter AUC24 was assumed to be log-normal. A total of 10000 subjects were simulated.
The PK/PD target was evaluated (Andes et al., 2004). Conservative value (AUC/MIC = 30) was selected to calculate the probability of target attainment (PTA). COPD was defined as the MIC at which the PTA was ≥90%.
Results
Wild-Type (WT) MIC Distribution
All presumptive H. parasuis isolates were confirmed by PCR-based method. The MIC for Enterococcus faecalis (ATCC 29212) was 8 μg/mL, which was within the acceptable QC range according to CLSI document M31-A3.
The WT MIC distribution for tilmicoin against H. parasuis is shown in Figure 1. The tilmicosin MIC ranged from 0.06 to 16 μg/mL. The distribution of each MIC (0.06, 0.125,0.25, 0.5, 1, 2, 4, 8, and 16 μg/mL) among tested isolates was as follows: 0.06 μg/mL (1.94%), 0.12 μg/mL (4.85%), 0.25 μg/mL (19.42%), 0.5 μg/mL (15.53%), 1 μg/mL (28.16%), 2 μg/mL (15.53%), 4 μg/mL (10.68%), 8 μg/mL (2.91%), and 16 μg/mL (0.97%). The MIC50 and MIC90 were 1 and 4 μg/mL, respectively.
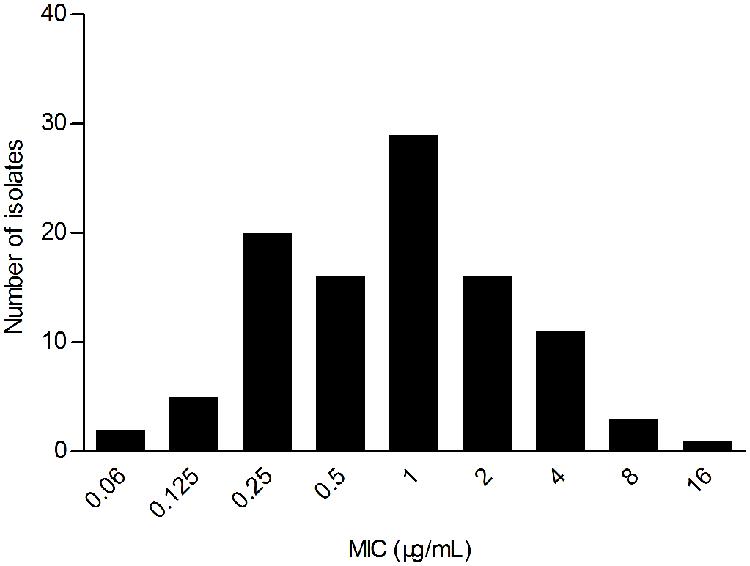
FIGURE 1. Primary MIC distribution of tilmicosin against 103 Haemophilus parasuis isolates.
The Epidemiologic Cutoff Value (ECV)
Despite a lower prevalence at the MIC of 0.5 μg/mL, cumulative counts of MIC data were found to match a good-shape normal distribution by use of normality test (P = 0.200) as shown in Figure 2. The optimum MIC range (0.015–16 μg/mL) was obtained using non-linear regression (Table 1). In addition, this range was further corrected to 0.06–16 μg/mL by employing the NORMINV function. The probabilites of an isolate MIC value higher than the high cutoff (0.18%) and lower than the low cutoff (0.07%) were estimated using NORMDIST function. As the result, the ECV was defined as 16 μg/mL, which encompassed 100% of the WT isolates (Table 1).
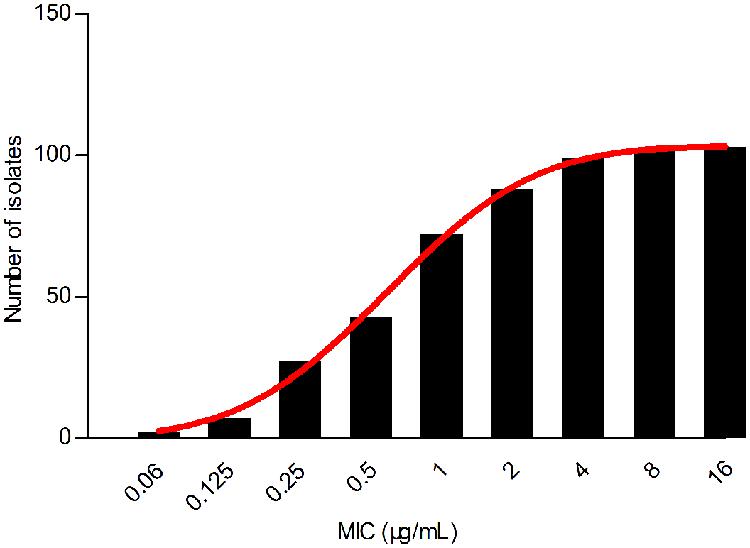
FIGURE 2. Cumulative MIC distribution of tilmicosin against H. parasuis after non-linear regression.
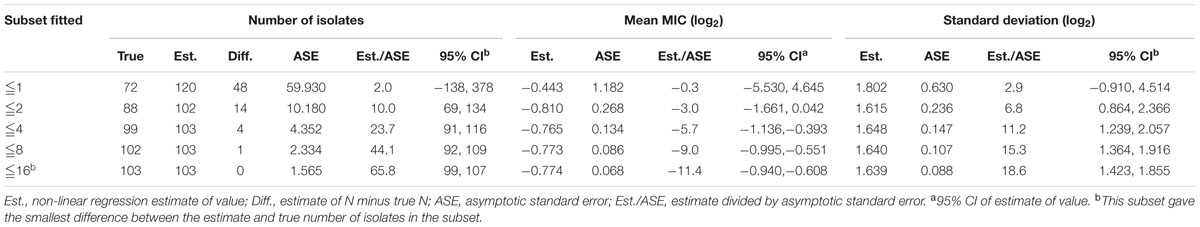
TABLE 1. Optimum non-linear least squares regression fitting of pooled MICs (μg/mL) for tilmicosin and Haemophilus parasuis.
After PCR amplification and DNA sequencing, no 23S rRNA gene mutations associated with macrolide resistance were found among all of the tested H. parasuis isolates. Therefore, all isolates were assumed to be WT strains.
In vitro Time Kill Curve
As displayed in Figure 3, the lower concentrations (≤MIC) of tilmicosin exhibited similar antimicrobial activity to H. parasuis. However, when tilmicosin concentrations were higher than MIC, the bacteriostatic efficiency gradually strengthened due to increased drug concentration. Therefore, the in vitro time kill curve showed that activity of tilmicosin against H. parasuis was concentration-dependent.
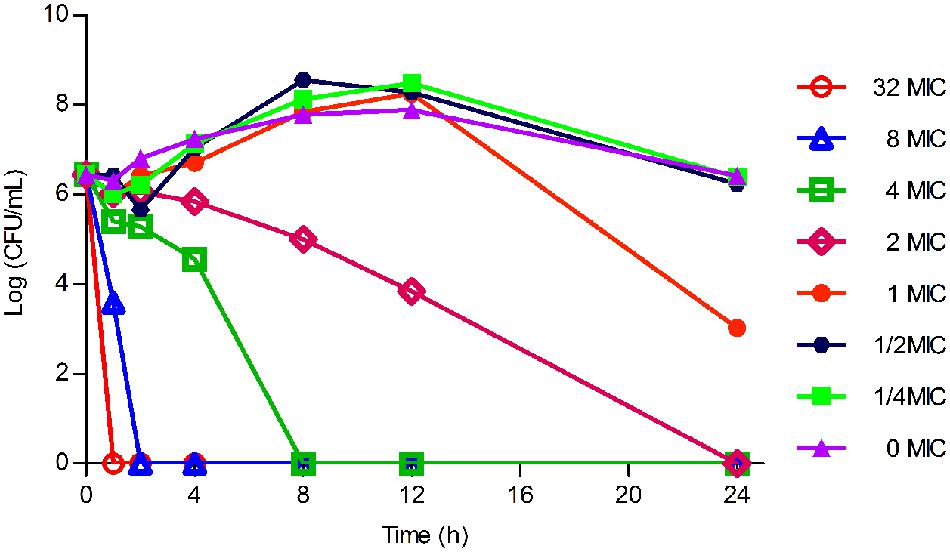
FIGURE 3. The in vitro time killing curve of tilmicosin against H. parasuis. Fixed concentration (106CFU/mL) of H. parasuis was incubated with different concentration of tilmicosin (1/4 MIC, ½ MIC, ……, 32 MIC). The X-axis was the different time point and the Y-axis was log10 transformed number of H. parasuis.
Pharmacokinetic Characteristics of Tilmicosin in Plasma
No serious adverse influences were observed after oral administration of tilmicosin. The concentration of tilmicosin in plasma was reduced below the LOQ after 72 h. A two-compartment model was used for model fitting from 0 to 72 h. The concentration and time profiles are illustrated in Figure 4. Pharmacokinetic parameters of tilmicosin in plasma were calculated by model analysis conducted by WinNonlin v. 5.2.1. As shown in Table 2, the time to reach to maximum concentration (Tmax), the peak drug concentration (Cmax), and the area under the curve at 24 h (AUC24) were 3.52 ± 0.34 h, 1.57 ± 0.46 μg/mL, and 20.13 ± 5.26 μg. h/mL, respectively. The mean residence time (MRT) was 16.45 ± 1.67 h. The intercept for the distribution phase (A) and for the elimination phase (B) were 2.67 ± 0.99 μg/mL and 0.09 ± 0.01 μg/mL. The distribution rate constant (α) and elimination rate constant (β) were 0.11 ± 0.01 L/h and 0.002 ± 0.001 L/h.
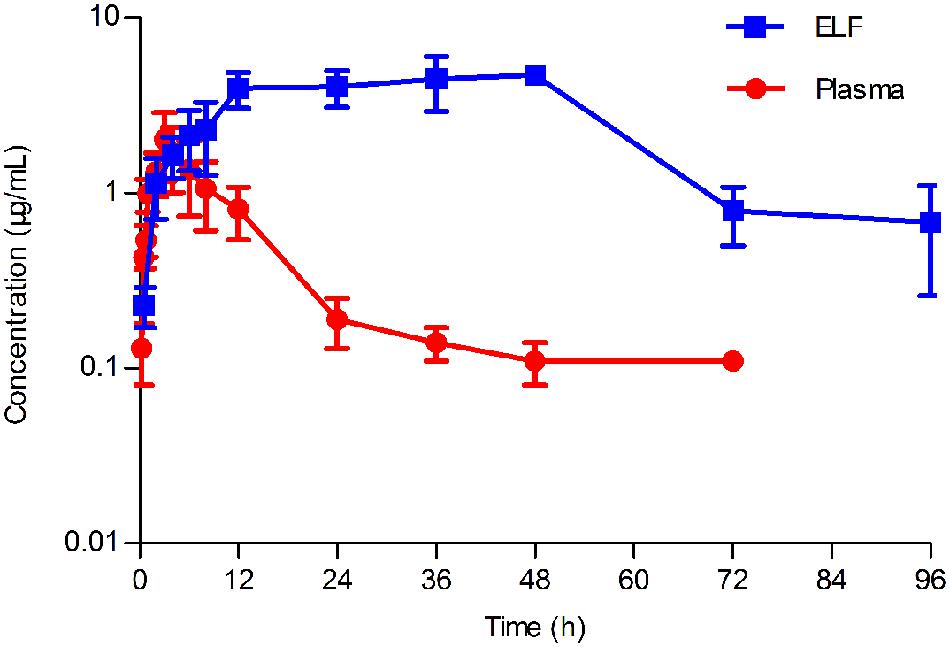
FIGURE 4. Concentration-time curve of tilmicosin in plasma and in epithelial lining fluid (ELF) after oral administration at a single dose of 40 mg/kg to pigs (n = 6). The concentration of tilmicosin in plasma was determined at 0, 0.5, 0.75, 1, 2, 3, 4, 5, 6, 8, 12, 24, 36, 48, 72, and 96 h after drug administration. The concentration of tilmicosin in ELF was detected at 0, 0.5, 2, 4, 6, 8, 12, 24, 36, 48, 72, and 96 h post-drug administration.
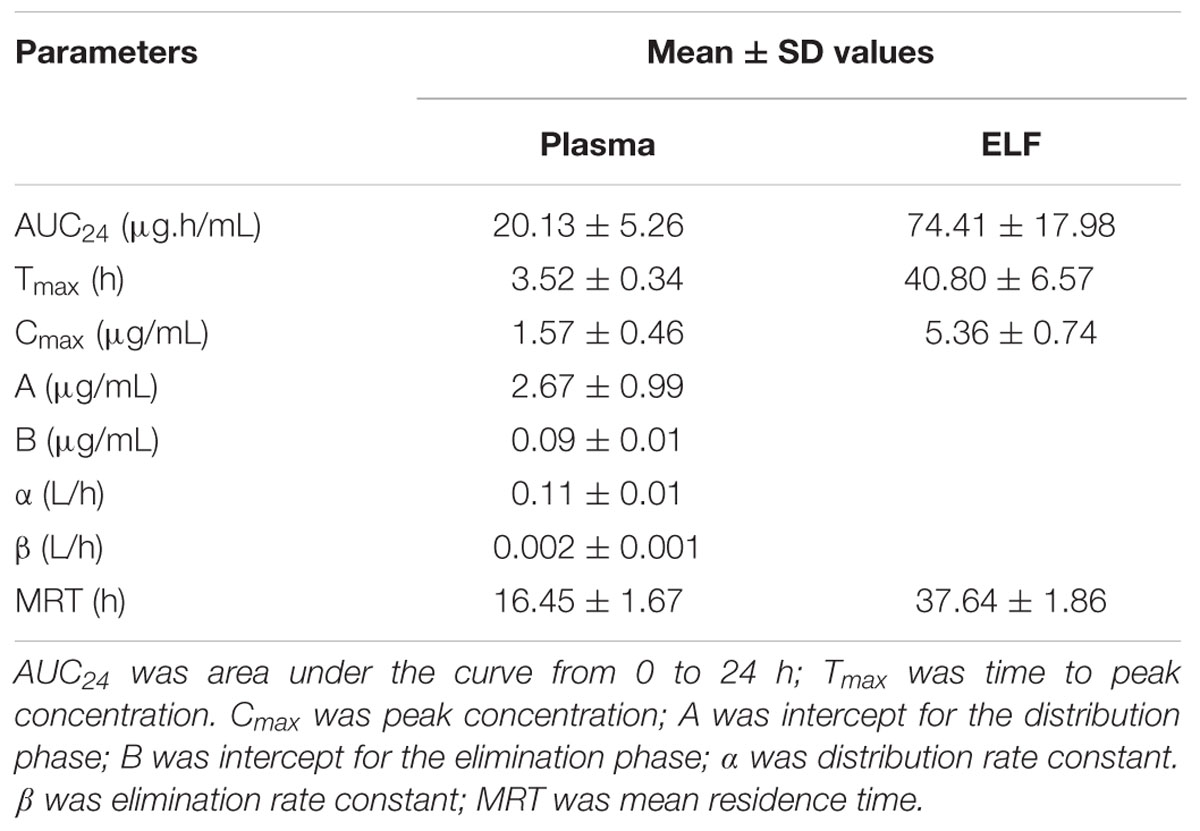
TABLE 2. Pharmacokinetic parameters in plasma and ELF after oral administration of tilmicosin at a single dose of 40 mg/kg.bw.
Pharmacokinetic Characteristics of Tilmicosin in PELF
After drug administration, the tilmicosin concentration in PELF reached to a higher level at 3 h and kept at that level until 96 h. A non-compartment model was selected to analyze the drug concentration and time characteristics for PELF samples. The pharmacokinetic parameters for PELF samples are summarized in Table 2. The values (mean ± SD) of Tmax, Cmax, AUC24, and MRT were 40.80 ± 6.57 h, 5.36 ± 0.74 μg/Ml, 74.41 ± 17.98 μg.h/mL, and 37.64 ± 1.86 h, respectively.
Comparison of Pharmacokinetics in Plasma and PELF
The concentration-time curves both in plasma and in PELF after oral administration of tilmicosin at a single dose of 40 mg/kg/bw are shown in Figure 4. The drug concentration in plasma and in PELF was lower than 2 μg/mL during 0~4 h. The concentration of tilmicosin in plasma rapidly decreased from 1.36 μg/mL at 6 h to 0.11 μg/mL at 72 h. In contrast, the drug concentration in PELF remained more stable, as values were higher than 4 μg/mL from 6 to 48 h and then showed a rapid decrease from 4.72 μg/mL at 48 h to 0.68 μg/mL at 96 h. Significant differences were observed between drug concentrations in plasma and in PELF. It was noteworthy that the drug concentration in PELF at 48 h reached 4.72 ± 0.44 μg/mL, which was more than 40 times of that (0.11 ± 0.03 μg/mL) detected in plasma. Both the values for Cmax and AUC24 in PELF were obviously higher than those in plasma (Table 2).
Monte Carlo Simulation and COPD
As presented in Table 3, 10,000 subjects were modeled by employing Monte Carlo simulation. The PTA under different WT MICs was calculated. The PTA achieved to 100% when MIC value of 1 μg/mL was employed. However, the PTA was merely 76% (far below 90%) under the MIC value of 2 μg/mL. Consequently, the COPD was defined as 1 μg/mL.
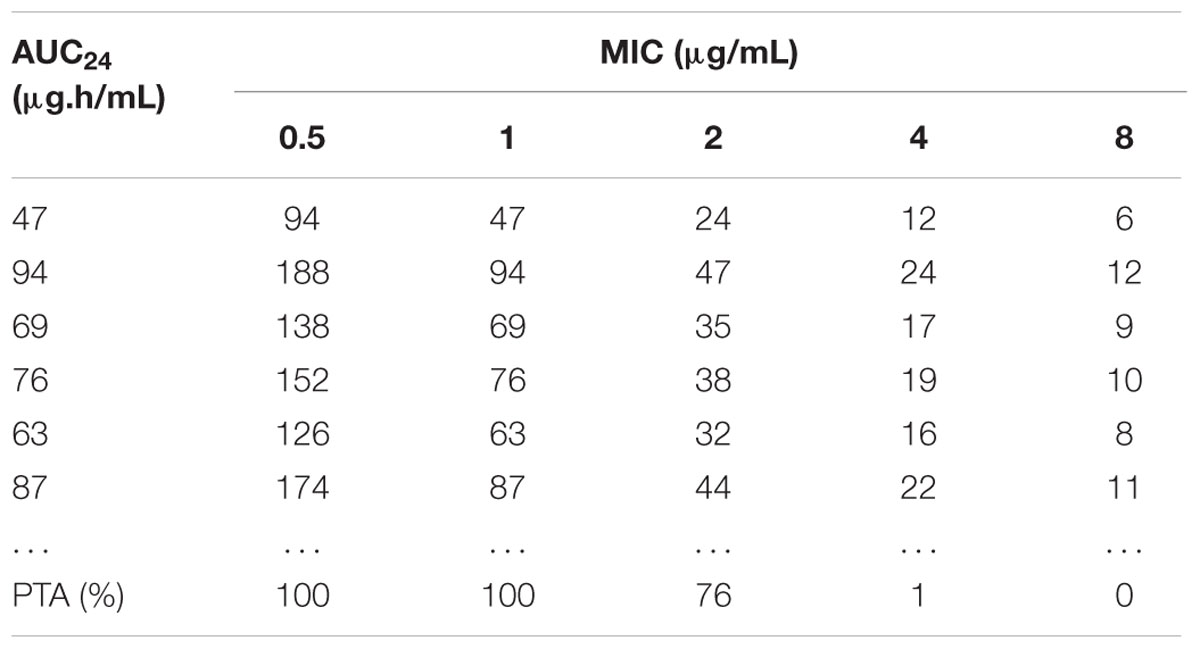
TABLE 3. The AUC/MIC value calculated by Monte Carlo simulation and the accumulated probability of target attainment (PTA) of the target AUC/MIC (≥30) at specific MIC breakpoints.
Discussion
Temporal and geographic differences could be frequently found on the prevalence of resistance. For instance, H. parasuis isolates from Denmark exhibited higher MIC90 to tilmicosin than those isolated from Czech Republic (8 μg/mL vs. 2 μg/mL; Aarestrup et al., 2004; Nedbalcová and Kučerová, 2013). In our study, 103 H. parasuis isolates were collected in 2014 and antimicrobial susceptibility tests were performed using the agar dilution method according to CLSI documents. The MIC90 (4 μg/mL) of the 103 H. parasuis isolates was higher than that (2 μg/mL) of strains isolated by Zhou et al. (2010).
Wild type isolates do not harbor any acquired mutational resistance mechanisms. Hence, resistance markers specific for a microorganism-drug combination should be determined (Meletiadis et al., 2012). However, no mutations associated with tilmicosin resistance have been confirmed in H. parasuis isolates so far. The mutations associated with macrolide resistance in the target gene of 23S rRNA did not occur in our H. parasuis isolates. Conservatively, all H. parasuis isolates used in this study could be considered WT strains.
The bactericidal characteristic of an antibiotic is closely dependent on the organism-drug combination. The same drug is likely to show distinct bactericidal features to different bacterial strains. Most macrolide drugs exhibited time-dependent antibacterial activity and two parameters (T > MIC and AUC/MIC) were generally used for PK/PD modeling (Owens and Ambrose, 2007). However, the effect of tilmicosin against H. parasuis was concentration-dependent, according to the result of the in vitro time kill test.
In previous reports, the drug concentrations at the infection site were highly correlated to that in blood (Craig, 1998). However, as macrolide drugs may accumulate in respiratory organs, the concentrations of macrolides at the infection site were undoubtedly better to predict the clinical outcome. Although several intrapulmonary pharmacokinetic studies have been conducted using BAL in humans (Conte et al., 2000a,b, 2005; Heng et al., 2013), the BAL technique was still only limitedly applied to establish intrapulmonary pharmacokinetic models among mammal animals (Womble et al., 2007; Villarino et al., 2013). Those intrapulmonary pharmacokinetics experiments using BAL technique were normally designed for long term studies with long sampling intervals. In our study, the PK data of tilmicosin in PELF in pigs were obtained for the first time by use of the BAL technique and intrapulmonary model on the basis of our modified anesthesia method.
Although, the preparation methods for extraction of tilmicosin from plasma were available in previous studies, the extraction procedures were complex (Modric et al., 1998; Stobba-Wiley et al., 2000). To simplify the extraction procedure, we tested diverse chemical materials (acetonitrile, methyl alcohol, dichloromethane and trichloromethane) and found that dichloromethane was the optimum reagent for tilmicosin extraction. Selection of the mobile phase was important for HPLC methods. Complex chemical compositions had been required for use in the mobile phase of HPLC for detecting tilmicosin in previous studies (Shen et al., 2005; Abu-Basha et al., 2007; Herrera et al., 2007). To improve the efficiency of the HPLC method, we tried different mobile phases and found that a mobile phase with simple composition (5 mM ammonium formate: acetonitrile, 73:27, v/v) could satisfy requirements for HPLC analysis of tilmicosin in plasma and in PELF.
Drug concentrations in PELF have been positively related to antibiotic activity for treatment of intrapulmonary infections (Kiem and Schentag, 2007). Previous study found that alveolar macrophages with high concentrations of macrolide drugs could migrate into the alveolar space when organisms or dust intrude (Gladue et al., 1989). This is why we chose to establish our intrapulmonary model in healthy subjects rather than diseased animals, as the latter may influence the stability of the model. Additionally, drug concentrations in PELF in healthy animals should have more clinical relevance compared to that taken from blood in diseased animals.
Pharmacokinetics of tilmicosin in the plasma of cattle, sheep, swine and chicken have been previously described (Modric et al., 1998; Shen et al., 2005; Abu-Basha et al., 2007). The intrapulmonary pharmacokinetics of tilmicosin in swine was reported in the present study for the first time. The plasma pharmacokinetic data in this study was similar to what was reported by Shen et al. (2005). Interestingly, the concentration in PELF reached the peak value at 48 h, which was significantly later than what was detected in plasma. This may because macrolide drugs can accumulate and persist in respiratory tissues for extended periods (Villarino and Martin-Jimenez, 2013).
The COPD (1 μg/mL) was lower than the ECV (16 μg/mL) established in this study. The reasons may be: (1) the ECV was overestimated because of existing, but currently unknown, resistance mechanisms; or (2) the sample size in this study was not enough to ensure definite results. Compared to the breakpoint of tilmicosin against A. pleuropneumoniae and P. multocida (16 μg/mL), the ECV for H. parasuis seemed reasonable to be used as the final breakpoint of tilmicosin against H. parasuis in pigs.
Author Contributions
Experiment designation: PZ, HH; Experiment carry out: PZ, JL, IA, DC, YT, ZL; Manuscript writing: PZ, HH, GC, LH, YW, MD; Manuscript review and modification: HH, ZY.
Funding
This work was supported by grants from the National Basic Research Program of China (2013CB127200), Fundamental Research Funds for the Central Universities (2662015PY035) and by the morning program of Wuhan in China (2015070404010191). National Natural Science Foundation of China (31101856), National Key Technology R&D Program (2012BAK01B00). The funders had no role in study design, data collection and analysis, decision to publish, or preparation of the manuscript.
Conflict of Interest Statement
The authors declare that the research was conducted in the absence of any commercial or financial relationships that could be construed as a potential conflict of interest.
Acknowledgments
We appreciated Katherine Mcelhanywilliams from USA FDA national center of toxicological research for her help on the manuscript modification. We thank Yahong Liu from South China Agricultural University and Xuwang Cai and Long Guo from State Key Laboratory of Agricultural Microbiology in Huazhong Agricultural University for freely providing H. parasuis isolates. We also thank Xiaoli Liu for supplying the anesthetic. Thanks also to Xianqiang Li, Feng Mao, Yan Zhao, Xiuhua Kuang, and Linquan Yang for their assistance in the experiments.
References
Aarestrup, F. M., Seyfarth, A. M., and Angen, Ø. (2004). Antimicrobial susceptibility of Haemophilus parasuis and Histophilus somni from pigs and cattle in Denmark. Vet. Microbiol. 101, 143–146. doi: 10.1016/j.vetmic.2004.02.012
Abu-Basha, E. A., Idkaidek, N. M., and Al-Shunnaq, A. F. (2007). Pharmacokinetics of tilmicosin (provitil powder and pulmotil liquid AC) oral formulations in chickens. Vet. Res. Commun. 31, 477–485. doi: 10.1007/s11259-006-3543-6
Andes, D., Anon, J., Jacobs, M. R., and Craig, W. A. (2004). Application of pharmacokinetics and pharmacodynamics to antimicrobial therapy of respiratory tract infections. Clin. Lab. Med. 24, 477–502. doi: 10.1016/j.cll.2004.03.009
Ayling, R. D., Baker, S. E., Peek, M. L., Simon, A. J., and Nicholas, R. A. (2000). Comparison of in vitro activity of danofloxacin, florfenicol, oxytetracycline, spectinomycin and tilmicosin against recent field isolates of Mycoplasma bovis. Vet. Rec. 146, 745–747. doi: 10.1136/vr.146.26.745
Barbour, A., Scaglione, F., and Derendorf, H. (2010). Class-dependent relevance of tissue distribution in the interpretation of anti-infective pharmacokinetic/pharmacodynamic indices. Int. J. Antimicrob. Agents 35, 431–438. doi: 10.1016/j.ijantimicag.2010.01.023
Canton, E., Peman, J., Hervas, D., Iniguez, C., Navarro, D., Echeverria, J., et al. (2012). Comparison of three statistical methods for establishing tentative wild-type population and epidemiological cutoff values for Echinocandins, Amphotericin B, Flucytosine, and Six Candida Species as determined by the colorimetric sensititre yeastone method. J. Clin. Microbiol. 50, 3921–3926. doi: 10.1128/JCM.01730-12
Choi, S.-H., Hong, S.-B., Ko, G.-B., Lee, Y., Park, H. J., Park, S.-Y., et al. (2012). Viral Infection in patients with severe pneumonia requiring intensive care unit admission. Am. J. Respir. Crit. Care Med. 186, 325–332. doi: 10.1164/rccm.201112-2240OC
Conte, J. E. Jr., Golden, J. A., McQuitty, M., Kipps, J., Lin, E. T., and Zurlinden, E. (2000a). Effects of AIDS and gender on steady-state plasma and intrapulmonary ethionamide concentrations. Antimicrob. Agents Chemother. 44, 1337–1341. doi: 10.1128/AAC.44.5.1337-1341.2000
Conte, J. E. Jr., Golden, J. A., McQuitty, M., Kipps, J., Lin, E. T., and Zurlinden, E. (2000b). Single-dose intrapulmonary pharmacokinetics of rifapentine in normal subjects. Antimicrob. Agents Chemother. 44, 985–990. doi: 10.1128/AAC.44.4.985-990.2000
Conte, J. E., Golden, J. A., Kelley, M. G., and Zurlinden, E. (2005). Intrapulmonary pharmacokinetics and pharmacodynamics of meropenem. Int. J. Antimicrob. Agents 26, 449–456. doi: 10.1016/j.ijantimicag.2005.08.015
Conte, J. E., Golden, J. A., Kipps, J., and Zurlinden, E. (2004). Steady-state plasma and intrapulmonary pharmacokinetics and pharmacodynamics of cethromycin. Antimicrob. Agents Chemother. 48, 3508–3515. doi: 10.1128/AAC.48.10.3823-3827.2004
Craig, W. A. (1998). Pharmacokinetic/pharmacodynamic parameters: rationale for antibacterial dosing of mice and men. Clin. Infect. Dis. 26, 1–10, quiz 11–12. doi: 10.1086/516284
DeRosa, D. C., Veenhuizen, M. F., Bade, D. J., and Shryock, T. R. (2000). In vitro susceptibility of porcine respiratory pathogens to tilmicosin. J. Vet. Diagn. Invest. 12, 541–546. doi: 10.1177/104063870001200608
Espinel-Ingroff, A., Diekema, D. J., Fothergill, A., Johnson, E., Pelaez, T., Pfaller, M. A., et al. (2010). Wild-Type mic distributions and epidemiological cutoff values for the triazoles and six Aspergillus spp. for the CLSI broth microdilution method (M38-A2 Document). J. Clin. Microbiol. 48, 3251–3257. doi: 10.1128/JCM.00536-10
Fittipaldi, N., Klopfenstein, C., Gottschalk, M., Broes, A., Paradis, M. A., and Dick, C. P. (2005). Assessment of the efficacy of tilmicosin phosphate to eliminate Actinobacillus pleuropneumoniae from carrier pigs. Can. J. Vet. Res. 69, 146–150.
Frank, G. H., Briggs, R. E., Loan, R. W., Purdy, C. W., and Zehr, E. S. (2000). Effects of tilmicosin treatment on Pasteurella haemolytica organisms in nasal secretion specimens of calves with respiratory tract disease. Am. J. Vet. Res. 61, 525–529. doi: 10.2460/ajvr.2000.61.525
Fu, S. L., Ou, J. W., Zhang, M. M., Xu, J., Liu, H. Z., Liu, J. L., et al. (2013). The Live Attenuated Actinobacillus pleuropneumoniae triple-deletion mutant delta apxIC delta apxIIC delta apxIV-ORF1 strain, SLW05, immunizes pigs against lethal challenge with Haemophilus parasuis. Clin. Vaccin. Immunol. 20, 134–139. doi: 10.1128/CVI.00458-12
Gladue, R. P., Bright, G. M., Isaacson, R. E., and Newborg, M. F. (1989). In vitro and in vivo uptake of azithromycin (CP-62,993) by phagocytic cells: possible mechanism of delivery and release at sites of infection. Antimicrob. Agents Chemother. 33, 277–282. doi: 10.1128/AAC.33.3.277
Guo, L., Zhang, J., Xu, C., Zhao, Y., Ren, T., Zhang, B., et al. (2011). Molecular characterization of fluoroquinolone resistance in Haemophilus parasuis isolated from pigs in South China. J. Antimicrob. Chemother. 66, 539–542. doi: 10.1093/jac/dkq497
Hao, H., Yuan, Z., Shen, Z., Han, J., Sahin, O., Liu, P., et al. (2013). Mutational and transcriptomic changes involved in the development of macrolide resistance in Campylobacter jejuni. Antimicrob. Agents Chemother. 57, 1369–1378. doi: 10.1128/AAC.01927-12
Heng, S. C., Snell, G. I., Levvey, B., Keating, D., Westall, G. P., Williams, T. J., et al. (2013). Relationship between trough plasma and epithelial lining fluid concentrations of voriconazole in lung transplant recipients. Antimicrob. Agents Chemother. 57, 4581–4583. doi: 10.1128/AAC.00942-13
Herrera, M., Ding, H., McClanahan, R., Owens, J., and Hunter, R. (2007). Quantitative determination of tilmicosin in canine serum by high performance liquid chromatography–tandem mass spectrometry. J. Chromatogr. B 857, 9–14. doi: 10.1016/j.jchromb.2007.06.017
Kiem, S., and Schentag, J. J. (2007). Interpretation of antibiotic concentration ratios measured in epithelial lining fluid. Antimicrob. Agents Chemother. 52, 24–36. doi: 10.1128/AAC.00133-06
Kronvall, G. (2010). Normalized resistance interpretation as a tool for establishing epidemiological MIC susceptibility breakpoints. J. Clin. Microbiol. 48, 4445–4452. doi: 10.1128/JCM.01101-10
Lee, J. Y., Park, H. J., Kim, Y. K., Yu, S., Chong, Y. P., Kim, S.-H., et al. (2015). Cellular profiles of bronchoalveolar lavage fluid and their prognostic significance for non-hiv-infected patients with Pneumocystis jirovecii Pneumonia. J. Clin. Microbiol. 53, 1310–1316. doi: 10.1128/JCM.03494-14
Luan, S. L., Chaudhuri, R. R., Peters, S. E., Mayho, M., Weinert, L. A., Crowther, S. A., et al. (2013). Generation of a Tn5 transposon library in Haemophilus parasuis and analysis by transposon-directed insertion-site sequencing (TraDIS). Vet. Microbiol. 166, 558–566. doi: 10.1016/j.vetmic.2013.07.008
MacInnes, J. I., Paradis, M. A., Vessie, G. H., Slavic, L., Watson, S., Wilson, J. B., et al. (2003). Efficacy of prophylactic tilmicosin in the control of experimentally induced Haemophilus parasuis infection in pigs. J. Swine Health Prod. 11, 174–180.
Meletiadis, J., Mavridou, E., Melchers, W. J. G., Mouton, J. W., and Verweij, P. E. (2012). Epidemiological cutoff values for azoles and Aspergillus fumigatus based on a novel mathematical approach incorporating cyp51A sequence analysis. Antimicrob. Agents Chemother. 56, 2524–2529. doi: 10.1128/AAC.05959-11
Modric, S., Webb, A. I., and Derendorf, H. (1998). Pharmacokinetics and pharmacodynamics of tilmicosin in sheep and cattle. J. Vet. Pharmacol. Ther. 21, 444–452. doi: 10.1046/j.1365-2885.1998.00177.x
Moleres, J., Santos-Lopez, A., Lazaro, I., Labairu, J., Prat, C., Ardanuy, C., et al. (2015). Novel bla(ROB-1)-bearing plasmid conferring resistance to beta-lactams in Haemophilus parasuis Isolates from healthy weaning pigs. Appl. Environ. Microbiol. 81, 3255–3267. doi: 10.1128/AEM.03865-14
Mullins, M. A., Register, K. B., Brunelle, B. W., Aragon, V., Galofre-Mila, N., Bayles, D. O., et al. (2013). A curated public database for multilocus sequence typing (MLST) and analysis of Haemophilus parasuis based on an optimized typing scheme. Vet. Microbiol. 162, 899–906. doi: 10.1016/j.vetmic.2012.11.019
Naccari, F., Giofre, F., Pellegrino, M., Calo, M., Licata, P., and Carli, S. (2001). Effectiveness and kinetic behaviour of tilmicosin in the treatment of respiratory infections in sheep. Vet. Rec. 148, 773–776. doi: 10.1136/vr.148.25.773
Nedbalcová, K., and Kučerová, Z. (2013). Antimicrobial susceptibility of Pasteurella multocida and Haemophilus parasuis isolates associated with porcine pneumonia. Acta Vet. Brno 82, 3–7. doi: 10.2754/avb201382010003
Owens, R. C., and Ambrose, P. G. (2007). Antimicrobial stewardship and the role of pharmacokinetics–pharmacodynamics in the modern antibiotic era. Diagn. Microbiol. Infect. Dis. 57, S77–S83. doi: 10.1016/j.diagmicrobio.2006.12.012
Pfaller, M. A., Boyken, L., Hollis, R. J., Kroeger, J., Messer, S. A., Tendolkar, S., et al. (2010). Wild-type MIC distributions and epidemiological cutoff values for the Echinocandins and Candida spp. J. Clin. Microbiol. 48, 52–56. doi: 10.1128/JCM.01590-09
Pfaller, M. A., Diekema, D. J., Andes, D., Arendrup, M. C., Brown, S. D., Lockhart, S. R., et al. (2011). Clinical breakpoints for the echinocandins and Candida revisited: integration of molecular, clinical, and microbiological data to arrive at species-specific interpretive criteria. Drug Resist. Updat. 14, 164–176. doi: 10.1016/j.drup.2011.01.004
Pfaller, M. A., Diekema, D. J., Ghannoum, M. A., Rex, J. H., Alexander, B. D., Andes, D., et al. (2009). Wild-type MIC distribution and epidemiological cutoff values for Aspergillus fumigatus and three triazoles as determined by the clinical and laboratory standards institute broth microdilution methods. J. Clin. Microbiol. 47, 3142–3146. doi: 10.1128/JCM.00940-09
Shen, J., Li, C., Jiang, H., Zhang, S., Guo, P., Ding, S., et al. (2005). Pharmacokinetics of tilmicosin after oral administration in swine. Am. J. Vet. Res. 66, 1071–1074. doi: 10.2460/ajvr.2005.66.1071
Stobba-Wiley, C. M., Chang, J. P., Elsbury, D. T., Moran, J. W., Turner, J. M., and Readnour, R. S. (2000). Determination of tilmicosin residues in chicken, cattle, swine, and sheep tissues by liquid chromatography. J. AOAC Int. 83, 837–846.
Turnidge, J., Kahlmeter, G., and Kronvall, G. (2006). Statistical characterisation of bacterial wild-type MIC value distributions and the determination of epidemiological cut-off values. Clin. Microbiol. Infect. 12, 418–425. doi: 10.1111/j.1469-0691.2006.01377.x
Turnidge, J., and Paterson, D. L. (2007). Setting and revising antibacterial susceptibility breakpoints. Clin. Microbiol. Rev. 20, 391–408. doi: 10.1128/CMR.00047-06
Vilalta, C., Galofre, N., Aragon, V., de Rozas, A. M. P., and Fraile, L. (2012). Effect of marbofloxacin on Haemophilus parasuis nasal carriage. Vet. Microbiol. 159, 123–129. doi: 10.1016/j.vetmic.2012.03.028
Villarino, N., Lesman, S., Fielder, A., García-Tapia, D., Cox, S., Lucas, M., et al. (2013). Pulmonary pharmacokinetics of tulathromycin in swine. Part 2: intra-airways compartments. J. Vet. Pharmacol. Ther. 36, 340–349. doi: 10.1111/jvp.12015
Villarino, N., and Martin-Jimenez, T. (2013). Pharmacokinetics of macrolides in foals. J. Vet. Pharmacol. Ther. 36, 1–13. doi: 10.1111/jvp.12010
Womble, A., Giguere, S., and Lee, E. A. (2007). Pharmacokinetics of oral doxycycline and concentrations in body fluids and bronchoalveolar cells of foals. J. Vet. Pharmacol. Ther. 30, 187–193. doi: 10.1111/j.1365-2885.2007.00857.x
Yamazaki, K., Ogura, S., Ishizaka, A., Oh-hara, T., and Nishimura, M. (2003). Bronchoscopic microsampling method for measuring drug concentration in epithelial lining fluid. Am. J. Respir. Crit. Care Med. 168, 1304–1307. doi: 10.1164/rccm.200301-111OC
Zehr, E. S., Lavrov, D. V., and Tabatabai, L. B. (2012). Comparison of Haemophilus parasuis reference strains and field isolates by using random amplified polymorphic DNA and protein profiles. BMC Microbiol. 12:108. doi: 10.1186/1471-2180-12-108
Keywords: epidemiologic cutoff value, pharmacodynamic cutoff, bronchoaveolar lavage, H. parasuis, tilmicosin
Citation: Zhang P, Hao H, Li J, Ahmad I, Cheng G, Chen D, Tao Y, Huang L, Wang Y, Dai M, Liu Z and Yuan Z (2016) The Epidemiologic and Pharmacodynamic Cutoff Values of Tilmicosin against Haemophilus parasuis. Front. Microbiol. 7:385. doi: 10.3389/fmicb.2016.00385
Received: 29 December 2015; Accepted: 11 March 2016;
Published: 22 March 2016.
Edited by:
Fiona Walsh, National University of Ireland Maynooth, IrelandReviewed by:
Osmar Nascimento Silva, Dom Bosco Catholic University, BrazilLeila Vali, Kuwait University, Kuwait
Copyright © 2016 Zhang, Hao, Li, Ahmad, Cheng, Chen, Tao, Huang, Wang, Dai, Liu and Yuan. This is an open-access article distributed under the terms of the Creative Commons Attribution License (CC BY). The use, distribution or reproduction in other forums is permitted, provided the original author(s) or licensor are credited and that the original publication in this journal is cited, in accordance with accepted academic practice. No use, distribution or reproduction is permitted which does not comply with these terms.
*Correspondence: Zonghui Yuan, yuan5802@mail.hzau.edu.cn; Haihong Hao, haohaihong@mail.hzau.edu.cn
†These authors have contributed equally to this work.