 Ida Steinberger-Levy*
 Ohad Shifman
 Anat Zvi
 Naomi ArielAdi Beth-DinOfir IsraeliDavid GurMoshe Aftalion
 Sharon Maoz
 Raphael Ber*
- Department of Biochemistry and Molecular Genetics, Israel Institute for Biological Research, Ness-Ziona, Israel
Standard antimicrobial susceptibility tests used to determine bacterial susceptibility to antibiotics are growth dependent and time consuming. The long incubation time required for standard tests may render susceptibility results irrelevant, particularly for patients infected with lethal bacteria that are slow growing on agar but progress rapidly in vivo, such as Yersinia pestis. Here, we present an alternative approach for the rapid determination of antimicrobial susceptibility, based on the quantification of the changes in the expression levels of specific marker genes following exposure to growth-inhibiting concentrations of the antibiotic, using Y. pestis and ciprofloxacin as a model. The marker genes were identified by transcriptomic DNA microarray analysis of the virulent Y. pestis Kimberley53 strain after exposure to specific concentrations of ciprofloxacin for various time periods. We identified several marker genes that were induced following exposure to growth-inhibitory concentrations of ciprofloxacin, and we confirmed the marker expression profiles at additional ciprofloxacin concentrations using quantitative RT-PCR. Eleven candidate marker transcripts were identified, of which four mRNA markers were selected for a rapid quantitative RT-PCR susceptibility test that correctly determined the Minimal Inhibitory Concentration (MIC) values and the categories of susceptibility of several Y. pestis strains and isolates harboring various ciprofloxacin MIC values. The novel molecular susceptibility test requires just 2 h of antibiotic exposure in a 7-h overall test time, in contrast to the 24 h of antibiotic exposure required for a standard microdilution test.
Introduction
Rapid determination of the antibiotic susceptibility of pathogenic bacteria is required to assure proper treatment of the bacterial infection. Bacterial susceptibility is determined by standard antimicrobial susceptibility tests (ASTs) performed according to Clinical and Laboratory Standards Institute guidelines (CLSI, 2015). ASTs are growth-dependent assays in which bacterial growth in the presence and absence of the relevant antibiotic is compared. Preliminary bacterial isolation, enrichment and identification steps are required. Thus, susceptibility determination is a time-consuming procedure that may delay appropriate antibiotic treatment for the patient, and a novel rapid AST is needed. Rapid ASTs are particularly important for fatal pathogenic bacteria that grow slowly in vitro but rapidly in vivo, such as Yersinia pestis.
Y. pestis, a Gram-negative bacterium, is the etiological agent of plague, a severe and rapidly progressing disease characterized by a high mortality rate (40–60% for the bubonic, 30–50% for the septicemic, and 100% for the pneumonic forms of plague) if not treated with proper antibiotics within 18–24 h after the onset of symptoms (Pollitzer, 1960; Inglesby et al., 2000). Plague has caused millions of deaths in three world pandemics, and local outbreaks in endemic areas (Gage and Kosoy, 2005; Butler, 2013) or potential intentional dissemination in a bioterror event remain concerns. Due to its rapid disease progression and person-to-person transmission (Inglesby et al., 2000), Y. pestis is classified by the Centers for Disease Control and Prevention (CDC) as a Tier 1 Select Agent. To prevent morbidity and mortality, rapid identification of the microbial agent and its susceptibility to recommended antibiotics is needed. The recommended antibiotics for post-exposure prophylaxis of Y. pestis are ciprofloxacin, doxycycline and, as an alternative, chloramphenicol, whereas the recommended antibiotics for treatment are streptomycin, gentamicin and, as alternatives, levofloxacin, ciprofloxacin, doxycycline, moxifloxacin and chloramphenicol (Inglesby et al., 2000; CDC, 20161). Most naturally occurring Y. pestis strains are susceptible to the recommended antibiotics; however, plasmid-mediated single and multiple drug-resistant strains have been isolated from infected patients (Galimand et al., 2006). To select appropriate antibiotics for plague prophylaxis or treatment, a microdilution test is recommended (CLSI, 2015). Y. pestis growth in liquid is not significantly slower than other Gram-negative bacterial pathogens; however, its growth on solid agar, which is required for isolation, is considered slow. Therefore, the standard procedure for a positive clinical sample usually requires 3 days (including 2 days for the enrichment step on rich agar followed by 24 h for the AST). Moreover, ASTs of environmental Y. pestis samples (as in a bioterrorism attack) require an additional isolation step of the sample on selective agar and thus require at least 5 days (including 2 days for the isolation step, 2 days for the enrichment step, and 24 h for the AST). Because death may occur within a few hours of bacterial exposure and symptom onset (Pollitzer, 1960; Dennis and Hughes, 1997), rapid ASTs are urgently needed.
In recent years, different novel methods have been developed to decrease the AST duration by reducing the time required for either the preliminary isolation and enrichment steps or the susceptibility determination step (reviewed by Pulido et al., 2013; van Belkum and Dunne, 2013). For example, we have developed a rapid susceptibility test for Y. pestis-positive blood cultures that includes the direct isolation and enrichment of the bacteria from the blood culture components using a vacutainer serum separation tube, followed by bacterial counting using flow cytometry (Steinberger-Levy et al., 2007). Few of the novel alternative methods [such as flow cytometry for live/dead determination (Jepras et al., 1997)] enable the determination of both the antibiotic minimal inhibitory concentration (MIC) and category of susceptibility, and most other methods [such as using MALDI-TOF-MS (Burckhardt and Zimmermann, 2011) or magnetic bead rotation (Kinnunen et al., 2012)] determine only the category of susceptibility (reviewed by van Belkum and Dunne, 2013). Determining the MIC value of antibiotics and not only the susceptibility category is particularly important in complicated cases, such as infected patients with contraindications to the first-choice antibiotic, pregnant women, children and strains whose sensitivity is close to the resistant category break-point (intermediate category).
In the present study, we describe the development of a rapid mRNA-based molecular AST using Y. pestis and ciprofloxacin as our bacteria:antibiotic model combination. The molecular AST is based on monitoring the changes in the expression of specific mRNA transcripts (mRNA markers) induced by 2-h exposure to ciprofloxacin.
Ciprofloxacin, the model antibiotic in the present study, is a bactericidal fluoroquinolone. Fluoroquinolones inhibit bacterial growth mainly by binding to DNA gyrase and topoisomerase IV and thus preventing DNA synthesis and repair, resulting in DNA damage and bacterial death (Redgrave et al., 2014). Exposure of various bacteria to ciprofloxacin or other fluoroquinolones induces common transcriptomic changes, such as induction of genes belonging to the SOS response pathway, as well as changes in mRNA transcripts that differ among studies (Gmuender et al., 2001; Shaw et al., 2003; Kaldalu et al., 2004; Brazas and Hancock, 2005; Cirz et al., 2006, 2007). Moreover, the fold induction of different genes varies among studies. These differences can be attributed to the different experimental conditions used, such as bacterial species, antibiotic concentrations, antibiotic exposure time, inoculum size and growth medium. In addition, previous transcriptomic analyses were not performed under standard CLSI-recommended conditions.
Thus, to identify marker mRNA transcripts that are altered upon Y. pestis exposure to inhibitory concentrations (1 × MIC and above) of ciprofloxacin, we conducted transcriptome analysis using DNA microarray analysis. The exposure experiments were performed under CLSI-recommended conditions. Several mRNA transcripts that were induced or repressed, depending on both exposure time and ciprofloxacin concentration, were identified. Using 4 marker genes, we developed a 7-h quantitative RT-PCR (qRT-PCR)-based AST for the determination of Y. pestis susceptibility to ciprofloxacin. The measured changes in transcription levels were translated to the strain's MIC value and the susceptibility category. The molecular-derived MIC values were similar to those obtained using the standard 24-h CLSI test. Our rapid molecular AST was confirmed using the virulent Kimberley53 strain, its non-virulent derivative Kimberley53pCD1−pPCP1−, several Kimberley53pCD1−pPCP1− isolates with reduced susceptibility toward ciprofloxacin and the EV76 vaccine strain.
Materials and Methods
Bacterial Strains and Growth Conditions
Experiments were conducted using the virulent Y. pestis strain Kimberley53 (Ben-Gurion and Hertman, 1958). An in-house DNA sequencing analysis of this strain (which harbors the 3 virulent plasmids: pMT1, pCD1, and pPCP1) revealed 99.7% homology with the CO92 clinical strain (biovar orientalis) and 100% identity in the sequences encoding known virulent factors, including both chromosomal and plasmidial factors. Kimberley53 has been shown to be virulent in both pneumonic (Vagima et al., 2015) and bubonic (Tidhar et al., 2009) mouse plague models, and its mouse LD50 in those models resembles the CO92 MLD50 values. In addition, we also used the plasmid-cured non-virulent Kimberley53pCD1−pPCP1− derivative strain (Flashner et al., 2004) or the vaccine strain EV76 (Ben-Gurion and Hertman, 1958). Experiments using the virulent strain were performed using biosafety level 3 (BSL-3) containment and procedures. Experiments conducted using the non-virulent strains, were performed using biosafety level 2 (BSL-2) containment and procedures.
Kimberley53pCD1−pPCP1− spontaneous mutants with reduced susceptibility to ciprofloxacin were isolated according to previously published reports (Lindler et al., 2001; Udani and Levy, 2006; Louie et al., 2007a,b, 2011a,b). The isolation was performed in compliance with Israeli law for working with select agents, approved by the Institutional “Recombinant DNA Experimental Usage Committee” and performed according to specific Institutional “Biosafety committee” guidelines for containment and working procedures.
Bacteria were plated on brain-heart infusion agar (BHIA, BD) or on BIN [a Y. pestis selective agar plate (Ber et al., 2003)]. Live counting of bacteria was performed by plating serial 10-fold dilutions on BHIA, followed by incubation for 48 h. All incubations were conducted at the optimal growth temperature of 28°C.
Standard Ciprofloxacin MIC Determination
ASTs were performed by standard microdilution test (CLSI, 2015) in a 96-well microplate (TPP) using an inoculum containing 5 × 10⁵–1 × 10⁶ colony-forming units (CFUs)/ml suspended in cation-adjusted Mueller-Hinton broth (MHB, BBL). Ciprofloxacin (Ciproxin 200, Bayer) was serially diluted two-fold in MHB to a final concentration in the range of 0.001–16 μg/ml. Bacterial cultures were incubated for 24 h at 28°C in a plate reader (Sunrise or Infinite 200, TECAN), and the optical density at 630 nm (OD630) was read at 1-h intervals. The MIC value was defined after 24 h of growth as the lowest ciprofloxacin concentration that reduced growth to less than 10% of the OD630 of the no-antibiotic growth control. No growth was verified by unaided visual inspection. Each assay was performed with three independent experiments. The microdilution kinetic curves represent the average absorbance of three well replicates for each antibiotic concentration. The error bars represent the standard deviation (SD).
Antibiotic Exposure
Y. pestis exposed to ciprofloxacin was prepared for either transcriptomic DNA microarray analysis or molecular-based AST by suspending BHIA- or BIN-plated (lawn with pinhead-sized colonies) bacteria in MHB to OD660 = 0.1 (1–2 × 10⁸ CFU/ml). The cultures were then diluted 1:200 in MHB to obtain the standard CLSI-recommended inoculum of 5 × 10⁵–1 × 10⁶ CFU/ml (CLSI, 2015).
For the transcriptomic DNA microarray analysis, BHIA-plated virulent Kimberley53 was suspended in MHB (in five 2-l Erlenmeyer flasks each containing 420 ml of standard inoculum). The flasks were incubated with continuous shaking at 150 rpm for 2 h for the adjustment of the culture to the standard AST MHB medium. The cultures were then combined, mixed and divided into five culture samples of 400 ml each. Ciprofloxacin stock solutions (4 ml of 100 ×) were added to four cultures to obtain final concentrations of 0.001, 0.016, 0.5, and 4 μg/ml, and the non-treated culture was used as a growth control. Each of the five cultures was then further divided into 4 × 100 ml in 0.5-l flasks (each flask represents one exposure time point). Samples (0.5 ml) were taken for microdilution AST (triplicates of 0.1 ml/well) to confirm the standard MIC value (0.15 ml of the 0.016 μg/ml sample was also diluted 1:1 to verify the partial inhibition of growth at the sub-MIC concentration of 0.008 μg/ml; see Figure 2A). The 0.5-l Erlenmeyer flasks were incubated with shaking at 150 rpm for either 20, 45, 90, or 120 min. At each time point, samples were taken for both live counting and total RNA extraction. For RNA extraction, 40 ml of the bacterial suspension was centrifuged at 3200 × g for 15 min at 4°C, the supernatant was discarded, and the bacterial pellet was frozen by liquid nitrogen and stored at −70°C until RNA extraction.
To prepare the inoculum for the molecular AST experiments, bacteria were plated on BIN for 20–24 h. The inoculum was then prepared and recovered for 2 h in MHB prior to ciprofloxacin exposure as described above. The recovered cultures were exposed to serial 2-fold dilutions of ciprofloxacin (in the range of 0.002–16 μg/ml, as indicated in the figures) in MHB for 2 h in a sample volume of 0.5 ml in a 24-well flat bottom plate (Costar 3524). The entire 0.5-ml well volume was used for RNA extraction.
RNA Purification
Total RNA was extracted from bacterial pellets using the RNeasy Mini kit (QIAGEN) according to the manufacturer's instructions. Residual DNA was removed by 15-min on-column digestion using the RNase-free DNase kit (QIAGEN). RNA samples were quantified using a NanoDrop ND-1000 spectrophotometer. For DNA microarray analysis, the quality of the RNA samples was determined using an Agilent 2100 Bioanalyzer with the “Prokaryote Total RNA Nano” chip. The RNA integrity number (RIN value) was determined for each sample, and samples with RIN ≥ 9 were used for the DNA microarray analysis. RNA samples were stored at −70°C until further use.
Transcriptomic Microarray Analysis
Complementary RNA (cRNA) was produced from the RNA samples and fluorescently labeled using the MessageAmp™ II-Bacteria kit (Ambion) according to the manufacturer's instructions with either Cy3-CTP or Cy5-CTP (Perkin Elmer) as the fluorescent label. Specific activity and cRNA concentrations were determined using a NanoDrop ND-1000 spectrophotometer. The labeled samples were stored at −70°C until use. Dual-color DNA microarray hybridizations were performed using a custom Agilent 8x15K slide containing probes for the 4196 chromosomal and plasmidial Y. pestis CO92 genes and pseudogenes [Accession no. NC_003143.1 NCBI; (Parkhill et al., 2001)]. Hybridization and scanning were performed as suggested by Agilent. The slides were scanned in the Agilent DNA microarray scanner G2505B. Images were analyzed, and data were extracted using the Agilent Feature Extraction (FE) software (version 9.5.1.1), with linear and lowess normalization. Statistical analysis was performed using the Limma (Linear Models for Microarray Data) package from the Bioconductor project (http://www.bioconductor.org). The processed signal from the FE was read into Limma using the “read.maimages” function. Background subtraction and lowess normalization were performed for each array. Quantile normalization was applied between arrays. The Benjamini-Hochberg false discovery rate (FDR) was used to correct for multiple comparisons. The fold change (FC) in each gene was calculated as the median FC value measured for 3–5 different or replicated probes representing the same gene. Each experiment comprised 4 samples representing 4 different ciprofloxacin concentrations and labeled with Cy3-CTP that were co-hybridized with the growth control sample, which was not exposed to ciprofloxacin and was labeled with Cy5-CTP. Each slide was hybridized with samples originating from two independent biological experiments representing the same time point, performed with Cy3-Cy5 dye swap. The results are available online (http://www.ncbi.nlm.nih.gov/geo/), GEO ID: GSM2101145.
Quantitative Reverse Transcription-PCR (qRT-PCR)
One-step qRT-PCR was performed in a 50-μl reaction mixture containing 1 ng of total RNA as the template, 1 × buffer (0.5 M KCl, 0.1 M Tris-HCl, pH 8.8 [Bio-Rad], 1 μM SuperROX® [Biosearch Technologies]), 0.6 μM each primer, 0.3 μM TaqMan probe, 0.2 mM dNTP, 3 mM MgCl2, 0.5 μl of Sensiscript reverse transcriptase (QIAGEN), 2 U of Taq DNA polymerase (Promega) and 0.4 μl of JumpStart Taq antibodies (Sigma). Gene-specific primers and TaqMan probes (5′ 6-FAM; 3′ BHQ-1) were designed based on the Y. pestis CO92 genomic sequence (NC_003143.1) using Primer Express software (Table S1) and were ordered from IDT (USA). qRT-PCR was performed in an Applied Biosystems 7500 real-time PCR system under the following conditions: 50°C for 30 min, 95°C for 3 min, and 40 cycles of 94°C for 15 s and 60°C for 35 s. Negative template controls (NTCs) were used for each primer/probe set to exclude nonspecific reactions. No RT controls lacking Sensiscript reverse transcriptase were used to confirm the effective removal of genomic DNA. A standard curve was obtained for each primer/probe set using a serial 10-fold dilution of the growth control RNA sample (100–0.01 ng/reaction) to confirm the high dynamic range of their reaction efficiency (results not shown).
The transcript FC, defined as the ratios of the mRNA expression level in the ciprofloxacin-exposed sample to that in the untreated sample, was calculated from the difference between the Ct values (as obtained from the 7500 Real-time PCR System Sequence Detection Software) of the ciprofloxacin-exposed samples (Ct treatment) and the Ct value of the untreated control sample (Ct control) using the equation: FC = 2−ΔCt (ΔCt = Ct treatment−Ct control).
For RNA extracted from 0.5-ml culture volumes (where RNA concentrations were below the NanoDrop ND-1000 limit of detection), equal volumes (5 μl) of total RNA were used for the qRT-PCR, and the RNA concentrations were normalized using a 16S rRNA primer set (Table S1) with a 1:1000 dilution of the samples. FC was calculated according to the ΔΔCt method (FC = 2−ΔΔCt where ΔΔCt = ΔCt marker gene−ΔCt16S RNA).
Representative outcomes from two independent experiments are presented in the figures.
Results
Identification of Ciprofloxacin Growth Inhibitory-Responsive Genes by Transcriptomic Screening
To develop a rapid qRT-PCR-based molecular AST, we searched for candidate marker genes whose expression is altered in correlation with the susceptibility level following short exposure of Y. pestis to growth-inhibitory concentrations (≥1 × MIC) of ciprofloxacin (see schematic presentation in Figure 1). For this purpose, an inoculum of 5 × 10⁵–1 × 10⁶ CFU/ml of Y. pestis Kimberley53 virulent strain was obtained from BHIA, suspended in MHB and incubated for 2 h at 28°C before exposure to different ciprofloxacin concentrations, for different incubation times. Incubations were performed at the optimal growth temperature of 28°C. Because inoculum size influences the MIC value (as illustrated for Y. pestis exposed to ciprofloxacin in Figure S1), we used an inoculum concentration of 5 × 10⁵–1 × 10⁶ CFU/ml as recommended by the CLSI guidelines (CLSI, 2015). Cultures were exposed to ciprofloxacin concentrations of 0.001, 0.016, 0.5, and 4 μg/ml (equivalent to 1/16 ×, 1 ×, 31 ×, and 250 × MIC, respectively). Samples of the exposed cultures were withdrawn after 20, 45, 90, and 120 min. Total RNA purification and the transcriptomic profile characterization were performed as described in the Materials and Methods. The standard MIC value was determined in parallel using the microdilution susceptibility test and the same inoculum, culture media, and antibiotic solutions (Figure 2A). In addition, live bacterial counting was performed to characterize the ciprofloxacin-induced bacterial growth arrest and cell death and its correlation with the transcriptomic alterations following 2-h antibiotic exposure (Figure 2B).
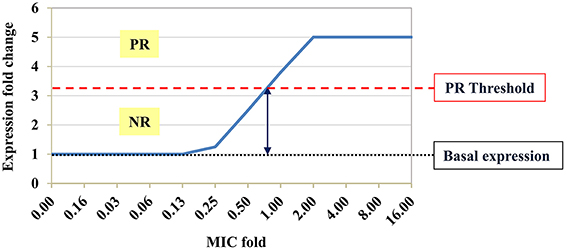
Figure 1. Schematic expression profile of a potential marker gene. Hypothetical pattern of a potential marker gene expression profile following exposure to an antibiotic at sub-MIC, MIC and above the MIC. Basal expression of the tested marker gene in the growth control sample (black dotted line) was defined as fold change (FC) = 1. Expression FC < threshold value (red dashed line) was defined as a negative response (NR), whereas FC ≥ threshold value was defined as a positive response (PR) to the antibiotic. The MIC derived from the molecular AST is the minimal antibiotic concentration that leads to PR.
Figure 2. Standard microdilution test and survival curves of Y. pestis Kimberley53 exposed to ciprofloxacin. A culture of MHB-suspended Y. pestis Kimberley53 was prepared from BHIA-plated bacteria to a standard inoculum size of 5 × 10⁵–1 × 10⁶ CFU/ml and incubated for 2 h at 28°C with moderate agitation (for adjustment of the culture from the BHIA to MHB growth medium) before performing the 24-h microdilution test. (A) The microdilution test was conducted in a 96-well microplate at the indicated ciprofloxacin concentrations, and the OD630 was measured hourly using a TECAN plate reader. (B) Survival analysis was performed by BHIA plating of serial 10-fold dilutions of replicate samples at different time points after ciprofloxacin addition. The error bars represent the SD of 3 independent experiments.
Live CFU counting of a culture exposed to a sub-MIC concentration of ciprofloxacin (0.001 μg/ml; 1/16 × MIC) did not reveal growth inhibition or cell death (Figure 2). In contrast, exposure to 1 × MIC (0.016 μg/ml) ciprofloxacin led to growth arrest (Figure 2A), while exposure to the higher ciprofloxacin concentrations of 0.5 and 4 μg/ml (31 × and 250 × MIC, respectively) caused both growth arrest (Figure 2A) and a rapid ~3 log reduction of bacterial CFU counts (Figure 2B). The survival curves of the 31 × and 250 × MIC-exposed bacteria exhibited typical biphasic patterns, consistent with the rapid killing of most cells by the fluoroquinolone and a persistent subpopulation that can survive the bactericidal effect of the antibiotic (Dörr et al., 2009).
The transcriptomic analysis of the 1 × MIC ciprofloxacin-exposed culture revealed changes in the expression (both up-regulation and down-regulation by a FC ≥ 2) of 0, 3, 13, and 31 genes following 20, 45, 90, and 120 min of ciprofloxacin exposure, respectively (Table 1). However, only some of the genes (3, 7, and 13 for 45, 90, and 120 min of ciprofloxacin exposure, respectively) exhibited changes in expression levels following exposure to 1 × MIC as well as to 31 × and 250 × MIC. Because more candidate marker genes and higher expression FC values were observed following 2 h of exposure to 1 × MIC ciprofloxacin compared to the other time points, we further developed the rapid molecular susceptibility assay using a 2-h incubation period. After 2 h of exposure, 11 genes were induced and 2 genes were repressed by a FC > 2 in all of the three tested ciprofloxacin concentrations. One of the 11 induced genes, YPMT1.86A, is plasmid encoded and was excluded from further analysis because the plasmid may not be present in all Y. pestis strains. Notably, 8 of the 10 chromosomal induced genes belong to the SOS response gene family (recN, dinI [YPO1232], recA, oraA, dinI [YPO1586], b4058, dinP, and b4043), which is known to be induced following DNA damage caused by ciprofloxacin. Similar effects have been reported following exposure of heterologous bacteria to various fluoroquinolones (Gmuender et al., 2001; Shaw et al., 2003; Kaldalu et al., 2004; Cirz et al., 2006, 2007).
Table 1. Transcriptomic microarray results for the 1 × MIC responsive genesa.
The DNA microarray screen results were validated by qRT-PCR analysis of the 10 induced and the two repressed genes using the same RNA samples that were used for the DNA microarray analysis. For comparison, a gene identified as non-responsive in the DNA microarray analysis (capR [YPO3155]) was included in the qRT-PCR validation. Seven of the 10 induced chromosomal genes (pla2, recN, dinI [YPO1232], recA, oraA, dinI [YPO1586] and YPO1233) exhibited significant changes in expression using both techniques (Figure S2 and Table 2). A good correlation with the DNA microarray results was also observed for the two repressed genes. The non-responsive gene, capR, displayed some reduction in expression at the higher ciprofloxacin concentrations in the qRT-PCR analysis, which may be attributed to the different normalization processes of the two quantification methods.
Table 2. Comparison of the FCs of selected genes determined by transcriptomic microarray and qRT-PCR analysis.
For use in a molecular AST, we chose to focus on positive response monitoring of chromosomal genes; thus, the 7 induced potential marker genes were selected for further characterization in a microdilution test format.
Characterization of the Expression Profile of the Candidate Marker Genes in a Microdilution Format
Microdilution is the standard 24-h incubation test recommended by the CLSI for susceptibility determination of Y. pestis (CLSI, 2015). To shorten this AST, we developed a molecular AST based on the standard microdilution format, which requires only a 2 h ciprofloxacin-exposure period, followed by RNA purification and qRT-PCR monitoring of the FC levels of the marker genes. The assay was performed in adherence to CLSI-recommended conditions to maximize the possibility of obtaining MIC values that are similar (equal or within one 2-fold dilution) to the standard microdilution-derived MIC values. The molecular AST-derived MIC was defined as the minimal antibiotic concentration that causes changes in the marker gene expression levels equal to or above a threshold level (see schematic presentation in Figure 1). The threshold values used in the molecular ASTs were determined by analyzing results at 1 × MIC from all of the exposure experiments using different hypothetical threshold values (starting with a value of 2.0 with 0.1 increments). For each marker, we chose the threshold value that maximized the correct MIC prediction for all tested strains while giving preference to minimizing major errors that lead to a lower molecular MIC prediction as compared to the actual MIC result by standard microdilution. We hypothesized that these threshold values could be used to determine the MICs for Y. pestis strains with unknown susceptibility levels.
We determined the standard MIC and the expression profile of the candidate marker genes following Y. pestis Kimberley53 exposure to serial two-fold dilutions of ciprofloxacin, yielding a range of antibiotic concentrations around the MIC (0.002–0.5 μg/ml, representing 0.125 × –31 × MIC). The MIC value of ciprofloxacin in the standard 24-h microdilution test for Kimberley53 was 0.016 μg/ml (Figure 3A). Exposure to sub-MIC concentrations of ciprofloxacin (0.002–0.008 μg/ml, 0.125–0.5 × MIC, respectively) resulted in a slight reduction of the growth rate compared to the growth control (Figure 3A). Monitoring the changes in the candidate marker gene expression levels revealed that 4 of the 7 candidate marker genes (recA, recN, pla2, and dinI [YPO1232]) were induced > 2-fold following exposure to ciprofloxacin concentrations of 0.016 μg/ml (1 × MIC) and above. However, the bacteria also responded to the sub-MIC concentrations with variable but correlated levels of induction. These results emphasize the high sensitivity of the molecular test, which monitors the direct and primary effects of the antibiotic on the bacterial molecular response, whereas the growth rate indicates the consequence of those molecular alterations. For example, recA was induced 2-fold following exposure to a sub-MIC concentration of 0.002 μg/ml (0.125 × MIC, Figure 3B). The induction was enhanced as the ciprofloxacin concentration increased. A threshold value of 7.5 was assigned for recA usage as a marker gene for 1 × MIC value identification. Another candidate gene, recN, was induced ~2-fold following exposure to a sub-MIC concentration of 0.004 μg/ml (0.25 × MIC), and a threshold FC value of 3.2 was set for the 1 × MIC value determination (Figure 3B). Similarly, we determined the threshold values for pla2, which was induced ~2-fold upon exposure to 0.008 μg/ml (0.5 × MIC) ciprofloxacin, and a threshold of 3.2 was assigned for the determination of the 1 × MIC value (Figure 3B). A threshold FC of 2.5 was assigned to dinI [YPO1232]. Thus, four candidate genes, recA, recN, pla2 and dinI [YPO1232], exhibited potential utility as marker genes, while the compiled expression profile results disqualified the other potential markers.
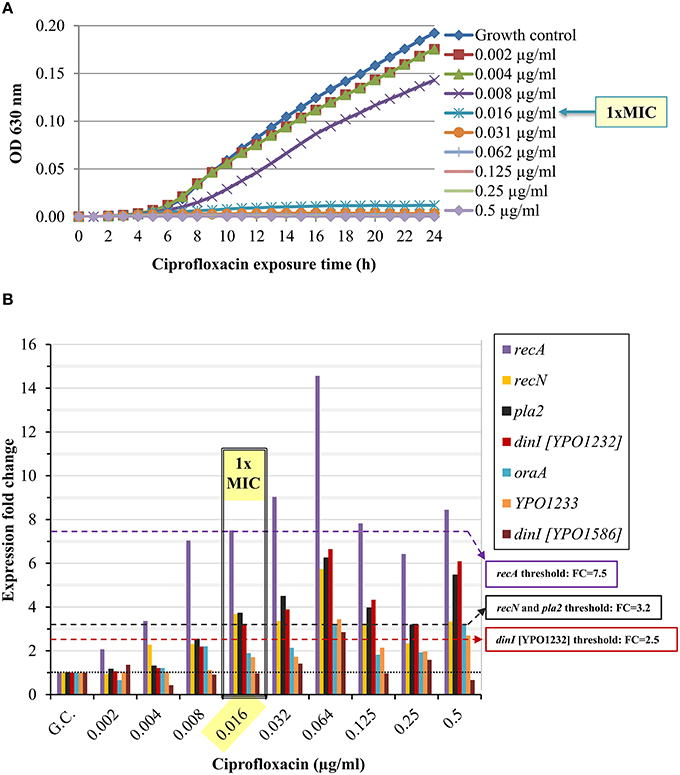
Figure 3. Ciprofloxacin-induced growth inhibition and changes in the expression levels of the candidate genes. BHIA-isolated colonies of Y. pestis Kimberley53 were suspended in MHB to a standard inoculum size of 5 × 10⁵ to 1 × 10⁶ CFU/ml. The culture was incubated for 2 h of recovery at 28°C followed by exposure to 2-fold serial dilutions of ciprofloxacin (40 ml each) at a range of 0.002–0.5 μg/ml. (A) Samples of 100 μl were transferred (from the 40 ml ciprofloxacin-exposed cultures) to a 96-well microplate. The optical density at 630 nm was recorded hourly for 24 h using a TECAN plate reader. The MIC value was determined at the 24-h time point. The OD630 values are the average of 3 replicated wells. (B) Cultures (40 ml) exposed to different concentrations of ciprofloxacin for 2 h, were used for total RNA extraction, and 1 ng of RNA sample was analyzed by qRT-PCR. The black dotted line represents basal expression (FC = 1) in the growth control sample, and the colored dashed lines represent the threshold values of the tested marker genes. The figure is representative of duplicate analyses.
Confirmation of the Molecular AST Using Kimberley53pCD1−pPCP1− Derivatives with Decreased Ciprofloxacin Susceptibility
For the proof-of-concept of the qRT-PCR-based molecular AST, we analyzed the gene expression profiles of various non-virulent Y. pestis Kimberley53pCD1−pPCP1− derivatives with different ciprofloxacin MIC values. The derivatives were either ciprofloxacin sensitive (MIC ≤ 0.25 μg/ml) or non-sensitive (MIC > 0.25 μg/ml), as defined by the ciprofloxacin susceptibility category for Y. pestis (CLSI, 2015). Point mutations in the quinolone resistance-determining region (QRDR) locus, which is part of ciprofloxacin target encoding, the gyrA gene, are known to be acquired following exposure to fluoroquinolones and reduce the bacterial sensitivity to the antibiotic (Wiedemann and Heisig, 1994; Redgrave et al., 2014). Therefore, we sequenced the QRDR locus of these isolates. Several point mutations were identified (Table 3), thus partially explaining the reduced sensitivity of these derivatives to ciprofloxacin.
Table 3. Characterization of the reduced ciprofloxacin sensitivity of non-virulent Kimberley53pCD1−pPCP1− derivatives.
The expression profiles of the four potential marker genes (recA, recN, pla2, and dinI [YPO1232]) in the non-virulent Kimberley53pCD1−pPCP1− parental strain exposed to ciprofloxacin, resembled those in the w.t. virulent Kimberley53 strain (compare Figure S3 with Figure 3B). The pla2 gene was induced ~4.5-fold in the parental strain exposed to 0.016 μg/ml ciprofloxacin (microdilution measured 1 × MIC value), representing an FC above the assigned threshold value (FC = 3.2), as required (Figure 4 and Figure S3). In contrast, isolates #83 and #66-6, which have higher MIC values (0.125 and 4 μg/ml, respectively), exhibited no induction at that (0.016 μg/ml) concentration (Figure 4). However, exposure to higher ciprofloxacin concentrations representing the isolates' higher MIC values caused induction near the threshold value and above. The exposure of isolate #83–0.125 μg/ml ciprofloxacin (the MIC value of this isolate), resulted in a lower level of induction compared to the parental strain (FC = 2.1 vs. 4.7). Thus, using a threshold value of 3.2 for pla2, determined previously, led to a molecular MIC of 0.25 μg/ml compared to 0.125 μg/ml observed in the microdilution test. A two-fold difference is acceptable because in the standard microdilution test, the accepted MIC value for QC reference strains might be in the range of 1 to 2 two-fold dilutions (CLSI, 2015). The non-sensitive isolate #66-6 (standard microdilution MIC = 4 μg/ml) exhibited marker induction above the threshold only following exposure to ciprofloxacin at its MIC value (Figure 4). Similar results were obtained in the qRT-PCR-based AST using dinI [YPO1232] (Figure 5).
Figure 4. Expression of pla2 in non-virulent Y. pestis Kimberley53pCD1−pPCP1− and its derivatives #83 and #66-6. The expression profile of pla2 was determined in the non-virulent Y. pestis Kimberley53pCD1−pPCP1− (parental strain) and its ciprofloxacin reduced-susceptibility derivatives #83 and #66-6. Cultures were prepared from bacteria grown overnight on BIN, suspended in MHB and incubated for 2 h followed by 2 h exposure to the required ciprofloxacin concentrations in a 0.5-ml culture volume in 24-well plates. RNA samples were purified and used for qRT-PCR analysis using 16S rRNA as a reference for FC determination as described in the Materials and Methods. The MIC value for each derivative was also determined by a standard microdilution test performed using the same cultures that were used for the molecular AST. The colored arrows indicate the microdilution-measured MIC values of the bacterial derivatives. The black dotted line represents basal expression (FC = 1) in the growth control sample, and the green dashed line represents the threshold value assigned to pla2 (FC = 3.2). The figure is representative of duplicate analyses.
Figure 5. Expression pattern of dinI [YPO1232] in non-virulent Y. pestis Kimberley53pCD1−pPCP1− and its derivatives #83 and #66-6. The molecular AST was performed as described in Figure 4. The black dotted line represents basal expression (FC = 1) in the growth control sample, and the red dashed line represents the threshold value assigned to dinI [YPO1232] (FC = 2.5). The figure is representative of duplicate analyses.
The level of induction of an additional marker gene, recN, in the different isolates exposed to 0.5 ×, 1 ×, and 2 × MIC ciprofloxacin was correlated with the isolate's MIC value. The threshold of 3.2 enabled the determination of the 1 × MIC values of both the sensitive and the non-sensitive Y. pestis isolates (Figure 6).
Figure 6. Expression pattern of recN in non-virulent Y. pestis EV76 and Kimberley53pCD1pPCP1− and its derivatives. The molecular AST was performed as described in Figure 4. For each derivative, the corresponding MIC (as determined by the standard microdilution assay) is given in parenthesis. The black dotted line represents basal expression (FC = 1) in the growth control sample, and the orange dashed line represents the threshold value assigned to recN (FC = 3.2). The figure is representative of duplicate analyses.
The ability of the qRT-PCR assay to determine the MIC value was also tested with EV76, another Y. pestis strain. The expression pattern of the four potential marker genes (recA, recN, pla2, and dinI [YPO1232]) was similar to the pattern observed for Kimberley53 and its derivative (Figure S4 vs. Figure 3B and Figure S3). Using the above-mentioned assigned thresholds for recN and dinI [YPO1232]) enabled the determination of the correct MIC value (microdilution MIC = 0.031 μg/ml). The MIC value determined using the threshold assigned for pla2 was 0.064 μg/ml (2 × microdilution MIC), which is within an acceptable range of the AST results. It should be noted that even though the expression pattern of recA was similar to that of the other marker genes, the previously assigned threshold for recA (7.5) could not be used to define the MIC value for EV76 because its expression level in this strain was lower than that in Kimberley53 and its derivative Kimberley53pCD1−pPCP1−. The threshold value assigned for recA was high due to its high expression level, i.e., in sub-MIC concentrations of 0.5 × and 0.25 × MIC, in Kimberley53 and its derivative Kimberley53pCD1−pPCP1− (Figure 3B and Figure S3), indicating that not only the threshold level but also the pattern of the markers' response should be taken into consideration when predicting bacterial susceptibility. In such cases, we could use the other 3 marker genes (recN, pla2, and dinI [YPO1232]) for MIC determination and the expression pattern of the fourth marker gene (recA) to strengthen the MIC interpretation.
In this manuscript, we present a proof-of-concept for rapid determination of antibiotic MIC value using a molecular approach. However, validation of the assay should be done by using additional Y. pestis strains, with different genetic backgrounds and biovars. This will enable the recommendation of valid threshold values for the candidate marker genes and the determination of the minimal marker genes required for valid MIC interpretation.
Our results indicate that the qRT-PCR AST based on these mRNA markers has the potential to be used for the rapid determination of the MIC values of ciprofloxacin for Y. pestis.
Discussion
Reducing the time required for ASTs is of significant importance, particularly for patients infected with pathogenic bacteria that grow slowly in vitro but can cause rapidly progressing fatal disease, such as that caused by Y. pestis. In addition, the emerging number of drug-resistant bacterial strains necessitates the development of novel technologies for rapid ASTs (Pulido et al., 2013; van Belkum and Dunne, 2013). Standard ASTs are time consuming because they are based on bacterial growth in the presence and absence of the tested antimicrobial agent in liquid media or growth in antibiotic diffusion gradients, such as the disk diffusion test or Etest methods (Jorgensen and Ferraro, 2009). In addition to the time required for incubation during the antibiogram tests, a pure culture must first be obtained by isolation and enrichment steps. These growth-dependent and time-consuming steps are the bottleneck for standard ASTs and prolong the overall process to several days and even weeks, depending on the bacterial source and the growth rate of the tested bacteria. Thus, the development of alternative rapid ASTs is crucial.
Various alternative AST methods have been described in recent years, including nucleic acid-based ASTs. These nucleic acid-based ASTs are performed by determining either the bacterial chromosomal DNA copy number using qPCR or phage-specific mRNA transcript copy number using qRT-PCR (Waldeisen et al., 2011; Mulvey et al., 2015). However, these assays are still growth dependent and time consuming. PCR methods to detect mutations or gene lesions responsible for the acquisition of resistance have been used for various bacteria, such as monitoring point mutations in gyrA responsible for ciprofloxacin resistance in Y. pestis (Lindler and Fan, 2003). However, this method is not reliable because only some resistance-conferring genes are known. Moreover, the MIC value cannot be determined because the correlation of the bacterial genotype with the antibiotic susceptibility is not direct (van Belkum and Dunne, 2013).
In the present article, we describe the development of a rapid molecular AST that is based on quantifying the FC of specific mRNA marker expression following antibiotic exposure. In contrast to DNA-based methods, our approach is correlated with the level of bacterial susceptibility to the tested antibiotic agent. If the bacteria are sensitive to the tested antimicrobial concentration, the culture will exhibit a physiological response according to its susceptibility, and this response can be quantified at the mRNA level. However, if the bacteria are not sensitive to the tested antimicrobial concentration, no stress will be imposed on the culture; thus, no significant change in the expression of the specific marker genes will be observed. Accordingly, at higher antibiotics concentrations equal to or above the MIC of the reduced susceptibility strain, a significant change in the markers' expression will be observed, thus enabling the determination of the bacterial MIC value.
Antibiotic-responsive (induced or repressed) genes were previously described for various antimicrobial agents; however, these genes were not universal and not necessarily suitable for MIC determination. The development of a molecular test requires the identification of marker genes suitable for the specific drug-bacterium combination and under the specific (standard) exposure conditions. Therefore, we performed DNA microarray analysis of the Y. pestis Kimberley53 virulent strain after exposure for various time periods to several ciprofloxacin concentrations under standard CLSI test guidelines. Ciprofloxacin was chosen because it is one of the antibiotics of choice for treatment in Y. pestis exposure or ongoing plague disease (Inglesby et al., 2000; Peterson et al., 2010). We identified several SOS responsive genes that were induced, and their levels of induction were correlated with ciprofloxacin concentration. Some of those genes were also induced to a greater extent as the exposure time increased (Table 1). Eight genes (recN, dinI [YPO1232], recA, oraA, dinI [YPO1586], b4058, dinP, and b4043, Table 1) of the 11 induced genes identified following 2 h of exposure belong to the SOS response gene family. We characterized four genes (recA, pla2, recN, and dinI [YPO1232]) of the 11 induced genes for potential use as markers for antimicrobial susceptibility determination by the qRT-PCR method. The expression FC value of each marker mRNA following exposure to 1 × MIC antibiotic was determined relative to the basal expression in the growth control and was used for assignment of the threshold value. The markers' threshold values were used to interpret the MIC values of various Y. pestis strains and derivatives. The minimal antibiotic concentration that resulted in marker gene expression equal to or greater than its assigned threshold value was determined as the molecular MIC value. This molecular MIC value was identical to or differed by up to one 2-fold dilution from the standard microdilution-derived MIC value and predicted identical ciprofloxacin susceptibility categories of several derivatives, representing a wide range of ciprofloxacin susceptibilities (Figures 4–6). When evaluating a new susceptibility method, both sensitive and resistant strains should be examined, and an overall 1 × MIC agreement of greater than 90% plus or minus one double dilution of a standard CLSI-derived MIC should be attained (Jorgensen and Ferraro, 2009). Our molecular assay is well within the range of these guidelines.
An mRNA-based AST of various heterologous bacteria and antibiotics was recently described (Barczak et al., 2012; Hou et al., 2015). However, the experiments were performed using a non-standard inoculum (OD600 of ~1, which represents ~109 CFU/ml). Inoculum concentration affects the MIC value (Figure S1), and thus molecular susceptibility determination using a non-standard inoculum size might be inaccurate. The reported mRNA-based AST enables the determination of the category of susceptibility only and not the MIC value, in contrast to the method described here. In addition, the reported mRNA-based AST was used to monitor alterations in gene expression in cultures exposed to only one representative antibiotic concentration (Barczak et al., 2012). We believe that molecular AST should be conducted using a wider range of 2-fold antibiotic dilutions in a microdilution-like format that includes the category interpretation breakpoints, as we presented here. This format, together with molecular mRNA marker expression changes that correlate with the bacterial susceptibility level, will enable the rapid determination of the category of susceptibility of Y. pestis strains, regardless of their MIC value.
Here, we demonstrate that the duration of the AST can be reduced by replacing the 24-h standard microdilution test with a 7-h molecular AST that includes the following steps: culture recovery (2 h), ciprofloxacin exposure (2 h), total RNA purification (1 h) and qRT-PCR analysis of specific mRNA markers (2 h; Figure 7). Automation of the total RNA purification and qRT-PCR steps would make the assay simpler and even faster.
Figure 7. Schematic comparison of the steps and duration of the standard AST and the molecular AST for Y. pestis susceptibility determination. *Isolation and enrichment steps are recommended by the CDC/WHO (Dennis et al., 1999). The AST conditions were guided by the CLSI recommendations (CLSI, 2015).
Moreover, the duration of the overall susceptibility determination process may be shortened by reducing not only the AST assay but also the isolation and enrichment preliminary steps. This alteration may be achieved using BIN, a selective agar plate that can enable both Y. pestis selection and efficient growth (Ber et al., 2003). Here, we used a 20- to 24-h BIN-plated Y. pestis as the source for the molecular AST. Thus, the usage of BIN in combination with the molecular AST may reduce the overall required time for the standard CLSI-based AST process, which can be up to 120 h for heterogeneous environmental samples or ~72 h for homogenous clinical samples, to a 27- to 31-h protocol (Figure 7). Moreover, isolation and enrichment from blood samples may be replaced by a 15-min procedure of centrifugation using a vacutainer serum separation tube (vacutainer SST), as we previously reported (Steinberger-Levy et al., 2007) and may thus enable the antibiogram results within 8 h.
A similar approach can be used to develop molecular assays for additional antibiotics and for other slow-growing pathogenic bacteria. We are currently using this novel molecular AST approach to develop a similar assay for MIC and susceptibility category determination of doxycycline for Y. pestis, an additional recommended antibiotic for prophylaxis and treatment of plague.
Author Contributions
Research project design: IS, OS, AZ, NA, AB, OI, and RB. Experiments: IS, OS, AZ, NA, DG, MA, SM, and RB. Writing: IS, OS, and RB.
Funding
This study was supported by the Israeli Institute of Biology Research, Ness Ziona, Israel.
Conflict of Interest Statement
The authors declare that the research was conducted in the absence of any commercial or financial relationships that could be construed as a potential conflict of interest.
Supplementary Material
The Supplementary Material for this article can be found online at: http://journal.frontiersin.org/article/10.3389/fmicb.2016.00763
Footnotes
References
Barczak, A. K., Gomez, J. E., Kaufmann, B. B., Hinson, E. R., Cosimi, L., Borowsky, M. L., et al. (2012). RNA signatures allow rapid identification of pathogens and antibiotic susceptibilities. Proc. Natl. Acad. Sci. U.S.A. 109, 6217–6222. doi: 10.1073/pnas.1119540109
Ben-Gurion, R., and Hertman, I. (1958). Bacteriocin-like material produced by Pasteurella pestis. J. Gen. Microbiol. 19, 289–297.
Ber, R., Mamroud, E., Aftalion, M., Tidhar, A., Gur, D., Flashner, Y., et al. (2003). Development of an improved selective agar medium for Isolation of Yersinia pestis. Appl. Environ. Microbiol. 69, 5787–5792. doi: 10.1128/aem.69.10.5787-5792.2003
Brazas, M. D., and Hancock, R. E. W. (2005). Ciprofloxacin induction of a susceptibility determinant in Pseudomonas aeruginosa. Antimicrob. Agents Chemother. 49, 3222–3227. doi: 10.1128/aac.49.8.3222-3227.2005
Burckhardt, I., and Zimmermann, S. (2011). Using matrix-assisted laser desorption ionization-time of flight mass spectrometry to detect carbapenem resistance within 1 to 2.5 hours. J. Clin. Microbiol. 49, 3321–3324. doi: 10.1128/jcm.00287-11
Butler, T. (2013). Plague gives surprises in the first decade of the 21st century in the United States and worldwide. Am. J. Trop. Med. Hyg. 89, 788–793. doi: 10.4269/ajtmh.13-0191
Cirz, R. T., Jones, M. B., Gingles, N. A., Minogue, T. D., Jarrahi, B., Peterson, S. N., et al. (2007). Complete and SOS-mediated response of Staphylococcus aureus to the antibiotic ciprofloxacin. J. Bacteriol. 189, 531–539. doi: 10.1128/jb.01464-06
Cirz, R. T., O'Neill, B. M., Hammond, J. A., Head, S. R., and Romesberg, F. E. (2006). Defining the Pseudomonas aeruginosa SOS response and its role in the global response to the antibiotic ciprofloxacin. J. Bacteriol. 188, 7101–7110. doi: 10.1128/jb.00807-06
CLSI. (2015). M45 Methods for Antimicrobial Dilution and Disk Susceptibility Testing of Infrequently Isolated or Fastidious Bacteria. Wayne, PA: Clinical and Laboratories Standard Institute.
Dennis, D. T., Gage, K. L., Gratz, N. G., Poland, J. D., and Tikhomirov, E. (1999). Plague Manual: Epidemiology, Distribution, Surveillance and Control. Geneva: World Health Organization.
Dennis, D. T., and Hughes, J. M. (1997). Multidrug resistance in plague. New Engl. J. Med. 337, 702–704. doi: 10.1056/NEJM199709043371010
Dörr, T., Lewis, K., and Vulić, M. (2009). SOS response induces persistence to fluoroquinolones in Escherichia coli. PLoS Genet. 5:e1000760. doi: 10.1371/journal.pgen.1000760
Flashner, Y., Mamroud, E., Tidhar, A., Ber, R., Aftalion, M., Gur, D., et al. (2004). Generation of Yersinia pestis attenuated strains by signature-tagged mutagenesis in search of novel vaccine candidates. Infect. Immun. 72, 908–915. doi: 10.1128/iai.72.2.908-915.2004
Gage, K. L., and Kosoy, M. Y. (2005). Natural history of plague: perspectives from more than a century of research. Ann. Rev. Entomol. 50, 505–528. doi: 10.1146/annurev.ento.50.071803.130337
Galimand, M., Carniel, E., and Courvalin, P. (2006). Resistance of Yersinia pestis to antimicrobial agents. Antimicrob. Agents Chemother. 50, 3233–3236. doi: 10.1128/aac.00306-06
Gmuender, H., Kuratli, K., Di Padova, K., Gray, C. P., Keck, W., and Evers, S. (2001). Gene expression changes triggered by exposure of Haemophilus influenzae to novobiocin or ciprofloxacin: combined transcription and translation analysis. Genome Res. 11, 28–42. doi: 10.1101/gr.157701
Hou, H. W., Bhattacharyya, R. P., Hung, D. T., and Han, J. (2015). Direct detection and drug-resistance profiling of bacteremias using inertial microfluidics. Lab. Chip. 15, 2297–2307. doi: 10.1039/c5lc00311c
Inglesby, T. V., Dennis, D. T., Henderson, D. A., Bartlett, J. G., Ascher, M. S., Eitzen, E., et al. (2000). Plague as a biological weapon: medical and public health management. JAMA 283, 2281–2290. doi: 10.1001/jama.283.17.2281
Jepras, R. I., Paul, F. E., Pearson, S. C., and Wilkinson, M. J. (1997). Rapid assessment of antibiotic effects on Escherichia coli by bis-(1,3-dibutylbarbituric acid) trimethine oxonol and flow cytometry. Antimicrob. Agents Chemother. 41, 2001–2005.
Jorgensen, J. H., and Ferraro, M. J. (2009). Antimicrobial susceptibility testing: a review of general principles and contemporary practices. Clin. Infect. Dis. 49, 1749–1755. doi: 10.1086/647952
Kaldalu, N., Mei, R., and Lewis, K. (2004). Killing by ampicillin and ofloxacin induces overlapping changes in Escherichia coli transcription profile. Antimicrob. Agents Chemother. 48, 890–896. doi: 10.1128/aac.48.3.890-896.2004
Kinnunen, P., McNaughton, B. H., Albertson, T., Sinn, I., Mofakham, S., Elbez, R., et al. (2012). Self-assembled magnetic bead biosensor for measuring bacterial growth and antimicrobial susceptibility testing. Small (Weinheim an der Bergstrasse, Germany) 8, 2477–2482. doi: 10.1002/smll.201200110
Lindler, L. E., and Fan, W. (2003). Development of a 5′ nuclease assay to detect ciprofloxacin resistant isolates of the biowarfare agent Yersinia pestis. Mol. Cell. Probes 17, 41–47. doi: 10.1016/S0890-8508(02)00111-1
Lindler, L. E., Fan, W., and Jahan, N. (2001). Detection of ciprofloxacin-resistant Yersinia pestis by fluorogenic PCR using the LightCycler. J. Clin. Microbiol. 39, 3649–3655. doi: 10.1128/JCM.39.10.3649-3655.2001
Louie, A., Brown, D. L., Liu, W., Kulawy, R. W., Deziel, M. R., and Drusano, G. L. (2007a). In vitro infection model characterizing the effect of efflux pump inhibition on prevention of resistance to levofloxacin and ciprofloxacin in Streptococcus pneumoniae. Antimicrob. Agents Chemother. 51, 3988–4000. doi: 10.1128/AAC.00391-07
Louie, A., Deziel, M. R., Liu, W., and Drusano, G. L. (2007b). Impact of resistance selection and mutant growth fitness on the relative efficacies of Streptomycin and levofloxacin for plague therapy. Antimicrob. Agents Chemother. 51, 2661–2667. doi: 10.1128/AAC.00073-07
Louie, A., Heine, H. S., VanScoy, B., Eichas, A., Files, K., Fikes, S., et al. (2011a). Use of an in vitro pharmacodynamic model to derive a moxifloxacin regimen that optimizes kill of Yersinia pestis and prevents emergence of resistance. Antimicrob. Agents Chemother. 55, 822–830. doi: 10.1128/AAC.00818-10
Louie, A., VanScoy, B., Liu, W., Kulawy, R., Brown, D., Heine, H. S., et al. (2011b). Comparative efficacies of candidate antibiotics against Yersinia pestis in an in vitro pharmacodynamic model. Antimicrob. Agents Chemother. 55, 2623–2628. doi: 10.1128/AAC.01374-10
Mulvey, M. C., Lemmon, M., Rotter, S., Lees, J., Einck, L., and Nacy, C. A. (2015). Optimization of a nucleic acid-based reporter system to detect Mycobacterium tuberculosis antibiotic sensitivity. Antimicrob. Agents Chemother. 59, 407–413. doi: 10.1128/aac.03135-14
Parkhill, J., Wren, B. W., Thomson, N. R., Titball, R. W., Holden, M. T. G., Prentice, M. B., et al. (2001). Genome sequence of Yersinia pestis, the causative agent of plague. Nature 413, 523–527. doi: 10.1038/35097083
Peterson, J. W., Moen, S. T., Healy, D., Pawlik, J. E., Taormina, J., Hardcastle, J., et al. (2010). Protection afforded by fluoroquinolones in animal models of respiratory infections with Bacillus anthracis, Yersinia pestis, and Francisella tularensis. Open Microbiol. J. 4, 34–46. doi: 10.2174/1874285801004010034
Pulido, M. R., García-Quintanilla, M., Martín-Peña, R., Cisneros, J. M., and McConnell, M. J. (2013). Progress on the development of rapid methods for antimicrobial susceptibility testing. J. Antimicrob. Chemother. 68, 2710–2717. doi: 10.1093/jac/dkt253
Redgrave, L. S., Sutton, S. B., Webber, M. A., and Piddock, L. J. V. (2014). Fluoroquinolone resistance: mechanisms, impact on bacteria, and role in evolutionary success. Trends Microbiol. 22, 438–445. doi: 10.1016/j.tim.2014.04.007
Shaw, K. J., Miller, N., Liu, X., Lerner, D., Wan, J., Bittner, A., et al. (2003). Comparison of the changes in global gene expression of Escherichia coli induced by four bactericidal agents. J. Mol. Microbiol. Biotechnol. 5, 105–122. doi: 10.1159/000069981
Steinberger-Levy, I., Zahavy, E., Cohen, S., Flashner, Y., Mamroud, E., Aftalion, M., et al. (2007). Enrichment of Yersinia pestis from blood cultures enables rapid antimicrobial susceptibility determination by flow cytometry. Adv. Exp. Med. Biol. 603, 339–350. doi: 10.1007/978-0-387-72124-8_31
Tidhar, A., Flashner, Y., Cohen, S., Levi, Y., Zauberman, A., Gur, D., et al. (2009). The NlpD lipoprotein is a novel Yersinia pestis virulence factor essential for the development of plague. PLoS ONE 4:e7023. doi: 10.1371/journal.pone.0007023
Udani, R. A., and Levy, S. B. (2006). MarA-like regulator of multidrug resistance in Yersinia pestis. Antimicrob. Agents Chemother. 50, 2971–2975. doi: 10.1128/AAC.00015-06
Vagima, Y., Zauberman, A., Levy, Y., Gur, D., Tidhar, A., Aftalion, M., et al. (2015). Circumventing Yersinia pestis virulence by early recruitment of neutrophils to the lungs during pneumonic plague. PLoS Pathog 11:e1004893. doi: 10.1371/journal.ppat.1004893
van Belkum, A., and Dunne, W. M. (2013). Next-generation antimicrobial susceptibility testing. J. Clin. Microbiol. 51, 2018–2024. doi: 10.1128/jcm.00313-13
Waldeisen, J. R., Wang, T., Mitra, D., and Lee, L. P. (2011). A real-time PCR antibiogram for drug-resistant sepsis. PLoS ONE 6:e28528. doi: 10.1371/journal.pone.0028528
Keywords: antibiotics, rapid AST, Y. pestis, qRT-PCR, molecular testing, ciprofloxacin, minimal inhibitory concentration (MIC), RNA expression
Citation: Steinberger-Levy I, Shifman O, Zvi A, Ariel N, Beth-Din A, Israeli O, Gur D, Aftalion M, Maoz S and Ber R (2016) A Rapid Molecular Test for Determining Yersinia pestis Susceptibility to Ciprofloxacin by the Quantification of Differentially Expressed Marker Genes. Front. Microbiol. 7:763. doi: 10.3389/fmicb.2016.00763
Received: 07 February 2016; Accepted: 05 May 2016;
Published: 19 May 2016.
Edited by:
Yuji Morita, Aichi Gakuin University, JapanReviewed by:
Vishvanath Tiwari, Central University of Rajasthan, IndiaHelen Kreuzer, Pacific Northwest National Laboratory, USA
Ian Mark Gut, National Biodefense Analysis and Countermeasures Center, USA
Copyright © 2016 Steinberger-Levy, Shifman, Zvi, Ariel, Beth-Din, Israeli, Gur, Aftalion, Maoz and Ber. This is an open-access article distributed under the terms of the Creative Commons Attribution License (CC BY). The use, distribution or reproduction in other forums is permitted, provided the original author(s) or licensor are credited and that the original publication in this journal is cited, in accordance with accepted academic practice. No use, distribution or reproduction is permitted which does not comply with these terms.
*Correspondence: Ida Steinberger-Levy, idasl@iibr.gov.il;
Raphael Ber, raphaelb@iibr.gov.il