 Gonzalo Martinez-Fernandez1*
 Stuart E. Denman1
 Chunlei Yang2
 Jane Cheung1
 Makoto Mitsumori3
 Christopher S. McSweeney1
- 1CSIRO, Agriculture and Food, Queensland Bioscience Precinct, St Lucia, QLD, Australia
- 2Institute of Dairy Science, MoE Key Laboratory of Molecular Animal Nutrition, College of Animal Sciences, Zhejiang University, Hangzhou, China
- 3NARO Institute of Livestock and Grassland Science, Tsukuba, Japan
Management of metabolic hydrogen ([H]) in the rumen has been identified as an important consideration when reducing ruminant CH4 emissions. However, little is known about hydrogen flux and microbial rumen population responses to CH4 inhibition when animals are fed with slowly degradable diets. The effects of the anti-methanogenic compound, chloroform, on rumen fermentation, microbial ecology, and H2/CH4 production were investigated in vivo. Eight rumen fistulated Brahman steers were fed a roughage hay diet (Rhode grass hay) or roughage hay:concentrate diet (60:40) with increasing levels (low, mid, and high) of chloroform in a cyclodextrin matrix. The increasing levels of chloroform resulted in an increase in H2 expelled as CH4 production decreased with no effect on dry matter intakes. The amount of expelled H2 per mole of decreased methane, was lower for the hay diet suggesting a more efficient redirection of hydrogen into other microbial products compared with hay:concentrate diet. A shift in rumen fermentation toward propionate and branched-chain fatty acids was observed for both diets. Animals fed with the hay:concentrate diet had both higher formate concentration and H2 expelled than those fed only roughage hay. Metabolomic analyses revealed an increase in the concentration of amino acids, organic, and nucleic acids in the fluid phase for both diets when methanogenesis was inhibited. These changes in the rumen metabolism were accompanied by a shift in the microbiota with an increase in Bacteroidetes:Firmicutes ratio and a decrease in Archaea and Synergistetes for both diets. Within the Bacteroidetes family, some OTUs assigned to Prevotella were promoted under chloroform treatment. These bacteria may be partly responsible for the increase in amino acids and propionate in the rumen. No significant changes were observed for abundance of fibrolytic bacteria, protozoa, and fungi, which suggests that fiber degradation was not impaired. The observed 30% decrease in methanogenesis did not adversely affect rumen metabolism and the rumen microbiota was able to adapt and redirect [H] into other microbial end-products for both diets. However, it is also required dietary supplements or microbial treatments to capture the additional H2 expelled by the animal to further improve rumen digestive efficiency.
Introduction
The principal greenhouse gas emitted from livestock is enteric CH4 which represents between 7 and 18% of total anthropogenic emissions (Hristov et al., 2013). Methane produced as an end product of fermentation constitutes an energy loss from digested feed (estimated between 2 and 12% of gross energy intake; Johnson and Johnson, 1995). If methanogenesis was inhibited and the available [H] was redirected into alternative energy-yielding metabolic pathways increased productivity could be expected. Thus, reducing CH4 production could potentially improve productivity for the same energetic intake by the animal provided rumen metabolism is not compromised.
The fermentation of feedstuff in the rumen by bacteria, protozoa, and fungi produces H2 which is used by some bacteria and methanogens to obtain energy while generating metabolic end products through this process. Methanogenic archaea are the main consumers of the H2 in this ecosystem, producing CH4 as the end product (Ungerfeld and Kohn, 2006; Janssen, 2010). It has been assumed that H2 accumulation resulting from the inhibition of methanogenesis will impair fiber digestion and fermentation (Wolin et al., 1997; McAllister and Newbold, 2008; Janssen, 2010). However, Mitsumori et al. (2012) found that inhibition of methanogenesis by bromochloromethane (BCM) in goats (around 80% CH4 decrease) dramatically increased H2 expelled without affecting dry matter intake (DMI) and feed digestibility. BCM has been used in numerous studies to decrease CH4 production in ruminants and it is considered one of the most effective inhibitors of methanogenesis (Denman et al., 2007; Goel et al., 2009; Abecia et al., 2012; Mitsumori et al., 2012). The restrictions on use of BCM due to its ozone depleting capacity have led to other halogenated methanogenesis inhibitors such as chloroform and bromoethanesulfonate (BES) being used in ruminant research as experimental models (Dong et al., 1999; Ungerfeld et al., 2004; Knight et al., 2011). Chloroform appears to decrease rumen CH4 production to the same extent as BCM with little or no adverse effect on rumen fermentation in dairy cows and in vitro (Knight et al., 2011; Hwang et al., 2012). Chloroform, like BCM, interferes with the transfer of the methyl group to methyl-coenzyme M (CoM) at the cobamide-dependent methyl transferase step of the methanogenesis pathway (Gunsalus and Wolfe, 1978; Graham and White, 2002).
Management of H2 in the rumen was identified as an important consideration when inhibiting ruminant CH4 emissions since it is assumed that accumulation of H2 would inhibit the re-oxidation of NADH and adversely affect fermentation (Wolin et al., 1997; Joblin, 1999). However, H2 is rarely measured while much effort is expended on quantifying the amounts of CH4 formed in animal studies. Recently three studies have measured both the expelled CH4 and H2 simultaneously in cattle and dairy cows. Rooke et al. (2014) showed significant differences on CH4 and H2 emissions between diets when cattle were fed a high-concentrate or a mixed forage-concentrate diet. Veneman et al. (2015) observed an increase in expelled H2 when methanogenesis was inhibited in dairy cows treated with nitrates or linseed oil and fed with a total mixed ration. Significant increases in expelled H2 occurred when methanogenesis was inhibited in dairy cows fed with a total mixed ration and treated with 3-nitrooxypropanol with non-detrimental effects on feed intake or apparent total tract digestibility (Hristov et al., 2015). In fact, a recent meta-analysis (Ungerfeld, 2015) of in vitro trials observed a greater accumulation of H2 when inhibiting methanogenesis in incubations with increasing concentrate substrate. However, little is known about rumen fermentation and microbial population responses to CH4 inhibition when animals are fed with slowly degradable diets, such as low quality roughage hay. With the exception of a study conducted by Vyas et al. (2016), there is scarce information about the effects of inhibiting methanogenesis with different types of diet in the same in vivo study.
The aims of the present study were to analyze the effect of chloroform on CH4 production, [H] flux, and subsequent responses in rumen fermentation and microbial community composition of cattle on diets of varying quality. Three dose levels of chloroform were administered into the rumen of steers fed ad libitum on two different diets of roughage:concentrate (60:40) or roughage hay. It was hypothesized that lesser amounts of H2 relative to intake would accumulate in the roughage fed animals compared to those receiving a roughage:concentrate diet due to a shift in fermentation to reductive processes that will consume more reducing equivalents, resulting in less energy lost to the animal.
Materials and Methods
The experimental protocol complied with the Australian Code for the Care and Use of Animals for Scientific Purposes (eighth edition, 2013) and was approved by the local Animal Experimentation and Ethics Committee (A18/2013).
Experimental Design and Sampling
Eight rumen-fistulated Brahman (Bos indicus) steers (mean, live weight LW, 288 ± 7 kg) were used in the experiment. Animals were randomly allocated to two groups (four animals per group), each group receiving a different ad libitum diet twice per day. One group was fed a roughage hay diet (Rhode grass hay; chemical composition: DM, 881 g/kg fresh matter; in g/kg of DM: OM, 802; CP, 50; NDF, 765: ADF, 454; ADL, 64; ash, 65; and GE 16.5 MJ/kg) and the second group received a roughage hay:concentrate diet (60:40; Ridley AgriProducts Pty Ltd, Brisbane, QLD, Australia. Concentrate ingredients (g/kg): barley (574), sorghum (200), molasses mixer (30), cotton hull pellet (100), urea (5); concentrate chemical composition: DM, 906 g/kg fresh matter; in g/kg of DM: OM, 906; CP, 116; NDF, 263; ADF, 120; ADL, 30; fat, 34; ash, 74; and GE 17.2 MJ/kg) being the hay the same for both diets. Animals were adapted to each diet over an initial 17 days period. After that initial period, experimental animals were maintained in individual pens in an animal house for the measurement of individual intakes (10 days) and were treated with cyclodextrin (CD; 3 g/100 kg LW). On days 9 and 10 animals were confined in open-circuit respiration chambers for measurement of CH4 and H2 production and collection of rumen samples (control period). Following the initial adaption/control period animals received a low dose of chloroform-cyclodextrin (CCD; 1 g/100 kg LW) for 10 days with the last 2 days being confined in open-circuit respiration chambers for direct measurement of CH4 and H2 production. Doses were then increased to a mid level (1.6 g/100 kg LW) for 10 days with rumen fluid collection and CH4/H2 measurements, and then to a high level (2.6 g/100 kg LW) for 10 days with a similar sampling regime for the final 2 days. The CCD doses were split up in two shots and administered through the rumen cannula at 0 and 3 h after feeding. After a 15 days period without CCD animals were returned to open circuit respiration chambers during two consecutive days with a similar rumen sampling regime (post-treatment period). Rumen fluid samples (60 mL per animal) were collected using a probe covered with two layers of cheesecloth at 3 h post feeding and just before dosing with CCD during each confinement period in respiration chambers. Rumen samples were stored at -20°C for short chain fatty acids (SCFA) and NH3-N analyses. Additionally, 20 mL were kept at -80°C for DNA extraction and metabolite analyses.
Antimethanogen Formulation
The antimethanogen was an halogenated hydrocarbon (chloroform) entrapped in a β-CD matrix (May et al., 1995). The formulation was prepared by CSIRO Manufacturing (Clayton, VIC, Australia) in 3-kg batches and contained 6–7% w/w chloroform. Chloroform was encapsulated within a CD matrix, to increase its stability and slow its rate of release in the rumen. Similar halogenated analogs (such as bromochloromethane) entrapped in a CD matrix have been previously used in ruminants, to delay the release of the antimethanogenic compound in the rumen (Denman et al., 2007; Abecia et al., 2012; Mitsumori et al., 2012).
Gas Measurements
Four open circuit respiration chambers were used to determine CH4 production from individual steers. Each chamber had an internal volume of 23.04 m3 and was equipped with a water trough and feed bin containing the daily ration. Each chamber was maintained at 2°C below ambient air temperature, approximately -10 Pa, and the relative humidity for the two, 24 h measurement periods varied from 50 to 75%. Air was drawn through a 250 mm diameter duct into each chamber at a rate of 3000 L/min. Exact flow rates, corrected to measured conditions for temperature and pressure for each chamber were used in calculations for CH4 and H2 production (Takahashi et al., 1999; Williams et al., 2007). Flow rate through each chamber was measured using thermal flow sensors (SS20.500 SCHMIDT® Flow Sensor). The air sample for the analysis of gas composition was drawn from a point in the exhaust duct through polyurethane tubing at 4.5 L/min using a micro diaphragm pump located between a multiport gas switching unit (SW & WS Burrage, Ashford Kent UK) and membrane drier (Perma Pure LLC). Air samples from each chamber initially passed through particulate filters (AF30-02 SMC Pneumatics Aust. Pty Ltd) and a four port fridge drier prior to the multiport gas switching unit which was programmed to cycle through each chamber and two outside air ports. Air samples passed through a chemical drier and were metered through independent rotameters before compositional analysis for CO2 and CH4 (Servomex 4100 Servomex Group Ltd. Crowborough, UK) and H2 (Servomex Chroma, Servomex Group Ltd, Crowborough, UK; and Dräger X-am 5000, Draeger Safety Pacific Pty. Ltd., Notting Hill, VIC, Australia). Data for flow rate, temperature and chamber pressure, and CH4/H2 content of the exhaust air for the final 315 s of each sampling event was used to calculate CH4 and H2 flux.
Chemical Analysis
The feed samples were dried in a forced-air oven at 105°C prior to grinding. Feed samples were ground through a 1-mm sieve before analysis. DM, ash, NDF, ADF, lignin, fat, gross energy (adiabatic calorimeter), and total nitrogen contents were analyzed by Symbio Alliance (Eight Mile Plains, QLD, Australia) following the accredited methods CF006.1, CF007, CF038.3, CF038.3, CF038.6, CF004.1, CF237, and CF003.2, respectively (Association of Official Analytical Chemists [AOAC], 2005 official methods: 925.60, 923.03, 920.39, 990.03, 2002.04, and 973.18). The nitrogen values were converted to CP by multiplying by 6.25.
Concentrations of SCFAs (acetate, propionate, n-butyrate, iso-butyrate, iso-valerate, and n-valerate) were measured by gas chromatography (GC) as described by Gagen et al. (2014). Iso-valerate (3-methyl butyrate) includes 2-methylbutyrate, which co-eluted.
The NH3-N concentration was determined by a colorimetric method following Chaney and Marbach (1962).
An UltiMate® 3000 HPLC system (Dionex, Sunnyvale, CA, USA) with a dedicated Photodiode Array Detector and an Autosampler was used to determine the presence of formic acid in samples supernatants as described by Gagen et al. (2014).
Calculation of [H] Redirection and Non-carboxyl SCFA Carbons
As actual flows of metabolites formation were not measured, concentrations were used as a proxy to estimate changes in the incorporation of [H] into SCFA (HUSr) and formate (HUFr). The stoichiometry was calculated as follows (Goel et al., 2009):
The CH4 gas production (GP; mol/day) and H2 gas production (GP; mol/day) was used to calculate the ratio between [H] redirected to H2 expelled/CH4 decrease ((H2 GP)/(CH4 GP decrease × 4)).
Total non-carboxyl SCFA carbon concentration were calculated using the following formula:
Average chain length (ACL) = [mM Formate + (2x mM Acetate) + (3x mM Propionate) + (4x mM Butyrate) + (5x mM
Valerate)]/[Total mM Formate + Acetate + Propionate + Butyrate + Valerate]
The calculation removes from consideration the carboxyl group of the SCFA and provides a standard for comparison for SCFA energy available to the animal (Ungerfeld, 2013).
The non-carbohydrate contributions to SCFA were assumed to be unimportant and were not considered in the calculations described above.
Rumen Metabolomics Analyses
Samples from rumen fluid were prepared and metabolites quantified by Metabolomics Australia, University of Melbourne.
Amines quantification: Sample volumes of 10 μL of rumen fluid supernatant were placed in 2 mL Eppendorf tubes under cold conditions (4°C). Methanol (100% MeOH, 250 μL) containing four internal standards [13C-sorbitol (0.5 mg/mL), 13C5-15N-Valine (0.5 mg/mL), 2-aminoanthracene (0.25 mg/mL), and pentafluorobenzoic acid (0.25 mg/mL)] was added to the sample tubes and the samples were vortexed for 5 min until uniform. The samples were then incubated in a Thermomixer (Eppendorf brand, distributed by Quantum Scientific, Australia) at 70°C with a mixing speed of 850 rpm for 15 min, followed by a 15 min of centrifugation at 4°C at 13,800 × g in an Eppendorf benchtop centrifuge. The MeOH supernatant was transferred into a new 2 mL Eppendorf tube and set aside. Water (250 μL, Milli-Q grade) was added to the remaining sample pellet in the initial tube and vortexed for 5 min before being centrifuged at 13,800 x g at 4°C for 15 min. The H2O supernatant was transferred to the Eppendorf tube containing the MeOH supernatant and vortexed to mix. A 10 μL aliquot was transferred to a fresh Eppendorf tube in preparation for derivatisation with 6-aminoquinolyl-N-hydroxysuccinimidyl carbamate (Aqc) followed by LC-MS analysis as per Boughton et al. (2011). In summary, 70 μL borate buffer was added to the sample aliquot, vortexed to mix and then centrifuged at 13,800 × g at 4°C for 1 min. Then, 20 μL Aqc reagent was added to the sample aliquot, vortexed immediately to mix and then centrifuged at 13,800 × g at 4°C for 1 min. The Aqc-treated samples were incubated in a Thermomixer at 55°C with a mixing speed of 1150 rpm for 10 min and then centrifuged at 13,800 × g at 4°C for 5 min. The derivatized samples were then transferred to HPLC vials for LC-MS analysis as described by Boughton et al. (2011).
Sugars, organics, and fatty acids quantification: Sample volumes of 240 μL of rumen fluid supernatant were placed in 2 mL Eppendorf tubes under cold conditions (4°C) and 320 μL of 100% methanol, containing 2% 13C6-Sorbitol as a quantitative internal standard, was added. The samples were then vortexed for 1 min and incubated with shaking (950 rpm) at 30°C for 15 min prior to centrifugation at 13,800 × g for 15 min at room temperature in a bench-top Eppendorf centrifuge. The supernatant was transferred to a clean tube while the remaining pellet was re-extracted with 640 μL of CHCl3 and vortexing for 1 min. After re-centrifugation as before, 60 μL of the polar upper phase was removed and dried under vacuum without heating prior to preparation for sugars and organic acids quantitation as described by Dias et al. (2015). The lower CHCl3-phase was dried under vacuum without heating then reconstituted in 320 μL of CHCl3 before a 160 μL aliquot transferred to a glass insert and re-dried under vacuum prior to preparation for fatty acid quantitation described by Dias et al. (2015).
DNA Extractions
DNA extractions were carried out on rumen samples using the cetyltrimethylammonium bromide (CTAB) method of Brookman and Nicholson (2005) with minor modifications as follows: samples were centrifuged (13,000 × g for 5 min), and the supernatant was removed before DNA extraction. Cells were homogenized with 200 mg of silica–zirconium beads (1:1 mixture of 0.1- and 1.0-mm beads; Biospec, Bartlesville, OK, USA) and 800 μl of CTAB buffer in a Mini-Beadbeater-8 (Biospec) on maximum speed for 2 min, twice. Samples were incubated at 70°C for 20 min and centrifuged at 10,000 × g for 10 min, and the supernatant was mixed with 500 μl of 25:24:1 phenol–chloroform–isoamyl alcohol (Fluka BioChemika, Buchs, Switzerland). The yield and purity of the extracted DNA were assessed with a NanoDrop 8000 spectrophotometer (Thermo Fisher Scientific, Wilmington, DE, USA).
Real-Time PCR Analysis
The DNA samples were used as templates for quantifying the abundance of anaerobic rumen fungi, protozoa populations, and mcrA gene for methanogens. The primers and assay conditions used were previously published (Sylvester et al., 2004; Denman and McSweeney, 2006; Denman et al., 2007). Real-time PCR (qPCR) analyses were run in triplicate from one DNA extraction on an Applied BiosystemsTM ViiATM 7 Real-Time PCR System (Thermo Fisher Scientific Inc.). Assays were set up using the SensiFAST SYBR® Lo-ROX (Bioline). Optimisation of assay conditions was performed for primer, template DNA, and MgCl2 concentrations. An optimal primer concentration of 400 nM, a final MgCl2 concentration of 3 mM and DNA template concentration of 50 ng were used for each assay under the following cycle conditions: one cycle of 50°C for 10 s and 95°C for 2 min 30 s for initial denaturation, forty cycles at 95°C for 15 s and 60°C for 1 min for primer annealing and product elongation. Fluorescence detection was performed at the end of each annealing and extension step. Amplicon specificity was performed via dissociation curve analysis of PCR end products by raising the temperature at a rate of 0.05°C/s from 60 to 95°C. Changes in targeted populations were calculated using a relative quantification calculation and the 2-ΔΔCt method, with the control period used as the calibrator and total bacterial (Denman and McSweeney, 2006) Ct (cycle threshold) values used as the reference value (Livak and Schmittgen, 2001). Estimation of abundance of target populations to indicate their contribution to the sample was also calculated using standard curves for each target gene generated from cloned PCR products (Mitsumori et al., 2012).
16S rDNA Analysis
Using high throughput sequencing platforms and barcoded primer sets, phylogenetic based methods targeting the 16S rDNA gene were used to deeply characterize the microbial populations present in the rumen for the control and treatment periods. The V4 region of the 16S rRNA gene was targeted using specific primers (Kozich et al., 2013). Each individual DNA sample was amplified using the specific primers and a unique barcode combination. Afterward, amplification products were visualized by performing gel electrophoresis. Product quantities were calculated and an equal molar amount of each product was pooled. The pooled products were run in a 1% agarose gel and bands were visualized and excised under blue light transillumination. The amplicons were gel purified with QIAquick Gel extraction Kit (Qiagen, Hilden, Germany) prior to submission for Illumina Miseq.
Short read sequence data generated was analyzed using QIIME: Quantitative Insights Into Microbial Ecology software package (Caporaso et al., 2010). Sequences were clustered as operational taxonomic units (OTUs) of 97% similarity using uclust (Edgar, 2010). Taxonomic assignment of sequences was performed against the Greengenes database (McDonald et al., 2012). Alpha and beta diversity and significant fold change of OTU’s were performed in the R packages ade4, Phyloseq, and DESeq2 (Chessel et al., 2004; McMurdie and Holmes, 2013; Love et al., 2014). The sequences obtained in this paper have been deposited in the European Nucleotide Archive (ENA) under the accession number PRJEB13653.
Statistical Analyses
The effect of dose, diet, and their interaction were analyzed for the CH4/H2 production, DMI and fermentation variables as a univariate repeated-measures analysis of variance using the GLM procedure of SPSS (IBM, version 21.0), with animal as the experimental unit. Linear and quadratic components of the response to incremental dose of CCD were evaluated using polynomial contrasts. Effects were considered significant at P ≤ 0.05 and considered as tendencies toward significance at P ≤ 0.10. When significant differences were detected, differences among means were tested by pairwise comparisons (LSD test). The model used was:
Where:
yijtk is the dependent variable measured at time t on the i-th steer treated with the j-th dose and the k-th feed,
μ the overall mean,
dj is the fixed dose effect,
fk is the fixed feed effect,
(d × f)jk the interaction between dose and feed,
𝜖ijkt the residual error associated with the i-th steer within the j-th dose and k-th feed at time t.
Results
Ruminal Fermentation and Gas Production
There was an interaction (P = 0.040) between dose and diet on DM intake (DMI), with a decrease in DMI with CCD dose increase in the hay:concentrate diet, and an increase in DMI with CCD dose increase in the hay diet (Table 1). Methane production (g/kg DMI) was decreased significantly (P < 0.01) for mid and high doses compared with the control on both diets. Conversely H2 expelled by treated animals increased significantly (P < 0.05) as CH4 production was decreased, with the greatest amounts of H2 release (g/kg DMI) occurring in animals supplemented with the roughage hay:concentrate diet. Both effects were linear, showing a dose-dependent response. In addition the amount of H2 expelled relative to the decrease in CH4 (mol H2/mol CH4 decrease) was greater in animals fed the concentrate diet showing a significant (P < 0.05) diet effect, although no diet–dose interaction was observed. Fourteen days after the CCD treatment was terminated, the CH4 and H2 production were no significantly different to the control period for both diets (data not shown).
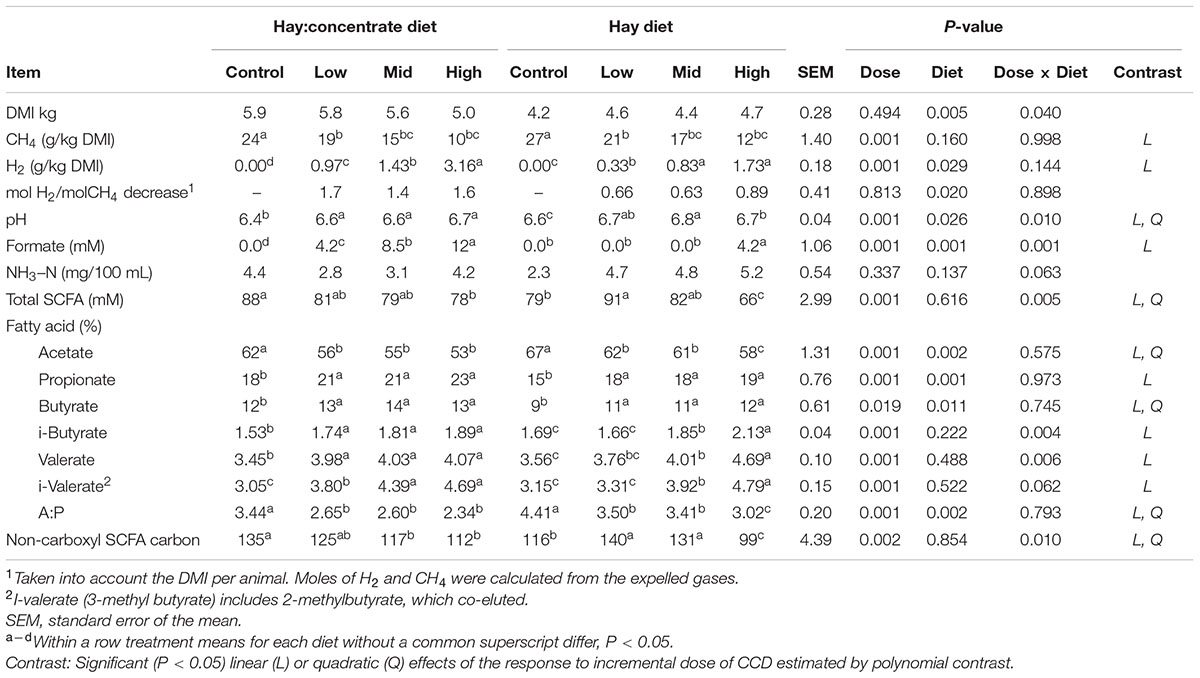
TABLE 1. Control and CCD doses (low, mid, and high) effects on DMI, CH4, and H2 production, and rumen fermentation variables from samples collected 3 h after feeding of animals fed with hay:concentrate or hay diet.
Rumen SCFA analysis showed a shift in the fermentation pathways (Table 1) toward a higher propionate profile when CCD was linearly increased on both diets. This was reflected by a significant decrease in acetate molar percentage (P < 0.001) and an increase in propionate molar percentage (P < 0.05) for both diets. As a result, a significant linear and quadratic decrease of the acetate:propionate ratio was observed at all doses for both diets. A diet–dose interaction (P = 0.005) was observed for the total SCFA concentration, with a significant decrease with the highest dose of CCD for the hay:concentrate diet. The hay diet, however, showed a significant (P < 0.001) increase in total SCFA concentration when animals were treated with the low and mid dose of CCD and a decrease with the high dose. Butyrate molar percentage linearly increased with CCD with both diets (P < 0.011). The branched-chain SCFA linearly increased with both diets, showing a diet–dose interaction effect (P < 0.05), with the greatest increase observed for the hay diet. Rumen pH increased linearly with CCD (P < 0.001) treatment for both diets showing a diet–dose interaction (P = 0.01). Rumen ammonia concentration was unchanged compared with the control period for both diets. A significant linear increase in formate concentration was observed for all CCD doses for the hay:concentrate diet and only with the hay diet at the highest CCD dose, showing a diet and a diet–dose interaction (P < 0.001). Regarding the diet effect, it was observed for formate, pH, acetate, propionate, butyrate, and acetate:propionate ratio. Interestingly, the total non-carboxyl SCFA carbons linearly decreased (P = 0.002) for the hay:concentrate diet and increased for the hay diet at low and mid doses, showing a diet-dose interaction (P = 0.01).
Rumen metabolite profiles for control and treated animals at mid dose of CCD are shown in Supplementary Table S1. Some amino acids, organic acids and sugars were significantly increased on both diets in animals treated with CCD, although the profile observed was different for each diet. A greater number of metabolites increased significantly (P < 0.05) for those animals fed the hay diet, (amino acids: serine, homoserine, asparagine, threonine, proline, valine, isoleucine, leucine, tyramine, and phenethylamine; the organic acids: malate, fumarate, malonate, and nicotinic acid; and the sugars: arabitol, fructose, and inositol). In animals fed the hay:concentrate diet the greatest increase (P < 0.05) was observed for the amino acids: homoserine, asparagine, proline, valine, isoleucine, glutamate (P = 0.053), and leucine (P = 0.080); and the sugars: ribose, arabitol, and inositol. A marked fold increase was observed in nucleic acid precursors/derivatives (inosine and hypoxanthine) in CCD treated animals compared with the control group, fed with hay (P ≤ 0.05) or hay:concentrate (P ≤ 0.10) diet, while no significant effect was observed on lactate concentrations (Supplementary Table S2).
The calculation of the [H] redirection showed a different pattern for the [H] into SCFA (Figure 1A) and formate/SCFA ratio (Figure 1B) for each diet. All the CCD doses showed a significant (P ≤ 0.001) increase in [H] redirected into formate for the hay:concentrate diet, while for the hay diet, a measurable proportion of [H] was recovered in formate only at the highest CCD dose. On the other hand, a significant increase (P ≤ 0.05) of [H] redirected into SCFA was observed with the low and mid dose for the hay diet, while no significant effect was detected for the grain:concentrate diet. Interestingly, a diet effect (P ≤ 0.05) was observed for the H2/CH4 decrease ratio (Figure 1C), being more [H] recovered into H2 per mole of CH4 decrease for the hay:concentrate compared with the hay diet.
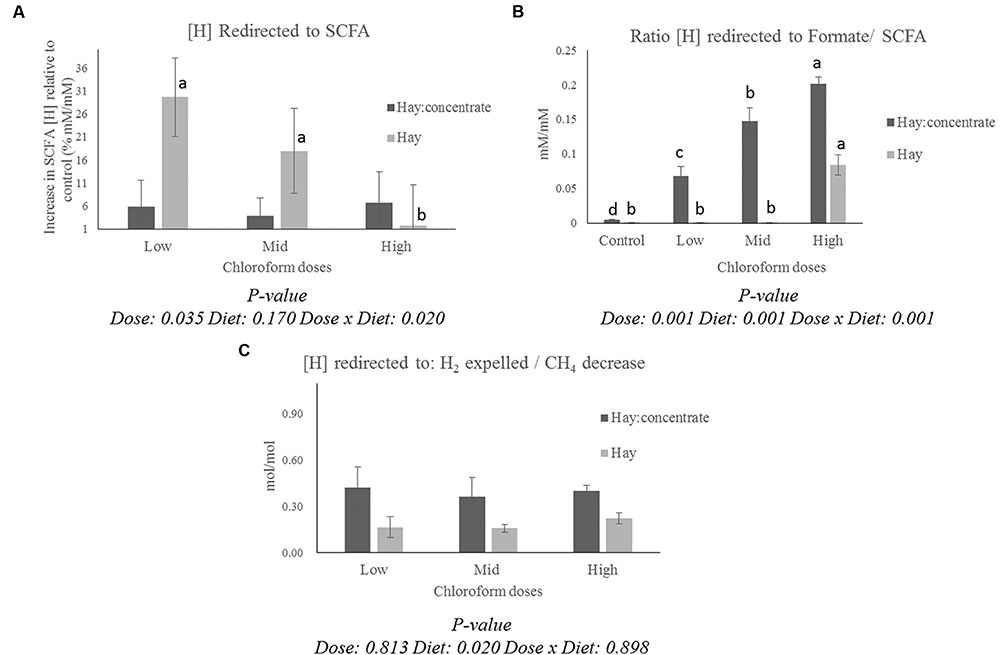
FIGURE 1. Effect of CCD doses on (A) redirection of [H] to SCFA (Increase of [H] incorporated into SCFA relative to control for each diet, % mM/mM), (B) the ratio between [H] incorporated into formate and [H] incorporated into SCFA for each diet, and (C) the ratio between [H] redirected to H2 expelled/CH4 decrease with both diets. a-dLetters denote significant differences between doses for each diet, bars that do not share the same letter are significantly different from each other in each diet (P < 0.05).
Microbial Community
The dose effect of CCD on the abundance of methanogens, protozoa, and fungi are shown in Supplementary Figure S1 for hay:concentrate and hay diet, respectively. The methanogen abundance decreased (P < 0.05) with increasing doses of CCD for both diets. The CCD doses tended to increse the protozoa abundance in animals fed with the hay:concentrate diet, whereas the anaerobic fungi were not significantly affected by the CCD doses for either diets.
The diversity analysis of the rumen microbiota showed that total microbial species richness was impacted with the administration of all CCD doses in animals fed the hay:concentrate diet, whilst only the highest dose of CCD resulted in a significantly altered for the hay diet. While the CCD caused an increase in observed and estimated speciess richness for hay:concentrate diet animals, a contraction in Shannon diversity was observed for mid and high doses on a roughage diet. The microbial species richness from the post-treatment period samples showed similar values to the highest dose of CCD on both diets (Supplementary Figure S2).
The composition of the microbiomes as determined by beta diversity analysis showed a clear separation between the control and CCD doses for both diets (Supplementary Figure S3). The post-treatment period was similar to the low CCD dose or intermediate between that dose and the control treatment. The greatest variance observed between control and CCD groups was 18 and 15% in hay:concentrate and roughage diets, respectively. Variation between animals explained the next level of variance irrespective of treatment due to one animal possessing a different microbial population compared to the other three animals on both diets. The variance between individual animals decreased at the high CCD dose and post-treatment period (Supplementary Figure S3).
Analysis of the rumen microbiome showed a shift in the relative abundance at the phylum level when the CCD dose was increased in both diets. An increase in the sequences assigned to the Bacteroidetes phylum and a decrease in Firmicutes, Synergistetes, Verrucomicrobia, and Archaea were observed in both diets (Figures 2 and 3). An increase in sequences assigned to the Proteobacteria phylum, mainly classified as Succinivibrionaceae family, were observed in the hay:concentrate diet animals upon treatment with CCD in contrast with hay diet. Consequently the Bacteroidetes:Firmicutes ratio increased with both diets when methanogenesis was inhibited (Figure 4). The ratios of sequences assigned to Archaea, Synergistetes, and Verrucomicrobia in relation to bacteria, decreased when CCD dose increased and methane was inhibited showing a dose-dependent effect (Figures 4 and 5).
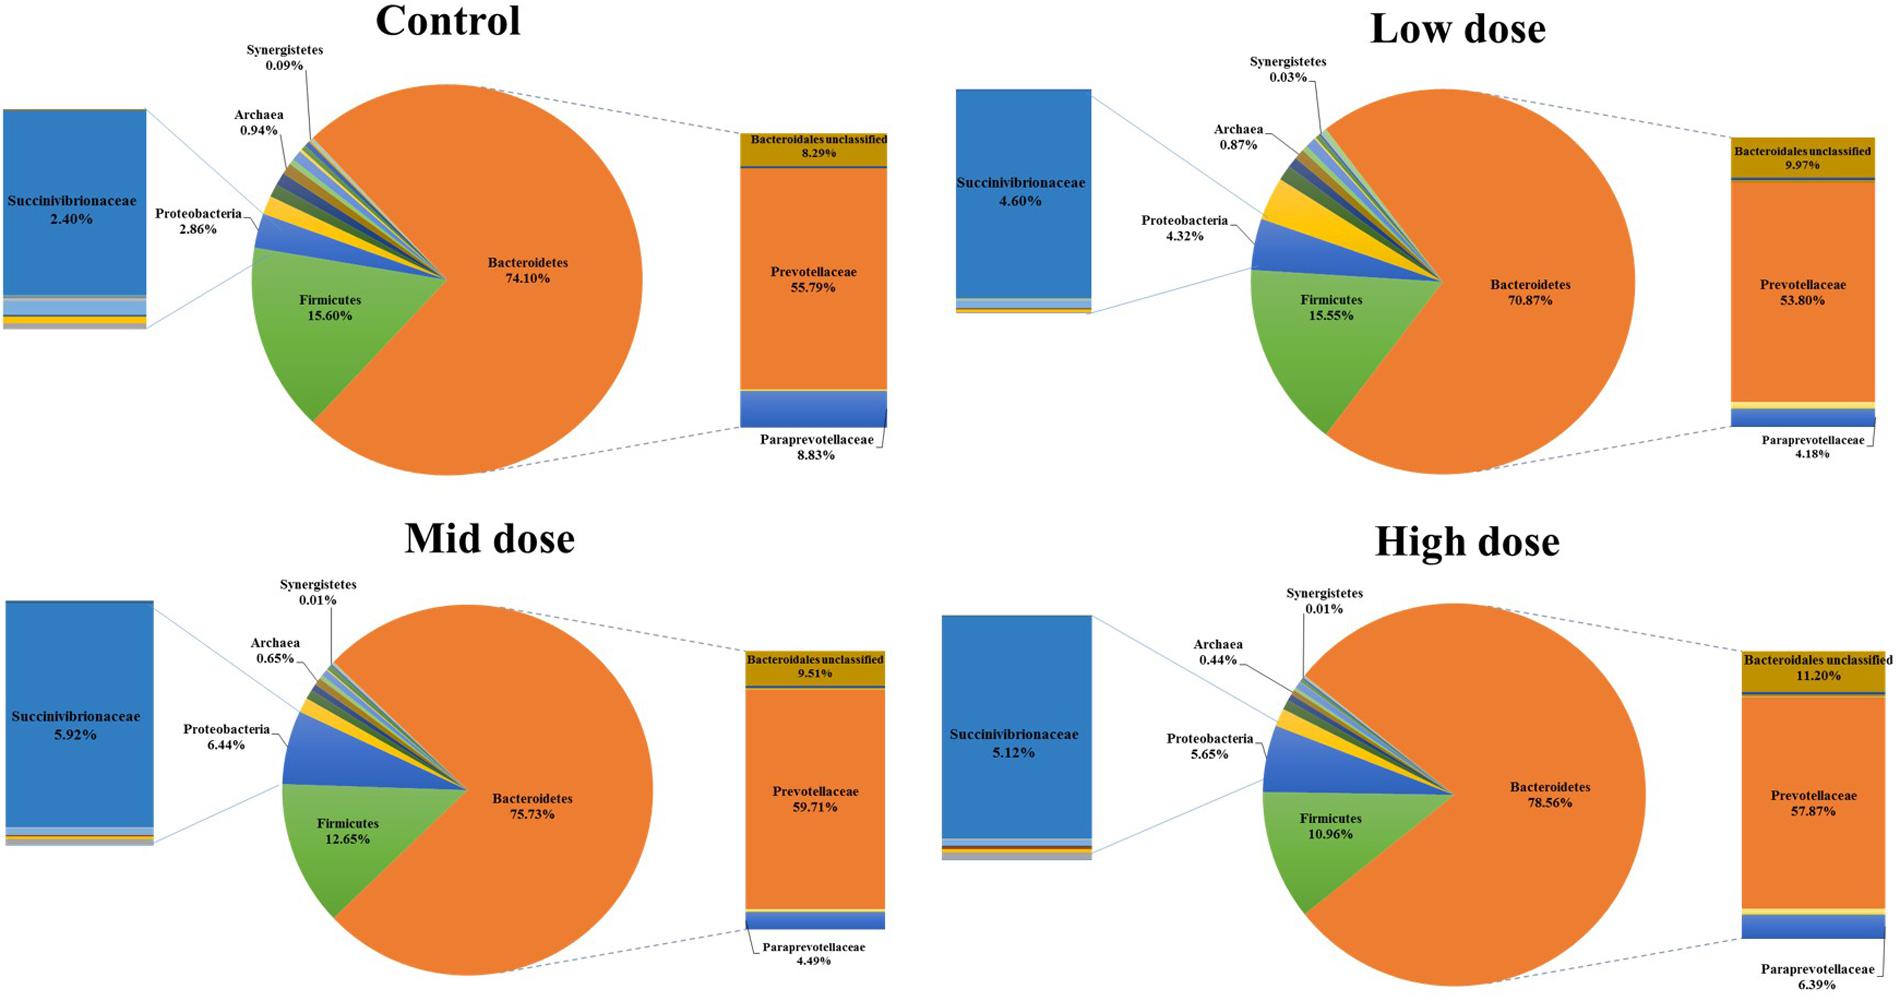
FIGURE 2. Taxonomic composition of rumen microbiome at the phylum level (pie chart) and family level (bar chart) for control and CCD (low, mid, and high doses) in animals fed with hay:concentrate diet 3 h after feeding.
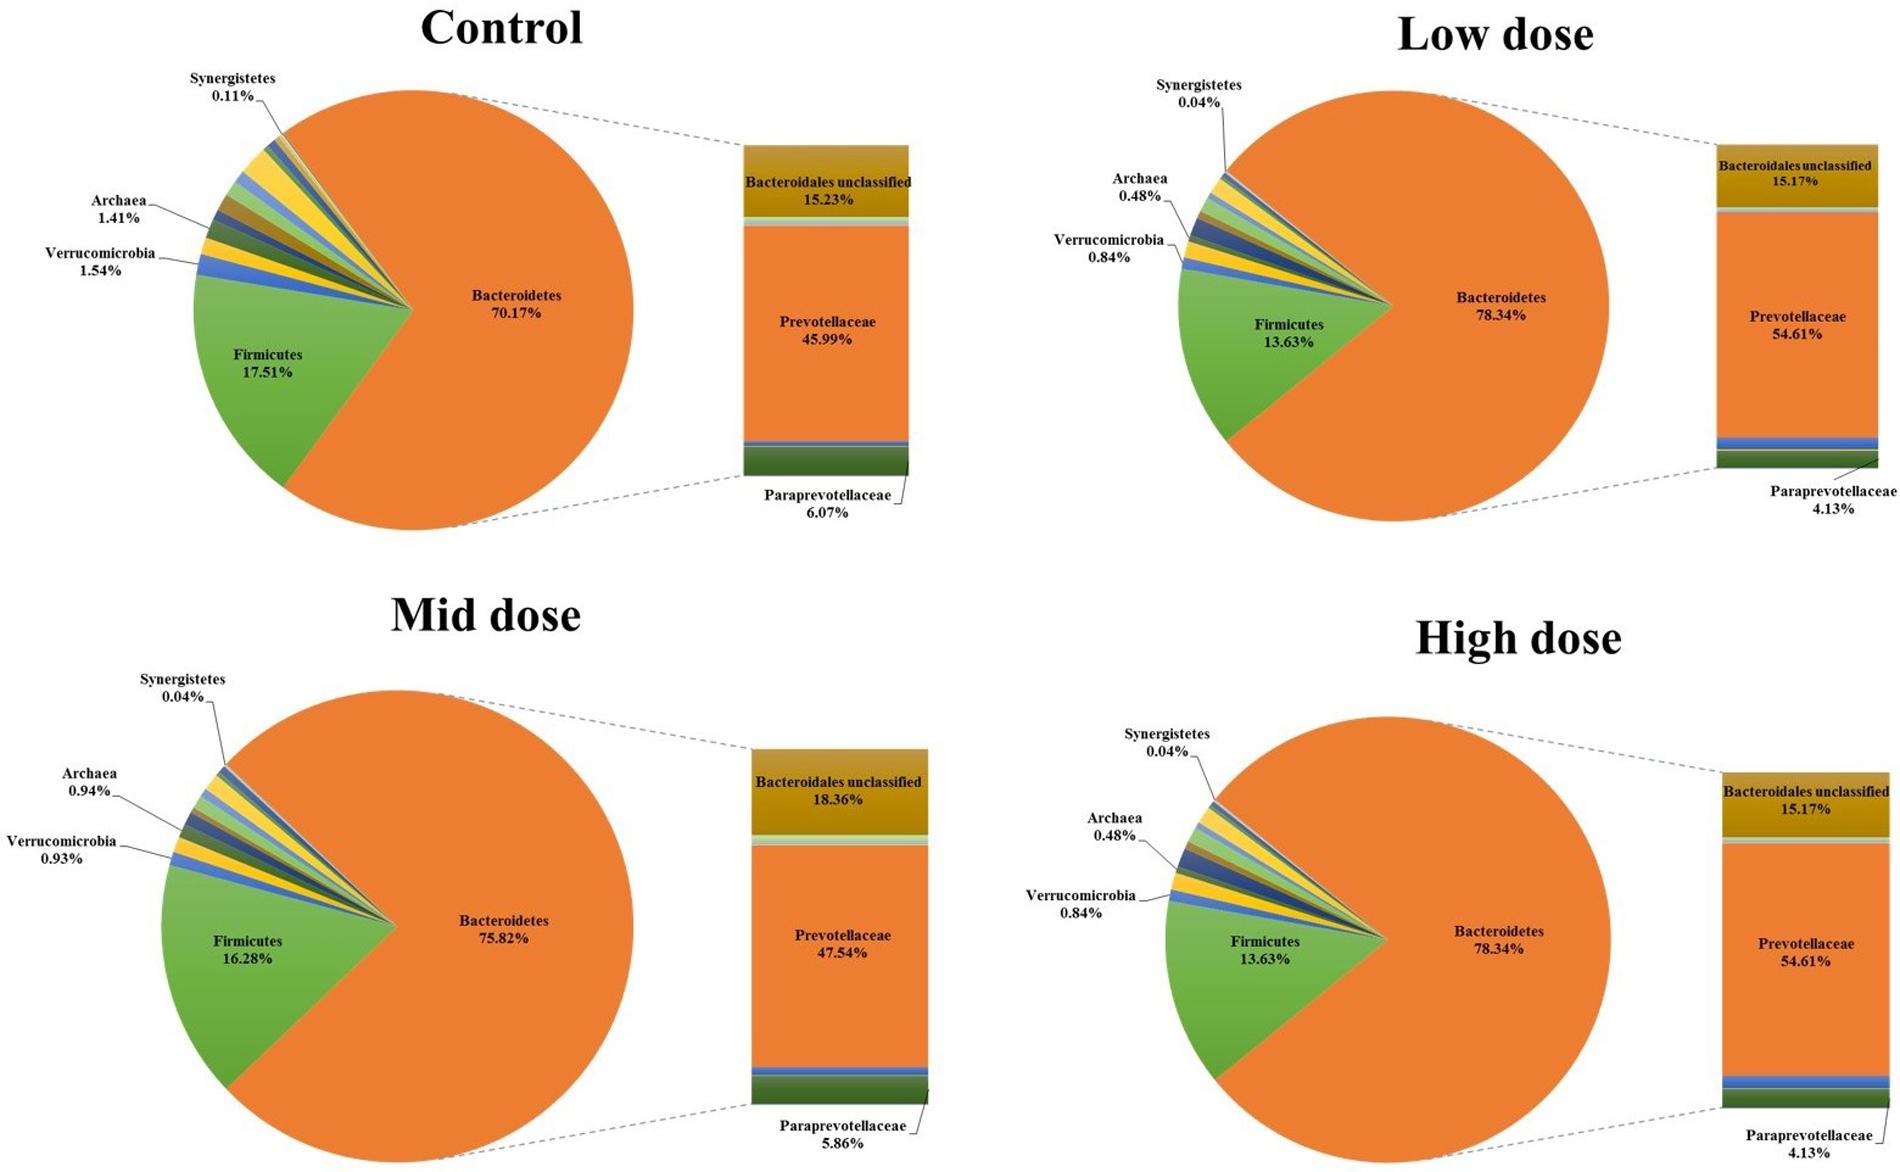
FIGURE 3. Taxonomic composition of rumen microbiome at the phylum level (pie chart) and family level (bar chart) for control and CCD (low, mid, and high doses) in animals fed with hay diet 3 h after feeding.
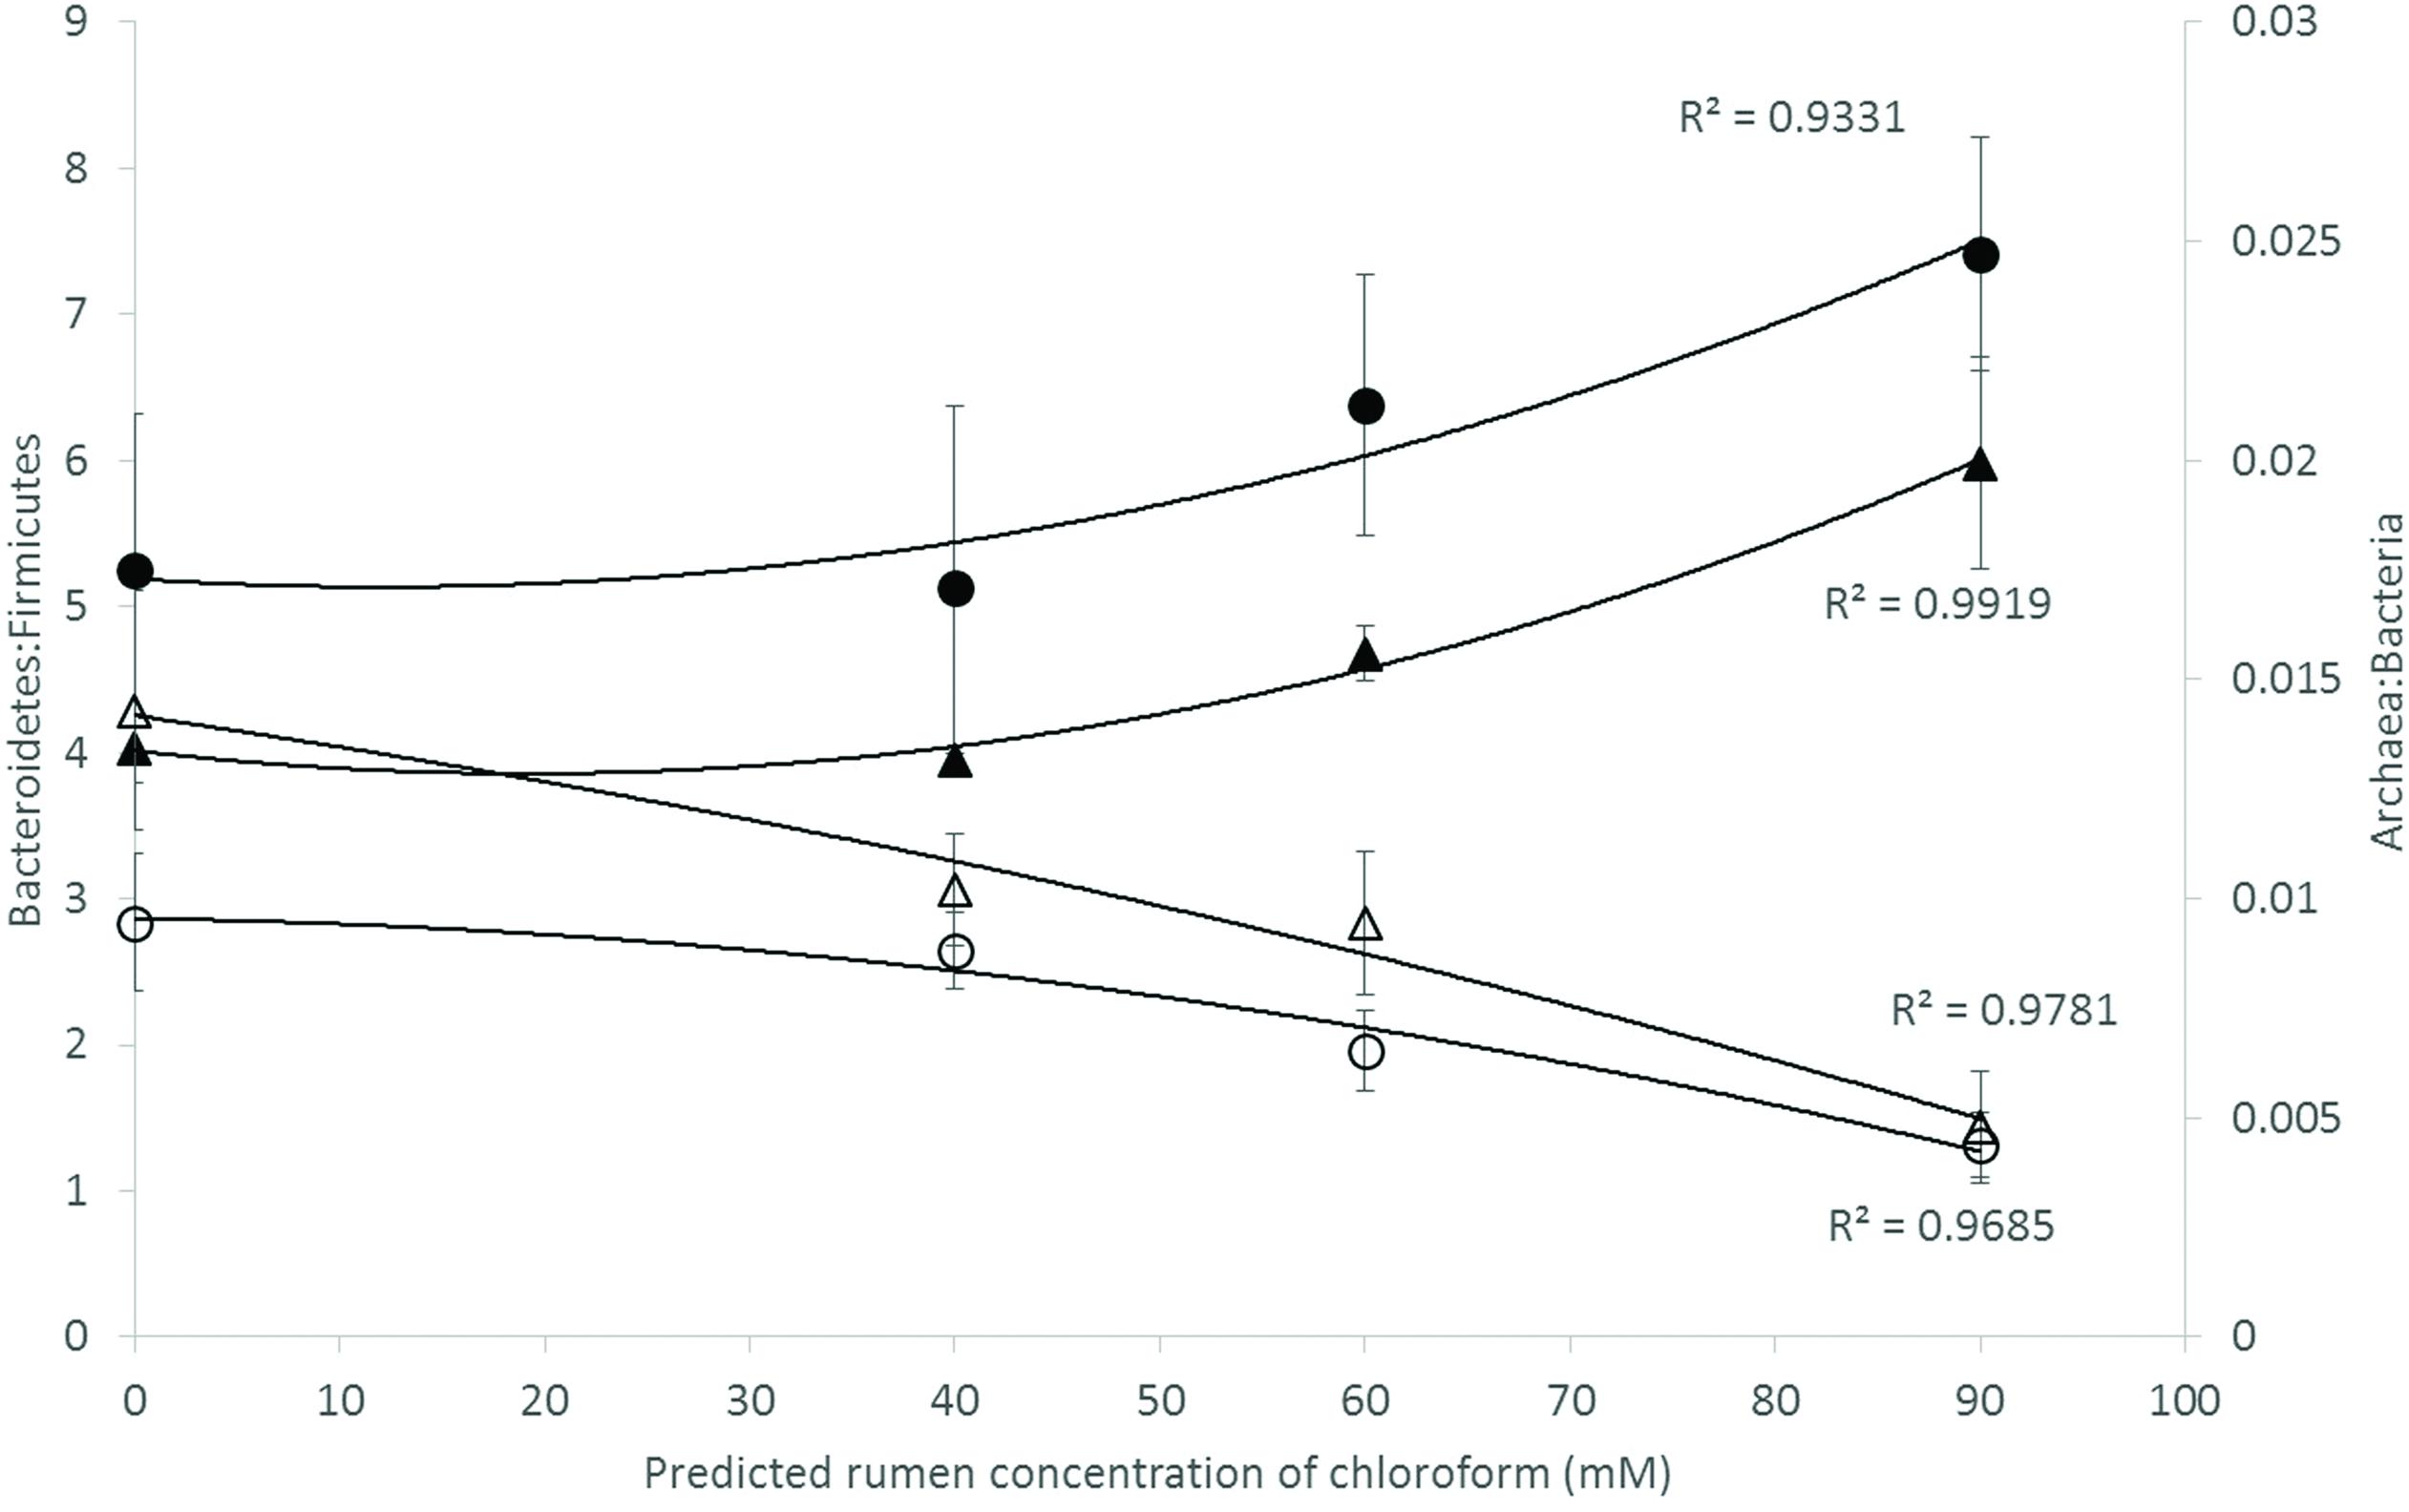
FIGURE 4. Microbial ratios [Bacteroidetes:Firmicutes (B:F) and Archaea:Bacteria (A:B)] for increasing concentration of chloroform on animals fed with hay [B:F (▲) or A:B (△)] or hay:concentrate [B:F (●) or A:B (◯)] diet 3 h after feeding. Predicted rumen concentration of chloroform: 40, 60, and 90 μM for low, mid, and high dose, respectively.
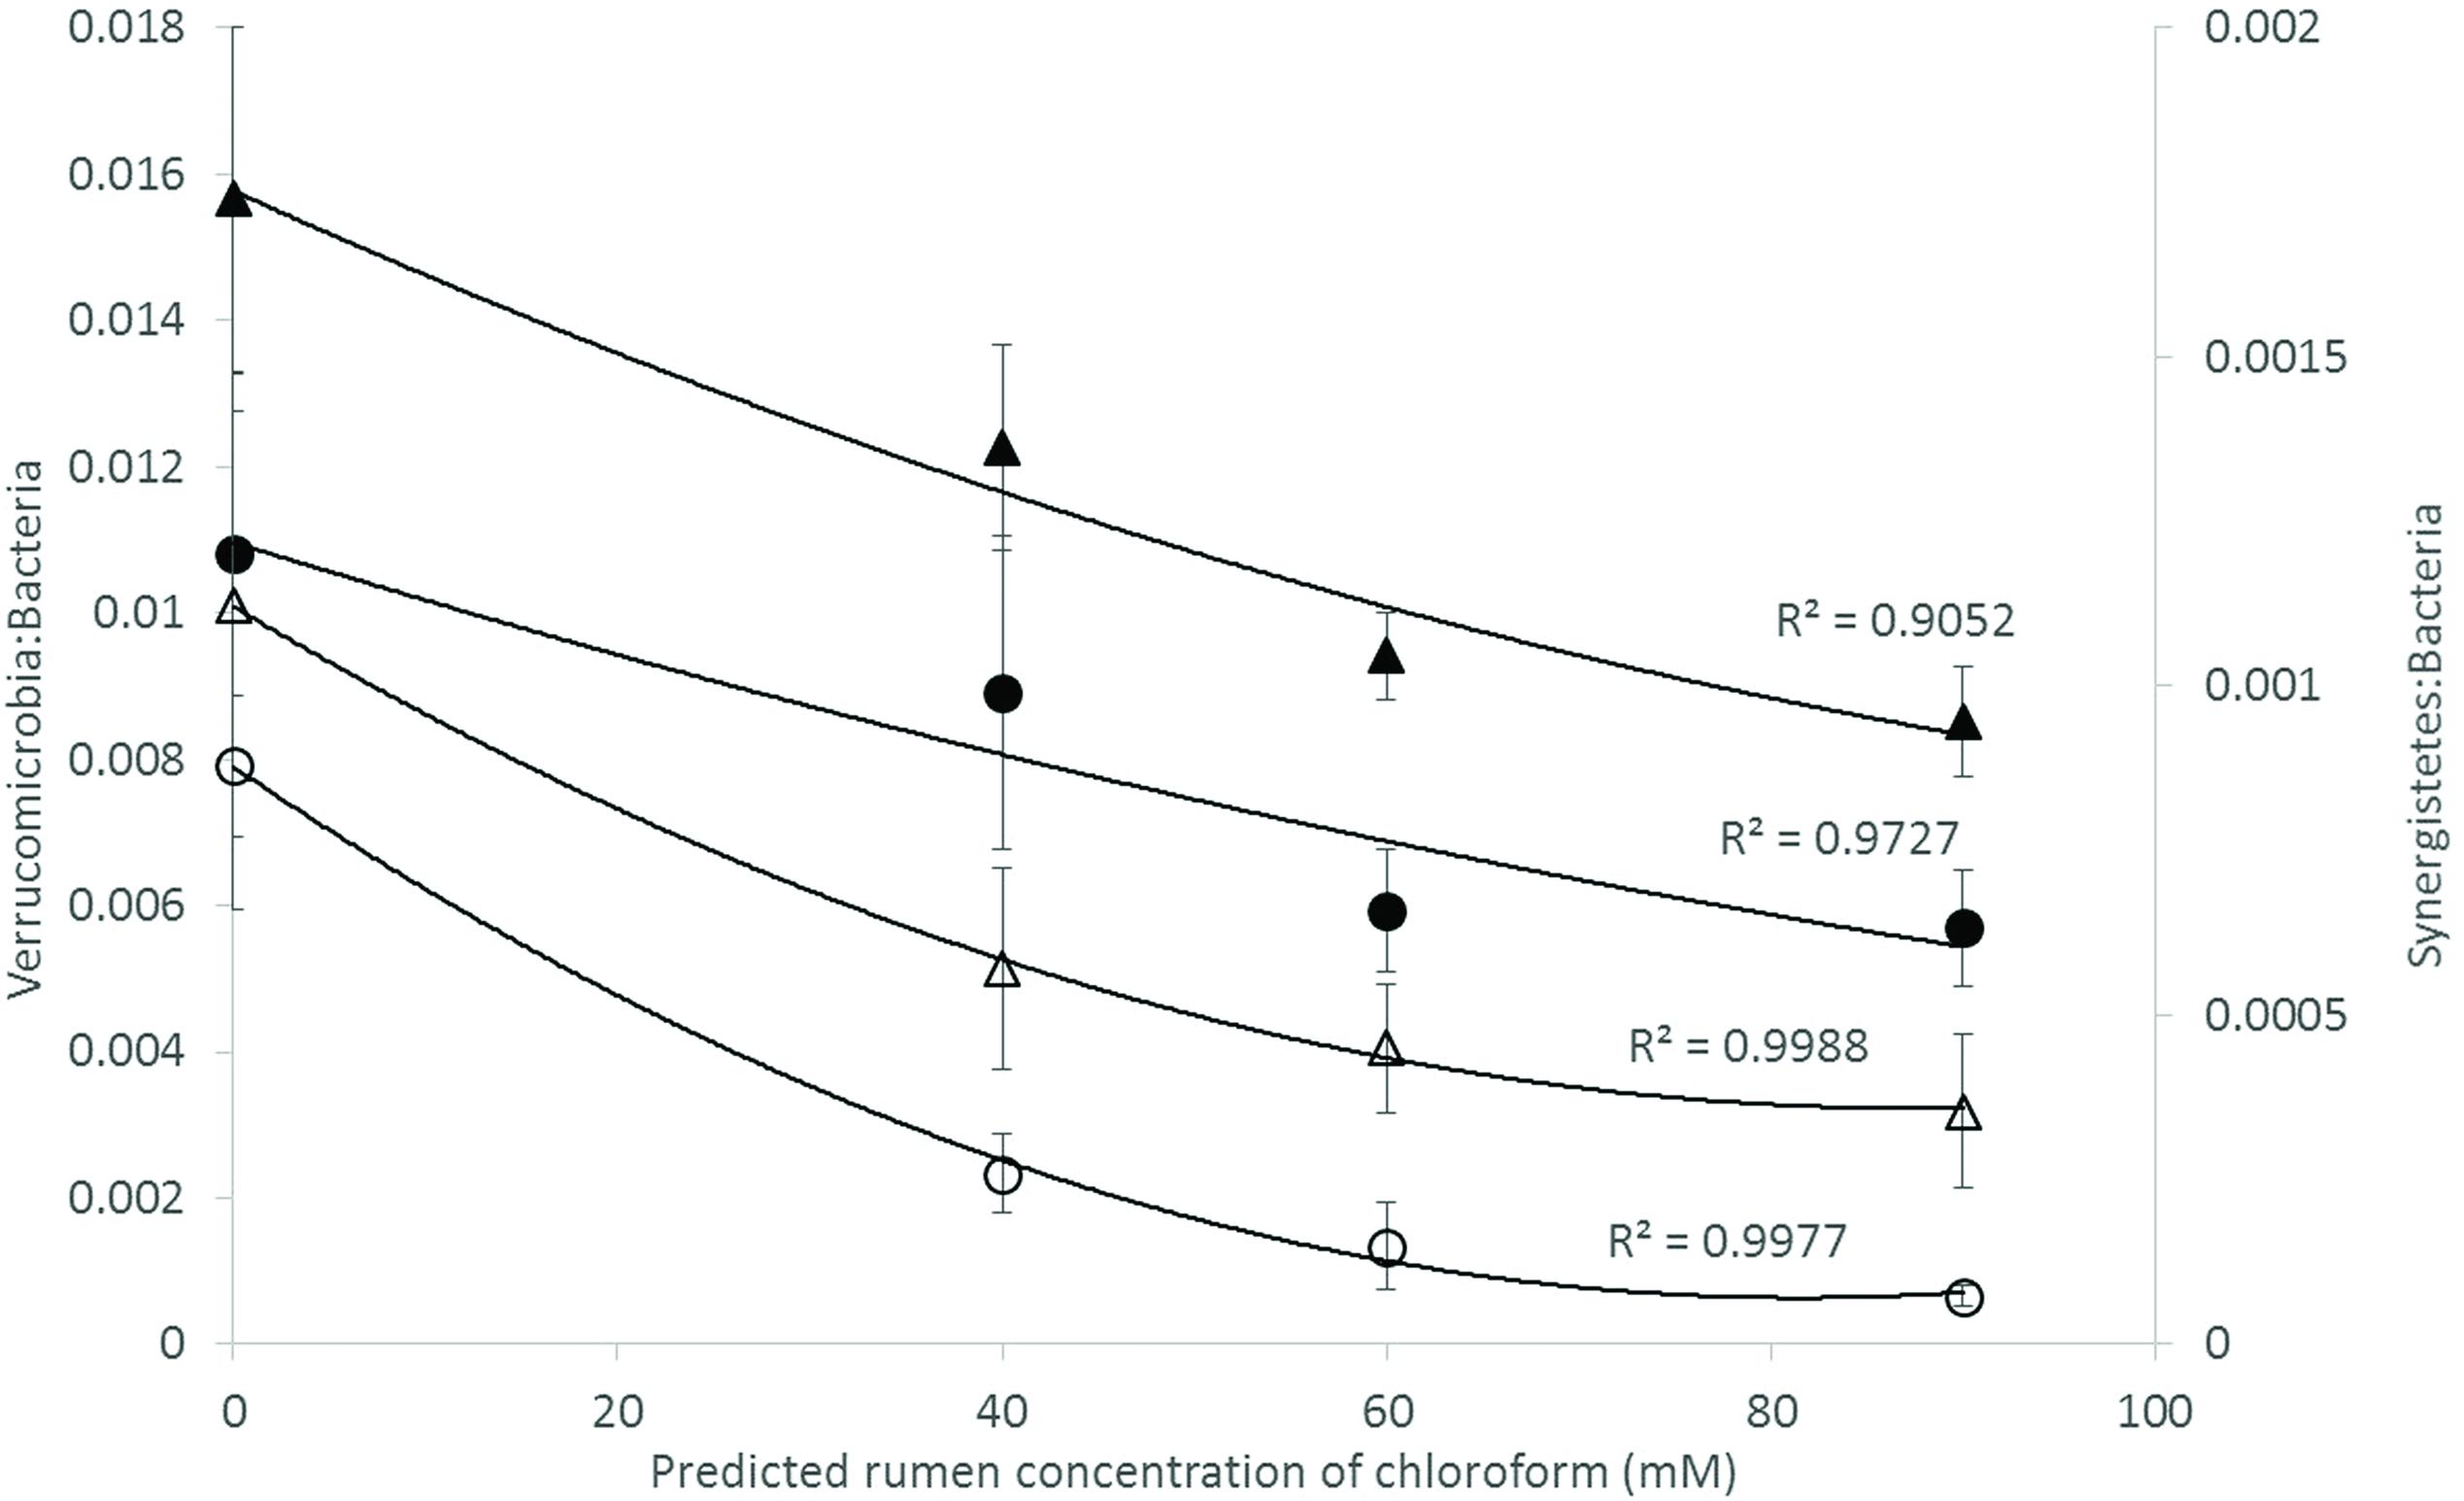
FIGURE 5. Microbial ratios [Synergistetes:Bacteria (S:B) and Verrucomicrobia:Bacteria (V:B)] for increasing concentration of chloroform on animals fed with hay [V:B (▲) or S:B (△)] or hay:concentrate [V:B (●) or S:B (◯)] diet 3 h after feeding. Predicted rumen concentration of chloroform: 40, 60, and 90 μM for low, mid, and high dose, respectively.
Specific OTUs that were significantly increased with CCD treatment were classified in the Prevotella genus, for both diets. Specifically for the animals fed with the hay:concentrate diet, a few OTUs that increased in abundance with CCD were assigned to Moraxellaceae and Succinivibrionaceae family in the Proteobacteria phylum, and the fiber degrading microorganisms Fibrobacter succinogenes and Ruminococcus spp. Regarding the roughage hay fed animals, minor OTUs promoted by the CCD doses were within the Paraprevotellaceae family and Butyrivibrio genus for all the doses and at the highest dose, respectively (Supplementary Figures S4–S9).
The increasing level of CCD was negatively associated in both diets with the abundance of OTUs assigned to Prevotella genus compared with the control, which could suggest a shift within the Prevotella groups through both diets (Supplementary Figures S4–S9). In relation to the fibrolytic microorganisms minor OTUs assigned to Fibrobacter genus were decreased in both diets with the lowest dose but did not change or were promoted with the increasing doses of CCD, which could suggest a shift in those populations. OTUs assigned to the fibrolytic species R. albus did not change with the doses, although a single OTU classified as R. flavefaciens was suppressed at the highest dose of CCD with the hay diet.
The Archaea domain was negatively affected by CCD levels in both diets in accordance with the decrease observed in the Archaea:Bacteria (A:B) ratio. Specific OTUs assigned to the Methanobacteriaceae family and Methanoplasmatales order were decreased by the CCD levels (Supplementary Figures S4–S9).
Discussion
This study established a model in cattle whereby methanogens were directly inhibited in a dose dependent manner and the subsequent responses in rumen microbial metabolism were evaluated. The three levels of CCD, low, medium, and high, decreased CH4 production by approximately 14, 37, and 55%, respectively, on average of both diets compared to the control period with no apparent effect on feed intakes. Conversely H2 expelled by treated animals showed a dose-dependent increase as CH4 decreased. A similar inverse relationship between CH4 decrease and H2 loss has been reported in dairy cows treated with nitrate or 3-nitrooxypropanol, and goats fed the CH4 inhibitor BCM (Mitsumori et al., 2012; Hristov et al., 2015; Veneman et al., 2015). However, importantly this study showed that greater amounts of H2 (1.7- to 2.9-fold; g/kg DMI) were expelled in animals supplemented with the hay:concentrate diet compared to the hay only diet. Furthermore the amount of H2 expelled in the CH4 inhibited animals was lower than the predicted amount of H2 involved in hydrogenotrophic CH4 formation (four moles of H2/mole CH4). This suggests that significant amounts of [H] were redirected into reduced end products other than CH4 and H2, and perhaps microbial protein in agreement with the meta-analysis of Ungerfeld (2015). Interestingly the rumen microbiota in the hay-fed animals appeared to utilize more H2 that was available from the decrease in CH4 formation than their hay:concentrate-fed counterparts, possibly due to the slower fermentation rate of the hay diet compare with the highly fermentable hay:concentrate diet which might produce a more consistent release of hydrogen. Two in vitro studies (Lin et al., 2013; O’Brien et al., 2013) observed a greater accumulation of H2 when inhibiting methanogenesis in mixed roughage concentrate fermentations compared with the roughage substrates. Furthermore, a recently published article by Vyas et al. (2016) also shows increased expulsion of H2 for methanogenesis-inhibited animals fed a high concentrate diet compared with a mixed forage:concentrate diet.
In relation to the redirection of [H], on both diets there was a shift in fermentation from acetate to fatty acids that were longer in length, particularly propionate that is a major gluconeogenic precursor in ruminants (Newbold et al., 2005). This pattern of fermentation along with an increase in branched chain fatty acids, has been reported previously in studies using the halogenated methane analog, BCM, as the methane inhibitor (Denman et al., 2007; Abecia et al., 2012; Mitsumori et al., 2012). In fact, the total non-carboxyl SCFA carbons increased at the low and mid dose with the hay diet, which might indicate that [H] is more effectively redirected into SCFA for that diet. The rumen microbiome analysis showed specific OTUs assigned to the Prevotella genus were promoted when methanogenesis was inhibited. Some of these Prevotella OTUs promoted by chloroform with the hay:concentrate diet (results not shown), were closely associated with the Prevotella group 7 which was increased in goats inhibited with BCM (Mitsumori et al., 2012). Prevotella species appear to increase propionate production via the randomizing pathway when methanogenesis is inhibited (Denman et al., 2015). The Prevotella OTUs, promoted in the CCD treated animals, may occupy the niche vacated by those Prevotella OTUs that declined as a result of increasing CCD concentration. OTUs assigned to the Butyrivibrio genus were positively affected by CCD in roughage fed animals, which might be a contributor to the increased butyrate in these animals.
Another potential [H] sink in absence of methanogenesis is acetate produced from reductive acetogenesis (Fonty et al., 2007). In the present study, the acetic acid concentration decreased with CCD treatments, which possibly indicates that reductive acetogenic bacteria have not contributed significantly to the redirection of [H]. However, it has been observed that chloroform might inhibit acetogens (Knight et al., 2011). The notion that acetogens would be promoted through an increase in availability of [H] in the methanogenesis-inhibited rumen remains unresolved and may be confounded by using chemical inhibitors that target methanogenesis but may inhibit reductive acetogenesis.
A particularly interesting observation was the gradual increase in formate concentration as methane formation declined and hydrogen accumulated. This has been observed previously when CH4 analogs such as chloroform inhibited methanogenesis (Thiele and Zeikus, 1988). A meta-analysis of studies involving methane inhibition also identified that increased formate was a characteristic response to methane inhibition (Ungerfeld, 2015). Leng (2014) suggested that formate accumulates when methanogenesis is inhibited, and this helps to maintain a steady partial pressure of H2 in the rumen fluid. Formate is produced by ruminal bacteria and fungi and it is mainly consumed by specific methanogens as a precursor for CH4 formation (Hungate et al., 1970; Bauchop and Mountfort, 1981; Asanuma et al., 1998). Leng (2014) cited studies showing that some methanogens can produce formate when inhibited with halogenated hydrocarbons (Thiele and Zeikus, 1988; Bleicher and Winter, 1994). It is possible therefore that the increase of formate concentration might be due to a balance between an increase in production and a decrease in utilization, when methanogenesis is inhibited. Furthermore, formate has a greater coefficient of diffusion compared to H2 (Boone et al., 1989). Thus, we hypothesize that more reducing equivalents might be released through pyruvate formate liases compared to pyruvate oxidoreductases when H2 accumulates. Formate might help in the control of H2 partial pressures in the rumen, playing a role as hydrogen sink and being an indicator of H2 partial pressure. This is in accord with the present study where methanogenesis-inhibited animals fed with the hay:concentrate diet had higher concentrations of formate and H2 release than those only fed with the roughage hay.
A shift in SCFA pattern and increase in formate were not the only significant changes, other metabolites such as amino acids and nucleic acids increased in rumen fluid as H2 concentration rose. There were increases in amino acids and nucleic acids, which could be indicative of an increase in proteolysis and microbial growth. In our study, metabolites (such as hypoxanthine, inosine, or nicotinic acid) which are degradation products of microbial cells and diet, increased with CCD treatment. Nucleic acids can breakdown into inosine, xanthine, hypoxanthine, and uracil, and nicotinic acid can increase microbial protein synthesis (McAllan and Smith, 1973; Riddell et al., 1980). The amino acid profile showed an increase in valine, leucine, and isoleucine that could be due to greater digestion of protein in the rumen. Another important amino acid which increased when methanogenesis was inhibited, was aspartate. This amino acid is the transamination product of oxaloacetic acid which is produced in the succinate–propionate (randomizing) pathway that is considered as a major route for propionate synthesis in the rumen (Baldwin et al., 1963; Joyner and Baldwin, 1966). An abundance of genes assigned to this pathway were found to be increased and predominately associated with Prevotella species in goats administered with the anti-methanogenic BCM (Denman et al., 2015). Other intermediates of the randomizing pathway, such as malate and fumarate, increased when methanogenesis was inhibited particularly with the roughage diet, supporting the redirection found toward propionate. The increase in amino acids in the rumen may be due to proteolytic activity associated with the relative increase in Bacteroidetes and Prevotella-related bacteria. Ungerfeld (2015) suggested that inhibition of methanogens, could stimulate amino acids and fatty acids synthesis and therefore the increase in microbial biomass would also be a [H] sink under these conditions. Also, some studies (Russell and Jeraci, 1984; Russell and Martin, 1984; Hino and Russell, 1985) have shown that methanogenesis suppression resulted in inhibition of deamination of amino acids. This might be due to the antimethanogenic compound used (ionophores and hydrogenase inhibitors) and the extent of methane decreased (almost total suppression). On the other hand, later in vitro and in vivo studies using halogenated compounds (BCM) or a more specific antimethanogenic compound (3-NOP) showed consistently an increase on branched-chain fatty acids when methane was decreased (between 30 and 50%), which might suggest that deamination of amino acids was not negatively affected (Denman et al., 2007; Mitsumori et al., 2012; Martinez-Fernandez et al., 2014, 2015; Romero-Perez et al., 2014; Haisan et al., 2016). These observations are further supported by the metabolomic data in the present study, which showed an increase in more reduced metabolites and likely greater fermentation of amino acids as shown by increasing concentration of isoacids with increasing CCD dose, particularly in the hay fed animals.
The Bacteroidetes:Firmicutes (B:F) ratio (~75:17) observed in the untreated animals for both diets was substantially higher than has been reported in many other ruminant studies where temperate diets are common. Our study involving tropical adapted cattle fed a basal diet of tropical hay is in agreement with the high ratio reported by McCann et al. (2014) in Brahman cattle fed Coastal Bermuda-grass. In this study, a further increase in this ratio was observed in both diets when methane was decreased and is consistent with the redirection of hydrogen in the rumen. The Bacteroidetes are considered net H2 utilizers whereas the Firmicutes phylum contains a higher number of known H2 producers (Stewart et al., 1997). The same B:F shift was observed when methane was decreased in vivo and in vitro when methanogenesis was inhibited with BCM (Denman et al., 2015; Martinez-Fernandez et al., 2015). Cattle fed hay:concentrate, had a significant population of Proteobacteria (~3%) compared with the hay only diet and within this phylum, the predominant family Succinivibrionaceae which are involved in propionate production, increased with the three levels of CCD. A higher abundance of this family in low-emission beef cattle compared with high emitters has also been observed (Wallace et al., 2015).
Bacteria affiliated with the Synergistetes and Verrucomicrobia phyla were negatively correlated with the increasing levels of CCD and increases in H2, for both diets. A similar negative relationship for these groups of bacteria and increased of H2 expelled has been previously reported in ruminants treated with BCM (Denman et al., 2015). In high and low methane emitting animals, Synergistetes were significantly more abundant in high emitters and there was a tendency for Verrucomicrobia to also be higher in these animals as well (Wallace et al., 2015). Collectively these data may indicate that Synergistetes and Verrucomicrobia bacteria are sensitive indicators of H2 partial pressures in the rumen fluid. Recently, Leong et al. (2016) demonstrated that interspecies H2 transfer between Synergistetes and methanogens enhanced the growth of the bacterium which may explain why these bacteria declined in abundance when methanogens were inhibited in the current study.
In relation to the rumen archaeal community, the A:B ratio decreased with increasing levels of CCD, which represented a fivefold to sevenfold decrease in the methanogen population and a 30–50% decrease in methane production. Furthermore the rumen microbiome analysis revealed that OTUs assigned to Methanobacteriaceae family and Methanoplasmatales order decreased with the increasing doses of CCD. Our results are in agreement with previous studies which observed a similar decrease using halogenated compounds to inhibit enteric methanogenesis in cattle (Denman et al., 2007). Mitsumori et al. (2012) observed that only a half-log reduction in the methanogen population was correlated with 50% decrease in methane when BCM was used. Previous studies (Wallace et al., 2015; Roehe et al., 2016) have also reported a higher proportion of A:B ratio from high methane emitting animals compared with low emitters. The decreasing A:B ratio observed when methanogenesis was inhibited may provide a simple index for relative methane production in ruminants.
It is assumed that H2 accumulation in the rumen impairs fiber digestion and therefore would reduce productivity (Wolin et al., 1997; Janssen, 2010). However, a previous study showed that inhibition of methanogenesis by BCM in small ruminants dramatically increased H2 without affecting DMI and feed digestibility (Mitsumori et al., 2012). In the present study, dry matter intakes were not affected and OTUs assigned to the fibrolytic species R. albus and R. flavefaciens did not change through the CCD low and mid doses compared with control period. Importantly, OTUs classified as F. succinogenes were positively associated with CCD in the hay:concentrate diet and were only negatively associated with the lowest dose in both diets. It is known that F. succinogenes might not be affected by H2 accumulation (Wolin et al., 1997). In fact, F. succinogenes populations increased in the presence of H2 that accumulated when BCM was used to inhibit methanogenesis but surprisingly R. albus abundance was unaffected even though it produces large amounts of H2 in the presence of methanogens (Mitsumori et al., 2012). Our results suggest that the bacterial fibrolytic community was not affected by the increasing level of H2, although the relative abundance of some particular OTUs changed. Further analyses to study how those changes affect the fiber degradability in the rumen should be carried out in future experiments.
Protozoa and fungi also play a key role in fiber degradation and rumen metabolism, and can be affected by the H2 accumulation in the rumen. No significant changes were observed in the abundance of those populations that suggests, in accordance with the microbial, metabolite and fermentation profiles, a non-detrimental effect on fiber digestion, and microbial and dietary proteolysis. However, further analyses using in-depth sequencing technology could be developed in future experiments to understand these important rumen community members.
Conclusion
The present study in cattle showed that a decrease in methane formation by 30–35% resulted in a redirection of [H] into more reduced microbial end-products and eructation of excess H2 without an apparent adverse effect on DM intake, fibrolytic activity and general rumen function. The amount of expelled H2 per mol of decreased methane was lower for the hay diet suggesting a more efficient redirection of [H] perhaps due to the slower fermentation rate and evolution of H2 compared with the hay:concentrate supplemented animals. The metabolomics analysis showed increases in amino acids and nucleic acids concentration that may indicate an enhanced of the proteolysis and microbial protein synthesis in the rumen, particularly in the methanogenesis-inhibited cattle fed hay. These changes in metabolism were accompanied by a shift in the microbiota toward more Bacteroidetes and a decrease in Archaea and Synergistetes for both diets. Synergistetes among other bacteria groups, may be sensitive indicators of H2 partial pressures in the rumen. Although there was a redirection of [H], dietary supplements or microbial treatments might be needed to drive the excess H2 into energy-yielding substrates and consequently improve the energy supply to the animal.
Author Contributions
CM, GM-F, and SD conceived and designed the experiments and analytical approaches; GM-F performed the animal trial; GM-F, JC, and CY analyzed biological samples. SD, MM, and GM-F analyzed the data. GM-F, CM, MM, and SD wrote the manuscript. All authors agree to be accountable for all aspects of the work.
Conflict of Interest Statement
The authors declare that the research was conducted in the absence of any commercial or financial relationships that could be construed as a potential conflict of interest.
Acknowledgments
This research was funded by a grant from Meat and Livestock Australia and Department of Agriculture, Fisheries and Forestry, Australian Government. We gratefully acknowledge S. Austin for his assistance with the animals.
Supplementary Material
The Supplementary Material for this article can be found online at: http://journal.frontiersin.org/article/10.3389/fmicb.2016.01122
References
Abecia, L., Toral, P., Martín-García, A., Martínez, G., Tomkins, N., Molina-Alcaide, E., et al. (2012). Effect of bromochloromethane on methane emission, rumen fermentation pattern, milk yield, and fatty acid profile in lactating dairy goats. J. Dairy Sci. 95, 2027–2036. doi: 10.3168/jds.2011-4831
Asanuma, N., Iwamoto, M., and Hino, T. (1998). Formate metabolism by ruminal microorganisms in relation to methanogenesis. Anim. Sci. Technol. 69, 576–584.
Association of Official Analytical Chemists [AOAC] (2005). Official Methods of Analysis, 18th Edn. Gaithersburg, MD: AOAC.
Baldwin, R., Wood, W., and Emery, R. (1963). Conversion of glucose-C14 to propionate by the rumen microbiota. J. Bacteriol. 85, 1346–1349.
Bauchop, T., and Mountfort, D. O. (1981). Cellulose fermentation by a rumen anaerobic fungus in both the absence and the presence of rumen methanogens. Appl. Environ. Microbiol. 42, 1103–1110.
Bleicher, K., and Winter, J. (1994). Formate production and utilisation by methanogens and by sludge consortia: interference with the concept of interspecies formate transfer. Appl. Microbiol. Biot. 40, 910–915. doi: 10.1007/BF00173998
Boone, D. R., Johnson, R. L., and Liu, Y. (1989). Diffusion of the interspecies electron carriers H2 and formate in methanogenic ecosystems and its implications in the measurement of Km for H2 or formate uptake. Appl. Environ. Microbiol. 55, 1735–1741.
Boughton, B. A., Callahan, D. L., Silva, C., Bowne, J., Nahid, A., Rupasinghe, T., et al. (2011). Comprehensive profiling and quantitation of amine group containing metabolites. Anal. Chem. 83, 7523–7530. doi: 10.1021/ac201610x
Brookman, J. L., and Nicholson, M. J. (2005). “Anaerobic fungal populations,” in Methods in Gut Microbial Ecology for Ruminants, eds H. P. S. Makkar and C. S. McSweeney (Netherlands: Springer), 139–150.
Caporaso, J. G., Kuczynski, J., Stombaugh, J., Bittinger, K., Bushman, F. D., Costello, E. K., et al. (2010). QIIME allows analysis of high-throughput community sequencing data. Nat. Methods 7, 335–336. doi: 10.1038/nmeth.f.303
Chaney, A. L., and Marbach, E. P. (1962). Modified reagents for determination of urea and ammonia. Clin. Chem. 8, 130–132.
Chessel, D., Dufour, A. B., and Thioulouse, J. (2004). The ade4 package. I. One-table methods. R. News 4, 5–10.
Denman, S. E., Martinez Fernandez, G., Shinkai, T., Mitsumori, M., and McSweeney, C. S. (2015). Metagenomic analysis of the rumen microbial community following inhibition of methane formation by a halogenated methane analog. Front. Microbiol. 6:1087. doi: 10.3389/fmicb.2015.01087
Denman, S. E., and McSweeney, C. S. (2006). Development of a real-time PCR assay for monitoring anaerobic fungal and cellulolytic bacterial populations within the rumen. FEMS Microbiol. Ecol. 58, 572–582. doi: 10.1111/j.1574-6941.2006.00190.x
Denman, S. E., Tomkins, N. W., and McSweeney, C. S. (2007). Quantitation and diversity analysis of ruminal methanogenic populations in response to the antimethanogenic compound bromochloromethane. FEMS Microbiol. Ecol. 62, 313–322. doi: 10.1111/j.1574-6941.2007.00394.x
Dias, D. A., Hill, C. B., Jayasinghe, N. S., Atieno, J., Sutton, T., and Roessner, U. (2015). Quantitative profiling of polar primary metabolites of two chickpea cultivars with contrasting responses to salinity. J. Chromatogr. B 1000, 1–13. doi: 10.1016/j.jchromb.2015.07.002
Dong, Y., Bae, H. D., Mcallister, T. A., Mathison, G. W., and Cheng, K.-J. (1999). Effects of exogenous fibrolytic enzymes, α-bromoethanesulfonate and monensin on fermentation in a rumen simulation (RUSITEC) system. Can. J. Anim. Sci. 79, 491–498. doi: 10.4141/A99-024
Edgar, R. C. (2010). Search and clustering orders of magnitude faster than BLAST. Bioinformatics 26, 2460–2461. doi: 10.1093/bioinformatics/btq461
Fonty, G., Joblin, K., Chavarot, M., Roux, R., Naylor, G., and Michallon, F. (2007). Establishment and development of ruminal hydrogenotrophs in methanogen-free lambs. Appl. Environ. Microbiol. 73, 6391–6403. doi: 10.1128/AEM.00181-07
Gagen, E. J., Wang, J. K., Padmanabha, J., Liu, J., De Carvalho, I. P. C., Liu, J. X., et al. (2014). Investigation of a new acetogen isolated from an enrichment of the tammar wallaby forestomach. BMC Microbiol. 14:314. doi: 10.1186/s12866-014-0314-3
Goel, G., Makkar, H. P. S., and Becker, K. (2009). Inhibition of methanogens by bromochloromethane: effects on microbial communities and rumen fermentation using batch and continuous fermentations. Br. J. Nutr. 101, 1484–1492. doi: 10.1017/S0007114508076198
Graham, D. E., and White, R. H. (2002). Elucidation of methanogenic coenzyme biosyntheses: from spectroscopy to genomics. Nat. Prod. Rep. 19, 133–147. doi: 10.1039/b103714p
Gunsalus, R. P., and Wolfe, R. S. (1978). ATP activation and properties of the methyl coenzyme M reductase system in Methanobacterium thermoautotrophicum. J. Bacteriol. 135, 851–857.
Haisan, J., Sun, Y., Guan, L., Beauchemin, K., Iwaasa, A., Duval, S., et al. (2016). The effects of feeding 3-nitrooxypropanol at two doses on milk production, rumen fermentation, plasma metabolites, nutrient digestibility, and methane emissions in lactating Holstein cows. Anim. Prod. Sci. (in press). doi: 10.1071/AN15219
Hino, T., and Russell, J. B. (1985). Effect of reducing-equivalent disposal and NADH/NAD on deamination of amino acids by intact rumen microorganisms and their cell extracts. Appl. Environ. Microbiol. 50, 1368–1374.
Hristov, A., Oh, J., Firkins, J., Dijkstra, J., Kebreab, E., Waghorn, G., et al. (2013). Special Topics—mitigation of methane and nitrous oxide emissions from animal operations: I. A review of enteric methane mitigation options. J. Anim. Sci. 91, 5045–5069. doi: 10.2527/jas.2013-6583
Hristov, A. N., Oh, J., Giallongo, F., Frederick, T. W., Harper, M. T., Weeks, H. L., et al. (2015). An inhibitor persistently decreased enteric methane emission from dairy cows with no negative effect on milk production. Proc. Natl. Acad. Sci. U.S.A. 112, 10663–10668. doi: 10.1073/pnas.1504124112
Hungate, R., Smith, W., Bauchop, T., Yu, I., and Rabinowitz, J. (1970). Formate as an intermediate in the bovine rumen fermentation. J. Bacteriol. 102, 389–397.
Hwang, H. S., Ok, J. U., Lee, S. J., Chu, G. M., Oh, Y. K., Lee, S. S., et al. (2012). Effects of halogenated compounds on in vitro fermentation characteristics in the rumen and methane emissions. J. Life Sci. 22, 1187–1193. doi: 10.5352/JLS.2012.22.9.1187
Janssen, P. H. (2010). Influence of hydrogen on rumen methane formation and fermentation balances through microbial growth kinetics and fermentation thermodynamics. Anim. Feed Sci. Technol. 160, 1–22. doi: 10.1016/j.anifeedsci.2010.07.002
Joblin, K. N. (1999). Ruminal acetogens and their potential to lower ruminant methane emissions. Austr. J. Agr. Res. 50, 1307–1313. doi: 10.1071/AR99004
Johnson, K. A., and Johnson, D. E. (1995). Methane emissions from cattle. J. Anim. Sci. 73, 2483–2492.
Joyner, A., and Baldwin, R. (1966). Enzymatic studies of pure cultures of rumen microorganisms. J. Bacteriol. 92, 1321–1330.
Knight, T., Ronimus, R. S., Dey, D., Tootill, C., Naylor, G., Evans, P., et al. (2011). Chloroform decreases rumen methanogenesis and methanogen populations without altering rumen function in cattle. Anim. Feed Sci. Technol. 16, 101–112. doi: 10.1016/j.anifeedsci.2011.04.059
Kozich, J. J., Westcott, S. L., Baxter, N. T., Highlander, S. K., and Schloss, P. D. (2013). Development of a dual-index sequencing strategy and curation pipeline for analyzing amplicon sequence data on the MiSeq Illumina sequencing platform. Appl. Environ. Microbiol. 79, 5112–5120. doi: 10.1128/AEM.01043-13
Leng, R. A. (2014). Interactions between microbial consortia in biofilms: a paradigm shift in rumen microbial ecology and enteric methane mitigation. Anim. Prod. Sci. 54, 519–543. doi: 10.1071/AN13381
Leong, L. E., Denman, S. E., Hugenholtz, P., and McSweeney, C. S. (2016). Amino acid and peptide utilization profiles of the fluoroacetate-degrading bacterium Synergistetes Strain MFA1 under varying conditions. Microb. Ecol. 71, 494–504. doi: 10.1007/s00248-015-0641-4
Lin, M., Schaefer, D. M., Zhao, G. Q., and Meng, Q. X. (2013). Effects of nitrate adaptation by rumen inocula donors and substrate fiber proportion on in vitro nitrate disappearance, methanogenesis, and rumen fermentation acid. Animal 7, 1099–1105. doi: 10.1017/S1751731113000116
Livak, K. J., and Schmittgen T. D. (2001). Analysis of relative gene expression data using real-time quantitative PCR and the 2-ΔΔCT method. Methods 25, 402–408. doi: 10.1006/meth.2001.1262
Love, M. I., Huber, W., and Anders, S. (2014). Moderated estimation of fold change and dispersion for RNA-seq data with DESeq2. Genome Biol. 15:550. doi: 10.1186/s13059-014-0550-8
Martinez-Fernandez, G., Abecia, L., Arco, A., Cantalapiedra-Hijar, G., Martín-García, A. I., Molina-Alcaide, E., et al. (2014). Effects of ethyl-3-nitrooxy propionate and 3-nitrooxypropanol on ruminal fermentation, microbial abundance, and methane emissions in sheep. J. Dairy Sci. 97, 3790–3799. doi: 10.3168/jds.2013-7398
Martinez-Fernandez, G., Abecia, L., Martin-Garcia, A. I., Ramos-Morales, E., Denman, S. E., Newbold, C. J., et al. (2015). Response of the rumen archaeal and bacterial populations to anti-methanogenic organosulphur compounds in continuous-culture fermenters. FEMS Microbiol. Ecol. 91, fiv079. doi: 10.1093/femsec/fiv079
May, C., Payne, A. L., Stewart, P. L., and Edgar, J. A. (1995). A Delivery System for Agents. AU International Patent PCT/AU95/00733. Canberra, ACT, Australia: Australian Industrial Property Organisation.
McAllan, A. B., and Smith, R. H. (1973). Degradation of nucleic acids in the rumen. Br. J. Nutr. 29, 331–345. doi: 10.1079/BJN19730107
McAllister, T., and Newbold, C. J. (2008). Redirecting rumen fermentation to reduce methanogenesis. Aust. J. Exp.Agr. 48, 7–13. doi: 10.1071/EA07218
McCann, J. C., Wiley, L. M., Forbes, T. D., Rouquette, F. M., and Tedeschi, L. O. (2014). Relationship between the rumen microbiome and residual feed intake-efficiency of Brahman bulls stocked on bermudagrass pastures. PLoS ONE 9:e91864. doi: 10.1371/journal.pone.0091864
McDonald, D., Price, M. N., Goodrich, J., Nawrocki, E. P., Desantis, T. Z., Probst, A., et al. (2012). An improved greengenes taxonomy with explicit ranks for ecological and evolutionary analyses of bacteria and archaea. ISME J. 6, 610–618. doi: 10.1038/ismej.2011.139
McMurdie, P. J., and Holmes, S. (2013). phyloseq: an R package for reproducible interactive analysis and graphics of microbiome census data. PLoS ONE 8:e61217. doi: 10.1371/journal.pone.0061217
Mitsumori, M., Shinkai, T., Takenaka, A., Enishi, O., Higuchi, K., Kobayashi, Y., et al. (2012). Responses in digestion, rumen fermentation and microbial populations to inhibition of methane formation by a halogenated methane analogue. Br. J. Nutr. 108, 482–491. doi: 10.1017/S0007114511005794
Newbold, C. J., Lopez, S., Nelson, N., Ouda, J. O., Wallace, R. J., and Moss, A. R. (2005). Proprionate precursors and other metabolic intermediates as possible alternative electron acceptors to methanogenesis in ruminal fermentation in vitro. Br. J. Nutr. 94, 27–35. doi: 10.1079/BJN20051445
O’Brien, M., Navarro-Villa, A., Purcell, P. J., Boland, T. M., and O’Kiely, P. (2013). Reducing in vitro rumen methanogenesis for two contrasting diets using a series of inclusion rates of different additives. Anim. Prod. Sci. 54, 141–157. doi: 10.1071/AN12204
Riddell, D. O., Bartley, E. E., and Dayton, A. D. (1980). Effect of nicotinic acid on rumen fermentation in vitro and in vivo. J. Dairy Sci. 63, 1429–1436. doi: 10.3168/jds.S0022-0302(80)83100-6
Roehe, R., Dewhurst, R. J., Duthie, C.-A., Rooke, J. A., Mckain, N., Ross, D. W., et al. (2016). Bovine host genetic variation influences rumen microbial methane production with best selection criterion for low methane emitting and efficiently feed converting hosts based on metagenomic gene abundance. PLoS Genet. 12:e1005846. doi: 10.1371/journal.pgen.1005846
Romero-Perez, A., Okine, E. K., McGinn, S. M., Guan, L. L., Oba, M., Duval, S. M., et al. (2014). The potential of 3-nitrooxypropanol to lower enteric methane emissions from beef cattle1. J. Anim. Sci. 92, 4682–4693. doi: 10.2527/jas.2014-7573
Rooke, J. A., Wallace, R. J., Duthie, C. A., Mckain, N., De Souza, S. M., Hyslop, J. J., et al. (2014). Hydrogen and methane emissions from beef cattle and their rumen microbial community vary with diet, time after feeding and genotype. Br. J. Nutr. 112, 398–407. doi: 10.1017/S0007114514000932
Russell, J. B., and Jeraci, J. L. (1984). Effect of carbon monoxide on fermentation of fiber, starch, and amino acids by mixed rumen microorganisms in vitro. Appl. Environ. Microbiol. 48, 211–217.
Russell, J. B., and Martin, S. A. (1984). Effects of various methane inhibitors on the fementation of amino acids by mixed rumen microorganisms in vitro. J. Anim. Sci. 59, 1329–1338.
Stewart, C., Flint, H., and Bryant, M. (1997). “The rumen bacteria,” in The Rumen Microbial Ecosystem, eds P. N. Hobson and C. S. Stewart (London: Blackie), 10–72.
Sylvester, J. T., Karnati, S. K. R., Yu, Z., Morrison, M., and Firkins, J. L. (2004). Development of an assay to quantify rumen ciliate protozoal biomass in cows using real-time PCR. J. Nutr. 134, 3378–3384.
Takahashi, J., Chaudhry, A., Beneke, R., and Young, B. (1999). An open-circuit hood system for gaseous exchange measurements in small ruminants. Small Rumin. Res. 32, 31–36. doi: 10.1016/S0921-4488(98)00163-1
Thiele, J. H., and Zeikus, J. G. (1988). Control of interspecies electron flow during anaerobic digestion: significance of formate transfer versus hydrogen transfer during syntrophic methanogenesis in flocs. Appl. Environ. Microbiol. 54, 20–29.
Ungerfeld, E., and Kohn, R. (2006). “The role of thermodynamics in the control of ruminal fermentation,” in Ruminant Physiology: Digestion, Metabolism and Impact of Nutrition on Gene Expression, Immunology and Stress, eds K. Sejrsen, T. Hvelplund, and M. O. Nielsen (Wageningen: Wageningen Academic Publishers), 55–85.
Ungerfeld, E., Rust, S., Boone, D., and Liu, Y. (2004). Effects of several inhibitors on pure cultures of ruminal methanogens. J. Appl. Microbiol. 97, 520–526. doi: 10.1111/j.1365-2672.2004.02330.x
Ungerfeld, E. M. (2013). A theoretical comparison between two ruminal electron sinks. Front. Microbiol. 4:319. doi: 10.3389/fmicb.2013.00319
Ungerfeld, E. M. (2015). Shifts in metabolic hydrogen sinks in the methanogenesis-inhibited ruminal fermentation: a meta-analysis. Front. Microbiol. 6:37. doi: 10.3389/fmicb.2015.00037
Veneman, J. B., Muetzel, S., Hart, K. J., Faulkner, C. L., Moorby, J. M., Perdok, H. B., et al. (2015). Does dietary mitigation of enteric methane production affect rumen function and animal productivity in dairy cows? PloS ONE 10:e0140282. doi: 10.1371/journal.pone.0140282
Vyas, D., McGinn, S. M., Duval, S. M., Kindermann, M. K., and Beauchemin, K. A. (2016). Optimal dose of 3-nitrooxypropanol for decreasing enteric methane emissions from beef cattle fed high-forage and high-grain diets. Anim. Prod. Sci. (in press). doi: 10.1071/AN15705
Wallace, R. J., Rooke, J. A., Mckain, N., Duthie, C.-A., Hyslop, J. J., Ross, D. W., et al. (2015). The rumen microbial metagenome associated with high methane production in cattle. BMC Genomics 16:839. doi: 10.1186/s12864-015-2032-0
Williams, Y., Klein, L., and Wright, A.-D. (2007). “A protocol for the operation of open-circuit chambers for measuring methane output in sheep,” in Measuring Methane Production from Ruminants, eds H. P. Makkar and P. E. Vercoe (Dordrecht: Springer), 111–123.
Keywords: rumen, microbial community, metabolites, methane, hydrogen, 16S sequencing
Citation: Martinez-Fernandez G, Denman SE, Yang C, Cheung J, Mitsumori M and McSweeney CS (2016) Methane Inhibition Alters the Microbial Community, Hydrogen Flow, and Fermentation Response in the Rumen of Cattle. Front. Microbiol. 7:1122. doi: 10.3389/fmicb.2016.01122
Received: 26 April 2016; Accepted: 06 July 2016;
Published: 19 July 2016.
Edited by:
Emilio M. Ungerfeld, Instituto de Investigaciones Agropecuarias – Carillanca, ChileReviewed by:
Robin Anderson, United States Department of Agriculture/Agricultural Research Service, USAPaul James Weimer, United States Department of Agriculture, USA
Copyright © 2016 Martinez-Fernandez, Denman, Yang, Cheung, Mitsumori and McSweeney. This is an open-access article distributed under the terms of the Creative Commons Attribution License (CC BY). The use, distribution or reproduction in other forums is permitted, provided the original author(s) or licensor are credited and that the original publication in this journal is cited, in accordance with accepted academic practice. No use, distribution or reproduction is permitted which does not comply with these terms.
*Correspondence: Gonzalo Martinez-Fernandez, gonzalo.martinezfernandez@csiro.au