 Rui Liu
 Hangwei Hu
 Helen Suter1
 Helen L. Hayden
- 1Faculty of Veterinary and Agricultural Sciences, The University of Melbourne, Melbourne, VIC, Australia
- 2Department of Economic Development, Jobs, Transport and Resources, Melbourne, VIC, Australia
Most studies on soil N2O emissions have focused either on the quantifying of agricultural N2O fluxes or on the effect of environmental factors on N2O emissions. However, very limited information is available on how land-use will affect N2O production, and nitrifiers involved in N2O emissions in agricultural soil ecosystems. Therefore, this study aimed at evaluating the relative importance of nitrification and denitrification to N2O emissions from different land-use soils and identifying the potential underlying microbial mechanisms. A 15N-tracing experiment was conducted under controlled laboratory conditions on four agricultural soils collected from different land-use. We measured N2O fluxes, nitrate (), and ammonium () concentration and 15N2O, 15, and 15 enrichment during the incubation. Quantitative PCR was used to quantify ammonia-oxidizing archaea (AOA) and ammonia-oxidizing bacteria (AOB). Our results showed that nitrification was the main contributor to N2O production in soils from sugarcane, dairy pasture and cereal cropping systems, while denitrification played a major role in N2O production in the vegetable soil under the experimental conditions. Nitrification contributed to 96.7% of the N2O emissions in sugarcane soil followed by 71.3% in the cereal cropping soil and 70.9% in the dairy pasture soil, while only around 20.0% of N2O was produced from nitrification in vegetable soil. The proportion of nitrified nitrogen as N2O (PN2O-value) varied across different soils, with the highest PN2O-value (0.26‰) found in the cereal cropping soil, which was around 10 times higher than that in other three systems. AOA were the abundant ammonia oxidizers, and were significantly correlated to N2O emitted from nitrification in the sugarcane soil, while AOB were significantly correlated with N2O emitted from nitrification in the cereal cropping soil. Our findings suggested that soil type and land-use might have strongly affected the relative contribution of nitrification and denitrification to N2O production from agricultural soils.
Introduction
Ammonium-based fertilizers are extensively used in agricultural practices to meet the food demand for the increasing human population, which has resulted in an increase in atmospheric N2O concentrations (Galloway et al., 2008; Davidson, 2009). Globally, natural and anthropogenic N2O sources are primarily dominated by emissions from soil ecosystems, comprising approximately 65% of the total N2O emissions (IPCC, 2007). In Australia, agriculture is the second largest greenhouse gas (GHG) source, accounting for 16% of total GHG emissions, 19% of which could be attributed to N2O emitted from agricultural soils (Australian Greenhouse Office, 2001).
The emission of N2O is the result of multiple biological pathways, such as nitrification (autotrophic and heterotrophic), denitrification, dissimilatory nitrate reduction to ammonium (DNRA), nitrifer denitrification, and non-biological chemodenitrification (Wrage et al., 2001; Butterbach-Bahl et al., 2013; Hu et al., 2015a; Zhang et al., 2015), but is particularly dominated by nitrification and denitrification (Davidson et al., 1986; Stevens et al., 1997; Hu et al., 2015a). As multiple pathways involved in N2O production and N2O consumption occur simultaneously in different micro-environments in the same soil, a great challenge exists in allocating their relative contributions. Nitrification inhibitors and isotope signature techniques are commonly utilized to separate N2O-producing and -reducing pathways (Zhang et al., 2009). Stable isotope enrichment approaches have been developed to identify N2O sources following the application of 15N-labeled fertilizers in short-term experiments, through the measurement of 15N enrichment in N2O and mineral N pools (Baggs, 2008). Application of 15N labeled and enables the source of fertilizer-derived 15N-N2O to be determined. Generally, denitrification-derived N2O is quantified following the supply of 15, while nitrification derived N2O is measured following the supply of 15 (Baggs, 2008). The reduction of N2O to N2 can also be quantified by determining 15N in N2 after the supply of 15 (Stevens and Laughlin, 1998). For example, applications of 14NO3 and 15NO3 have been used to determine the relative contributions of nitrification and denitrification to N2O production (Baggs and Blum, 2004).
Agricultural practice, climatic conditions and soil properties all influence N2O emission from soil. These include soil moisture and temperature (Livesley et al., 2008), aeration, ammonium, and nitrate concentration (Jørgensen and Elberling, 2012), and pH (Mørkved et al., 2007). Soil water content is one of the predominant factors regulating N2O emission from soils. Increasing soil water content due to wetting-up events such as irrigation and rainfall can stimulate nitrification and denitrification (Hu et al., 2015b), and can promote N2O production (Hofstra and Bouwman, 2005). N2O emission has been found to be highly correlated with water filled pore space (WFPS), with the highest emission under 70% WFPS coming from both nitrification (35–53%) and denitrification (44–58%) pathways in an intensively managed calcareous Fluvo-aquic soil (Huang et al., 2014). The favorable conditions for N2O production from nitrification occur within the range of 30–70% WFPS (Hu et al., 2015a), whereas denitrification dominates N2O production in wet soils with >80–90% WFPS (Braker and Conrad, 2011; Huang et al., 2014).
To date, most studies on soil N2O emissions have focused either on the quantification of agricultural N2O fluxes (Reay et al., 2012) or on the effect of environmental factors on N2O fluxes (Cantarel et al., 2011). However, very limited information is available on how land-use will affect the relative contributions of nitrification and denitrification to N2O production, the nitrified N lost as N2O, and the underlying microbial mechanisms in agricultural soil ecosystems.
It has been widely accepted that two groups of ammonia oxidizers, ammonia-oxidizing archaea (AOA), and ammonia-oxidizing bacteria (AOB) are responsible for the first step of nitrification (oxidation of NH3 to ; Di et al., 2009, 2010; Gubry-Rangin et al., 2010), and the two groups are typically profiled using functional amoA gene encoding the alpha sub-unit of ammonia mono-oxygenase (AMO), the key enzyme for ammonia oxidation. The bacterial and archaeal amoA genes can be distinguished by their sequences. The conversion of to , is regulated by nitrite oxidoreductase which is encoded by the functional nxrB gene (Freitag et al., 1987). Until recently, AOB were believed to be the only microbes active in nitrification, however ammonia-oxidizing archaea activity in soils has been reported based on in situ expression of archaeal amoA genes (Treusch et al., 2005; Leininger et al., 2006; Offre et al., 2009). It has been revealed that AOA can also be present in large numbers in terrestrial environments (He et al., 2007; Shen et al., 2008). More recently, the complete oxidation of ammonia to nitrate in one organism (complete ammonia oxidation; comammox) has been reported by Daims et al. (2015) and van Kessel et al. (2015).
Land-use and land management appears a very important factor affecting microbial communities in soils. For instance, Morimoto et al. (2011) reported that land-use types affected the abundances of AOA and AOB and the nitrification activity. Research across different soils in Australia has also revealed that changes in soil variables due to different land-use can strongly influence the abundance of AOB amoA gene (Hayden et al., 2010). Increasing evidence has also reported that AOA and AOB can produce N2O (Santoro et al., 2011; Stieglmeier et al., 2014; Kozlowski et al., 2016), but their contributions to soil N2O emissions in agricultural ecosystems with different land-use and the relevant microbial pathways remain unclear. Therefore, it is necessary to improve the understanding of N2O formation and quantify the contribution of different pathways and verify whether land-use is a key factor to influence N2O emissions and AOA and AOB function in nitrification.
This study used 15N tracer technique to separate nitrification and denitrification to (i)determine the contribution of nitrification and denitrification to nitrous oxide production in laboratory microcosms using 15N isotope tracer method; and (ii) quantify the abundance of AOA and AOB in experimental microcosms. We hypothesized that: (i) the relative contribution of nitrification and denitrification changes with different agricultural soils and (ii) the relationship between AOA/AOB populations and N2O emission is affected by different agricultural soils.
Materials and Methods
Soil Collection and Physicochemical Measurement
Soil samples used in this study were collected from four different agricultural sites across Australia: sugarcane at Bundaberg, QLD (24°57′S, 152°20′E), vegetable at Boneo, VIC (38°24′S, 144°53′E), dairy pasture at Longworry, VIC (38°08′S, 145°43′E) and cereal cropping at Hamilton, VIC (38°19′S, 142°42′E). At each site, 10 replicate samples of the top soils (0–10 cm) were collected, thoroughly homogenized, and transported on ice to the laboratory. The fresh soils were air-dried, and remaining roots and leaf pieces were removed with tweezers. Air-dried soils were ground and sieved through a 2.0 mm mesh prior to establishment of the microcosm incubation. Soil moisture contents were determined by oven-drying three subsamples (10 g of air-dried soil) at 105°C for 48 h. Soil pH (1:5 soil/water), texture (sieve and hydrometer procedures), total carbon (Dumas method) and other soil properties are demonstrated in Table 1.
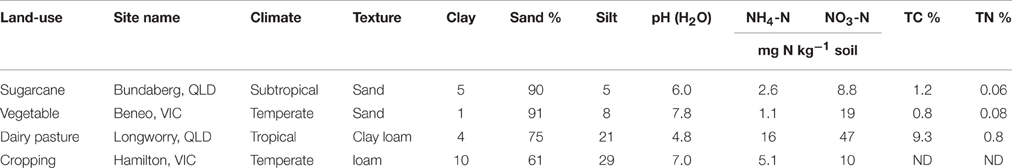
Table 1. Field site description and basic characteristics of soils used in this study.
Soil Microcosm Incubation
Soil microcosms were established in 500 ml vials containing 60 g of soils (oven-dry equivalent). Soil microcosms were pre-incubated at 25°C for 3 weeks to stabilize the soil indigenous microbial communities and to minimize effects associated with wetting events. Soil moisture contents during pre-incubation were adjusted to below 50% of the WFPS during the incubation (Linn and Doran, 1984). After pre-incubation, 2 ml of distilled water with or without fertilizers was applied to each vial to reach the targeted 50% WFPS and fertilizer levels. Two sets of treatments were established in four replicates with addition of 100 mg -N and 50 mg -N kg−1 soil: (1) 15NH4Cl (at 10 atom% 15N excess) + KNO3; and (2) NH4Cl + K15NO3 (at 10 atom% 15N excess). Aerobic conditions and soil moisture contents in the vials were maintained every 3 days by opening microcosms for aeration and water replenishment. Soil microcosms were incubated at 25°C in the dark for 3 weeks.
Gas Sampling and Analysis
Gas samples (20 ml) for N2O and CO2 analysis were taken from the headspace of 500 ml vials on days 0, 4, 7, 12, and 15 after fertilizer application. Gas samples (60 ml) for the analysis of fertilizer-derived 15N2O were taken at 72 h sampling time after vials closure on days 0, 7, and 15. The four replicate gas samples (20 ml) were collected from the 500 ml vials using gas tight syringes at 0, 8, 24, 48, and 72 h for each sampling day. A preliminary test was done before this work commencement, and found out the most suitable five gas collection time points at each collection day to calculate N2O production rate. Before gas collection, 20/60 ml compressed zero air were injected into 500 ml vials to keep the pressure in the vials and then collected 20 ml gas samples into the pre-evacuated exetainers (Exetainer®, Labco Ltd., Lampeter, Ceredigion, UK). The 20 ml gas samples were analyzed for concentrations of N2O and CO2 by gas chromatography (GC, Agilent 7890). Gas samples (60 ml) for the analysis of fertilizer-derived 15N2O were taken on days 0, 7, and 15 were analyzed for 15N enrichment in N2O by Isotope Ratio Mass Spectrometry (IRMS, Hydra 20–20, SerCon, Crewe, UK).
Soil Sampling and Analysis
Soils were destructively sampled for mineral nitrogen measurements and isotope measurements on days 0, 7, and 15 immediately after gas sampling. There were four replicates at each sampling day. Subsamples of 2 g soil were collected for soil DNA extraction, and 50 g of soil in the 500 ml vials was shaken with 250 ml 2M KCl (1:5 ratio soil:KCl solution) for 1 h at 200 rpm at room temperature, and the supernatant was filtered through a qualitative Whatman No. 42 filter paper. The extracts (30 ml) were stored at −20°C prior to analysis of -N and -N on a segmented-flow analyser (Skalar SAN++, Breda, Holland). The 15N enrichment of and was determined by a micro-diffusion method as reported by Saghir et al. (1993), with the modification that an acidified filter paper disc (Whatman No. 41) was used instead of the petri dish of acid to absorb NH3 and analysis by the Isotope Ratio Mass Spectrometer (Hydra 20–20, Sercon, Crewe, UK).
Soil DNA Extraction and Quantitative PCR (qPCR)
The Power Soil DNA Isolation kit (MO BIO Laboratories Inc., Carlsbad, CA, USA) was used for DNA extraction from 0.25 g of soils collected on days 0, 7, and 15 following the manufacturer's instructions. The quantity and quality of the extracted DNA were assessed using a NanoDrop ND2000c spectrophotometer (NanoDrop Technologies, Wilmington, DE, USA) and checked on the 1% agarose gel. The AOA and AOB amoA gene copy numbers were quantified from triplicate samples using qPCR with the primer sets Arch-amoAF/Arch-amoAR (Francis et al., 2005) and amoA1F/amoA2R (Rotthauwe et al., 1997), respectively. Each qPCR reaction for AOA was performed in a 20 μl volume containing 10 μl SensiFAST SYBR No-ROX reagent (Bioline, Sydney, Australia), 0.5 μM of each primer, and 2 μl of 10-fold dilution DNA template (1–10 ng). Each qPCR reaction for AOB was performed in a 10 μl volume containing 5 μl iTaq Universal SYBR Green Supermix (Bio-Rad Laboratories, USA), 0.6 μM of each primer, and 2 μl of 10-fold dilution DNA template (1–10 ng). Amplification conditions for both AOA and AOB were as follows: 95°C for 3 mins, 40 cycles of 5 s at 95°C, 30 s at 60°C, and 45 s at 72°C. A known copy number of plasmid DNA for AOA or AOB was used to create a standard curve. For all assays, qPCR efficiency was 92.5–98.7% and r2 was 0.96–0.99.
Calculations
N2O fluxes were calculated according to the following equation:
where F is the gas flux in μg N2O-N cm2 d−1, ρ represents the density of N2O under the standard state (g ml−1), V is the volume of the head space (ml), A is the area of the vial (cm2), is the change in gas concentration per unit of time in ppm d−1, and T is the air temperature within the vial (°K).
The gross nitrification rate was determined by the 15N dilution technique (Kirkham and Bartholomew, 1954; Barraclough and Puri, 1995).
The relative contribution by denitrification (Cd) and nitrification (Cn) to N2O production was calculated using the method by Stevens et al. (1997) following the equation:
where aN2O is the 15N atom% enrichment of N2O, aNO3 is the 15N atom% enrichment in pool, and aNH4 is the 15N atom% enrichment in pool. Based on Stevens et al. (1997), the relative contribution of nitrification and denitrification to N2O emission was calculated from the 15N-NO3 treatment.
Where is produced through nitrification.
Statistical Analyses
Data were analyzed using SPSS 19 and means were compared using one-way analysis of variance (ANOVA) between treatments to test the variance with a level of significance of p < 0.05. Spearman correlation analysis was performed to test the relationships between N2On and the abundances of AOA and AOB.
Results
Characteristics of Soils Used in This Study
In this study, the examined soil physical and chemical properties highly varied across different land-use (Table 1). All soils except the vegetable soil were acidic (pH ≤ 6). The dairy pasture soil had the highest total C content (9.3%), while the vegetable soil the lowest (0.8%). The same trends for the total N contents were observed. The inorganic nitrogen was dominated by -N ranging from 8.8 to 47 mg kg−1 soil, with the highest value recorded in the dairy pasture soil. Sugarcane and vegetable soils had sandy texture, but dairy pasture soil was clay loam and cropping soil was loam.
N2O Production Rates
The N2O production rates were found to be highly variable across different land-use in agricultural soils (Figure 1). The highest N2O production rate was recorded in the cereal cropping soil (average 1.98 μg N2O-N cm−2 d−1), which was significantly higher than those in the sugarcane soil (0.12 μg N2O-N cm−2 d−1), vegetable soil (0.20 μg N2O-N cm−2 d−1), and dairy pasture soil (0.48 μg N2O-N cm−2 d−1). The N2O flux continuously decreased throughout the incubation period in the cereal cropping soil, while in the sugarcane, dairy pasture, and vegetable soils, N2O production rates stabilized after 7 days of incubation (Figure 1). The soils with higher total N contents tended to have higher N2O production rates.
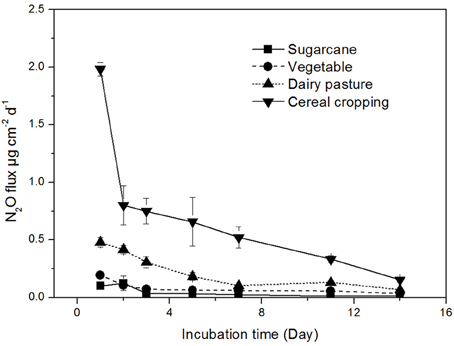
Figure 1. Soil N2O production rates from different agricultural soils. Error bars represent standard error.
N2O Sources in Different Agricultural Soils
The enrichment of N2O, , and pool is shown for each treatment in the different agricultural soils in Figure 2. In the 15 treatment, the 15N enrichment in the N2O pool over the course of incubation was always between the 15N enrichment levels of the and pools, suggesting that N2O was produced by both nitrification and denitrification (Figures 2A,C,E,G). The denitrification pathway was responsible for only 3.3% of N2O production in the sugarcane soil (Table 2), which was reflected by the 15N enrichment of N2O from the 15 treatment (Figure 2B). In the sugarcane soil the 15N enrichment of N2O from the 15 treatment was close to natural abundance (Figure 2B), and N2O was determined to be mainly produced from nitrification (96.7%), which was the same trend as observed for dairy pasture and cereal cropping soils at day 7 (Figures 2F,H). However, in the vegetable soil, the 15N enrichment of the N2O pool (Figure 2D) was close to the 15N abundance of the 15 at day 7, indicating that denitrification was the predominant pathway of N2O emission and was determined to be responsible for 76.3% of N2O production (Table 2).
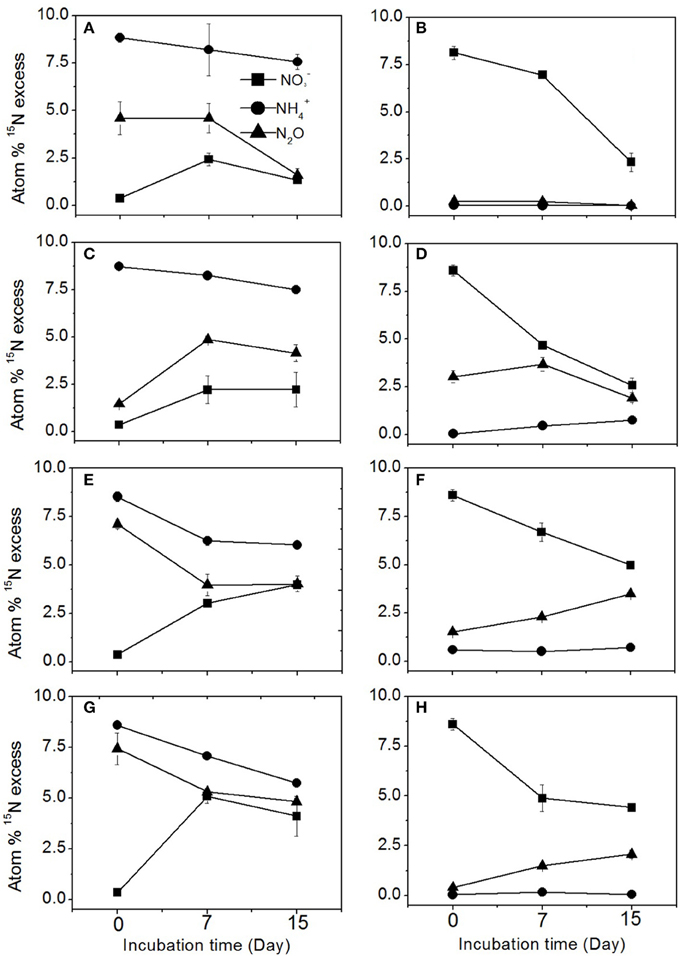
Figure 2. 15N enrichment of N2O, , and in the 15N labeled and treatments during the incubation. (A,C,E,G) represent the 15N-labeled treatment in the sugarcane, vegetable, dairy pasture, and cereal cropping soils, respectively. (B,D,F,H) represent the 15N labeled treatment in the sugarcane, vegetable, dairy pasture, and cereal cropping soils, respectively. Error bars represent standard error.
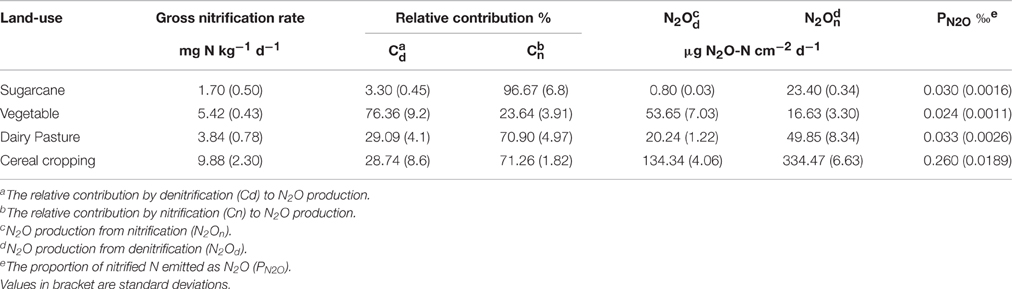
Table 2. Gross nitrification rates and the ratios of N2O production to nitrification in the studied agricultural soils.
The nitrification-derived N2O peak from the cereal cropping soil was 334.4 μg N2O-N cm−2 d−1 (Table 2), which was strikingly higher than that in the sugarcane soil (23.4 μg N2O-N cm−2 d−1) although the Cn (the contribution of nitrification to N2O production) of the sugarcane soil was higher than that of the cereal cropping soil. In the acidic soils, the Cn was higher than that of denitrification (Cd; Table 2), and followed the order sugarcane soil > cereal cropping soil > dairy pasture soil. There was a negative relationship between the denitrification capacity and soil pH in the three acidic soils (Table 2).
N2O Derived from Nitrification
The gross nitrification rate was calculated by the 15N dilution technique (Barraclough and Puri, 1995), because net nitrification does not necessarily reflect actual scale of processes, particularly where substrate is subject to losses of other pathways. The results showed that the gross nitrification rates were 1.70, 5.42, 3.84, and 9.88 mg N kg−1 d−1 for the sugarcane, vegetable, dairy pasture, and cereal cropping soils, respectively (Table 2). The nitrification rate in the cereal cropping soil was significantly (p < 0.05) higher than that in the other three soils. The proportion of nitrified N emitted as N2O (PN2O) over 7 days varied across soils (Table 2). The cereal cropping soil had the highest PN2O value (0.26‰) which was significantly (p < 0.05) higher than that in other soils. The gross nitrification rates for the four soils followed the order of cereal cropping > vegetable > dairy pasture > sugarcane, whilst PN2O followed different order of cereal cropping > dairy pasture > sugarcane > vegetable.
Dynamics of Ammonia Oxidizers during the Microcosm Incubation
The abundance of AOB amoA genes was always lower than that of AOA amoA genes in all four agricultural soils (Figure 3). The highest AOA amoA gene abundance was found in the vegetable soil at day 0 (1.5 × 10⁷ copies g−1 dry soil), while the highest AOB amoA abundance was observed in the cereal cropping soil at day 0 (9.1 × 10⁵ copies g−1 dry soil). Following application of fertilizers, both AOA and AOB amoA gene abundance significantly increased in the four soils (p < 0.05). The cereal cropping soil had the largest AOB population throughout the incubation period (on average 2.9 × 10⁷ copies g−1 dry soil), whilst AOA amoA gene abundance in the sugarcane soil (on average 2.5 × 10⁸ copies g−1 dry soil) were found to be higher than those in the vegetable soil (on average 8.6 × 10⁷ copies g−1 dry soil), the cereal cropping soil (on average 1.0 × 10⁸ copies g−1 dry soil) and the dairy pasture soil (on average 1.7 × 10⁸ copies g−1 dry soil; Figure 3). In the sugarcane soil the ratio of AOA to AOB was the highest and averaged at 61.4, followed by the dairy pasture soil averaged at 24.5, vegetable soil at 23.2 and cereal cropping soil at 5.4 within the whole incubation period. Although AOA were more abundant than AOB, the magnitude of changes in AOB abundance in the microcosm was greater than that of AOA.
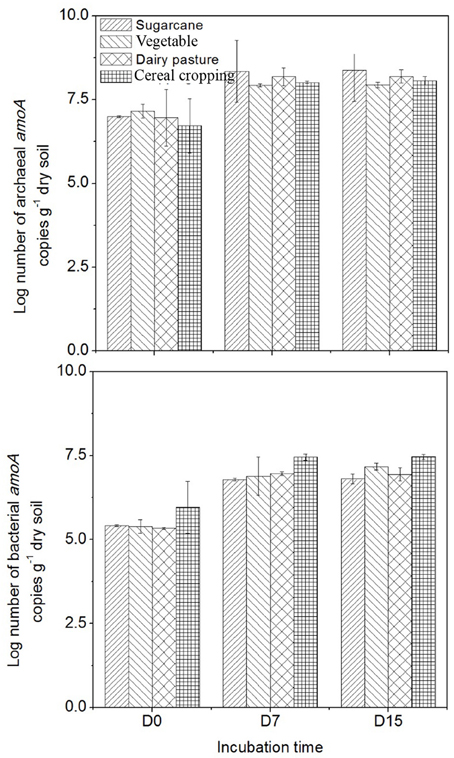
Figure 3. Changes in AOA and AOB amoA gene copy numbers in the 15NH4 treatment during the incubation period. Error bars represent standard error.
Correlation between Nitrification-Sourced N2O and AOA and AOB Populations in Different Soils
There was a significant correlation between AOA amoA gene abundance and nitrification-sourced N2O (p < 0.05) in sugarcane soil, regardless of the applied labeled fertilizer (Table 3). In contrast, significant relationship (p < 0.001) between nitrification-related N2O and AOB amoA gene abundance was only observed after fertilizer application in cereal cropping soil.
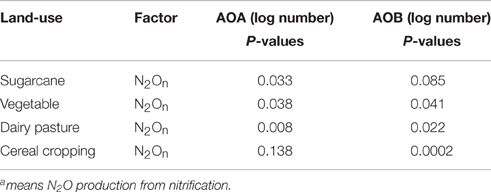
Table 3. Spearman correlations between N2 and the abundances of AOA and AOB.
Discussion
This study investigated N2O production, pathways of soil N2O emission, proportion of nitrified N emitted as N2O, changes in abundance of ammonia oxidizers, and the correlation between nitrification-related N2O and ammonia oxidizer populations in four agricultural soils with different land-use. The results demonstrate that these soils differing in both soil physicochemical properties and land-use have different rates of N2O production at a particular WFPS. Although it is not possible to clearly discern the effects of land-use from this experimental design, we speculated that land-use may affect nitrifier-derived N2O emissions. Verchot et al. (1999) demonstrated that there were lower N2O fluxes from pasture soils compared with forest soils. Studies in the humid and subhumid tropics have indicated that N2O fluxes from the fertilized cropping systems can be as much as 10 times that from the natural systems depending on the rates and timing of application of fertilizers (Davidson et al., 1986; Veldkamp and Keller, 1997). This was likely attributed to the different soil properties determined by different land-use. In fact, many previous studies have showed that land-use and management practices could significantly affect soil physical, chemical, and biological parameters (Lauber et al., 2008; Osborne et al., 2011; Bissett et al., 2014).
Firestone and Davidson (1989) indicated that the variable contribution of nitrification and denitrification to N2O was mainly due to the varying C and N availability. In this study, the different soils were largely characterized by the differences in soil pH and N, C. It has been reported that soil pH could directly and positively affect denitrification enzymes (Simek and Cooper, 2002), which may be a possible explanation for the higher contribution of denitrification to N2O (76%) in the vegetable soil (pH 7.8) compared with the other three acidic soils. Aulakh and Doran (1990) found that most denitrifiers had optimum pH values between 6 and 8 for growth and activity. The contribution of nitrification to N2O decreased with decreasing soil pH in the acidic soils (Table 2). This is probably because that acidic soil pH has an overriding effect on autotrophic nitrification and low soil pH can impede the activities of autotrophic nitrifier (Weber and Gainey, 1962). Some studies in subtropical China have revealed that acidic soils reduced nitrification capacity (Zhao et al., 2007). However, the research conducted by Xu and Cai (2007) on 54 denitrification measurements in humid subtropical soils showed that neither the increased pH of upland soil, nor the decreased pH of the tea garden soil altered soil denitrification capacity. The results from Xu and Cai (2007) suggested that land-use and management practices favored soil C and/or N accumulation and anaerobic microorganism activities enhanced soil denitrification capacity.
Furthermore, Weier et al. (1993) demonstrated that total N loss due to denitrification generally increased as soil texture became coarser and without the C-amendment. In this study, the sandy vegetable soil (pH 7.8) which had the lowest organic C content (0.6%) also had a strong denitrification capacity and a high contribution to N2O production (76.36%). However, in the sugarcane soil which was also sandy (pH 6.0) and had a low organic C content (0.99%), the contribution of N2O production was lowest (around 3.3%) among the four agricultural soils. The possible explanation might be that smaller amounts of organic C and mineral N can be available to the denitrifying population under acidic conditions (Simek and Cooper, 2002). In this study, the highest PN2O (0.26‰) occurred in the cereal cropping soil with the highest organic C indicating that soil organic C content may also have affected N2O production ratios from nitrification. Mørkved et al. (2007) found that the ratio of N2O production from nitrification in soils with low pH and high organic C content was higher than the soils with high pH and low soil organic C content.
Substrate N level is another important variable influencing N2O emissions from soils by affecting the rates and the product spectra of nitrification and denitrification (Moiser, 1994; Kaiser et al., 1996; Skiba et al., 1997). The initial concentration of in cereal cropping soil was low (10 mg N kg−1 soil), but the gross nitrification rate and nitrification-sourced N2O ranked the highest among the soil samples after treatments application. The results were in agreement with those obtained by Gödde and Conrad (2000). It may be because nitrifiers limited denitrification by providing and which were particularly low in initial concentrations. In our study, the nitrifiers in cereal cropping soil were highly responsive to fertilizer additions leading to the greatest N2O emissions from nitrification. The study conducted by Xu and Cai (2007) in the sub-tropical soils inferred that -N concentration was a vital factor affecting denitrification occurrence. Denitrification capacity varied greatly, from nearly absent to complete disappearance of -N added at a rate of 200 mg N kg−1 soil within 11 days under anaerobic incubation at 30°C (Xu and Cai, 2007). The results of this study showed the PN2O-values were lower than the observations of Zhang et al. (2011).
The different soils had different amoA genes copy numbers (Figure 3). Copy numbers of the AOA and AOB amoA genes were found to be higher in the sugarcane and cereal cropping soils respectively, than in the other soils, suggesting that amoA genes abundances might be influenced by land-use or soil type. Previous studies found similar results when comparing amoA genes between different agricultural land-use soils (Hayden et al., 2010; Bissett et al., 2014).
The important role of AOA in nitrification and their potential for N2O production has been highlighted previously in different ecosystems (Francis et al., 2005; Könneke et al., 2005; Hu et al., 2015a). Here, it was observed that nitrification-derived N2O emissions (Cn) in the cereal cropping soil was significantly correlated to AOB population (p < 0.01) while AOA was mainly correlated with nitrification in the sugarcane soil (p < 0.05). The sugarcane soil had the lowest amount of substrate (), while the concentration was two times higher in the cereal cropping soil. It has been suggested that AOA prefer by low fertility environments (Di et al., 2009; Schauss et al., 2009), while AOB communities are better adapted to the high nutrient availability conditions (Di et al., 2009). Therefore, in the cereal cropping soil, AOA may only play a minor role in N2O production, and AOB were likely to play the predominant role in N2O emission. Di et al. (2010) also found that AOB population had a significant relationship with N2O production in N-rich grassland soil. We measured the amoA gene abundance in different soils based on soil DNA, giving insights into community size and potential contribution to activity, however, measurements of active community based on soil RNA are highly desirable in future studies. Furthermore, community analysis perhaps is also needed to identify the active ammonia oxidizers, in addition to quantifying them. The interpretation of the relative contributions of AOA and AOB to N2O emissions cannot be made clearly and the underlying mechanism may need to be studied further using more advanced molecular techniques. Furthermore, it is not possible to accurately determine the relative contribution of AOA and AOB to N2O emissions, because the assumptions were made that all AOA and AOB produced the same yield of N2O per unit of ammonia oxidized. However, a large body of previous literature stated that this was not the case (Stieglmeier et al., 2014). 1-octyne, a recently reported AOB selective inhibitor, can be used to separate AOA-related N2O and AOB-related N2O and specifically inhibited AOB growth, activity and N2O production (Hink et al., 2016). Therefore, it is essential to make use of AOA or AOB selective inhibitor to give an explicit interpretation on the relative role on nitrification-sourced N2O.
Conclusions
In conclusion, under the experimental aerobic microcosm conditions, nitrification was the main contributor of N2O emissions in acidic sugarcane, dairy pasture and cereal cropping soils (pH < 6). Denitrification played a predominant role in N2O production in an alkaline vegetable soil. Compared to the cereal cropping, sugarcane, and dairy pasture soils, more nitrification-sourced N2O was emitted from the sugarcane soil (Cn 96.67%). AOB might be the major contributor to N2O emissions in the cereal cropping soil, while AOA may be predominately responsible for nitrification-sourced N2O in sugarcane soil. In the vegetable and dairy pasture soils, both AOA and AOB are likely to contribute to nitrification and N2O emissions. Our findings provide evidence that land-use and soil properties may be important factors influencing the contributions of different pathways to N2O emissions, and the size of the AOA and AOB communities. Furthermore, further work with more soil samples from similar land-use and/or field trials are required to confirm the laboratory microcosm observations.
Author Contributions
RL made substantial contribution to the content of this article and is the primary author. She was responsible primarily for the planning, execution, and preparation of the work for publication. HS, HwH, HH, JH, PM, and DC contributed substantial time and research funding to help RL to improve the design of the work and the analysis, interpretation of data for the work. They revised it critically for important intellectual content and final approval of the version to be published, also agreement to be accountable for all aspects of the work in ensuring that questions related to the accuracy or integrity of any part of the work are appropriately investigated and resolved.
Conflict of Interest Statement
The authors declare that the research was conducted in the absence of any commercial or financial relationships that could be construed as a potential conflict of interest.
Acknowledgments
The authors would like to acknowledge the financial support by Incitec Pivot, the Australian Government Department of Agriculture through the Grains Research and Development Corporation, and Australian Research Council (DE150100870, DP160101028).
References
Aulakh, M. S., and Doran, J. W. (1990). Effectiveness of acetylene inhibition of N2O reduction for measuring denitrification in soils of varying wetness. Commun. Soil Sci. 21, 2233–2243.
Australian Greenhouse Office (2001). National Greenhouse Gas Inventory 1999 with Methodology Supplements. Canberra: Australian Greenhouse Office, Commonwealth of Australia.
Baggs, E. (2008). A review of stable isotope techniques for N2O source partitioning in soils: recent progress, remaining challenges and future considerations. Rapid Commun. Mass Spectrom. 22, 1664–1672. doi: 10.1002/rcm.3456
Baggs, E. M., and Blum, H. (2004). CH4 oxidation and emissions of CH4 and N2O from Lolium perenne swards under elevated atmospheric CO2. Soil Biol. Biochem. 36, 713–723. doi: 10.1016/j.soilbio.2004.01.008
Barraclough, D., and Puri, G. (1995). The use of 15N pool dilution and enrichment to separate the heterotrophic and autotrophic pathways of nitrification. Soil. Biol. Biochem. 27, 17–22.
Bissett, A., Abell, G. C. J., Brown, M., Thrall, P. H., Bodrossy, L., Smith, M. C., et al. (2014). Land-use and management practices affect soil ammonia oxidizer community structure, activity and connectedness. Soil Biol. Biochem. 78, 138–148. doi: 10.1016/j.soilbio.2014.07.020
Braker, G., and Conrad, R. (2011). Diversity, structure, and size of N2O producingmicrobial communities in soils – what matters for their functioning? Adv. Appl. Microbiol. 75, 33–70. doi: 10.1016/B978-0-12-387046-9.00002-5
Butterbach-Bahl, K., Baggs, E. M., Dannenmann, M., Kiese, R., and Zechmeister-Boltenstern, S. (2013). Nitrous oxide emissions from soils: how well do we understand the processes and their controls? Phil. Trans. R. Soc. B 368:20130122. doi: 10.1098/rstb.2013.0122
Cantarel, A. A. M., Bloor, J. M. G., Deltroy, N., and Soussana, J. F. (2011). Effects of climate change drivers on nitrous oxide Fluxes in an upland temperate grassland. Ecosystems 14, 223–233. doi: 10.1007/s10021-010-9405-7
Daims, H., Lebedeva, E. V., Pjevac, P., Han, P., Herbold, C., Albertsen, M., et al. (2015). Complete nitrification by Nitrospira bacteria. Nature 528, 504–509. doi: 10.1038/nature16461
Davidson, E. A., Swank, W. T., and Perry, T. O. (1986). Distinguishing between nitrification and denitrification as sources of gaseous nitrogen production in soil. Appl. Environ. Microbiol. 52, 1280–1286.
Davidson, E. A. (2009). The contribution of manure and fertilizer nitrogen to atmospheric nitrous oxide since 1860. Nat. Geosci. 2, 659–662. doi: 10.1038/ngeo608
Di, H. J., Cameron, K. C., Shen, J. P., Winefield, C. S., O'Callaghan, M., Bowatte, S., et al. (2009). Nitrification driven by bacteria and not archaea in nitrogen-rich grassland soils. Nat. Geosci. 2, 621–624. doi: 10.1038/ngeo613
Di, H. J., Cameron, K. C., Sherlock, R. R., Shen, J. P., He, J. Z., and Winefield, C. (2010). Nitrous oxide emissions from grazed grassland as affected by a nitrification inhibitor, dicyandiamide, and relationships with ammonia-oxidizing bacteria and archaea. J. Soils Sediments 10, 943–954. doi: 10.1007/s11368-009-0174-x
Firestone, M. K., and Davidson, E. A. (1989). “Microbiological basis of NO and N2O production and consumption in soil,” in Exchange of Trace Gases between Terrestrial Ecosystems and the Atmosphere, eds M. O. Andrcas and D. S. Schimel (Chichester, UK: John Wiley & Sons), 7–21.
Francis, C. A., Roberts, K. J., Beman, J. M., Santoro, A. E., and Oakley, B. B. (2005). Ubiquity and diversity of ammonia-oxidizing archaea in water columns and sediments of the ocean. Proc. Natl. Acad. Sci. U.S.A. 102, 14683–14688. doi: 10.1073/pnas.0506625102
Freitag, A., Rudert, M., and Bock, E. (1987). Growth of nitrobacter by dissimilatoric nitrate reduction. FEMS Microbiol. Lett. 48, 105–109. doi: 10.1111/j.1574-6968.1987.tb02524.x
Galloway, J. N., Townsend, A. R., and Erisman, J. W. (2008). Transformation of the nitrogen cycle: recent trends, questions, and potential solutions. Science 320, 889–892. doi: 10.1126/science.1136674
Gödde, M., and Conrad, R. (2000). Immediate and adaptational temperature effects on nitric oxide production and nitrous oxide release from nitrification and denitrification in two soils. Biol. Fertil. Soils 30, 33–40. doi: 10.1007/s003740050584
Gubry-Rangin, C., Nicol, G. W., and Prosser, J. I. (2010). Archaea rather than bacteria control nitrification in two agricultural acidic soils. FEMS Microbiol. Ecol. 74, 566–574. doi: 10.1111/j.1574-6941.2010.00971.x
Hayden, H., Drake, J., Imhof, M., Oxley, A. P. A., Norng, S., and Mele, P. M. (2010). The abundance of nitrogen cycle genes amoA and nifH depends on land-use and soil types in South-Eastern Australia. Soil Biol. Biochem. 42, 1774–1783. doi: 10.1016/j.soilbio.2010.06.015
He, J. Z., Shen, J. P., Zhang, L. M., Zhu, Y. G., Zheng, Y. M., Xu, M. G., et al. (2007). Quantitative analyses of the abundance and composition of ammonia-oxidizing bacteria and ammonia-oxidizing archaea of a Chinese upland red soil under long-term fertilization practices. Environ. Microbiol. 9, 2364–2374. doi: 10.1111/j.1462-2920.2007.01358.x
Hink, L., Nicol, G. W., and Prosser, J. I. (2016). Archaea produce lower yields of N2O than bacteria during aerobic ammonia oxidation in soil. Environ. Microbiol. doi: 10.1111/1462-2920.13282. [Epub ahead of print].
Hofstra, N., and Bouwman, A. F. (2005). Denitrification in agricultural soils: summarizing published data and estimating global annual rates. Nutr. Cycl. Agroecosys 72, 267–278. doi: 10.1007/s10705-005-3109-y
Hu, H. W., Chen, D. L., and He, J. Z. (2015a). Microbial regulation of terrestrial nitrous oxide formation: understanding the biological pathways for prediction of emission rates. FEMS Microbiol. Rev. 39, 729–749. doi: 10.1093/femsre/fuv021
Hu, H. W., Macdonald, C. A., Trivedi, P., Holmes, B., Bodrossy, L., He, J. Z., et al. (2015b). Water addition regulates the metabolic activity of ammonia oxidizers responding to environmental perturbations in dry subhumid ecosystems. Environ. Microbiol. 17, 444–461. doi: 10.1111/1462-2920.12481
Huang, T., Gao, B., Hu, X. K., Lu, X., Well, R., Christie, P., et al. (2014). Ammonia-oxidation as an engine to generate nitrous oxide in an intensively managed calcareous Fluvo-aquic soil. Sci. Rep. 4:3950. doi: 10.1038/srep03950
IPCC (2007). “Climate change 2007: the physical science basis,” in Contribution of Working Group I to the Fourth Assessment Report of the Intergovernmental Panel on Climate Change, eds S. Solomon, D. Qin, M. Manning, Z. Chen, M. Marquis, K. B. Averyt, M. Tignor, and H. L. Miller (Cambridge: Cambridge University Press).
Jørgensen, C. J., and Elberling, B. (2012). Effects of flooding-induced N2O production, consumption and emission dynamics on the annual N2O emission budget in wetland soil. Soil Biol. Biochem. 53, 9–17. doi: 10.1016/j.soilbio.2012.05.005
Kaiser, E. A., Eiland, F., Germon, J. C., Gispert, M. A., Heinemeyer, O., Henault, C., et al. (1996). What predicts nitrous oxide emissions and denitrification N-loss from European soils? Z. Pflanzenernaehr Bodenkd 159, 541–547.
Kirkham, D., and Bartholomew, W. V. (1954). Equations for following nutrient transformations in soil utilizing tracer data. Soil Sci. Soc. Am. J. 18, 33–34. doi: 10.2136/sssaj1954.03615995001800010009x
Könneke, M., Bernhard, A. E., de la Torre, J. R., Walker, C. B., Waterbury, J. B., and Stahl, D. A. (2005). Isolation of an autotrophic ammonia-oxidizing marine archaeon. Nature 437, 543–546. doi: 10.1038/nature03911
Kozlowski, J. A., Stieglmeier, M., Schleper, C., Klotz, M. G., and Stein, L. Y. (2016). Pathways and key intermediates required for obligate aerobic ammonia-dependent chemolithotrophy in bacteria and Thaumarchaeota. ISME J. 10, 1836–1845. doi: 10.1038/ismej.2016.2
Lauber, C. L., Strickland, M. S., Bradford, M. A., and Fierer, N. (2008). The influence of soil properties on the structure of bacterial and fungal communities across land-use types. Soil Biol. Biochem. 40, 2407–2415. doi: 10.1016/j.soilbio.2008.05.021
Leininger, S., Urich, T., and Schloter, M. (2006). Archaea predominate among ammonia-oxidizing prokaryotes in soils. Nature 442, 806–809. doi: 10.1038/nature04983
Linn, D. M., and Doran, J. W. (1984). Effect of water-filled pore space on carbon dioxide and nitrous oxide production in tilled and nontilled soils. Soil Sci. Soc. Am. J. 48, 1267–1272. doi: 10.2136/sssaj1984.03615995004800060013x
Livesley, S., Kiese, R., and Graham, J. (2008). Trace gas flux and the influence of short-term soil water and temperature dynamics in Australian sheep grazed pastures of differing productivity. Plant Soil 309, 89–103. doi: 10.1007/s11104-008-9647-8
Moiser, A. R. (1994). Nitrous oxide emissions from agricultural soils. Fert. Res. 37, 191–200. doi: 10.1007/BF00748937
Morimoto, S., Hayatsu, M., Hoshino, T. Y., Nagaoka, K., Yamazaki, M., Karasawa, T., et al. (2011). Quantitative analyses of ammonia-oxidizing archaea (AOA) and ammonia-oxidizing bacteria (AOB) in fields with different soil types. Microbes Environ. 26, 248–253. doi: 10.1264/jsme2.ME11127
Mørkved, P. T., Dörsch, P., and Bakken, L. R. (2007). The N2O product ratio of nitrification and its dependence on long-term changes in soil pH. Soil Biol. Biochem. 39, 2048–2057. doi: 10.1016/j.soilbio.2007.03.006
Offre, P., Prosser, J. I., and Nicol, G. W. (2009). Growth of ammonia-oxidizing archaea in soil microcosms is inhibited by acetylene. FEMS Microbiol. Ecol. 70, 99–108. doi: 10.1111/j.1574-6941.2009.00725.x
Osborne, C. A., Zwart, A. B., Broadhurst, L. M., Young, A. G., and Richardson, A. E. (2011). The influence of sampling strategies and spatial variation on the detected soil bacterial communities under three different land-use types. FEMS Microbiol. Ecol. 78, 70–79. doi: 10.1111/j.1574-6941.2011.01105.x
Reay, D. S., Davidson, E. A., Smith, K. A., Smith, P., Melillo, J. M., Dentener, F., et al. (2012). Global agriculture and nitrous oxide emissions. Nat. Clim. Change 2, 410–416. doi: 10.1038/nclimate1458
Rotthauwe, J. H., Witzel, K. P., and Liesack, W. (1997). The ammonia monooxygenase structural gene amoA as a functional marker: molecular fine-scale analysis of natural ammonia-oxidizing populations. Environ. Microbiol. 63, 4704–4712.
Saghir, N. S., Mulvancy, R. L., and Azam, F. (1993). Determination of nitrogen by microdiffusion in mason jars. I. Inorganic nitrogen in soil extracts. Commun. Soil Sci. Plant Anal. 24, 1745–1762. doi: 10.1080/00103629309368912
Santoro, A. E., Buchwald, C., and McIlvin, M. R. (2011). Isotopic signature of N2O produced by marine ammonia-oxidizing archaea. Science 333, 1282–1285. doi: 10.1126/science.1208239
Schauss, K., Focks, A., Leininger, S., Kotzerke, A., Heuer, H., ThieleBruhn, S., et al. (2009). Dynamics of functional relevance of ammonia-oxidizing archaea in two agricultural soils. Environ. Microbiol. 11, 446–456. doi: 10.1111/j.1462-2920.2008.01783.x
Shen, J. P., Zhang, L. M., Zhu, Y. G., Zhang, J. B., and He, J. Z. (2008). Abundance and composition of ammonia-oxidizing bacteria and ammonia-oxidizing archaea communities of an alkaline sandy loam. Environ. Microbiol. 10, 1601–1611. doi: 10.1111/j.1462-2920.2008.01578.x
Simek, M., and Cooper, J. E. (2002). The influence of soil pH on denitrification: progress towards the understanding of this interaction over the last 50 years. Eur. J. Soil Sci. 53, 345–354. doi: 10.1046/j.1365-2389.2002.00461.x
Skiba, U., Fowler, D., and Smith, K. A. (1997). Nitric oxide emissions from agricultural soils in temperate and tropical climates: sources, controls and mitigation options. Nutr. Cycl. Agroecosyst 48, 139–153. doi: 10.1023/A:1009734514983
Stevens, R. J., and Laughlin, R. J. (1998). Measurement of nitrous oxide and dinitrogen emissions from agricultural soils. Nutr. Cycl. Agroecosys 52, 131–139. doi: 10.1023/A:1009715807023
Stevens, R. J., Laughlin, R. J., Burns, L. C., Arah, J. R. M., and Hood, R. C. (1997). Measuring the contributions of nitrification and denitrification to the flux of nitrous oxide from soil. Soil Biol. Biochem. 29, 139–151. doi: 10.1016/S0038-0717(96)00303-3
Stieglmeier, M., Mooshammer, M., and Kitzler, B. (2014). Aerobic nitrous oxide production through N-nitrosating hybrid formation in ammonia-oxidizing archaea. ISME J. 8, 1135–1146. doi: 10.1038/ismej.2013.220
Treusch, A. H., Leininger, S., and Kletzin, A. (2005). Novel genes for nitrite reductase and Amo-related proteins indicate a role of uncultivated mesophilic crenarchaeota in nitrogen cycling. Environ. Microbiol. 7, 1985–1995. doi: 10.1111/j.1462-2920.2005.00906.x
van Kessel, M. A., Speth, D. R., Albertsen, M., Nielsen, P. H., Op den Camp, H. J., et al. (2015). Complete nitrification by a single microorganism. Nature 528, 555–559. doi: 10.1038/nature16459
Veldkamp, E., and Keller, M. (1997). Nitrogen oxide emissions from a banana plantation in the humid tropics. J. Geophys. Res. 102, 15889–15898. doi: 10.1029/97JD00767
Verchot, L. V., Davidson, E. A., Cattanio, J. H., Ackerman, I. L., Erickson, H. E., and Keller, M. (1999). Land-use change and biogeochemical controls of nitrogen oxide emissions from soils in eastern Amazonia. Global Biogeochem. Cycles 13, 31–46. doi: 10.1029/1998GB900019
Weber, D. F., and Gainey, P. L. (1962). Relative sensitivity of nitrifying organisms to hydrogen ions in soils and solutions. Soil Sci. 94, 138–145. doi: 10.1097/00010694-196209000-00002
Weier, K., Doran, J., and Power, J. (1993). Denitrification and the dinitrogen/nitrous oxide ratio as affected by soil water, available carbon, and nitrate. Soil Sci. Soc. Am. J. 57, 66–72. doi: 10.2136/sssaj1993.03615995005700010013x
Wrage, N., Velthof, G. L., and van Beusichem, M. L. (2001). Role of nitrifier denitrification in the production of nitrous oxide. Soil Biol. Biochem. 33, 1723–1732. doi: 10.1016/S0038-0717(01)00096-7
Xu, Y., and Cai, Z. (2007). Denitrification characteristics of subtropical soils in China affected by soil parent material and land use. Eur. J. Soil Sci. 58, 1293–1303. doi: 10.1111/j.1365-2389.2007.00923.x
Zhang, J. B., Cai, Z. C., Cheng, Y., and Zhu, T. B. (2009). Denitrification and total nitrogen gas production from forest soils of Eastern China. Soil Biol. Biochem. 41, 2551–2557. doi: 10.1016/j.soilbio.2009.09.016
Zhang, J. B., Cai, Z. C., and Zhu, T. B. (2011). N2O production pathways in the subtropical acis froest soils in China. Environ. Res. 111, 643–649. doi: 10.1016/j.envres.2011.04.005
Zhang, J. B., Muller, C., and Cai, Z. C. (2015). Heterotrophic nitrification of organic N and its contribution to nitrous oxide emissions in soils. Soil Biol. Biochem. 84, 109–209. doi: 10.1016/j.soilbio.2015.02.028
Keywords: nitrification, AOA, AOB, bacteria, archaea, land-use management
Citation: Liu R, Hu H, Suter H, Hayden HL, He J, Mele P and Chen D (2016) Nitrification Is a Primary Driver of Nitrous Oxide Production in Laboratory Microcosms from Different Land-Use Soils. Front. Microbiol. 7:1373. doi: 10.3389/fmicb.2016.01373
Received: 10 March 2016; Accepted: 19 August 2016;
Published: 09 September 2016.
Edited by:
Tim Daniell, James Hutton Institute, UKReviewed by:
Cindy J. Smith, National University of Ireland, Galway, IrelandGraeme W. Nicol, Université de Lyon, France
Nicholas Morley, University of Aberdeen, UK
Copyright © 2016 Liu, Hu, Suter, Hayden, He, Mele and Chen. This is an open-access article distributed under the terms of the Creative Commons Attribution License (CC BY). The use, distribution or reproduction in other forums is permitted, provided the original author(s) or licensor are credited and that the original publication in this journal is cited, in accordance with accepted academic practice. No use, distribution or reproduction is permitted which does not comply with these terms.
*Correspondence: Rui Liu, rliu@unimelb.edu.au