 Jessica Lleixà
 Maria Manzano
 Albert Mas
 María del C. Portillo
- Biotecnología Enológica, Department Bioquímica i Biotecnologia, Facultat d‘Enologia, Universitat Rovira i Virgili, Tarragona, Spain
The inoculation of wines with autochthonous yeast allows obtaining complex wines with a peculiar microbial footprint characteristic from a wine region. Mixed inoculation of non-Saccharomyces yeasts and S. cerevisiae is of interest for the wine industry for technological and sensory reasons. However, the interactions between these yeasts are not well understood, especially those regarding the availability of nutrients. The aim of the present study was to analyze the effect of nitrogen and sugar concentration on the evolution of mixed yeast populations on controlled laboratory-scale fermentations monitored by density, plate culturing, PCR-DGGE and sugar and nitrogen consumption. Furthermore, the effect of the time of inoculation of Saccharomyces cerevisiae respect the initial co-inoculation of three non-Saccharomyces yeasts was evaluated over the evolution of fermentation. Our results have shown that S. cerevisiae inoculation during the first 48 h conferred a stabilizing effect over the fermentations with non-Saccharomyces strains tested and, generally, reduced yeast diversity at the end of the fermentation. On the other hand, nitrogen limitation increased the time of fermentation and also the proportion of non-Saccharomyces yeasts at mid and final fermentation. High sugar concentration resulted in different proportions of the inoculated yeast depending on the time of S. cerevisiae inoculation. This work emphasizes the importance of the concentration of nutrients on the evolution of mixed fermentations and points to the optimal conditions for a stable fermentation in which the inoculated yeasts survived until the end.
Introduction
Wine is the result of alcoholic fermentation performed by yeasts during a complex process that transform the sugars present in the grape must into ethanol and carbon dioxide. During this alcoholic fermentation, a microbiological population evolves as a consequence of the chemical changes produced in the environment (Riberéau-Gayon et al., 2006). Many studies have established the yeast succession of non-Saccharomyces to Saccharomyces during spontaneous fermentation of grape juice. These non-Saccharomyces yeasts are the predominant microbiota in grapes and the main responsible for starting spontaneous alcoholic fermentation and often, under uncontrolled fermentations, lead to sluggish or stuck fermentations. For that reason, winemakers tend to inoculate grape must with commercial yeasts to ensure the completion of the fermentation, but compromising the complexity or the particular microbial footprint of wines of a certain region. In recent years, good properties and contribution of the non-Saccharomyces yeasts to wine and fermentation process have been described (Pretorius, 2000; Fleet, 2008; Ciani and Comitini, 2011; Jolly et al., 2014; Padilla et al., 2016a). With the aim to obtain wines that reflect a certain terroir, a previous study part of the WILDWINE project (Mas et al., 2016) accomplished the isolation and the characterization of multiple yeast strains from Priorat region to better understand the winemaking process and also to determine the source of microorganisms that produce a particular microbial footprint (Padilla et al., 2016b). The contribution of non-Saccharomyces takes part mostly during beginning and mid fermentation (Fleet, 2008). Non-Saccharomyces yeasts are able to produce metabolites or hydrolyze aromatic precursors providing new wine styles and enhancing their complexity (Ciani et al., 2010; Viana et al., 2011; Andorrà et al., 2012; Jolly et al., 2014).
The possibility to obtain wines with differential characteristics due to the role of non-Saccharomyces yeasts explains the increasing interest of using mixed cultures. As we have mentioned, one of the objectives of the WILDWINE project is to mimic the natural microbiota of a vineyard by the use of mixed inocula to perform fermentations to fight the wine uniformity derived from the widespread use of commercial S. cerevisiae starter cultures (Mas et al., 2016). Besides, interaction between non-Saccharomyces and S. cerevisiae has not been extensively studied, however some positive metabolic interactions have been described (Ciani et al., 2010; Ciani and Comitini, 2015). In the present study, the most characteristic non-Saccharomyces yeast isolated during the WILDWINE project were subjected to mixed alcoholic fermentation under different nutrient conditions (Mas et al., 2016; Padilla et al., 2016b).
The main problems during mixed fermentations are related to the nutrient composition of the must and the competition between the different yeast strains involved (Andorrà et al., 2010; Wang et al., 2015, 2016). It has been demonstrated that the consumption of nitrogen at the beginning of the fermentation by non-Saccharomyces yeast can prevent the correct development of S. cerevisiae.
Sugar and nitrogen composition of the grape must are key factors for the evolution of the alcoholic fermentation and the development of the yeasts (Bell and Henschcke, 2005; Beltran et al., 2005; Martínez-Moreno et al., 2012).
During the last few years, sugar content in grape must has become an important aspect since its concentration is increasing as a consequence of climate change and some viticultural practices (Mira de Orduña, 2010; Webb et al., 2012). The higher sugar content in grapes and, consequently, in musts is a problem for yeast physiology and it creates an osmotic stress that can produce, among others, stuck fermentations or wines with higher alcohol content.
In case of nitrogen, a higher or lower content can be harmful on fermentation kinetics and it has been demonstrated that a nitrogen concentration of 140 mg/L is the minimum required for yeasts to complete alcoholic fermentation (Bell and Henschcke, 2005), although this value is dependent on the sugar concentration (Martínez-Moreno et al., 2012). The same as sugar concentration, many factors can influence the nitrogen content on grapes and, consequently, on must such as environmental conditions and cultural practices (Bell and Henschcke, 2005).
The aim of this study was to determine the yeast dynamics and nutrient consumption during mixed fermentations of Saccharomyces and non-Saccharomyces yeast under four different nutrient conditions and with sequential addition of S. cerevisiae at four different time points. The fermentations were followed by density, plate culturing, PCR-DGGE and sugar consumption. According to our results, we propose the most suitable inoculation strategy for mixed fermentations using four strains isolated from Priorat region under the different nutrient concentrations.
Materials and Methods
Yeast Strains and Starter Cultures Preparation
Four different yeast strains frequently isolated from natural must from Priorat Appellation of Origin (Catalonia, Spain) were employed (Padilla et al., 2016b). These yeasts were identified by ITS sequencing and identified and deposited in the Spanish Type Culture Collection (CECT) as Saccharomyces cerevisiae CECT 13132, Hanseniaspora uvarum CECT 13130, Candida zemplinina CECT 13129 (synonym: Starmerella bacillaris, Duarte et al., 2012) and Toluraspora delbrueckii CECT 13135. The starter cultures were prepared by growing the yeasts strains separately in liquid YPD medium (2% glucose, 2% Bacto peptone, 1% yeast extract, 2% agar, w/v; Cultimed, Barcelona, Spain) at 28°C with a stirring rate of 150 rpm in an orbital shaker.
Mixed Inoculum Conditions
Fermentations were carried out in 250 mL of synthetic grape must (pH 3.3) as described by Riou et al. (1997), but with some modifications. The final concentration of sugars was either 200 or 240 g/L (denominated 200S or 240S, respectively) with a combination of glucose and fructose of 100 or 120 g/L each. The available nitrogen was either 100 or 300 mg/L (denominated 100N or 300N, respectively). Another variable was the time of the inoculation of S. cerevisiae: co-inoculation (0D), at 24 h (1D), at 48 h (2D) and at the 5th day (5D) after the inoculation of the non-Saccharomyces. Also, control fermentations were conducted for each nutrient condition with the sole inoculation of S. cerevisiae. Fermentations were considered finished when density was below 1000 g/L, or without variation for three consecutive days.
All the fermentations were performed in duplicate and inoculated at a concentration of 1.2·106 cells/mL of H. uvarum, 5·105 cells/mL of S. bacillaris, 1·105 cells/mL of T. delbrueckii and 2·106 cells/mL of S. cerevisiae. These concentrations resemble yeast populations of natural musts from Priorat, where the non-Saccharomyces yeasts were isolated (Wang et al., 2015) and the practice of inoculating commercial Saccharomyces presentations.
Density, Acetic Acid, and Sugar Measurements
The fermentations were monitored daily by density with Densito 30PX Portable Density Meter (Mettler Toledo, Spain). Once the fermentations were finished (the density was under 1000 g/L or stable for 3 days), concentrations of glucose and fructose and the acetic acid concentration in the final fermentation samples were analyzed by Miura One Multianalyzer (TDI, Barcelona, Spain) using the enzymatic kit from Biosystems S. A. (Barcelona, Spain). Samples for plating, qPCR and PCR-DGGE were taken at the beginning (24 h after incubation started), in the middle (density approximately 1020–1030 g/L) and at the end of fermentation (density below 1000 g/L or stable for 3 days). Maximum fermentation rate (R) was calculated as maximum slope of the density measurements respect the time. Also, time to reach the 10, 50, and 75% of the final density (referred as t10, t50, and t75, respectively) were calculated as additional parameters of the fermentation kinetics (Table S1). Successful fermentations were considered when density was below 1000 and residual sugar was below 3 g/L.
Plate Culturing
Fresh samples were directly analyzed by culture-dependent techniques at each fermentation stage (beginning, middle and end of fermentation). The total yeast populations were enumerated on plates with YPD medium. The Wallerstein Laboratory nutrient agar (WL; Oxoid, England) is useful to quantify and identify wine microorganisms and was used to discriminate between the used yeast species by colony morphology and color (Pallmann et al., 2001).
DNA Extraction
Cell pellets from 1 mL of samples at each fermentation stage (beginning, middle and end of fermentation) were collected by centrifugation after washing with sterile water and kept at −80°C for further culture-independent analysis by and PCR-DGGE. DNA cell pellets were extracted according to Hierro et al. (2007). The concentration and purity of DNA was determined using a NanoDrop 1000 spectrophotometer (Thermo Fisher Scientific, Wilmington, DE, U.S.A.).
PCR-DGGE Analysis
The PCR reactions were performed using a Gene Amp PCR System 2720 (Applied Biosystems, USA) with Primers U1GC and U2 (Meroth et al., 2003). The DGGE procedures followed the description in Andorrà et al. (2008) with a modified DGGE gel using a denaturing gradient from 35 to 55% urea and formamide. A marker prepared with the PCR products of each individual yeast species was included in the DGGE gels for migration comparison and yeasts identifications.
Statistical Analysis
Fermentation kinetics variables (residual sugar, acetic acid concentration, R, t10, t50, and t75) have been used to construct a dissimilarity matrix based on Euclidean distance between their values. All these variables have been used to construct a dissimilarity matrix based on the Euclidean distance between their values. ANOSIM (an analog of univariate ANOVA which tests for differences between groups of samples) was run in PRIMER v6 (Clarke and Gorley, 2006) to determine significant differences between the different fermentations among the main experimental factors (sugar and nitrogen content, residual sugar, S. cerevisiae inoculation time). Principal coordinate analysis (PCoA) was used to summarize and visualize the different fermentations under each Nitrogen condition respect the final residual sugar (as an estimator of fermentation success). Pearson correlation analysis were performed between the residual sugar and the rest of parameters.
Results and Discussion
Effect of Nutrients Concentration on Fermentation Kinetics
Fermentations with optimal nitrogen concentration (300N-240S and 300N-200S) were all completed in 5–13 days, with the fermentations under excess of sugar (300N-240S) the slower ones (Table 1) (Figure S1). On the other hand, most of the fermentations performed under limiting nitrogen concentration (100N-240S and 100N-200S) got stuck (Table 1). From these results we observed that the nitrogen content had a stronger effect than the sugar concentration in yeast metabolism and affected the fermentation kinetics. Also, ANOSIM results showed that the fermentations under different nitrogen concentration (100N and 300N) were significantly different (Table 2), i.e., their kinetics parameters (R, t10, t50, t75, residual sugar and acetic acid) were different for each nitrogen condition. However, sugar concentration (200S and 240S) did not result in significant differences (Table 2).
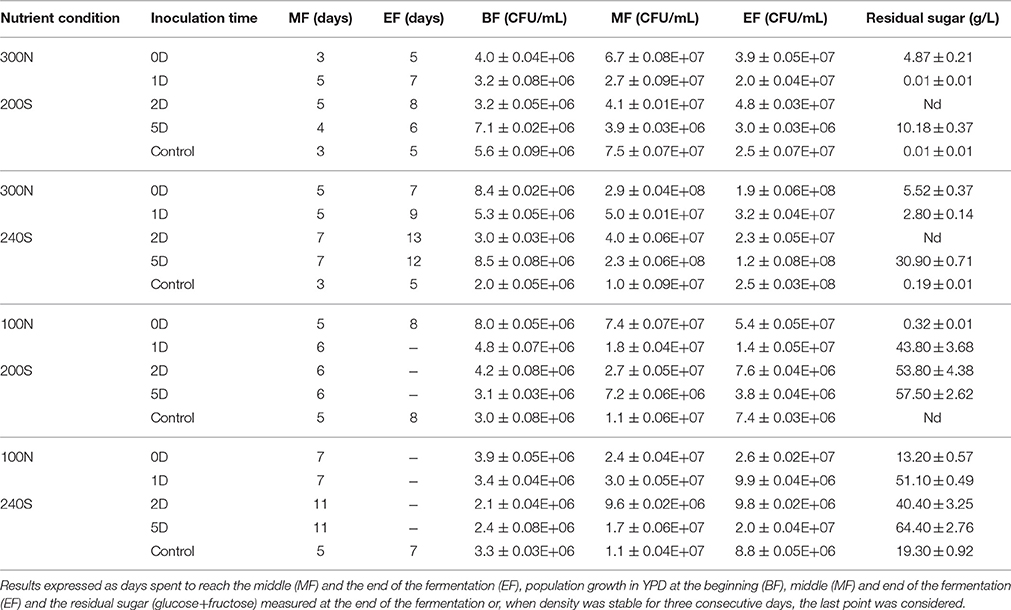
Table 1. Evolution of the different fermentations (0D, co-inoculated fermentation; 1D, inoculation of S. cerevisiae at 24 h; 2D, inoculation of S. cerevisiae at 48 h; 5D, inoculation of S. cerevisiae at 5 days; and Control, only S. cerevisiae) under four nutrient conditions (300N-200S, 300N-240S, 100N-200S, and 100N-240S).
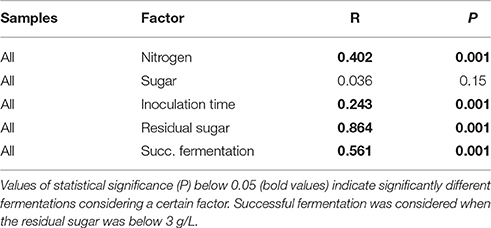
Table 2. ANOSIM of the different factors effect on the fermentations based on a dissimilarity matrix calculated by the Euclidian distance of the kinetic parameters.
It has been previously described that nitrogen concentration below 140 mg/L are limiting to growth and result in a decrease of the fermentation rate by S. cerevisiae, an increase the risk of sluggish and stuck fermentation as well as an increase in residual sugars (Bell and Henschcke, 2005; Martínez-Moreno et al., 2012; Tesnière et al., 2015). However, according to our results, both 100N control fermentations inoculated just with S. cerevisiae were able to be completed in 7–8 days (Table 1). This could be explained by the different nitrogen requirements of the selected S. cerevisiae strain, autochthonous yeast that was grown in YPD before its inoculation in the synthetic must, thus allowing inner nitrogen accumulation. Mixed fermentations with the four yeast species, with expected different nitrogen and sugar requirements, got generally stuck under 100N and it would be interesting to investigate the required addition of nitrogen to complete those fermentations (Table 1) (Figure 1). This could be due to the known higher nitrogen requirements of non-Saccharomyces yeast (Andorrà et al., 2010, 2012). The consumption of the available nitrogen by the non-Saccharomyces yeasts and the delay in S. cerevisiae inoculation could increase the risk of stuck and sluggish fermentations (Medina et al., 2012).
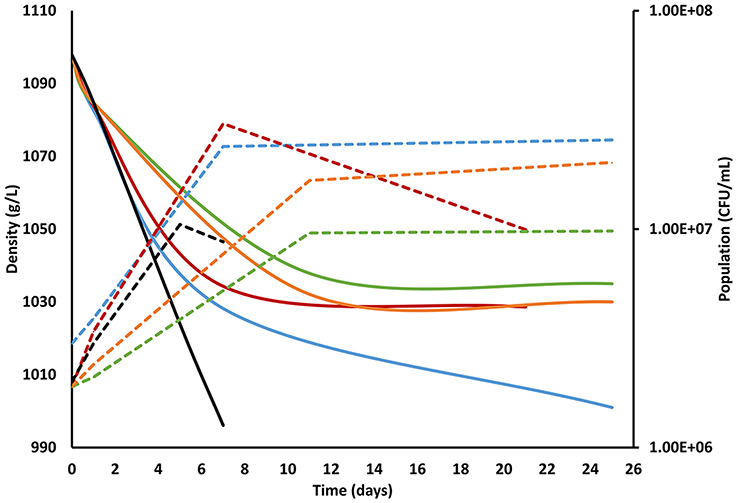
Figure 1. Fermentation kinetics of the different inoculation strategies performed under 100N-240S nutrient conditions. The solid line shows the evolution of the fermentation measured by density (g/L) and the dotted line assessed by plate culturing in YPD (CFU/mL). The line color corresponds to each fermentation strategy: blue, co-inoculated fermentation; red, inoculation of S. cerevisiae at 24 h; green, inoculation of S. cerevisiae at 48 h; orange, inoculation of S. cerevisiae at 5 days, and black; control fermentation with only S. cerevisiae. Standard deviations were always lower than 10% and have been avoided in the figure for clarity.
High-sugar must (240S) was indeed expected to result in longer fermentations since it has been previously described that high sugar concentration slows down yeasts growth and the progress of fermentation (Riberéau-Gayon et al., 2006). It has been suggested that the main stress factor under high sugar conditions would be the ethanol content and not the sugar osmotic pressure (Nishino et al., 1985; Mauricio and Salmon, 1992). Bisson and Butzke (2000) observed that a nitrogen supplementation could be appropriate in fermentations with S. cerevisiae under 240 g/L of sugar to complete the fermentation and Martínez-Moreno et al. (2012) suggested that 160 mg/L of nitrogen would be the minimum requirement at this sugar concentration. Conversely, other authors demonstrated in S. cerevisiae that the addition of nitrogen in high-sugar musts did not necessarily lead to complete fermentations even taking into account the nitrogen utilization requirements by different strains of S. cerevisiae (Martínez-Moreno et al., 2012; Childs et al., 2015). According to our results, a supplementation of 300 mg/L of nitrogen was enough to finish all the 240S fermentations.
Effect of Sequential Inoculation of S. cerevisiae over Fermentation Kinetics
The inoculation time of S. cerevisiae have a significant impact over the fermentation kinetics parameters (Table 1), especially within each nitrogen concentration (Figures 2A,B). Control fermentations performed just with S. cerevisiae were the fastest to complete (5–8 days) under any of the nutrient conditions and only matched by co-inoculation (0D) under optimal sugar concentrations (300N-200S and 100N-200S).
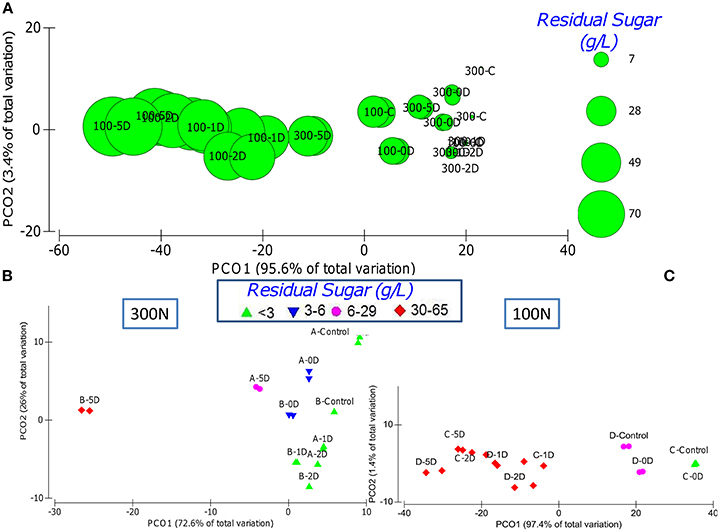
Figure 2. PCA graphs displaying the dissimilarity between the different fermentations taking into account the kinetics parameters R, t10, t50, t75, acetic acid and residual sugar. (A) PCA representing all the fermentations respects the residual sugar content (proportional to the bubbles size) with the clustering of most of 100N fermentations at the left and most of the 300N fermentations at the right. PCA of the 300N (B) and 100N (C) fermentations respect the residual sugar where the initial sugar concentration is indicated by A or C (200S) and B or D (240S), Control represent the inoculations with only S. cerevisiae and the inoculation time of S. cerevisiae is indicated by 0D, 1D, 2D, and 5D.
Under optimal nitrogen concentration (300N), the sequential inoculation of S. cerevisiae from 24 h onward had different effect over the fermentation kinetics depending on the sugar concentration. However, the earlier inoculation of S. cerevisiae did not imply that fermentation finished faster (Table 1). For example, it is interesting to observe that fermentations where S. cerevisiae was inoculated at 24–48 h (1D, 2D) under a nitrogen concentration of 300 mg/L took longer to finish than those where S. cerevisiae was added 5 days after the beginning of the fermentation (Table 1; Figure S1). This result was also reflected in the separation of these samples from the rest of the 300N samples as a consequence of the differences in the fermentation kinetics parameters (Table 2, Figure 2B). A possible explanation could be that at day 5, when S. cerevisiae was inoculated, half of the fermentation had already been spent and the viable non-Saccharomyces yeast were decreasing (Table 1, Figure 3) which meant less competition for nutrients by S. cerevisiae. Additionally, the death and the autolysis of non-Saccharomyces yeast could result in an extra nitrogen source for S. cerevisiae (Hernawan and Fleet, 1995).
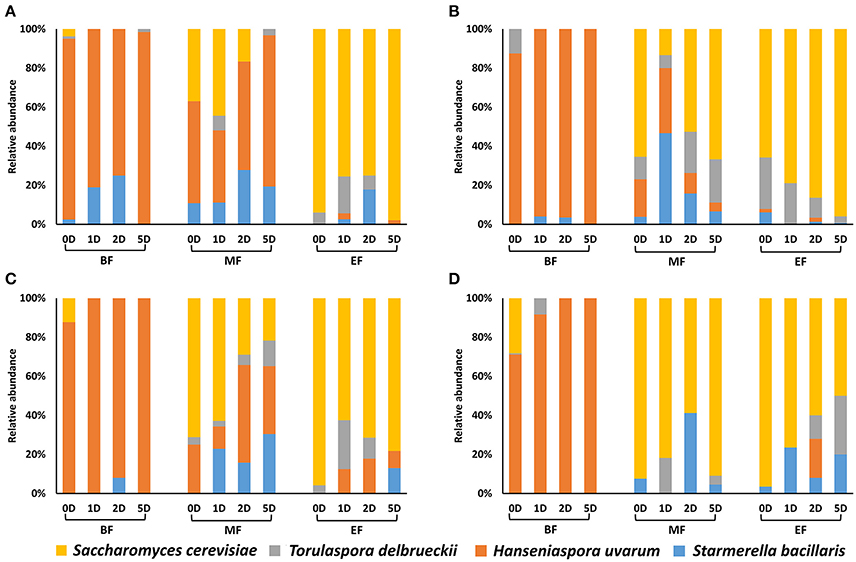
Figure 3. Yeast population dynamics at the beginning (BF), middle (MF) and end of the fermentation (EF) under four different nutrient conditions, (A) 300N-200S, (B) 300N-240S, (C) 100N-200S, and (D) 100N-240S. The fermentations strategies were: 0D, co-inoculated fermentation; 1D, inoculation of S. cerevisiae at 24 h; 2D, inoculation of S. cerevisiae at 48 h; and 5D, inoculation of S. cerevisiae at 5 days.
Under limiting nitrogen concentration (100N), as stated in the previous section, most of the fermentations got stuck and have a high residual sugar (Table 1, Figures 2A,C). However, control fermentations were able to finish and, under optimal sugar conditions, the co-inoculation of S. cerevisiae and the three non-Saccharomyces allowed the fermentation to complete as well (Table 1). These results allowed the separation of these fermentations from the rest fermentations on the PCA analysis taking into account all the kinetics parameters (Figure 2C). Some authors have proved that co-inoculated fermentations with one or two non-Saccharomyces yeast species are a good strategy to ensure S. cerevisiae development and the fermentation process (Andorrà et al., 2010; Medina et al., 2012). According to our results, the time of S. cerevisiae inoculation acquired more importance under limiting nitrogen content as a consequence of nutrient consumption by the different yeasts species. Medina et al. (2012) demonstrated that an increase of the inoculum size of non-Saccharomyces yeasts or the inoculation of S. cerevisiae after 24 h decreases the growth of the latter and slowed the fermentation rate of the mixed fermentation as a consequence of the nutrient consumption by non-Saccharomyces yeasts.
Thus, a limiting nitrogen concentration together with a sequential inoculation of S. cerevisiae later than 48 h involves nitrogen consumption by non-Saccharomyces yeasts that limits S. cerevisiae development and the fermentation progress.
Yeast Dynamics by Plate Culturing and PCR-DGGE
Both culture dependent and independent techniques (plate culturing and PCR-DGGE) were used to follow yeast dynamics at each fermentation stage (beginning, the middle and the end of the fermentation). The differential morphology of the colonies on WL medium of the four selected yeast species allowed us to calculate the proportion of each cultivable yeast species at each fermentation stage (Figure 3). Moreover, to compare with molecular analysis results thus avoiding underestimation by the presence of viable but non cultivable (VBNC) yeast, we performed PCR-DGGE analysis of the extracted DNA at each fermentation stage using general yeast primers (Meroth et al., 2003).
Figure 3 and Table 3 show that the results obtained by these two techniques were usually comparable. However, as previous studies have reported (Andorrà et al., 2008, 2010) plate culturing proved to be more sensitive than using PCR-DGGE when the proportion of a specific species was very low at some fermentation stages. For example, by DGGE we could not detect S. bacillaris and T. delbrueckii in most of the fermentation stages while a little proportion of these species was recovered by plate-culturing technique in almost all fermentation stages and conditions. However, under nutrient limiting and sugar excess conditions (100N-240S) the DGGE technique was more efficient and we were able to detect higher yeast diversity maybe as a consequence of the loss of yeast cultivability under these extreme conditions (Table 3).
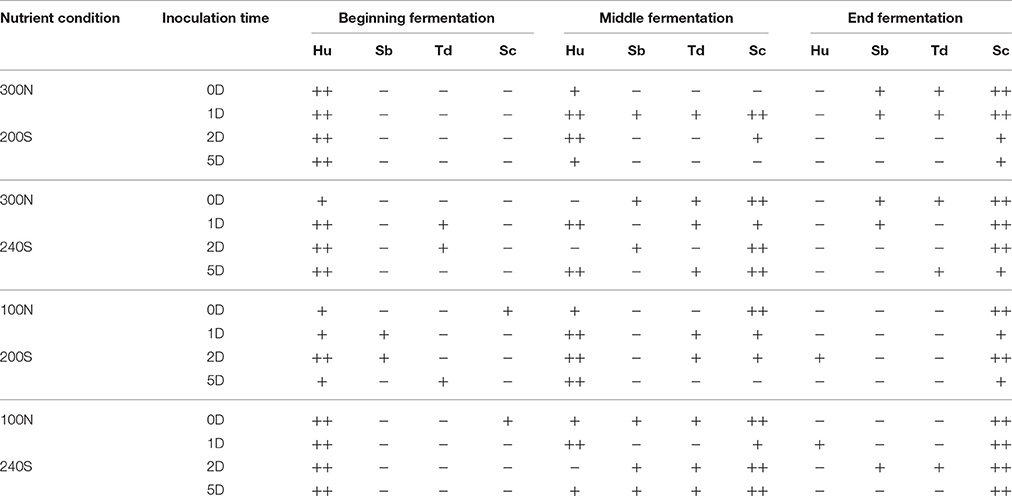
Table 3. Results of the DGGE-PCR for H. uvarum (Hu), S. bacillaris (Sb), T. delbrueckii (Td) and S. cerevisiae (Sc) expressed as “++” (the intensity of the band detected by DGGE gel was high), “+” (the intensity of the band detected by DGGE gel was weak) and “−” (no band was detected by DGGE gel).
The main yeast species at the beginning of the fermentation (24 h) in all cases was H. uvarum while, at the end of the fermentation S. cerevisiae took over. We used a higher inoculum of H. uvarum compared to the other non-Saccharomyces, as occurs on natural must from the Priorat DOQ region (Wang et al., 2016), and this would explain the H. uvarum high proportion at the beginning of the fermentation respect to S. bacillaris and T. delbrueckii. In this sense, our results are similar to those obtained in spontaneous grape fermentations where H. uvarum was in great proportion at the first stages of the fermentation in Priorat area (Constantí et al., 1998; Torija et al., 2001; Wang et al., 2016).
It is interesting that a low proportion of S. cerevisiae was recovered at the beginning of all the fermentations even when it was co-inoculated with the non-Saccharomyces even taking into account that its inoculum size was similar to that of H. uvarum. Previous studies have reported that the initial growth of H. uvarum retarded the growth of S. cerevisiae (Herraiz et al., 1990) which could be an explanation of this effect.
In the middle of the fermentation the yeast species proportion deeply varies depending on the nutrients and the time of inoculation of S. cerevisiae (Figure 3). For example, under optimal nutrient conditions (300N-200S) at the mid fermentation, the non-Saccharomyces yeasts overgrew S. cerevisiae that was just more abundant at inoculation 0D or 1D (37 and 44.4%, respectively). Medina et al. (2012) noticed a negative effect of non-Saccharomyces yeast on nutrient availability for S. cerevisiae reducing its ability for grow especially when it was sequentially inoculated. Interestingly, when they added nitrogen supplementation the fermentation rate and the proportion of S. cerevisiae increased, this effect was more prominent when they added a supplement of YAN and vitamin. This YAN consumption by non-Saccharomyces yeasts would explain the low imposition of S. cerevisiae over the different fermentations at the middle of the fermentation, specifically when S. cerevisiae was inoculated 24 h and after. However, under excess of sugar (300N-240S), S. cerevisiae was the most frequently recovered at 0D, 2D and 5D (52.6–66.6%) being in low proportion at 1D when the non-Saccharomyces yeasts (mainly S. bacilaris) represented more than 80%. Thus, at 300N-240S S. cerevisiae was able to overtake non-Saccharomyces yeasts at the middle of the fermentation except when it was inoculated at 24 h although the non-Saccharomyces yeasts were present in the mid fermentation under any of the conditions contemplated in the present study. We also observed that the excess of sugar (240S) affected negatively to H. uvarum respect the 200S conditions. Under nitrogen limitation (100N-200S/240S), we recovered higher proportion of S. cerevisiae at the middle of the fermentation than under the respective 300N fermentations.
At the end of the fermentation, S. cerevisiae was the most abundant yeast under any of the analyzed conditions, though S. bacillaris and T. delbrueckii were also present and generally in higher proportion than H. uvarum. In a previous study, Ciani et al. (2006) proved the high persistence of H. uvarum in mixed fermentations with S. cerevisiae under excess of sugar (270 g/L) and low temperature (15°C), which is in accordance with our results. Wang et al. (2016) demonstrated that T. delbrueckii and S. bacillaris where able to maintain its cultivability longer than H. uvarum when they were inoculated with S. cerevisiae. Furthermore, many interactions between non-Saccharomyces yeasts and S. cerevisiae can occur in the mixed fermentations under the studied conditions: yeast-yeast cell contact, antimicrobial compounds release or competition for substrate (Ciani and Comitini, 2015). It has been described that S. cerevisiae produce metabolites that negatively affect non-Saccharomyces yeasts (Pretorius, 2000; Pérez-Nevado et al., 2006; Wang et al., 2016). So, the effect of these metabolites together with the chemical changes on the medium could provide an explanation for the decrease of H. uvarum and the persistence and increase of T. delbrueckii and S. bacillaris along the fermentation, because the sensibility to these antimicrobial compounds is species and strain specific (Wang et al., 2016).
Fermentation Products
Total residual sugars were evaluated at the end of the fermentation or, in the case of stuck fermentations, at the last considered point with stable density for three consecutive days, using an enzymatic kit as described in Section Density, Acetic Acid, and Sugar Measurements. Residual sugars were significantly correlated with all the kinetic parameters considered except with the initial sugar concentration (Table S2).
Successful fermentations with residual sugar below 3 g/L where just those performed under optimal nitrogen concentration inoculated with S. cerevisiae at 48 H or before and under limiting nitrogen concentration when S. cerevisiae was the only yeast inoculated or when the non-Saccharomyces yeasts where co-inoculated (Figures 2B,C). These successful fermentations had kinetics parameters statistically different from the rest of fermentations tested (Table 2).
Fermentations performed under suitable nitrogen content (300N-200S/240S) presented the lowest residual sugars when they were sequentially inoculated at 24 or 48 h (Table 1). Unexpectedly, co-inoculated fermentations had a final sugar content between 4 and 6 g/l which could be explained by the high persistence of non-Saccharomyces yeast (Figure 3) that have been described as low fermentative yeasts (Pretorius, 2000). Besides, when S. cerevisiae was added after 5 days, sugar content was quite high as a consequence of the S. cerevisiae nutrient deprivation by non-Saccharomyces yeasts, which compromised its development and metabolic capacities (Andorrà et al., 2010; Medina et al., 2012).
On the other hand, under nitrogen limiting conditions (100N-200S/240S) the residual sugar concentration was very high at all fermentation stages as a consequence of the stuck fermentations resulting from the nutrient limitation (Bell and Henschcke, 2005) and just the co-inoculated fermentations (100N 200S) that completed the fermentation showed a lower residual sugar (Table 1).
Conclusions
Nowadays, the use of mixed fermentations represents a powerful tool as a consequence of the combination of the positive abilities of non-Saccharomyces yeasts with S. cerevisiae. Despite this fact, nutrient must conditions and the time of the inoculation of S. cerevisiae can determine an adequate fermentation performance. We have demonstrated the negative impact of limiting nitrogen musts on mixed fermentation resulting in stuck fermentations with higher significance than sugar concentration. However, an excess of sugar must slowed down the fermentation rate. Furthermore, the best inoculation time of S. cerevisiae, under adequate nitrogen concentration would be before 48 h to ensure the completion of the fermentation due to the nitrogen consumption by non-Saccharomyces. However, inoculations before 24 h low the proportion of non-Saccharomyces yeasts that could contributed to the complexity of the wines. On the other hand, under nitrogen-limiting conditions, S. cerevisiae should be co-inoculated to ensure the fermentation process and the nitrogen availability for this yeast.
Author Contributions
JL performed part of the experiments, analyzed the results and draft the manuscript. MM performed part of the experiments. AM and MP conceived the study and participated in its design and coordination and draft the manuscript. All authors read and approved the final manuscript.
Conflict of Interest Statement
The authors declare that the research was conducted in the absence of any commercial or financial relationships that could be construed as a potential conflict of interest.
Acknowledgments
This study was supported by WILDWINE EU Project (grant agreement 315065) and by a project from the Spanish Government AGL2015-73273-JIN (AEI/FEDER/EU). JL was supported by the project AEI-010300-2015-55.
Supplementary Material
The Supplementary Material for this article can be found online at: http://journal.frontiersin.org/article/10.3389/fmicb.2016.01959/full#supplementary-material
References
Andorrà, I., Berradre, M., Mas, A., Esteve-Zarzoso, B., and Guillamón, J. M. (2012). Effect of mixed culture fermentations on yeast populations and aroma profile. LWT-Food Sci. Technol. 49, 8–13. doi: 10.1016/j.lwt.2012.04.008
Andorrà, I., Berradre, M., Rozés, N., Mas, A., Guillamón, J. M., and Esteve-Zarzoso, B. (2010). Effect of pure and mixed cultures of the main yeast species on grape must fermentations. Eur. Food Res. Technol. 231, 215–224. doi: 10.1007/s00217-010-1272-0
Andorrà, I., Landi, S., Mas, A., Guillamón, J. M., and Esteve-Zarzoso, B. (2008). Effect of enological practices on microbial populations using culture-independent techniques. Food Microbiol. 25, 849–856. doi: 10.1016/j.fm.2008.05.005
Bell, S. J., and Henschcke, P. A. (2005). Implications of nitrogen in grapes, fermentation and wine. Aust. J. Grape Wine R. 11, 242–295. doi: 10.1111/j.1755-0238.2005.tb00028.x
Beltran, G., Esteve-Zarzoso, B., Rozès, N., Mas, A., and Guillamón, J. M. (2005). Influence of the timing of nitrogen additions during wine fermentations on the fermentation kinetics and nitrogen consumption. J. Agr. Food Chem. 53, 996–1002. doi: 10.1021/jf0487001
Bisson, L. F., and Butzke, C. E. (2000). Diagnosis and rectification of stuck and sluggish fermentations. Am. J. Enol. Vitic. 51, 168–177.
Childs, B. C., Bohlscheid, J. C., and Edwards, C. G. (2015). Impact of available nitrogen and sugar concentration in musts on alcoholic fermentation and subsequent wine spoilage by Brettanomyces bruxellensis. Food Microbiol. 46, 604–609. doi: 10.1016/j.fm.2014.10.006
Ciani, M., Beco, L., and Comitini, F. (2006). Fermentation behaviour and metabolic interactions of multistarter wine yeast fermentations. Int. J. Food Microbiol. 108, 239–245. doi: 10.1016/j.ijfoodmicro.2005.11.012
Ciani, M., and Comitini, F. (2011). Non-Saccharomyces wine yeasts have a promising role in biotechnological approaches to winemaking. Ann. Microbiol. 61, 25–32. doi: 10.1007/s13213-010-0069-5
Ciani, M., and Comitini, F. (2015). Yeast interactions in multi-starter wine fermentation. Curr. Opin. Food Sci. 1, 1–6. doi: 10.1016/j.cofs.2014.07.001
Ciani, M., Comitini, F., Manazzu, I., and Domizio, P. (2010). Controlled mixed culture fermentation: a new perspective on the use of non-Saccharomyces yeasts in winemaking. FEMS Yeast Res. 10, 123–133. doi: 10.1111/j.1567-1364.2009.00579.x
Clarke, K., and Gorley, R. (2006). PRIMER v6: User Manual/Tutorial. Plymouth: Plymouth Marine Laboratory.
Constantí, M., Reguant, C., Poblet, M., Zamora, F., Mas, A., and Guillamón, J. M. (1998). Molecular analysis of yeast population dynamics: effect of sulphur dioxide and inoculum on must fermentation. Int. J. Food Microbiol. 41, 169–175. doi: 10.1016/S0168-1605(98)00041-5
Duarte, F. L., Pimentel, N. H., Teixeira, A., and Fonseca, A. (2012). Saccharomyces bacillaris is not a synonym of Candida stellata: reinstatement as Starmerella bacillaris comb. nov. A Van Leeuw. J. Microb. 102, 653–658. doi: 10.1007/s10482-012-9762-7
Fleet, G. H. (2008). Wine yeasts for the future. FEMS Yeast Res. 8, 979–995. doi: 10.1111/j.1567-1364.2008.00427.x
Hernawan, T., and Fleet, G. (1995). Chemical and cytological changes during the autolysis of the yeasts. J. Ind. Microbiol. 14, 440–450. doi: 10.1007/BF01573955
Herraiz, T., Reglero, G., Herraiz, M., Martin-Alvarez, P. J., and Cabezudo, M. D. (1990). The influence of the yeast and type of culture on the volatile composition of wines fermented without sulfur dioxide. Am. J. Enol. Vitic. 41, 313–318.
Hierro, N., Esteve-Zarzoso, B., Mas, A., and Guillamón, J. M. (2007). Monitoring of Saccharomyces and Hanseniaspora populations during alcoholic fermentation by real-time quantitative PCR. FEMS Yeast Res. 7, 1340–1349. doi: 10.1111/j.1567-1364.2007.00304.x
Jolly, N. P., Varela, C., and Pretorius, I. S. (2014). Not your ordinary yeast: non-Saccharomyces yeasts in wine production uncovered. FEMS Yeast Res. 14, 215–237. doi: 10.1111/1567-1364.12111
Martínez-Moreno, R., Morales, P., Gonzalez, R., Mas, A., and Beltran, G. (2012). Biomass Production and alcoholic fermentation performance of Saccharomyces cerevisiae as a function of nitrogen source. FEMS Yeast Res. 12, 477–482. doi: 10.1111/j.1567-1364.2012.00802.x
Mas, A., Padilla, B., Esteve-Zarzoso, B., Beltran, G., Reguant, C., and Bordons, A. (2016). Taking advantage of natural biodiversity for wine making: the WILDWINE project. Agric. Agric. Sci. Procedia 8, 4–9. doi: 10.1016/j.aaspro.2016.02.002
Mauricio, J. C., and Salmon, J. M. (1992). Apparent loss of sugar transport activity in Saccharomyces cerevisiae may mainly account for maximum ethanol production during alcoholic fermentation. Biotechnol. Lett. 14, 577–582. doi: 10.1007/BF01023944
Medina, K., Boido, E., Dellacassa, E., and Carrau, F. (2012). Growth of non-Saccharomyces yeasts affects nutrient availability for Saccharomyces cerevisiae during wine fermentation. Int. J. Food Microbiol. 157, 245–250. doi: 10.1016/j.ijfoodmicro.2012.05.012
Meroth, C. B., Hammes, W. P., and Hertel, C. (2003). Identification and population dynamics of yeasts in sourdough fermentation processes by PCR-denaturing gradient gel electrophoresis. Appl. Environ. Microb. 69, 7453–7461. doi: 10.1128/AEM.69.12.7453-7461.2003
Mira de Orduña, R. (2010). Climate change associated effects on grape and wine quality and production. Food Res. Int. 43, 1844–1855. doi: 10.1016/j.foodres.2010.05.001
Nishino, H., Miyazaki, S., and Tohjo, K. (1985). Effect of osmotic pressure on the growth rate and fermentation activity of wine yeasts. Am. J. Enol. Vitic. 36, 170–174.
Padilla, B., García-Fernández, D., González, B., Izidoro, I., Esteve-Zarzoso, B., Beltran, G., et al. (2016b). Yeast biodiversity from DOQ Priorat uninoculated fermentations. Front. Microbiol. 7:930. doi: 10.3389/fmicb.2016.00930
Padilla, B., Gil, J. V., and Manzanares, P. (2016a). Past and future of non-Saccharomyces yeasts: from spoilage microorganisms to biotechnological tools for improving wine aroma complexity. Front. Microbiol. 7:411. doi: 10.3389/fmicb.2016.00411
Pallmann, L. C., Brown, A. J., Olineka, L. T., Cocolin, L., Mills, A. D., and Bisson, F. L. (2001). Use of WL medium to profile native flora fermentations. Am. J. Enol. Vitic. 52, 198–203.
Pérez-Nevado, F., Albergaria, H., Hogg, T., and Girio, F. (2006). Cellular death of two non-Saccharomcyes wine-related yeasts during mixed fermentations with Saccharomcyes cerevisiae. Int. J. Food Microbiol. 108, 336–345. doi: 10.1016/j.ijfoodmicro.2005.12.012
Pretorius, I. S. (2000). Tailoring wine yeast for the new millennium: novel approaches to the ancient art of winemaking. Yeast 16, 675–729. doi: 10.1002/1097-0061(20000615)16:8<675::AID-YEA585>3.0.CO;2-B
Riberéau-Gayon, P., Dubordieu, D., Donèche, B., and Lonvaud, A. (2006). Handbook of Enology. Vol. 1. The Microbiology of Wine and Vinifications, 2nd Edn. France: John Wiley and Sons, Ltd.
Riou, C., Nicaud, J. M., Barre, P., and Gaillardin, C. (1997). Stationary-Phase gene expression in Saccharomyces cerevisiae during wine fermentation. Yeast 13, 903–915. doi: 10.1002/(SICI)1097-0061(199708)13:10<903::AID-YEA145>3.0.CO;2-1
Tesnière, C., Brice, C., and Blondin, B. (2015). Responses of Saccharomyces cerevisiae to nitrogen starvation in wine alcoholic fermentation. Appl. Microbiol. Biotechnol. 99, 7025–7034. doi: 10.1007/s00253-015-6810-z
Torija, M. J., Rozès, N., Poblet, M., Guillamón, J. M., and Mas, A. (2001). Yeast population dinamics in spontaneous fermentations: comparison between two different wine producing areas overa period of three years. Antonie Van Leeuwenhoek 79, 345–352. doi: 10.1023/A:1012027718701
Viana, F., Belloch, C., Vallés, S., and Manzanares, P. (2011). Monitoring a mixed starter of Hanseniaspora vineae–Saccharomyces cerevisiae in natural must: impact on 2-phenylethyl acetate production. Int. J. Food Microbiol. 151, 235–240. doi: 10.1016/j.ijfoodmicro.2011.09.005
Wang, C., García-Fernández, D., Esteve-Zarzoso, B., and Mas, A. (2015). Fungal diversity in grape must and wine fermentation assessed by massive sequencing, quantitative PCR and DGGE. Front. Microbiol. 6:1156. doi: 10.3389/fmicb.2015.01156
Wang, C., Mas, A., and Esteve-Zarzoso, B. (2016). The Interaction between Saccharomyces cerevisiae and Non-Saccharomyces yeast during alcoholic fermentation is species and strain specific. Front. Microbiol. 7:502. doi: 10.3389/fmicb.2016.00502
Keywords: Torulaspora, Hanseniaspora, Starmarella, fermentation, wine
Citation: Lleixà J, Manzano M, Mas A and Portillo MC (2016) Saccharomyces and non-Saccharomyces Competition during Microvinification under Different Sugar and Nitrogen Conditions. Front. Microbiol. 7:1959. doi: 10.3389/fmicb.2016.01959
Received: 28 September 2016; Accepted: 22 November 2016;
Published: 05 December 2016.
Edited by:
Gustavo Cordero-Bueso, University of Cádiz, SpainReviewed by:
Maurizio Ciani, Marche Polytechnic University, ItalyMathabatha Evodia Setati, Stellenbosch University, South Africa
Copyright © 2016 Lleixà, Manzano, Mas and Portillo. This is an open-access article distributed under the terms of the Creative Commons Attribution License (CC BY). The use, distribution or reproduction in other forums is permitted, provided the original author(s) or licensor are credited and that the original publication in this journal is cited, in accordance with accepted academic practice. No use, distribution or reproduction is permitted which does not comply with these terms.
*Correspondence: Albert Mas, albert.mas@urv.cat
María del C. Portillo, carmen.portillo@urv.cat