Adverse associations between visceral adiposity, brain structure, and cognitive performance in healthy elderly
- 1 Cognitive Neuroscience Laboratory, Neuroscience and Behavioural Disorders Program, Duke–National University of Singapore Graduate Medical School, Singapore
- 2 School of Computer Engineering, Nanyang Technological University, Singapore
- 3 Yong Loo Lin School of Medicine, National University of Singapore, Singapore
The link between central adiposity and cognition has been established by indirect measures such as body mass index (BMI) or waist–hip ratio. Magnetic resonance imaging (MRI) quantification of central abdominal fat has been linked to elevated risk of cardiovascular and cerebro-vascular disease. However it is not known how quantification of visceral fat correlates with cognitive performance and measures of brain structure. We filled this gap by characterizing the relationships between MRI measures of abdominal adiposity, brain morphometry, and cognition, in healthy elderly. Methods: A total of 184 healthy community dwelling elderly subjects without cognitive impairment participated in this study. Anthropometric and biochemical markers of cardiovascular risk, neuropsychological measurements as well as MRI of the brain and abdomen fat were obtained. Abdominal images were segmented into subcutaneous adipose tissue and visceral adipose tissue (VAT) adipose tissue compartments. Brain MRI measures were analyzed quantitatively to determine total brain volume, hippocampal volume, ventricular volume, and cortical thickness. Results: VAT showed negative association with verbal memory (r = 0.21, p = 0.005) and attention (r = 0.18, p = 0.01). Higher VAT was associated with lower hippocampal volume (F = 5.39, p = 0.02) and larger ventricular volume (F = 6.07, p = 0.02). The participants in the upper quartile of VAT had the lowest hippocampal volume even after adjusting for age, gender, hypertension, and BMI (b = −0.28, p = 0.005). There was a significant age by VAT interaction for cortical thickness in the left prefrontal region. Conclusion: In healthy older adults, elevated VAT is associated with negative effects on cognition, and brain morphometry.
Introduction
Excessive accumulation of adipose tissue is associated with elevated risk of diabetes mellitus, cardiovascular disease, cerebro-vascular disease (Rexrode et al., 1998; Huang et al., 2005; Kizer et al., 2011), and dementia (Gustafson et al., 2003; Whitmer et al., 2008). Recent studies have shown that obesity has adverse effects on brain structure (Gunstad et al., 2008; Raji et al., 2010) and cognitive performance in non-demented persons (Elias et al., 2003; Wolf et al., 2007). Most of these associations have been determined by estimating adiposity using anthropometric measures, the most common being body mass index (BMI).
Although BMI is a convenient and economical means of estimating adiposity, it is imprecise. Furthermore, its relationship with adiposity is affected by ethnicity and body type differences (Wang et al., 1994). East Asians have elevated risk of adverse metabolic and cardiovascular outcomes at lower BMI values than Caucasians (Deurenberg-Yap et al., 2001). Critically, BMI fails to account for the distribution of the excess adipose tissue. Waist measurement focuses on abdominal fat, but it is not measured in a standardized manner (Bosy-Westphal et al., 2010) and conflates subcutaneous adipose tissue (SAT) and visceral adipose tissue (VAT) measurements (Poirier and Despres, 2003).
Visceral fat has emerged as the key pathogenic depot (Wajchenberg, 2000) having stronger association with multiple cardio-metabolic risk factors (Liu et al., 2010). For example, older persons with normal BMI but high visceral fat volume are at higher risk of adverse cardio-metabolic outcomes (Nomura et al., 2010). Additionally, a significant inverse association between VAT with total brain volume independent of the effect of BMI has been reported in healthy middle-aged participants (Debette et al., 2010). Against these findings, stronger inverse correlations between SAT as well as total fat mass on cognitive performance have been reported (Kanaya et al., 2009). Hence, it is somewhat unresolved whether there is incremental value in measuring VAT as opposed to using conventional anthropometric measures.
To fill this gap in our knowledge, we studied the associations between magnetic resonance imaging (MRI) measures of abdominal adiposity, cognitive performance, and brain structure in healthy older adults aged between 55 and 90 years. We hypothesized that VAT would be more strongly associated with cognitive performance and brain structure than SAT, BMI, and waist circumference.
Materials and Methods
Participants
One hundred eighty-four ethnically Chinese volunteers from the Singapore-Longitudinal Aging Brain Study contributed to this report (Chee et al., 2009). This is a community-based study of healthy volunteers recruited using advertisements and word-of-mouth among members of “active aging” clubs. The National University of Singapore Institutional Review Board approved the study, and all participants provided informed consent prior to enrollment.
Participants did not have any known active medical conditions other than uncomplicated hypertension. Exclusion criteria included: (1) history of diabetes mellitus; (2) history of significant vascular events (i.e., myocardial infarction, stroke, or peripheral vascular disease); (3) history of malignant neoplasia of any form; (4) a history of cardiac, lung, liver, or kidney failure; (5) active or an inadequately treated thyroid disease; (6) active neurological or psychiatric conditions; (7) a history of head trauma with loss of consciousness; (8) a Mini-Mental State Examination (MMSE; Folstein et al., 1975) score <26; (9) a 15-point modified-Geriatric Depression Scale (GDS; Sheikh and Yesavage, 1986) score >9; or (10) a history of recreational drug use. Eighty-seven subjects were excluded for the following reasons; health problems (47), and MMSE score <26 (40). Note that a MMSE score of ≤23 has been recommended as a cut-off for screening dementia in a community-based studies from this population (Ng et al., 2007; Feng et al., 2010).
MRI Measures of Adiposity
Magnetic resonance imaging images were acquired using a 3-T Tim Trio scanner (Siemens, Erlangen, Germany), using a body coil and the VB15 version of the two-point Dixon sequence (TR = 4.20 ms, TE1 = 1.225 ms, TE2 = 2.45 ms, flip angle = 10°, bandwidth 850 Hz/Px, FOV 380 mm × 285 mm, 80 axial slices, 256 × 192 matrix, 2.5 mm slice thickness, 16 s acquisition time). The volumes were centered over L3.
An automated fat segmentation algorithm based on histogram thresholding and a graph-cut minimization algorithm (Boykov et al., 2001) was used to partition and estimate VAT and SAT volumes between L1 and L5 vertebrae (mean number of slices included for quantification = 66) and umbilical slice. The umbilical slice was defined as the most inferior axial slice where the umbilicus could be seen.
Brain Imaging
High-resolution images of the brain were acquired using a T1-weighted MP–RAGE sequence. There were 192 contiguous sagittal slices with the following scanning parameters: TR = 2530 ms, TI = 1200 ms, flip angle = 7°, FOV 256 mm × 256 mm, 256 × 256 matrix, isotropic voxel dimensions of 1.0 mm, 6 min 3 s acquisition time. Automated measurements of brain volumes were performed using FreeSurfer 4.5.0 (http://surfer.nmr.mgh.harvard.edu/). In the present work, we report total cerebral volume (TCV; excluding brain stem and cerebellum), hippocampal volume, and ventricular volume. All of these measures were corrected for estimated total intracranial volume (eTIV) before statistical analysis. 3D-FLAIR images obtained in the sagittal plane with 176 slices (TR = 6000 ms, TI = 2100 ms, TE = 414 ms, isotropic voxel dimensions of 1.0 mm, 7 min 44 s acquisition time) were used to measure the volume of white matter hyperintensities.
Estimated total intracranial volume: This was calculated using a validated method described elsewhere (Buckner et al., 2004). Briefly, an Atlas Scaling Factor (ASF) was determined based on the transformation matrix of atlas normalization for each individual subject. The ASF was then used to scale the TIV of the standardized atlas brain to compute a given subject’s TIV.
Head-size adjustment: All the volumetric measurements reported here showed significant gender differences before adjusting for head-size differences. The adjustment was performed on each volume of interest using the following analysis of covariance approach (Buckner et al., 2004).

where b is the slope of the linear regression between the brain volume of interest and TIV.
Total cerebral volume: This term refers to the total volume of cerebral gray matter, cerebral white matter, and subcortical structures excluding the cerebellar hemispheres. Constituent sub-volumes were summed together before adjusting for head-size differences.
Total ventricular volume: The total ventricular volume was defined as the total volume of lateral ventricles, third ventricle, and fourth ventricle. As ventricular measurements were positively skewed, we log-transformed the raw measurements before making adjustments for head-size differences.
Hippocampal volume: Adjustments for head-size differences were performed separately for left hippocampal, right hippocampal, and total hippocampal volumes.
Cortical thickness: We used the output of the surface pipeline, which modeled the cortical surface after detecting the gray–white boundary and then “growing” the pial surface of gray matter. The average distance between these two boundaries is the thickness of a vertex on the cortex.
Parcellated cortical structure volumes: The surface parcellation procedure in FreeSurfer automatically assigned a neuroanatomical label to each gray matter voxel. This allowed extraction of the gray matter volume for each cortical structure in a manner that has been validated against expert manual tracing (Desikan et al., 2006).
Neuropsychological Assessment
Participants were assessed between 10 a.m. and 2 p.m., by a trained researcher who worked under the supervision of a clinical neuropsychologist. Following the administration of the MMSE, a battery of 11 neuropsychological tests evaluating six cognitive domains – attention, verbal memory, visuo-spatial memory, executive functioning, speed of processing, and language was used. We minimized the effects of language and culture by using tests that contained items that were familiar to the study population. Attention was assessed using the Digit Span subtest from the Wechsler memory scale (WMS)-III (Wechsler, 1997) and a computerized version of a spatial span task. Verbal memory was evaluated using the Rey Auditory Verbal Learning Test (RAVLT; Lezak et al., 2004) and a verbal paired associates test. Visuo-spatial memory was evaluated using the visual reproduction (VR) subtest from the WMS-III and a visual paired associates test. Executive functioning was assessed using a categorical verbal fluency test (using categories of animals, vegetables, and fruits), the design fluency test (Delis et al., 2001), and the trail-making test B (Reitan and Wolfson, 1985). Speed of processing was assessed with the trail-making test A (Reitan and Wolfson, 1985) and the Symbol–Digit Modalities Test (SDMT; Smith, 1991). Language was evaluated using the object and action naming battery (Druks and Masterson, 2000). The tests were administered in either English or Mandarin according to the subject’s most proficient language. The individual test scores were standardized (z-transformed) and combined into six theoretically motivated composite scores (attention, verbal memory, visuo-spatial memory, speed of processing, executive function, and language) to limit the number of comparisons.
Related Data
Body mass index was defined as weight (in kilograms) divided by the square of height (in meters; Keys et al., 1972). Waist circumference was measured midway between the lowest rib and the iliac crest. Hypertension was categorized based on direct measurement (blood pressure >140/90), self-report, or medication use. Blood pressure was measured twice, 5 min apart with subjects seated using a sphygmomanometer and stethoscope. The average of two measures was used for analyses. Blood samples were drawn to test for ApoE genotype, and fasting glucose (Hixson and Vernier, 1990).
Statistical Analysis
Data analysis was conducted on 184 participants, after excluding three participants who had unsuitable MRI abdominal imaging. Descriptive data were expressed as mean (SD; Tables 1 and 2). Gender differences in the distribution of MR adiposity measures were analyzed using independent samples t-tests. Subsequently, we used Pearson’s correlation coefficient to determine the association between adiposity measures and various neuropsychological measures (attention, verbal memory, visuo-spatial memory, speed of processing, executive function, and language) and brain morphometry (TCV, hippocampal volume, ventricular volume, and white matter hyperintensities). Partial correlation coefficients were used to adjust for age and gender effects in these associations.
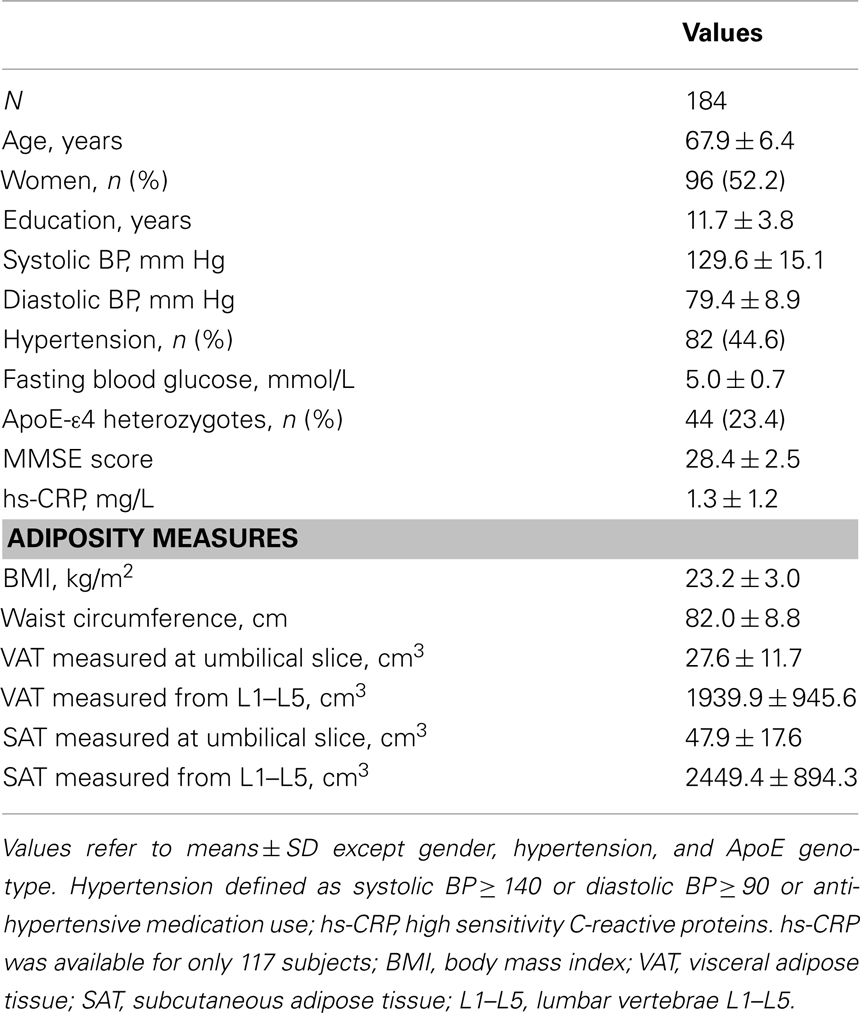
Table 1. Characteristics of the study sample.
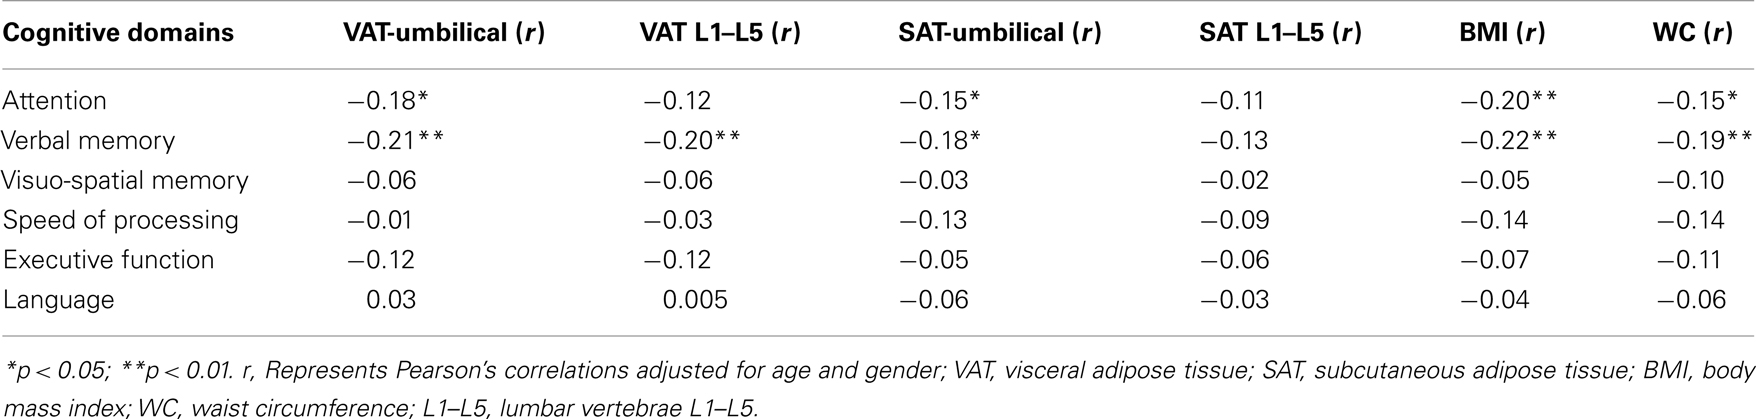
Table 2. Correlation between measures of adiposity and cognition performance.
We examined the unadjusted association between quartiles of adiposity measures with brain volumes using one-way ANOVA. Subjects with BMI, waist circumference, SAT, or VAT above the 75th percentile was termed “high adiposity” for that measure. The relationship between high adiposity (independent variable coded as highest quartile versus quartiles 1–3) and brain volume was analyzed using multivariate general linear models (GLM). Individual measures of adiposity were treated as independent variables and the various brain measures as dependent variables in separate multivariate analyses adjusted for age, gender, and hypertension. To characterize the specific contribution of VAT to brain structure and cognition, we repeated the multivariate analysis with SAT or BMI as covariates. Finally analyses of cortical thickness were performed using Qdec from FreeSurfer 4.5.0 to evaluate the effect of abdominal adiposity on cortical gray matter. Data analysis was performed using SPSS version 18.0 (IBM SPSS Inc., Chicago, IL, USA).
Results
Sample Characteristics
Data from 184 non-demented ethnically Chinese volunteers are reported. Their mean age (SD) was 67.9 (6.4) years and 52.2% were women. Volunteers had an average 11.7 (3.7) years of formal education, which is relatively high for this cohort and contrasts to another community-based study on the same population (Feng et al., 2006). ApoE4 heterozygote carriers constituted 23.5%. There were no ApoE4 homozygotes in the sample. Other sample characteristics are listed in Table 1.
The mean BMI of 23.2 (3.0) appears low, but is average for East Asians who have a higher risk of cardiovascular disease at a given BMI relative to Caucasians (Deurenberg-Yap et al., 2001). The mean waist circumference in men was 85.7 (8.2) and 78.6 (8.2) cm in women.
A significant gender difference was observed in abdominal adiposity. Women had higher SAT compared to men (t = −6.06, p < 0.001), and men had higher VAT than women (t = 4.39, p < 0.001). Age was not associated with accumulation of SAT or VAT.
Associations between Adiposity and Cognitive Performance
All measures of adiposity were negatively correlated with verbal memory and attention. VAT: verbal memory (r = −0.21, p = 0.005); attention (r = −0.18, p = 0.01), SAT: verbal memory (r = −0.18, p = 0.01); attention (r = −0.15, p = 0.04), waist circumference: verbal memory (r = −0.19, p = 0.01); attention (r = −0.15, p = 0.04), and BMI: verbal memory (r = −0.22, p = 0.003); attention (r = −0.20, p = 0.007). All these effects were significant after adjusting for the effects of age and gender (Table 2).
With reference to abdominal adiposity, both SAT and VAT were negatively correlated with verbal memory. However, additional regression analyses showed that after accounting for SAT, only VAT remained significantly associated with verbal memory (b = −0.17, p = 0.02). The reverse analysis, examining for an association with SAT after accounting for VAT, yielded a non-significant result (b = −0.10, p = 0.21).
Association between MRI Measures of Adiposity and Brain Volumetric Measures
Visceral adipose tissue was associated with both poorer cognitive performance and brain structural changes. VAT showed significant correlation with ventricular volume (r = 0.19, p = 0.009) and left hippocampal volume (−0.15, p = 0.04). The highest quartile of VAT was associated with higher ventricular volume (F = 5.39, p = 0.02) and lower hippocampal volume (F = 6.07, p = 0.02; Table 3). Concurrently, there was a positive association between hippocampal volume and verbal memory (r = 0.16, p = 0.02); and a negative association between ventricular volume and attention (r = −0.23, p = 0.001). Although SAT, BMI, and waist circumference were each associated with lower verbal memory and attention, their relationships with brain volume appear to be dissociated.
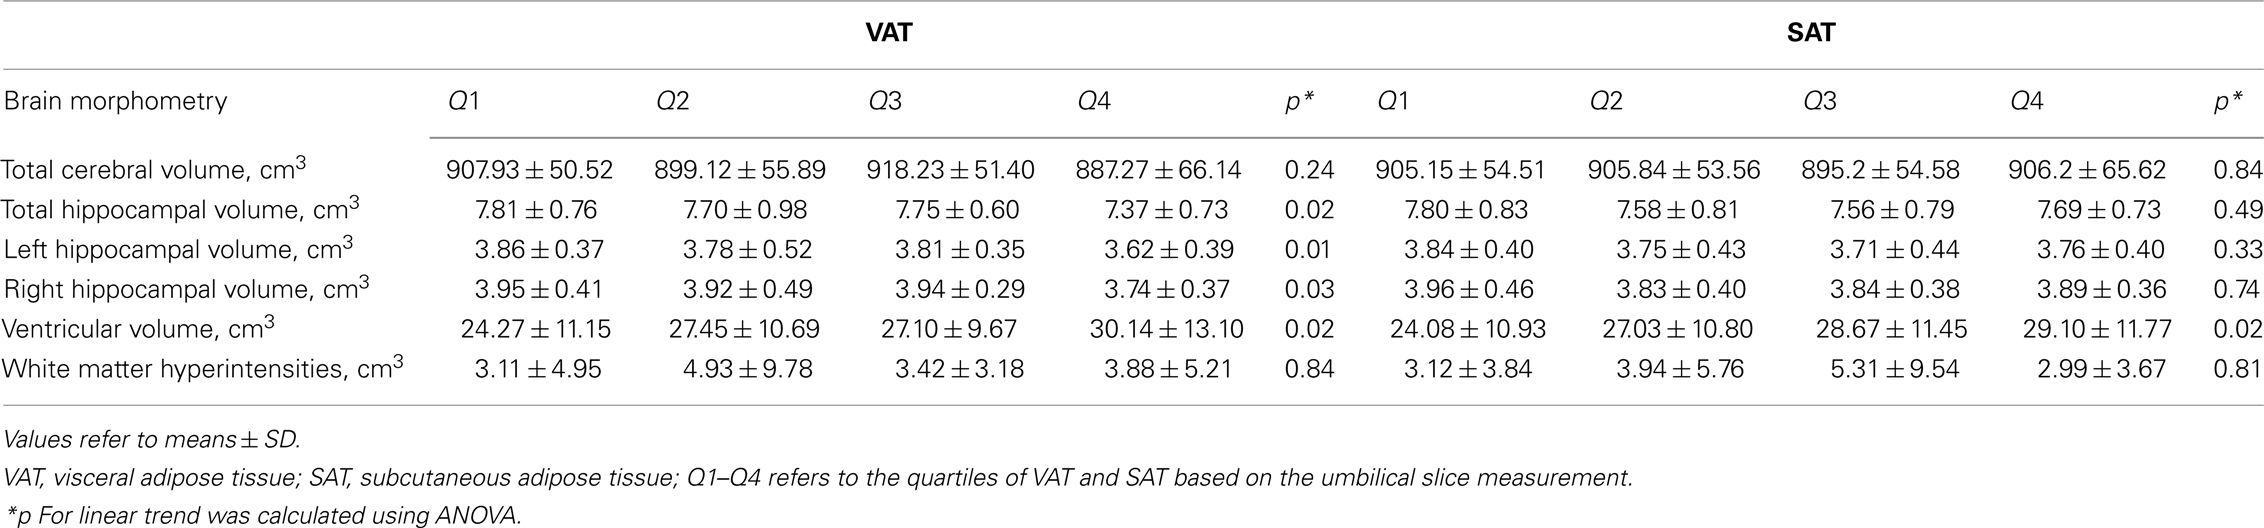
Table 3. Association between MRI measures of adiposity and brain volumetric measures.
Persons within the highest quartile of VAT at the umbilical slice had the strongest association with lower hippocampal volume (b = −0.32, p = 0.005). This association remained after adjusting for age, gender, and hypertension (Table 4). Additionally, VAT explained variance in hippocampal volume beyond that accounted for by SAT (b = −0.31, p = 0.009), BMI (b = −0.28, p = 0.02), waist circumference (b = 0.27, p = 0.02).
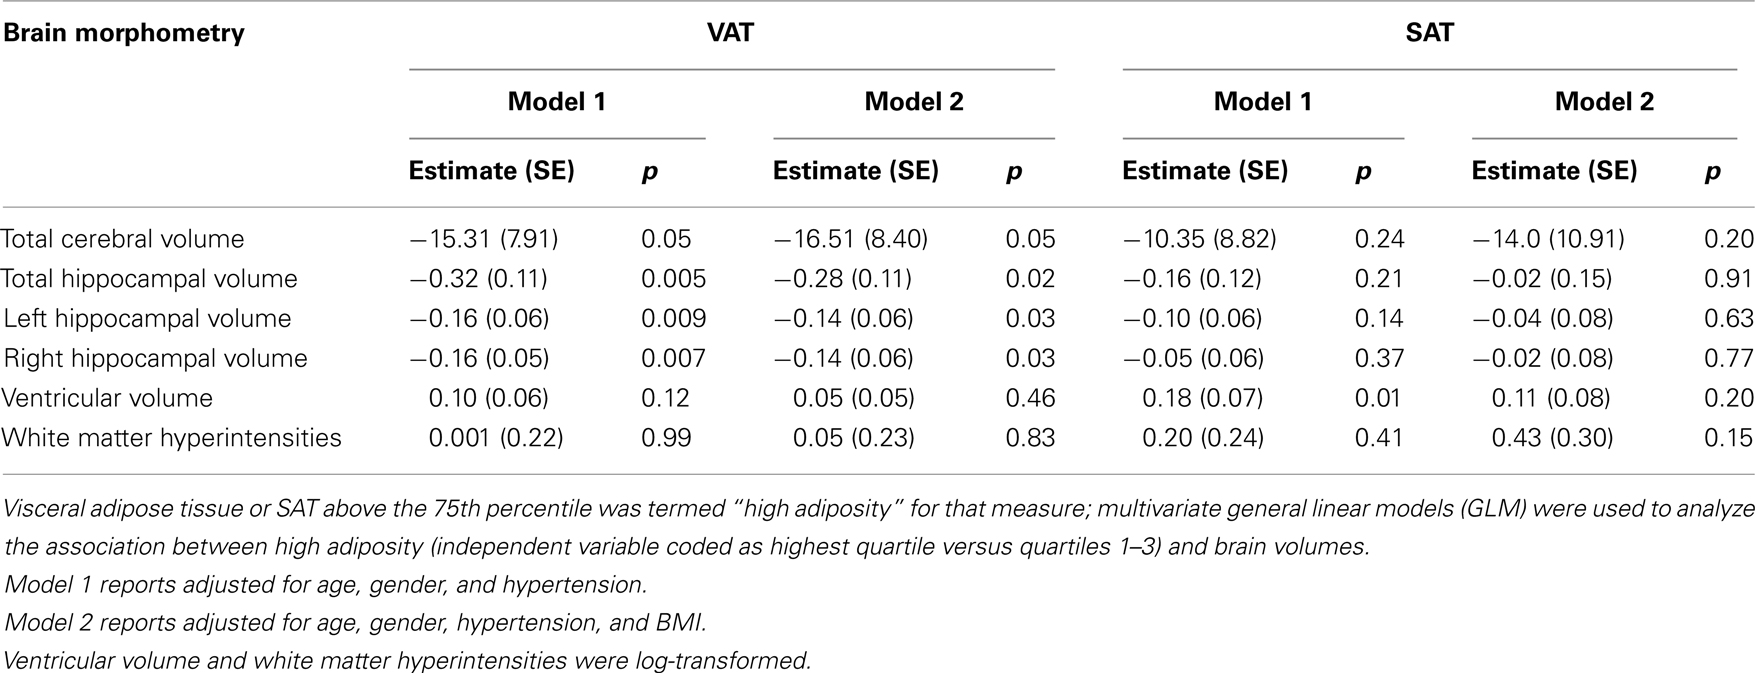
Table 4. Multivariate general linear models for the effect of MRI measures of adiposity on brain volumetric measures.
Association between of MRI Measures of Adiposity and Cortical Thickness
Elevated VAT was correlated with cortical thinning in bilateral pre-central (left p = 0.002, right p = 0.006), right post-central (p = 0.001), right superior temporal (p = 0.0001), and right inferior parietal cortices (p = 0.003). Both VAT and SAT were negatively associated with cortical thickness in medial occipital cortex bilaterally (p < 0.001 to p < 0.0001; Figure 1).
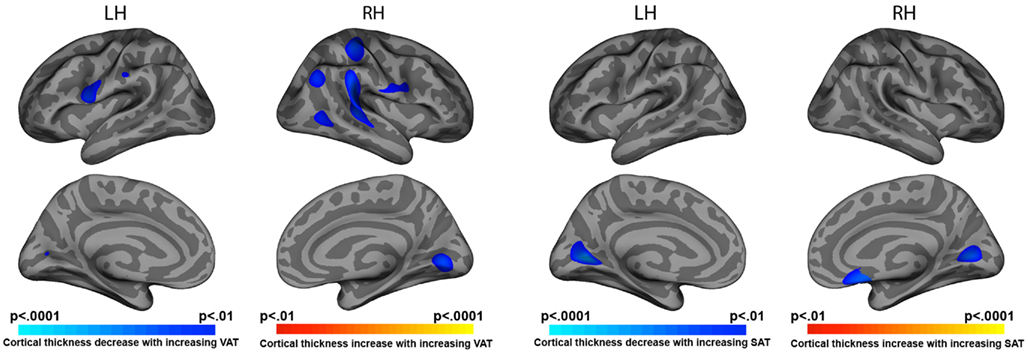
Figure 1. Statistical maps of VAT and SAT correlate with cortical thickness.
Analysis of cortical thickness revealed significant age by VAT interaction. In persons with high VAT, higher age was associated with reduced cortical thickness in the left prefrontal region (Figure 2B). A region of interest (ROI; 30 mm2) was drawn around area (A) where the most significant effects on cortical thickness were found (Figure 2A). Analysis of the average cortical thickness within the ROI showed significant main effects of age (F = 4.33, p = 0.041), VAT (F = 7.89, p = 0.006), and age(VAT interaction (F = 7.69, p = 0.007).
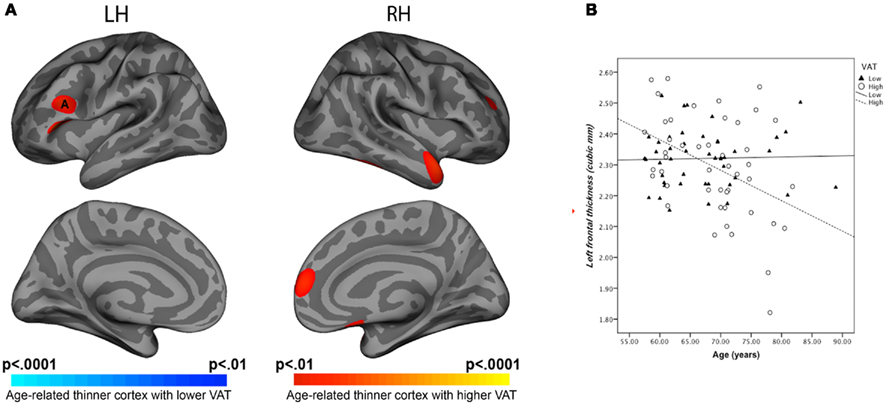
Figure 2. (A) Statistical maps of age and VAT interaction on cortical thickness. (B) Regression equations of age and VAT interaction for left-frontal ROI thickness. Note: Visceral adipose tissue categorized as high versus low using quartile split was compared for associations with cortical thickness. ANCOVA showed age*VAT interaction on cortical thickness at prefrontal regions (F = 7.69, p = 0.006).
Discussion
We found that in healthy elderly Chinese volunteers, elevated VAT correlated with reduced hippocampal volume, enlarged ventricles, and reduced verbal memory. Following correction for SAT, BMI, or waist circumference participants in the uppermost quartile of VAT remained those with the lowest hippocampal volume. Higher VAT was associated with regional cortical thinning. There was a significant age by VAT interaction in the left prefrontal cortex. Finally, we found an inverse correlation between VAT and verbal memory suggesting functional links between elevated VAT, changes in brain structure, and cognitive performance.
There exists an inverse association between anthropometric measurements of obesity and structural brain measures, particularly hippocampal volume (Jagust et al., 2005; Raji et al., 2010). However, there have only been isolated reports concerning how direct measures of adiposity relate to brain morphometric measures. For example, in one study, CT-measured VAT was associated with total brain volume independent of BMI and insulin resistance in middle-aged adults (Debette et al., 2010).
The present study found both anthropometric and MRI measures of adiposity to be associated with cognitive performance. MRI measured VAT showed a significant association with lower verbal memory and attention after correction for age and gender. We can reasonably connect increased VAT to lower hippocampal volume, ventricular enlargement and lower cognitive performance, on grounds that the brain volume loss contributed to lower cognitive performance (Hackert et al., 2002).
The highest quartile of VAT at the umbilical slice was associated with reduced hippocampal volume, and explained variance not fully accounted for by BMI.
Measurement of abdominal adiposity at this level may provide a clearer differentiation between the contribution of SAT and VAT (Wajchenberg, 2000). Interestingly, waist circumference also showed a borderline linear association with hippocampal volume but this was not independent of VAT. Waist circumference conflates SAT and VAT measures, and may not adequately identify the critical fat deposit that correlates with brain structure.
Our data concerning the association between cortical thickness and VAT volume is best regarded as exploratory and awaits replication. The closest result to the present one relates to the finding of reduced gray matter density with increasing BMI in left inferior frontal, right posterior region, right pre-central region, right lingual using voxel-based morphometry (Walther et al., 2010).
Mechanisms underlying the association between obesity and brain atrophy remain speculative (Jagust, 2007). Several risk factors that affect brain structure have been linked to obesity. Diabetes is strongly related to obesity and may mediate the relationship between adiposity and hippocampal volume (den Heijer et al., 2003). In the present dataset we excluded diabetic subjects but were still able to show an independent effect of VAT on brain structure. Systemic inflammation could be another important mediator. High sensitive C-reactive protein (hs-CRP), a marker for inflammation has been reported to mediate VAT and total brain volume (Debette et al., 2010). However, we did not find such an association. This result was unexpected but could be explained by an interaction between inflammation and some other variable portending to poorer metabolic and brain outcomes in less healthy individuals.
Other mechanisms that merit further investigation are hypercortisolemia, hyperlipidemia, and reduced exercise (Meyer et al., 1999; Erickson et al., 2009). Hypercortisolemia may contribute to hippocampal atrophy (Lupien et al., 1998). These factors, alone or in combination with other mechanisms may mediate the association between VAT and brain structure.
The strengths of this study include measurement of visceral adiposity using MRI and correlation with brain morphometric measures known to be useful biomarkers for studying cognitive decline in clinical settings (Jack et al., 2010). However, the cross-sectional nature of the present work precludes inferring a causal link between VAT, cognitive function, and changes in brain structure. Additionally, despite the MMSE cut-off of 26 (which is a conservative cut-off for this population), a few subjects with mild cognitive impairment (MCI) and incipient dementia may be have inadvertently been recruited (Goldman et al., 2001; de Jager et al., 2002; Aizenstein et al., 2008).
In conclusion, VAT appears to have negative effects on verbal memory and hippocampal volume. Higher VAT was associated with ventricular enlargement and compounds age-related cortical thinning. VAT appears to better account for variance in hippocampal volume among healthy elderly than BMI or waist circumference.
Author contributions
Isaac, Sim, Zheng, and Chee had full access to the data in the study and take full responsibility for the integrity of the data and the accuracy of the data analysis. Study concept and design: Zagorodnov, Tai, and Chee. Acquisition of data: Sim and Chee. Analysis and interpretation of data: Isaac, Zheng, Zagorodnov, Tai, and Chee. Drafting of the manuscript: Isaac, Sim, and Chee. Statistical analysis: Isaac. Critical revision of the manuscript for important intellectual content: Zagorodnov and Tai. Obtained funding: Chee. Administrative, technical, and material support: Sim, Zheng, and Chee. Study supervision: Chee.
Conflict of Interest Statement
Isaac, Sim, Zheng, Zagorodnov, and Chee report no disclosures. Tai is in the advisory boards for Bristol Myers Squibb (Singapore) Pte Ltd., Astra Zeneca (Singapore) Pte Ltd., and Novo Nordisk Pharma (Singapore) Pte Ltd. He received honoraria as a speaker for Merck Sharp and Dohme (I.A.) Corp, Unilever, and Abbot Laboratories. He also a recipient of an investigator initiated research grant from Pfizer to study psychological and socio-economic risk factors in relation to cardiovascular risk factors in south East Asia.
Acknowledgments
The work was supported by the Biomedical Research Council, Singapore BMRC 04/1/36/19/372 and A*STAR: SRP R-913-200-004-304. The authors thank all subjects for their participation, Karren Chen and Shuwei Koh for data collection; Sarayu Parimal for technical assistance.
References
Aizenstein, H. J., Nebes, R. D., Saxton, J. A., Price, J. C., Mathis, C. A., Tsopelas, N. D., Ziolko, S. K., James, J. A., Snitz, B. E., Houck, P. R., Bi, W., Cohen, A. D., Lopresti, B. J., Dekosky, S. T., Halligan, E. M., and Klunk, W. E. (2008). Frequent amyloid deposition without significant cognitive impairment among the elderly. Arch. Neurol. 65, 1509–1517.
Bosy-Westphal, A., Booke, C. A., Blocker, T., Kossel, E., Goele, K., Later, W., Hitze, B., Heller, M., Gluer, C. C., and Muller, M. J. (2010). Measurement site for waist circumference affects its accuracy as an index of visceral and abdominal subcutaneous fat in a Caucasian population. J. Nutr. 140, 954–961.
Boykov, Y., Veksler, O., and Zabih, R. (2001). Fast approximate energy minimization via graph cuts. IEEE Trans. Pattern Anal. Mach. Intell. 23, 17.
Buckner, R. L., Head, D., Parker, J., Fotenos, A. F., Marcus, D., Morris, J. C., and Snyder, A. Z. (2004). A unified approach for morphometric and functional data analysis in young, old, and demented adults using automated atlas-based head size normalization: reliability and validation against manual measurement of total intracranial volume. Neuroimage 23, 724–738.
Chee, M. W., Chen, K. H., Zheng, H., Chan, K. P., Isaac, V., Sim, S. K., Chuah, L. Y., Schuchinsky, M., Fischl, B., and Ng, T. P. (2009). Cognitive function and brain structure correlations in healthy elderly East Asians. Neuroimage 46, 257–269.
de Jager, C. A., Milwain, E., and Budge, M. (2002). Early detection of isolated memory deficits in the elderly: the need for more sensitive neuropsychological tests. Psychol. Med. 32, 483–491.
Debette, S., Beiser, A., Hoffmann, U., Decarli, C., O’donnell, C. J., Massaro, J. M., Au, R., Himali, J. J., Wolf, P. A., Fox, C. S., and Seshadri, S. (2010). Visceral fat is associated with lower brain volume in healthy middle-aged adults. Ann. Neurol. 68, 136–144.
Delis, D. C., Kaplan, E., and Kramer, J. H. (2001). Delis-Kaplan Executive Function System. San Antonio, TX: The Psychological Corporation.
den Heijer, T., Vermeer, S. E., Van Dijk, E. J., Prins, N. D., Koudstaal, P. J., Hofman, A., and Breteler, M. M. (2003). Type 2 diabetes and atrophy of medial temporal lobe structures on brain MRI. Diabetologia 46, 1604–1610.
Desikan, R. S., Segonne, F., Fischl, B., Quinn, B. T., Dickerson, B. C., Blacker, D., Buckner, R. L., Dale, A. M., Maguire, R. P., Hyman, B. T., Albert, M. S., and Killiany, R. J. (2006). An automated labeling system for subdividing the human cerebral cortex on MRI scans into gyral based regions of interest. Neuroimage 31, 968–980.
Deurenberg-Yap, M., Chew, S. K., Lin, V. F., Tan, B. Y., Van Staveren, W. A., and Deurenberg, P. (2001). Relationships between indices of obesity and its co-morbidities in multi-ethnic Singapore. Int. J. Obes. Relat. Metab. Disord. 25, 1554–1562.
Elias, M. F., Elias, P. K., Sullivan, L. M., Wolf, P. A., and D’Agostino, R. B. (2003). Lower cognitive function in the presence of obesity and hypertension: the Framingham heart study. Int. J. Obes. Relat. Metab. Disord. 27, 260–268.
Erickson, K. I., Prakash, R. S., Voss, M. W., Chaddock, L., Hu, L., Morris, K. S., White, S. M., Wojcicki, T. R., Mcauley, E., and Kramer, A. F. (2009). Aerobic fitness is associated with hippocampal volume in elderly humans. Hippocampus 19, 1030–1039.
Feng, L., Ng, T. P., Chuah, L., Niti, M., and Kua, E. H. (2006). Homocysteine, folate, and vitamin B-12 and cognitive performance in older Chinese adults: findings from the Singapore Longitudinal Ageing Study. Am. J. Clin. Nutr. 84, 1506–1512.
Feng, L., Scherer, S. C., Tan, B. Y., Chan, G., Fong, N. P., and Ng, T. P. (2010). Comorbid cognitive impairment and depression is a significant predictor of poor outcomes in hip fracture rehabilitation. Int. Psychogeriatr. 22, 246–253.
Folstein, M. F., Folstein, S. E., and Mchugh, P. R. (1975). “Mini-mental state.” A practical method for grading the cognitive state of patients for the clinician. J. Psychiatr. Res. 12, 189–198.
Goldman, W. P., Price, J. L., Storandt, M., Grant, E. A., Mckeel, D. W. Jr., Rubin, E. H., and Morris, J. C. (2001). Absence of cognitive impairment or decline in preclinical Alzheimer’s disease. Neurology 56, 361–367.
Gunstad, J., Paul, R. H., Cohen, R. A., Tate, D. F., Spitznagel, M. B., Grieve, S., and Gordon, E. (2008). Relationship between body mass index and brain volume in healthy adults. Int. J. Neurosci. 118, 1582–1593.
Gustafson, D., Rothenberg, E., Blennow, K., Steen, B., and Skoog, I. (2003). An 18-year follow-up of overweight and risk of Alzheimer disease. Arch. Intern. Med. 163, 1524–1528.
Hackert, V. H., Den Heijer, T., Oudkerk, M., Koudstaal, P. J., Hofman, A., and Breteler, M. M. (2002). Hippocampal head size associated with verbal memory performance in nondemented elderly. Neuroimage 17, 1365–1372.
Hixson, J. E., and Vernier, D. T. (1990). Restriction isotyping of human apolipoprotein E by gene amplification and cleavage with HhaI. J. Lipid Res. 31, 545–548.
Huang, K. C., Lee, M. S., Lee, S. D., Chang, Y. H., Lin, Y. C., Tu, S. H., and Pan, W. H. (2005). Obesity in the elderly and its relationship with cardiovascular risk factors in Taiwan. Obes. Res. 13, 170–178.
Jack, C. R. Jr., Wiste, H. J., Vemuri, P., Weigand, S. D., Senjem, M. L., Zeng, G., Bernstein, M. A., Gunter, J. L., Pankratz, V. S., Aisen, P. S., Weiner, M. W., Petersen, R. C., Shaw, L. M., Trojanowski, J. Q., and Knopman, D. S. (2010). Brain beta-amyloid measures and magnetic resonance imaging atrophy both predict time-to-progression from mild cognitive impairment to Alzheimer’s disease. Brain 133, 3336–3348.
Jagust, W. (2007). What can imaging reveal about obesity and the brain? Curr. Alzheimer Res. 4, 135–139.
Jagust, W., Harvey, D., Mungas, D., and Haan, M. (2005). Central obesity and the aging brain. Arch. Neurol. 62, 1545–1548.
Kanaya, A. M., Lindquist, K., Harris, T. B., Launer, L., Rosano, C., Satterfield, S., and Yaffe, K. (2009). Total and regional adiposity and cognitive change in older adults: the health, aging and body composition (ABC) study. Arch. Neurol. 66, 329–335.
Keys, A., Fidanza, F., Karvonen, M. J., Kimura, N., and Taylor, H. L. (1972). Indices of relative weight and obesity. J. Chronic Dis. 25, 329–343.
Kizer, J. R., Biggs, M. L., Ix, J. H., Mukamal, K. J., Zieman, S. J., De Boer, I. H., Mozaffarian, D., Barzilay, J. I., Strotmeyer, E. S., Luchsinger, J. A., Elkind, M. S., Longstreth, W. T. Jr., Kuller, L. H., and Siscovick, D. S. (2011). Measures of adiposity and future risk of ischemic stroke and coronary heart disease in older men and women. Am. J. Epidemiol. 173, 10–25.
Lezak, M. D., Howieson, D. B., and Loring, D. W. (2004). Neuropsychological Assessment. New York: Oxford University Press.
Liu, J., Fox, C. S., Hickson, D. A., May, W. D., Hairston, K. G., Carr, J. J., and Taylor, H. A. (2010). Impact of abdominal visceral and subcutaneous adipose tissue on cardiometabolic risk factors: the Jackson heart study. J. Clin. Endocrinol. Metab. 95, 5419–5426.
Lupien, S. J., De Leon, M., De Santi, S., Convit, A., Tarshish, C., Nair, N. P., Thakur, M., Mcewen, B. S., Hauger, R. L., and Meaney, M. J. (1998). Cortisol levels during human aging predict hippocampal atrophy and memory deficits. Nat. Neurosci. 1, 69–73.
Meyer, J. S., Rauch, G. M., Crawford, K., Rauch, R. A., Konno, S., Akiyama, H., Terayama, Y., and Haque, A. (1999). Risk factors accelerating cerebral degenerative changes, cognitive decline and dementia. Int. J. Geriatr. Psychiatry 14, 1050–1061.
Ng, T. P., Niti, M., Chiam, P. C., and Kua, E. H. (2007). Ethnic and educational differences in cognitive test performance on mini-mental state examination in Asians. Am. J. Geriatr. Psychiatry 15, 130–139.
Nomura, K., Eto, M., Kojima, T., Ogawa, S., Iijima, K., Nakamura, T., Araki, A., Akishita, M., and Ouchi, Y. (2010). Visceral fat accumulation and metabolic risk factor clustering in older adults. J. Am. Geriatr. Soc. 58, 1658–1663.
Poirier, P., and Despres, J. P. (2003). Waist circumference, visceral obesity, and cardiovascular risk. J. Cardiopulm. Rehabil. 23, 161–169.
Raji, C. A., Ho, A. J., Parikshak, N. N., Becker, J. T., Lopez, O. L., Kuller, L. H., Hua, X., Leow, A. D., Toga, A. W., and Thompson, P. M. (2010). Brain structure and obesity. Hum. Brain Mapp. 31, 353–364.
Reitan, R. M., and Wolfson, D. (1985). The Halstead-Reitan Neuropsychological Test Battery. Tucson, AZ: Neuropsychology Press.
Rexrode, K. M., Carey, V. J., Hennekens, C. H., Walters, E. E., Colditz, G. A., Stampfer, M. J., Willett, W. C., and Manson, J. E. (1998). Abdominal adiposity and coronary heart disease in women. JAMA 280, 1843–1848.
Sheikh, J. I., and Yesavage, J. A. (1986). Geriatric Depression Scale (GDS): recent evidence and development of a shorter version. Clin. Gerontol. 165–173.
Wajchenberg, B. L. (2000). Subcutaneous and visceral adipose tissue: their relation to the metabolic syndrome. Endocr. Rev. 21, 697–738.
Walther, K., Birdsill, A. C., Glisky, E. L., and Ryan, L. (2010). Structural brain differences and cognitive functioning related to body mass index in older females. Hum. Brain Mapp. 31, 1052–1064.
Wang, J., Thornton, J. C., Russell, M., Burastero, S., Heymsfield, S., and Pierson, R. N. Jr. (1994). Asians have lower body mass index (BMI) but higher percent body fat than do whites: comparisons of anthropometric measurements. Am. J. Clin. Nutr. 60, 23–28.
Wechsler, D. (1997). WMS-III Administration and Scoring Manual. San Antonio, TX: The Psychological Corporation.
Whitmer, R. A., Gustafson, D. R., Barrett-Connor, E., Haan, M. N., Gunderson, E. P., and Yaffe, K. (2008). Central obesity and increased risk of dementia more than three decades later. Neurology 71, 1057–1064.
Keywords: cognitive aging, visceral adiposity, hippocampus, neuropsychological assessment, MRI
Citation: Isaac V, Sim S, Zheng H, Zagorodnov V, Tai ES and Chee M (2011) Adverse associations between visceral adiposity, brain structure, and cognitive performance in healthy elderly. Front. Ag. Neurosci. 3:12. doi: 10.3389/fnagi.2011.00012
Received: 10 June 2011;
Paper pending published: 15 July 2011;
Accepted: 25 August 2011;
Published online: 13 September 2011.
Edited by:
Vadim Fraifeld, Ben Gurion University of the Negev, IsraelReviewed by:
William J. Jagust, University of California Berkeley, USAArie Budovsky, Judea R&D Center, Israel
Copyright: © 2011 Isaac, Sim, Zheng, Zagorodnov, Tai and Chee. This is an open-access article subject to a non-exclusive license between the authors and Frontiers Media SA, which permits use, distribution and reproduction in other forums, provided the original authors and source are credited and other Frontiers conditions are complied with.
*Correspondence: Michael Chee, Cognitive Neuroscience Laboratory, Duke–National University of Singapore Graduate Medical School, 8 College Road, Singapore 169857. e-mail: michael.chee@duke-nus. edu.sg