Coping with brief periods of food restriction: mindfulness matters
- 1Department of Radiology, Wake Forest University School of Medicine, Winston-Salem, NC, USA
- 2Translational Science Center, Wake Forest University, Winston-Salem, NC, USA
- 3Pennington Biomedical Research Center, Louisiana State University, Baton Rouge, LA, USA
- 4Departments of Health and Exercise Science and Geriatric Medicine, Wake Forest University, Winston-Salem, NC, USA
The obesity epidemic had spawned considerable interest in understanding peoples' responses to palatable food cues that are plentiful in obesogenic environments. In this paper we examine how trait mindfulness of older, obese adults may moderate brain networks that arise from exposure to such cues. Nineteen older, obese adults came to our laboratory on two different occasions. Both times they ate a controlled breakfast meal and then were restricted from eating for 2.5 h. After this brief period of food restriction, they had an fMRI scan in which they were exposed to food cues and then underwent a 5 min recovery period to evaluate brain networks at rest. On one day they consumed a BOOST® liquid meal prior to scanning, whereas on the other day they only consumed water (NO BOOST® condition). We found that adults high in trait mindfulness were able to return to their default mode network (DMN), as indicated by greater global efficiency in the precuneus, during the post-exposure rest period. This effect was stronger for the BOOST® than NO BOOST® treatment condition. Older adults low in trait mindfulness did not exhibit this pattern in the DMN. In fact, the brain networks of those low on the MAAS suggests that they continued to be pre-occupied with the elaboration of food cues even after cue exposure had ended. Further work is needed to examine whether mindfulness-based therapies alter brain networks to food cues and whether these changes are related to eating behavior.
Introduction
According to self-determination theory (Ryan and Deci, 2004), a quality of consciousness known as mindfulness is central to healthy self-regulation. Specifically, in a mindful state, people are less apt to be trapped by intrusive thoughts and conditioned responses that often lead to rumination and impulsive behavior (Brown et al., 2007). In this paper, we propose that, when exposed to palatable food cues in a short-term post-absorptive state, trait mindfulness as assessed by the Mindfulness Attention Awareness Scale (MAAS) (Brown and Ryan, 2003) will be related to the degree of confidence for controlling eating behavior and to the brain networks of older, obese adults.
Although a relatively new construct in the Western psychological literature, the last decade of research has made considerable progress in establishing mindfulness as an important quality of conscious experience that plays a central role in psychological functioning (Brown et al., 2007; Williams, 2010; Keng et al., 2011). These effects have been observed in research with the MAAS, brief experimental manipulations of mindfulness, and longer-term training programs (Broderick, 2005; Brown et al., 2007). Additionally, Weinstein and colleagues (Weinstein et al., 2009) have found that individuals who score higher on the MAAS are less stressed by external demands and exhibit more adaptive methods of coping with stress than those scoring low on this measure.
What is particularly interesting in the context of the current study is that mindfulness may help people to disengage from dysfunctional processing of food-related cues that are plentiful in the Western obesogenic environment. We would predict that, in a post-absorptive state in which participants consume only water, scores on the MAAS would moderate self-efficacy beliefs regarding the ability to control the consumption of palatable foods. Furthermore, we hypothesize that MAAS scores will moderate functional brain organization that reflects adaptive coping. At least one study in the neuroscience literature suggests that mindfulness can foster healthy brain networks. That is, Creswell and colleagues (Creswell et al., 2007) tested the hypothesis that participants' scores on the MAAS would be directly related to more favorable neural regulation during a labeling task that involved the visual identification of negative affect embedded in facial expressions. Consistent with their prediction, they found that participants who scored high on the MAAS had greater activation in several areas of the prefrontal cortex that were concomitant with deactivation of the amygdala; no such patterns were observed for those scoring low on the MAAS scale. These data are consistent with a conceptual overview of the mindfulness construct by Brown and colleagues (Brown et al., 2007). They argue that a core characteristic of mindful awareness is that external events revealed to the brain by the senses can be “witnessed” in an objective manner rather than fueling the fires of reactive cognitive processing.
In the current study, older adults came to our laboratory on two different occasions. Both times they ate a controlled breakfast meal and then were restricted from eating for 2.5 h. After this brief period of food restriction, they had an fMRI scan in which they were exposed to food cues and then underwent a 5 min recovery period to evaluate brain networks at rest. On one day they consumed a BOOST® liquid meal prior to scanning, whereas on the other day they only consumed water (NO BOOST® condition). We were particularly interested to see whether older adults who scored low on the MAAS would experience a disruption in their resting brain network as compared to those scoring high on the MAAS. Also, particularly in the NO BOOST® condition, we expected to find that those scoring low on the MAAS would show evidence of network connectivity between the insula and the amygdala. This is based on work showing that the insular cortices (Damasio, 2010) and amygdalae (LeDoux, 2003) are central to the processing of a range of both pleasant and unpleasant feeling states rooted in visceral cues.
Materials and Methods
Participants
A sample (n = 22) of obese (BMI ≥30 kg/m2 but ≤40 kg/m2), sedentary older adults (50–80 years of age) was recruited from Forsyth County, NC. All were Caucasians and were neither actively dieting nor involved in more than 60 min of structured exercise each week. Active dieting was defined as currently involved in a research study of weight loss, participating in a commercial weight loss program, or engaging in a self-directed program to lose weight. Structured exercise was any structured type of aerobic or resistance training performed in bouts lasting ≥ 10 min. Both active dieting and exercise habits were assessed via interview. Other exclusion criteria included: (1) the presence of a systemic uncontrolled disease or psychiatric illness determined via self-report, (2) a binge eating disorder, (3) the inability to safely undergo magnetic resonance imaging, (4) currently undergoing active treatment for cancer, or (5) unable to read or speak English. Of the 22 that were randomized to treatment, three were unable to complete the study leaving a final n of 19. One individual was lost due to complications from pre-existing back-pain, a second became claustrophobic during the first day of scanning, and the third had a large frontal artifact in the fMRI scan. Informed consent was obtained on all participants and the study protocol was approved by the Wake Forest University School of Medicine Institution Review Board. Participants received $225 to compensate for their time commitment.
Measures
Mindful attention awareness scale (MAAS)
The MAAS was used as a trait measure of mindfulness. It consists of 15 questions that appear on six-point Likert scales (1 = almost always, 6 = almost never) with a possible range from 15 to 90. The measure is unidimensional in structure with an alpha reliability coefficient of 0.85. Brown and Ryan have provided extensive support for its construct validity (Brown and Ryan, 2003; Brown et al., 2007). For the purpose of our analysis, participants were divided into a “high” and a “low” group based on a median MAAS score. After exclusions due to complications with scanning, this division resulted in eight participants in the low MAAS group and 11 participants in the high MAAS group.
Confidence for controlling eating behavior (CCEBstate)
We have developed a four-item measure of self-efficacy for eating behavior for the consumption of favorite foods that is state-based (Bandura, 1986). Participants rate their confidence in being able to resist or control eating their favorite food right now, at this moment. The items are rated on a 10-point scale ranging from 0 “not at all confident” to 10 “very confident,” with the anchor “moderately confident” spanning the values from 4 to 6 and centered at 5. The four items include the following: (1) if available, I could resist eating my favorite foods; (2) at the current time, I feel like I have good control over my appetite; (3) at the moment, I feel as if I could restrain myself from eating foods that I enjoy; and (4) currently I feel that I could avoid snacking between meals. In this sample, a principal component analysis yielded a single dimension that captured 78.4% of the item variance. All factor loadings were in excess of 0.80 with a Cronbach alpha reliability of 0.90. We have also examined the dimensionality of this measure in a larger sample of college students and found nearly identical results. Specifically, in a sample of 111 college undergraduates, 48 men and 63 women, we found that a single factor accounted for 72% of the variance in the four items that all items had loadings in excess of 0.70; the four-item scale had a Cronbach alpha internal consistency reliability of 0.87.
Food craving questionnaire (the FCQstate)
The FCQstate assesses state craving for specific foods using a five-point scale (1 = strongly disagree; 5 = strongly agree) with the mid-point being anchored by the label neutral. The FCQstate is based on a unifying construct and has a Cronbach alpha of 0.94. The FCQstate is distinct from the concept of Food Restraint and has been found to exhibit a statistically significantly reduction completed prior to and then following breakfast (Cepeda-Benito et al., 2000).
Power of food scale (PFS)
The PFS assesses the drive to consume food in an obesogenic food environment (Lowe et al., 2009); higher scores are associated with a higher drive. The total score has been shown to have good test–retest reliability (r = 0.77), is internal consistent (α = 0.91), and support exists for its construct validity. Three subscale scores can be calculated: food available, food presence, and food tasted.
The interview for the diagnosis of eating disorders (IDED-IV)
The semi-structured interview described by Kutlesic and colleagues (Kutlesic et al., 1998) was employed to exclude participants with a binge-eating disorder.
In-Person Screening and Assessments
An in-person screening visit was completed to obtain an informed consent, to gather biometric data, to assess whether there was evidence of current dieting practices, to assess volume of structured physical activity, and to screen for binge-eating disorders. At this time participants were asked to both identify and rate the pleasantness of their two favorite foods. Eligible participants completed the MAAS, the PFS and were scheduled for two imaging visits (7–10 days apart).
Experimental Protocol for the Two Scanning Visits
Participants completed two, early morning 4 h visits. During each visit, participants consumed a prepared breakfast: 350 Kcal for females; 450 Kcal for males. Following breakfast, participants completed baseline assessment of the CCEBstate. They then were not allowed to consume any food for 2.5 h. During this period of food restriction, participants were only allowed to consume water and remained in the research center to be monitored by nursing staff. Approximately 45 min before the imaging procedure, participants completed an MRI safety form, if necessary a lens fitting procedure to correct for poor vision, and were then instructed and given practice on the task to be performed during the fMRI.
Once the fMRI forms and protocol had been described, participants either consumed a can of BOOST® (240 calories) or consumed only water. They then completed a second round of the CCEBstate. The food restriction manipulation was counterbalanced. Specifically, 11 participants were initially randomly assigned to receive the BOOST® meal on their first visit, whereas the other 11 were to receive the NO BOOST (water only) manipulation; for the second visit, participants received the opposite treatment from the one that they received on the first visit. As discussed in the section on study participants, three were lost to follow-up due to claustrophobia and or medical problems resulting in a total n of 19.
Food Cue Scanning Task
Participants wore goggles in the scanner that were directly interfaced with a computer screen. The task that they performed involved the visualization of words that were presented on a computer screen for 30 s each. There were two word blocks and six words in each block representing either two different neutral stimuli or two different favorite foods identified during the in-person screening. Within each block, the words were presented in random order with the restriction that each of the four words was presented at least once in each block. Each block lasted 5 min and 20 s with a 20 s visual cross fixation period at the beginning and end of each word.
The instructions for the visualization phase of the task were as follows: “During the task, you will see words on the screen in front of you. Some of these words describe your favorite foods and others are non-food related. Each time a word appears, I want you to think about that word and what it represents. So, for example, if the words “baked potato” appeared, imagine the ingredients that you like to put on the potato, see the steam coming out of it, think about how it smells, its texture, and how it would taste. I want you to try to use as many senses as possible to come up with the best image you can. Hold on to that image for the entire time that the word is on the screen. Now, I want you to do the same thing for the non-food words. So, if the word “desk” appears, where is it? How many drawers does it have? Is the wood dark or light? Is it rough or smooth? Once again, hold onto that image for the entire time it is on the screen. Between each word, you will see a cross on the screen. During this time do not think about anything in particular, just focus on the cross. The visualization procedure can be construed as a cognitive priming procedure that activates brain networks. In addition, at two different times during the task, you will be asked to provide ratings of (1) your hunger, (2) craving for your favorite food, and (3) how vivid the image was. You will see your response to these scales using computer images that appear in your goggles.”
Immediately following each block, participants provided rating for their hunger, level of craving, and vividness of the images using visual analog scales ranging from 0 (“not at all”) to 100 (“extreme”/“very well”). All scales were shown on the computer with responses controlled by movement of a mouse. After completing the two-blocks of words and follow-up questions, participants were asked to simply lie quietly in the scanner and to focus on the cross for a final period which lasted 5 min and 20 s. This post-exposure resting scanning period was used to examine brain networks.
Scanning Protocol
All scans were performed on a 1.5 T GE scanner using an eight-channel neurovascular head coil (GE Medical Systems, Milwaukee, WI, USA) and included anatomic imaging, perfusion imaging, two runs of fMRI with a food visualization task, and a post-exposure resting fMRI to evaluate differences in brain networks between the two treatment conditions and as moderated by scores on the MAAS.
Functional images for the network analyses measured changes in the T2*-relaxation rate that accompany changes in blood oxygenation. The T2* signal is sensitive to changes in blood oxygen content. As brain activity changes the oxygen content of the blood in the same area also changes. Thus, the T2* signal is an indirect measure of changes in neural activity (Ogawa et al., 1990). Functional imaging was performed using multi-slice gradient-EPI (TR = 2000 ms; TE = 40 ms; field of view = 24 cm (frequency) × 15 cm (phase); matrix size = 96 × 86, 28 slices, 5 mm thickness, no skip; voxel resolution = 3.75 mm × 3.75 mm × 5 mm. The subjects performed no task but were asked to keep their eyes open looking at a fixation cross for the 5 min 20 s resting fMRI scan.
Statistical Analyses
The self-report data was analyzed using SPSS Version 19. Due to the small sample, Spearman Rank Order Correlations were used to describe relationships between the MAAS, the PFS, and ratings of hunger and cravings collected during the scanning procedure.
Prior to generating brain networks, all scanning images were re-aligned and normalized to standard space using FSL (Smith et al., 2004). The time courses were extracted for each voxel in gray matter based on the Automated Anatomical Labeling atlas (Tzourio-Mazoyer et al., 2002) and band-pass filtered to remove signals outside the range of 0.009–0.08 Hz (Biswal et al., 1995; Fox et al., 2005). Mean global white matter, and CSF signal as well as motion correction parameters were regressed from the filtered time series to account for physiological noise. A correlation matrix was then produced by computing partial correlations between all possible pairs of voxels. A threshold was applied to the correlation matrix and all cells that surpassed this threshold were assigned a value of 1. The threshold was defined such that the relationship between the number of nodes and average number of connections at each node was consistent across subjects. Specifically, the relationship S = log(N)/log – (K) was the same across subjects as described previously (Hayasaka and Laurienti, 2010). For this paper, the threshold S = 2.5 was used.
To assess network organization, three separate analyses were performed. The first analysis evaluated the role of each node in sharing information across the network. Specifically, global efficiency (Latora and Marchiori, 2001) was used. This metric ranges from 0 to 1 and determines the distance, in number of steps that a node is from all other nodes in the network. A node that is directly connected to all nodes in a network would have a global efficiency of 1 whereas a disconnected node would have a global efficiency of 0. Brain maps are then generated with each voxel containing the global efficiency value. The next task is to determine the group consistency of the spatial location of the nodes with the highest global efficiency. This is achieved by identifying the top 20% of nodes and then overlapping the location of those nodes across study subjects.
In addition to identifying the overall network connectivity, analyses were performed to determine the areas connected to the insula/auditory cortex and the amygdala. The amygdala region-of-interest (ROI) was selected from the AAL atlas using WFU Pickatlas software (Maldjian et al., 2003). The right insula/auditory cortex was a 17 mm radius sphere centered on the superior temporal gyrus (MNI coordinates 52, −22, 6). The ROIs were used as seeds, and the first and second order connections to the seeds were determined. For both analyses the first-order connections were all local (i.e., adjacent or within the ROI) and are, therefore, not considered further. The second order connections were those that extended from the area of interest to other brain regions. The maps showing second-order connections represent the average number of connections (across subjects) any one voxel has with the ROI. The number of connections in an ROI for an individual person follows an exponentially truncated power law rather than a normal distribution. Thus, measures of central tendency such as the mean or median are inappropriate. For statistical comparisons, the distributions were fit using the equation P(k) α k − β exp(−k/θ) (see Hayasaka and Laurienti, 2010). Statistical analyses were then performed to identify differences in the degree distributions based on the power law exponent (β). Any group or condition that has significantly smaller beta values can be interpreted as having higher connectivity.
The second analysis focused on identifying the core of the brain networks based on the number of connections (or degree, often abbreviated as K), using a procedure called k-core decomposition (Figure 1) (Alvarez-Hamelin et al., 2006). This procedure iteratively removes nodes based on the degree of each node. The first step removes all nodes with a single connection. This can often result in nodes that previously had a degree >1 now being equal to 1. The procedure is continued until no nodes have a single connection. The next step is to remove nodes with a degree of 2 and so on until the network completely collapses. In this process each node is then assigned a k-shell that refers to the point when the node was removed from the network. The nodes that remain toward the end of the procedure are the highly interconnected, high degree nodes that make up the core of the network (K = 3 in Figure 1 below). The core data presented here identified the top 10% of nodes to ensure that the core being compared across subjects contained the same number of nodes. As with global efficiency, the consistency of the location of the core was determined by overlapping the core maps across subjects in each study population or condition. Statistical analyses on the network core data used the average value of the k-shell in specific brain regions as described in the regions-of-interest analyses below.
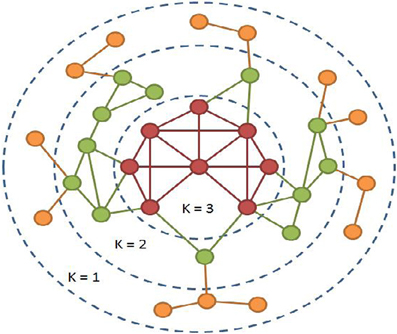
Figure 1. K-core decomposition map.
The values in each voxel from a network analysis are inherently multivariate. For example, the global efficiency in each voxel is determined by evaluating the connectivity between each and every voxel. Given this multivariate nature of the data, changes in one voxel inherently have effects on the network as a whole. Voxel-based statistics are essentially a compilation of massive numbers of univariate analyses with each voxel being treated as independent. Using massively univariate statistics on multivariate data can produce misleading outcomes. In order to generate quantitative comparisons, statistical analyses were restricted to ROIs. The right insula/auditory cortex, sensorimotor strip, and orbital frontal cortex were selected for statistical analyses. The sensorimotor cortex (pre- and post-central gyri) and orbital frontal cortex were selected from the AAL atlas using WFU Pickatlas software. The right auditory cortex was a 17 mm radius sphere centered on auditory cortex (MNI coordinates 52, −22, 6).
Results
Descriptive data for the sample can be found in Table 1. The success of the BOOST® manipulation is supported by the statistically significant treatment difference in hunger and craving ratings between the NO BOOST® and BOOST® conditions. That is, the ratings for hunger and cravings on the 100 unit VAS scales during the presentation of food cues in the scanner were higher in the NO BOOST® condition than in the BOOST® condition: M (SE) for hunger = 64.87 (6.78) and 32.80 (6.61), respectively [t(19) = 4.47, p = 0.0001]; for craving the M (SE) were 60.19 (7.39) and 42.75 (7.69), respectively [t(19) = 2.64, p = 0.16]. It is important to note, however, that ratings of hunger were not excessive in the NO BOOST® treatment condition given that the minimum score for hunger subscale of the FCQ hunger is 3 and the maximum is 15. This is why it is best to conceptualize the NO BOOST® condition as a short-term post-absorptive state, in which participants were only allowed to consume water, and the BOOST® condition as a short-term energy surfeit treatment condition, in which they consumed BOOST. In addition, participants reported a relatively high degree of vividness for the imagery of the food and non-food cues during the fMRI protocol, although the cues were reported to be somewhat more vivid in the NO BOOST® condition: M (SE) for NO BOOST® and BOOST® conditions were 87.21 (2.41) and 83.47 (1.98), respectively [t(19) = 2.19, p = 0.44]. Employing a Kolmogorov–Smirnov test, scores on the MAAS were found to be normally distributed with a mean (SD) of 66.65 (10.12) with minimum and maximum score of 48 and 83. After conducting a median split, the means (SD) for the low and high mindful groups [57.89 (6.62) vs. 73.81 (5.84)] were found to statistically different from one another (p < 0.001).
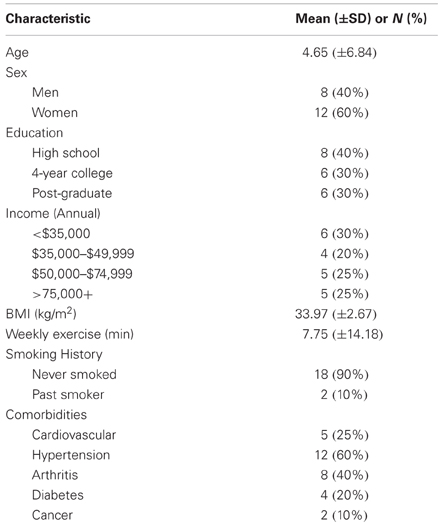
Table 1. Descriptive characteristics of participants.
Self-Report Data
Correlations were conducted between the MAAS, self-control, and PFS as well as between the MAAS and ratings of hunger and cravings immediately following the presentation of food cues in the scanner. The MAAS was not significantly related to PFS scores, rs = −0.30, p = 0.19, nor was it related to rating of hunger or cravings in either the NO BOOST® (rs for hunger = −0.01, p = 0.97; rs for craving = 0.02, p = 0.93) or BOOST® treatment conditions (rs for hunger = 0.15, p = 0.53; rs for craving = 0.19, p = 0.40). However, the MAAS did have a significant relationship with Confidence for Controlling Eating Behavior (CCEBstate) in the NO BOOST® treatment condition, rs = 0.46, p = 0.04; the relationship between the MAAS and the CCEBstate in the BOOST® treatment condition was not significant, rs = 0.33, p = 0.16.
Network Analyses
The high mindful group consistently had the highest global efficiency in the precuneus (Figure 2, Yellow circles), which is the primary hub of the resting brain (Hagmann et al., 2008; Moussa et al., 2011) and the primary component of the default mode network (DMN) (Raichle et al., 2001). An ROI analysis, see Table 2, revealed that these group differences were significant for the BOOST® (p = 0.02) and NO BOOST® (p = 0.04) conditions. An interesting trend suggests that the liquid meal replacement was effective in allowing the brains of High MAAS older adults to further solidify default-mode connectivity after exposure to food cues. This was not the case for the low mindful group, since they had low global efficiency in the precuneus during both the BOOST® and NO BOOST® conditions. Interestingly, in the NO BOOST® condition, the high mindful group had higher global efficiency in the precuneus than either condition for the low mindful group, albeit not as high as the high mindful group on BOOST®. Conversely, as shown in Figure 3, the low mindful group had the greatest global efficiency in the auditory and insular cortices. An ROI analysis revealed that global efficiency in the insula/auditory cortex was significantly greater in the Low MAAS group compared to the High MAAS group for BOOST® (p = 0.01) and NO BOOST® (p = 0.02) conditions. There was no significant effect of BOOST® on global efficiency in the insula/auditory cortex within study populations.
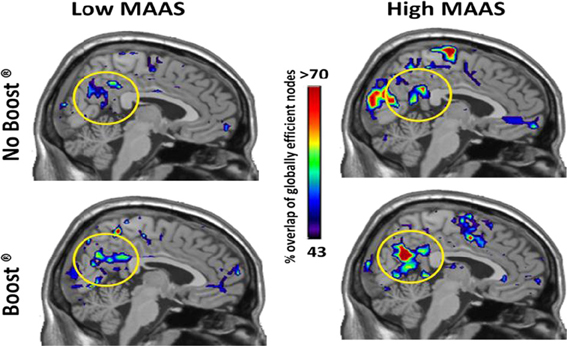
Figure 2. Global Efficiency Maps by MAAS Category: Precuneus. This figure shows a mid-saggital section of the brain for each group and condition. The regions that consistently exhibited high global efficiency across the study populations are color-coded according to % of the population. Note that the precuneus shows highest consistency in the High MAAS group following BOOST®. The Low MAAS group exhibited low consistency in this area regardless of condition.
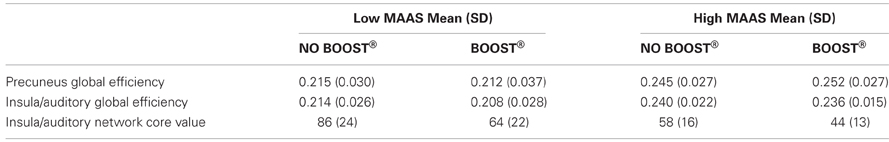
Table 2. Quantitative network metrics from region-of-interest analyses.
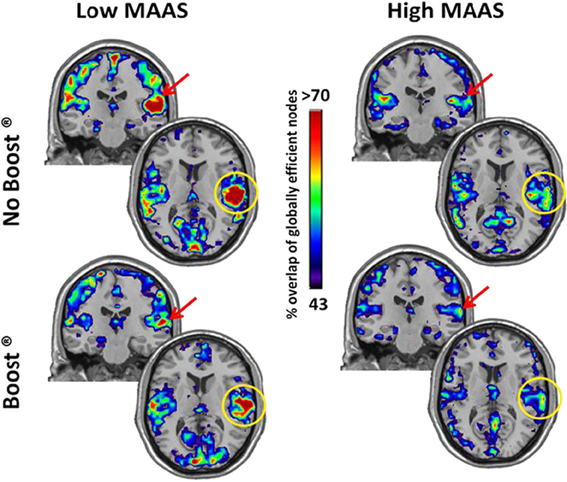
Figure 3. Global Efficiency Maps by MAAS Category: Insula/Auditory Cortex. This figure shows a coronal and axial section of the brain for each group and condition to highlight the insula/auditory cortex. The insula/auditory cortex consistently exhibited high global efficiency in the Low MAAS group under both conditions.
The insula/auditory cortex also exhibited particular prominence in the network core of the low mindfulness group (Figure 4). Note the similarities in the spatial distribution of brain regions that were in the network core and exhibited high global efficiency. A further analysis of the magnitude of the network core was performed in the insula/auditory cortex. The ROI analysis demonstrated that there was a significant reduction in the magnitude of the core in the low mindfulness group following BOOST® (p = 0.05). Following BOOST®, the low mindfulness group had core values that were much closer to those of the high mindfulness group (Table 2). Although there was a small reduction in the core values in the BOOST® condition for the high mindfulness group, this change did not reach significance. While there are clear differences in the network core maps between groups, the means from the insula/auditory cortex did not reach significance, likely due to high variability.
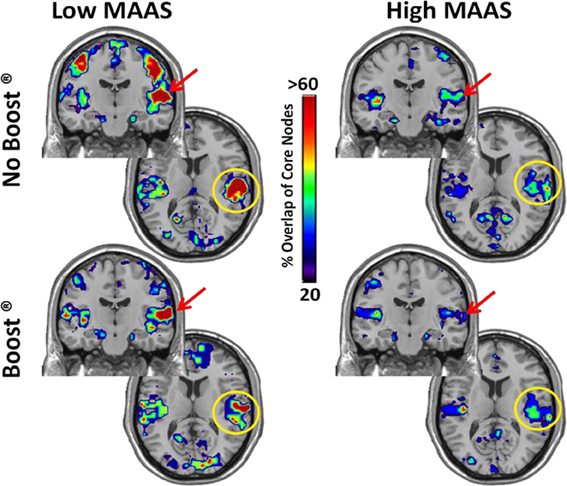
Figure 4. K-core Maps by MAAS Category: Insula/Auditory Cortex. The regions that were consistently within the core of the network are depicted in these coronal and axial brain slices. The color-code indicates the % of subjects that had each region within their network core. Note the similarity with the regions that exhibited high global efficiency.
The connectivity maps shown in Figure 5 reflect those second order connections for the auditory and insular cortices. Examination across the four panels reveals that the auditory and insular cortices of the low mindful group had higher connectivity with the sensorimotor cortex (yellow arrow), visual cortex (green arrow), and orbital frontal cortex (red arrows) than the high mindful group. The connectivity distributions follow exponentially truncated power laws. Therefore, we performed statistics on fit paramerters for the whole distributions (see Materials and Methods). Due to multiple subjects lacking connections to the orbital frontal cortex, the statistics focused on sensorimotor and visual cortices. These analyses revealed significantly greater connectivity in the visual cortex of the low mindfulness group compared to the high mindfulness group. Other comparisons did not achieve significance in the visual cortex, but there was a trend for a reduction in connectivity (p = 0.06) comparing the BOOST® and NO BOOST® conditions in the high mindfulness group. Connections to the sensorimotor cortex were marginally significant (p = 0.08) with greater connectivity again in the low compared to the high mindfulness groups. No other comparisons in the sensorimotor cortex were significant. These results suggest that in the low mindful group this sub-network was more strongly interconnected and continued to process and elaborate upon the food stimuli during the resting phase of the experiment. The connectivity maps shown in Figure 6 reflect those areas that were within one step of the amygdala. Once again, the auditory and insular cortices are major connectivity regions. While the group and condition differences shown here do not achieve significance when the distributions were statistically compared, it is important to note that the amygdala is also highly connected to the insula/auditory cortex.
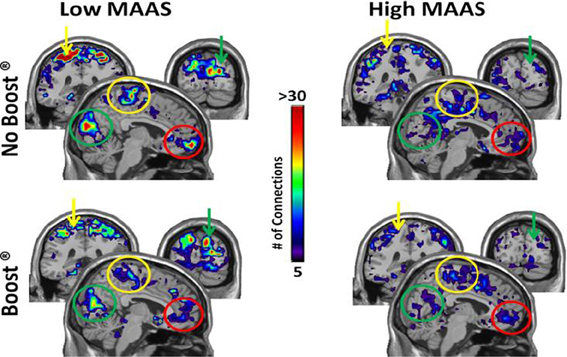
Figure 5. Connectivity Maps from Insula/Auditory Cortex by MAAS Category. This figure shows brain regions that are two steps removed from the auditory cortex. Thus, when tracking connections from the auditory cortex, the colored areas were reached after making two steps. Color bar represents the average number of connections across subjects for each voxel: sensorimotor cortex (yellow arrow), visual cortex (green arrow), orbital frontal cortex (red arrow).
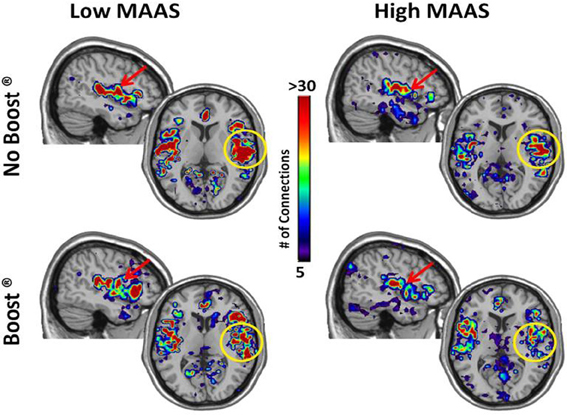
Figure 6. Connectivity Maps from Amygdala by MAAS Category. This figure shows brain regions that are two steps removed from the amygdala. The insula/auditory cortex on the right is highlighted by the yellow circle.
Discussion
The network data from this study suggest that trait mindfulness is a potent moderator of brain connectivity following exposure to palatable food cues. Specifically, older adults high in trait mindfulness were able to return to their DMN, as indicated by greater global efficiency in the precuneus, during the post-exposure rest period. This effect exhibited a trend to be stronger for the BOOST® than NO BOOST® treatment condition. Older adults low in trait mindfulness did not exhibit this pattern in the DMN. In fact, the opposite was true. That is, the brain networks of the low mindful group suggests that they continued to be pre-occupied with the elaboration of food cues as evident by activity in their auditory and insular cortices along with the connectivity of these regions to the sensorimotor cortex, visual cortex, orbital prefrontal cortex, and amygdala. Again, however, the effects were most dramatic when the low mindful group was not given a meal replacement. It is important to note that the insula is a key brain structure in processing visceral sensations, whereas the amygdala and orbital prefrontal cortex are well known for their involvement in the emotion elaboration of stimuli (LeDoux, 2003).
The patterns observed in brain networks within this experimental paradigm are consistent with the known characteristics of mindfulness as a quality of consciousness and with existing research on the MAAS, a measure of trait mindfulness. For example, Brown and Ryan (Brown and Ryan, 2003) have provided a convincing case that mindfulness facilitates effective self-regulation by preventing people from overreacting to, and fixating on, external cues, and internally constructed states of mind. Consistent with this position are results from an fMRI study by Creswell and colleagues (Creswell et al., 2007) who found that people high in trait mindfulness as assessed by the MAAS had less activity in the amygdala when exposed to threatening emotional stimuli than low mindful participants. In addition, studies have shown that MAAS scores are directly related to dispositional self-control (Barnes et al., 2007; Lakey et al., 2007). In the current study, older adults who scored higher on the MAAS had better perceived control related to eating behavior following the experimental manipulations than those scoring low on the MAAS. Interestingly, however, the low and high mindful subgroups did not differ in either state craving or ratings of hunger. These data suggest that high mindful people are not spared from experiencing physical sensations of craving and hunger, but that they act on them differently than those low in mindfulness. Indeed, the ability to accept rather than react to physical sensations is a key characteristic of mindfulness (Kabat-Zinn, 1990). Of course, one might wonder why being high in trait mindfulness is not protective against obesity? Our position is that “mindful awareness” alone is insufficient to prevent overeating, even people who are trait mindful fail at self-regulation. An interesting hypothesis, however, is that trait mindfulness may moderate the effects of cognitive behavioral interventions on weight management (see Rejeski et al., 2011). Specifically, low trait mindfulness may be a harbinger of people who have a particularly difficult time both losing weight in the intensive phase of treatment and with weight regain during maintenance. Moreover, the effectiveness of weight loss interventions may well be enhanced by coupling training in mindfulness with self-regulatory skill building.
In another recent publication of ours with this data-set, we demonstrated that exposure to palatable food cues in a post-absorptive state was associated with increases in state cravings for desired food, a reduction in self-regulatory self-efficacy, and shifts in brain networks that parallel what is observed with other addictive behaviors. Moreover, individuals who had a high drive to consume food, as assessed by the Power of Food Scale (PFS) (Lowe et al., 2009), were at an increased risk for experiencing these effects as compared to older adults who scored low on the PFS; in fact, the consumption of a meal replacement did not totally mitigate the “intrusion” that food cues had on the brain networks of those with a high drive to consume food. Interesting, scores on the MAAS were not significantly related to the PFS. What is even more intriguing is that although MAAS scores were unrelated to hunger ratings and cravings following exposure to food cues in the NO BOOST condition, within this same treatment condition scores on the PFS were substantially related to both hunger (p = 0.53, p = 0.01) and cravings (p = 0.61, p = 0.004). An important study would be to cross trait mindfulness with scores on the PFS and to examine eating behavior. The patterns in our data suggest that mindfulness interventions may be particularly beneficial for older adults that have a high drive to consume food.
The current study is not without limitations. First, the target sample was restricted to an older, obese population that was not currently dieting. It is possible that responses may have differed if participants were involved in an active weight loss intervention. Second, the current methods enabled us to examine resting networks after exposure to food cues, but not network activity during actual exposure to food and neutral cues. This is due to the fact that the food cues and neutral cues were presented in the same experimental run. Thus, at the current time, we do not know whether the observed effects in brain networks were due to the post-absorptive state itself or to actively imaging food cues. We are currently in the process of performing a follow-up study using a design that will allow the use of network analyses during both food cue exposure and neutral cue exposure. Third, by restricting the study to obese, older adults we may be describing functional brain networks that are unique to this subgroup; in short, our design has restricted population validity (Bracht and Glass, 1968). Future studies are warranted employing normal weight older adult and/or younger age group comparisons. And fourth, it is possible that the observed differences between those high and low in trait mindfulness is due to different metabolic phenotypes, a position that would argue for a more comprehensive metabolic screening in future studies. However, Cornier (Cornier, 2011) has recently argued that the problem in obesity may not be specific metabolic, autonomic, and/or hormonal signals, but the manner in which both homeostatic and non-homeostatic signals are integrated centrally. Rosenbaum and Leibel (2010) have put forth for a similar position. In fact, they go a step further arguing that food cues trigger “global changes” in the brain that involve multiple regions. This is exactly why we are applying network science to the study of food cues and to eating behavior.
In conclusion, despite the aforementioned limitations, we believe that the brain network data are compelling, make use of cutting-edge technology, and suggest that future research on trait mindfulness and eating behavior is warranted. Future work is needed to examine how mindfulness might be used to treat people who are obese and overeat due to a high drive to consume food. In addition, attention could be directed to examine whether brain states are predictive of disordered eating such as binging. Of note is the fact that a mindful-based intervention known as Dialetic Behavior Therapy has been found to be useful in the treatment of bulimia nervosa (Safer et al., 2001) and binge eating (Telch et al., 2001).
Conflict of Interest Statement
The authors declare that the research was conducted in the absence of any commercial or financial relationships that could be construed as a potential conflict of interest.
Acknowledgments
We would like to thank Beverly Nesbitt for her role in recruitment and screening and Qawi Telesford for making Figure 1. Support for this study was provided by (1) National Heart, Lung, and Blood Institute grant HL076441-01A1, (2) National Institutes for Aging grant P30 AG021332, and (3) General Clinical Research Center grant, M01-RR007122.
References
Alvarez-Hamelin, I., Dall'Asta, L., Barrat, A., and Vespignani, A. (2006). “Large scale networks in fingerprinting and visualization using the k-core decomposition,” in Advances in Neural Information Processing Systems, eds Y. Weiss, B. Scholkopf, and J. Platt (Cambrige, MA: MIT Press), 41–50.
Bandura, A. (1986). Social Foundations of Thought and Action: A Social Cognitive Theory. Englewood Cliffs, NJ: Prentice-Hall.
Barnes, S., Brown, K. W., Krusemark, E., Campbell, W. K., and Rogge, R. D. (2007). The role of mindfulness in romantic relationship satisfaction and responses to relationship stress. J. Marital Fam. Ther. 33, 482–500.
Biswal, B., Yetkin, F. Z., Haughton, V. M., and Hyde, J. S. (1995). Functional connectivity in the motor cortex of resting human brain using echo-planar MRI. Magn. Reson. Med. 34, 537–541.
Bracht, G. H., and Glass, G. V. (1968). The external validity of experiments. Am. Educ. Res. J. 5, 437–474.
Broderick, P. (2005). Mindfulness and coping with dysphoric mood: contrasts with rumination and distraction. Cogn. Ther. Res. 29, 501–510.
Brown, K. W., and Ryan, R. M. (2003). The benefits of being present: mindfulness and its role in psychological well-being. J. Pers. Soc. Psychol. 84, 822–848.
Brown, K. W., Ryan, R. A., and Creswell, J. D. (2007). Mindfulness: theoretical foundations and evidence for its salutary effects. Psychol. Inq. 18, 211–237.
Cepeda-Benito, A., Gleaves, D. H., Williams, T. L., and Erath, S. A. (2000). The development and validation of the state and trait food-cravings questionnaires. Behav. Ther. 31, 151–173.
Creswell, J. D., Way, B. M., Eisenberger, N. I., and Lieberman, M. D. (2007). Neural correlates of dispositional mindfulness during affect labeling. Psychosom. Med. 69, 560–565.
Fox, M. D., Snyder, A. Z., Vincent, J. L., Corbetta, M., Van Essen, D. C., and Raichle, M. E. (2005). The human brain is intrinsically organized into dynamic, anticorrelated functional networks. Proc. Natl. Acad. Sci. U.S.A. 102, 9673–9678.
Hagmann, P., Cammoun, L., Gigandet, X., Meuli, R., Honey, C. J., Wedeen, V., and Spoons, O. (2008). Mapping the structural core of human cerebral cortex. Plos Biol. 6:e159. doi: 10.1371/journal.pbio.0060159
Hayasaka, S., and Laurienti, P. J. (2010). Comparison of characteristics between region-and voxel-based network analyses in resting-state fMRI data. Neuroimage 50, 499–508.
Keng, S. L., Smoski, M. J., and Robins, C. J. (2011). Effects of mindfulness on psychological health: a review of empirical studies. Clin. Psychol. Rev. 31, 1041–1056.
Kutlesic, V., Williamson, D. A., Gleaves, D. H., Barbin, J. M., and Murphy-Eberenz, K. P. (1998). The Interview for the Diagnosis of Eating Disorders IV: application to DSM-IV diagnostic criteria. Psychol. Assess. 10, 41–48.
Lakey, C. E., Campbell, W. K., Brown, K. W., and Goodie, A. S. (2007). Dispositional mindfulness as a predictor of the severity of gambling outcomes. Pers. Indiv. Diff. 43, 1698–1710.
Latora, V., and Marchiori, M. (2001). Efficient behavior of small-world networks. Phys. Rev. Lett. 87, 1–4.
Lowe, M. R., Butryn, M. L., Didie, E. R., Annunziato, R. A., Thomas, J. G., Crerand, C. E., Ochner, C. N., Coletta, M. C., Bellace, D., Wallaert, M., and Halford, J. (2009). The power of food scale. A new measure of the psychological influence of the food environment. Appetite 53, 114–118.
Maldjian, J. A., Laurienti, P. J., Kraft, R. A., and Burdette, J. H. (2003). An automated method for neuroanatomic and cytoarchitectonic atlas-based interrogation of fMRI data sets. Neuroimage 19, 1233–1239.
Moussa, M. N., Vechlekar, C. D., Burdette, J. H., Steen, M. R., Hugenschmidt, C. E., and Laurienti, P. J. (2011). Changes in cognitive state alter human functional brain networks. Front. Hum. Neurosci. 5:83. doi: 10.3389/fnhum.2011.00083
Ogawa, S., Lee, T. M., Kay, A. R., and Tank, D. W. (1990). Brain magnetic-resonance-imaging with contrast dependent on blood oxygenation. Proc. Natl. Acad. Sci. U.S.A. 87, 9868–9872.
Raichle, M. E., MacLeod, A. M., Snyder, A. Z., Powers, W. J., Gusnard, D. A., and Shulman, G. L. (2001). A default mode of brain function. Proc. Natl. Acad. Sci. U.S.A. 98, 676–682.
Rejeski, W. J., Mihalko, S. L., Ambrosius, W. T., Bearon, L. B., and McClelland, J. W. (2011). Weight loss and self-regulatory eating efficacy in older adults: the cooperative lifestyle intervention program. J. Gerontol. Psychol. Sci. 66, 279–286.
Rosenbaum, M., and Leibel, R. L. (2010). Adaptive thermogenesis in humans. Int. J. Obes. 34, S47–S55.
Ryan, R. M., and Deci, E. L. (2004). “Automony is no illusion: self determination theory and the empirical study of authenticity, awareness, and will,” in Handbook of Experimental Existential Psychology, eds J. Greenberg, S.L. Koole, and T. Pyszcynski (New York, NY: Guilford), 449–479.
Safer, D. L., Telch, C. F., and Agras, W. S. (2001). Dialectical behavior therapy for bulimia nervosa. Am. J. Psychiatry 158, 632–634.
Smith, S. M., Jenkinson, M., Woolrich, M. W., Beckmann, C. F., Behrens, T. E., Johansen-Berg, H., Bannister, P. R., De Luca, M., Drobnjak, I., Flitney, D. E., Niazy, R. K., Saunders, J., Vickers, J., Zhang, Y., De Stefano, N., Brady, J. M., and Matthews, P. M. (2004). Advances in functional and structural MR image analysis and implementation as FSL. Neuroimage 23(Suppl. 1), S208–S219.
Telch, C. F., Agras, W. S., and Linehan, M. M. (2001). Dialectical behavior therapy for binge eating disorder. J. Consult. Clin. Psychol. 69, 1061–1065.
Tzourio-Mazoyer, N., Landeau, B., Papathanassiou, D., Crivello, F., Etard, O., Delcroix, N., Mazoyer, B., and Joliet, M. (2002). Automated anatomical labeling of activations in SPM using a macroscopic anatomical parcellation of the MNI MRI single-subject brain. Neuroimage 15, 273–289.
Weinstein, N., Brown, K. W., and Ryan, R. M. (2009). A multi-method examination of the effects of mindfulness on stress attribution, coping, and emotional well-being. J. Res. Pers. 43, 374–385.
Keywords: networks, mindfulness, food cues, obesity, aging, craving, self-efficacy
Citation: Paolini B, Burdette JH, Laurienti PJ, Morgan AR, Williamson DA and Rejeski WJ (2012) Coping with brief periods of food restriction: mindfulness matters. Front. Ag. Neurosci. 4:13. doi: 10.3389/fnagi.2012.00013
Received: 08 February 2012; Accepted: 16 May 2012;
Published online: 06 June 2012.
Edited by:
Emil C. Toescu, Birmingham University, UKReviewed by:
Rongqiao He, Institute of Biophysics, ChinaJin-Jing Pei, Karolinska Institutet, Sweden
Emil C. Toescu, Birmingham University, UK
Copyright: © 2012 Paolini, Burdette, Laurienti, Morgan, Williamson and Rejeski. This is an open-access article distributed under the terms of the Creative Commons Attribution Non Commercial License, which permits non-commercial use, distribution, and reproduction in other forums, provided the original authors and source are credited.
*Correspondence: W. Jack Rejeski, Department of Health and Exercise Science, Wake Forest University, Box 7868, Winston-Salem, NC 27109, USA. e-mail: rejeski@wfu.edu