Advanced BrainAGE in older adults with type 2 diabetes mellitus
 Katja Franke
 Christian Gaser
 Brad Manor
 Vera Novak
- 1Structural Brain Mapping Group, Department of Psychiatry, Jena University Hospital, Jena, Germany
- 2Department of Neurology, Jena University Hospital, Jena, Germany
- 3Institute for Aging Research, Hebrew SeniorLife, Boston, MA, USA
- 4Division of Gerontology, Beth Israel Deaconess Medical Center, Harvard Medical School, Boston, MA, USA
- 5Department of Neurology, Stroke Division, Harvard Medical School, Boston, MA, USA
Aging alters brain structure and function and diabetes mellitus (DM) may accelerate this process. This study investigated the effects of type 2 DM on individual brain aging as well as the relationships between individual brain aging, risk factors, and functional measures. To differentiate a pattern of brain atrophy that deviates from normal brain aging, we used the novel BrainAGE approach, which determines the complex multidimensional aging pattern within the whole brain by applying established kernel regression methods to anatomical brain magnetic resonance images (MRI). The “Brain Age Gap Estimation” (BrainAGE) score was then calculated as the difference between chronological age and estimated brain age. 185 subjects (98 with type 2 DM) completed an MRI at 3Tesla, laboratory and clinical assessments. Twenty-five subjects (12 with type 2 DM) also completed a follow-up visit after 3.8 ± 1.5 years. The estimated brain age of DM subjects was 4.6 ± 7.2 years greater than their chronological age (p = 0.0001), whereas within the control group, estimated brain age was similar to chronological age. As compared to baseline, the average BrainAGE scores of DM subjects increased by 0.2 years per follow-up year (p = 0.034), whereas the BrainAGE scores of controls did not change between baseline and follow-up. At baseline, across all subjects, higher BrainAGE scores were associated with greater smoking and alcohol consumption, higher tumor necrosis factor alpha (TNFα) levels, lower verbal fluency scores and more severe deprepession. Within the DM group, higher BrainAGE scores were associated with longer diabetes duration (r = 0.31, p = 0.019) and increased fasting blood glucose levels (r = 0.34, p = 0.025). In conclusion, type 2 DM is independently associated with structural changes in the brain that reflect advanced aging. The BrainAGE approach may thus serve as a clinically relevant biomarker for the detection of abnormal patterns of brain aging associated with type 2 DM.
Introduction
The global prevalence of type 2 diabetes mellitus (DM) is projected to rise sharply over the coming decades. Individuals aged 65 years and older have a particularly high risk of developing diabetes complications, due to the combination of both modifiable (i.e., lifestyle), and non-modifiable risk factors (Zimmet et al., 2001). Within this population, type 2 DM has been linked to increased brain atrophy (Araki et al., 1994; Schmidt et al., 2004; Last et al., 2007; De Bresser et al., 2010; Van Elderen et al., 2010; Novak et al., 2011), impaired cognitive function (Reijmer et al., 2011), increased risk of depression (Anderson et al., 2001; Ali et al., 2006) and dementia, including both vascular dementia and Alzheimer's disease (AD) (Janson et al., 2004; Xu et al., 2004; Biessels et al., 2006; Velayudhan et al., 2010; Tan et al., 2011; Cheng et al., 2012).
Chronic hyperglycemia is associated with vascular disease and neurotoxicity leading to neuronal damage (Tomlinson and Gardiner, 2008). Within the brain, hyperglycemia appears to induce structural abnormalities resembling the progressive, widespread atrophy often associated with biological aging (Gispen and Biessels, 2000; Biessels et al., 2006). Moreover, within the DM population, such generalized atrophy may be detected at an earlier age (Araki et al., 1994). Clinical manifestations of DM-related brain abnormalities include worse functional status (Stewart and Liolitsa, 1999; Biessels et al., 2006), deficits in cognition [i.e., verbal memory, mental flexibility, and processing speed (Gispen and Biessels, 2000; Cheng et al., 2012)], and depression (Heuser, 2002; Wolkowitz et al., 2010, 2011; Katon et al., 2012). As such, recognition and quantification of subtle deviations from aging-related brain atrophy may afford prospective identification and subsequent treatment of patients with DM who are at risk for clinically-significant functional decline.
Based on the widespread but well-ordered brain tissue loss that occurs with healthy aging into senescence (Good et al., 2001), we previously proposed a modeling approach to identify abnormal aging-related brain atrophy that may precede the onset of clinical symptoms. We introduced a novel BrainAGE approach (Franke et al., 2010, 2012b) based on a database of single time-point structural magnetic resonance imaging (MRI) data that aggregates the complex, multidimensional aging patterns across the whole brain to one single value, i.e., the estimated brain age (Figure 1A). Consequently, subtle deviations in “normal” brain atrophy can be directly quantified in terms of years by analyzing only one standard MRI scan per subject (Figure 1B). Recently, we demonstrated that the BrainAGE approach enables the identification of advanced brain aging in subjects with mild cognitive impairment and AD, and observed profound relationships between BrainAGE, disease severity, prospective worsening of cognitive functions (Franke et al., 2012a), conversion to AD (Gaser et al., 2013), as well as certain health and lifestyle markers (e.g., the metabolic syndrome; Franke et al., 2013).
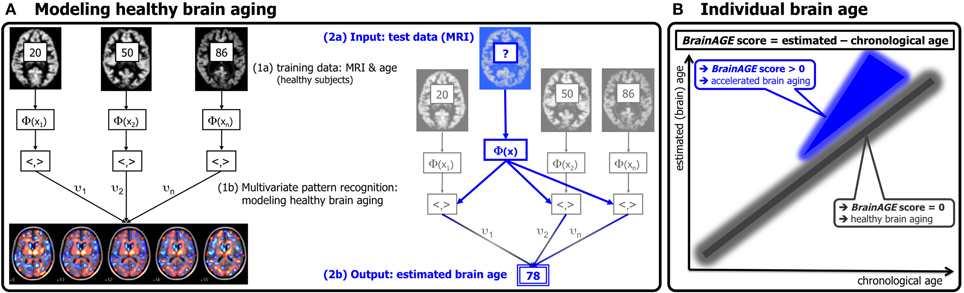
Figure 1. Depiction of the BrainAGE concept. (A) The model of healthy brain aging is trained with the chronological age and preprocessed structural MRI data of a training sample (left; with an exemplary illustration of the most important voxel locations that were used by the age regression model). Subsequently, the individual brain ages of previously unseen test subjects are estimated, based on their MRI data [blue; picture modified from Schölkopf and Smola (2002)]. (B) The difference between the estimated and chronological age results in the BrainAGE score. Consequently, positive BrainAGE scores indicate accelerated brain aging. [Image reproduced from Franke et al. (2012a), with permission from Hogrefe Publishing, Bern]?, unknown age.
In this study, we implemented the BrainAGE method to quantify the effects of type 2 DM on individual brain aging in non-demented older adults. We further explored the relationships between individual brain aging and clinically significant lifestyle risk factors (i.e., smoking duration, alcohol intake), clinical laboratory data [i.e., fasting blood glucose level as a potential indicator of hyperglycemia, tumor necrosis factor alpha (TNFα) as a potential indicator of persistent inflammation], and common clinical outcomes (i.e., cognition, depression). We hypothesized that type 2 DM is associated with greater BrainAGE scores, and that clinically significant risk factors additionally contribute to this process. We also hypothesized that those individuals with greater BrainAGE scores would also exhibit worse outcomes related to cognition and depression.
Research Design and Methods
Subjects
To train the age estimation framework, we used MRI data of 561 healthy subjects [250 males] from the publicly accessible IXI cohort (http://www.brain-development.org; data downloaded in September 2011) aged 20–86 years [mean (SD) = 48.6 (16.5) years; for more sample details see Franke et al. (2010)].
The current BrainAGE analyses were conducted using existing records of 185 subjects (98 with diagnosed type 2 DM; Table 1) who previously participated in studies within the Syncope and Falls in the Elderly (SAFE) Laboratory at the Beth Israel Deaconess Medical Center (BIDMC). A subset of these subjects (n = 25, 12 with type 2 DM; Table 2) also completed a follow-up MR scan after an average of 3.8 years (SD = 1.5).
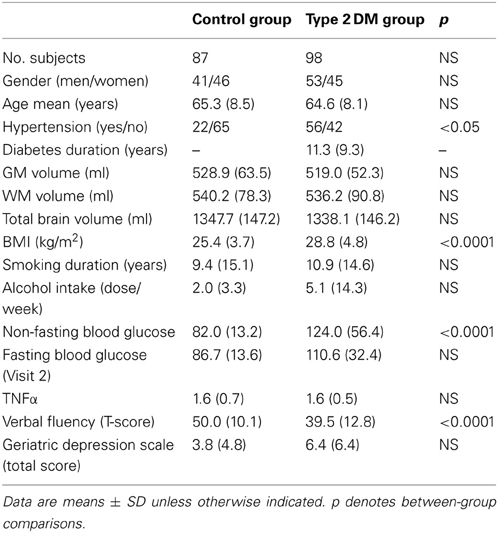
Table 1. Demographic and clinical variables of the cross-sectional control and type 2 DM groups.
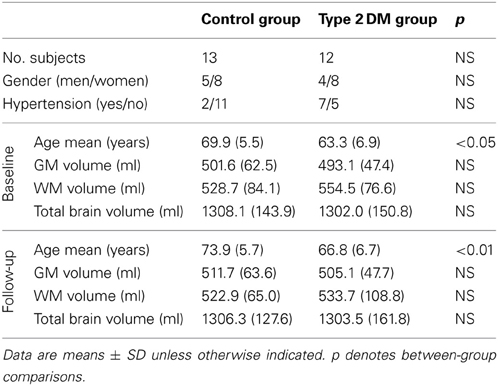
Table 2. Demographic and clinical variables of the longitudinal subsample.
Participants were recruited consecutively via advertisement in the local community and provided informed consent as approved by the Institutional Review Board. Controls were required to have normal fasting glucose, but had a similar distribution of risk factors. All participants were screened with a medical history and physical and laboratory examinations. Participants with DM were treated with insulin, oral glucose-control agents (sulfonylurea, second generation agents or their combinations), or diet only. Several participants in each group were treated for hypertension and/or hypercholesterolemia. Excluded were participants with type 1 DM, a history of stroke, myocardial infarction within 6 months, and other clinically important cardiac diseases, arrhythmias, significant nephropathy, kidney or liver transplant, renal or congestive heart failure, carotid artery stenosis (over 50% by medical history and MR angiography), neurological or other systemic disorders; claustrophobia, metal implants, pacemakers, arterial stents incompatible with 3Tesla MRI. All participants were admitted to the Clinical Research Center for an overnight stay. Laboratory chemistries were collected after overnight fasting, and MRI was done before noon. Functional clinical outcomes were acquired through a battery of neuropsychological tests, including assessments for learning and memory, depression, and physical function.
In order to quantify the relationship between BrainAGE scores, life-style risk factors and clinical outcomes, the following data were extracted: body mass index (BMI), smoking duration, alcohol intake, non-fasting blood glucose levels, parameters of diabetes control (duration, fasting blood glucose levels), common clinical outcomes [i.e., verbal fluency, more specifically “semantic fluency,” requiring the generation of exemplars of the category “animals” (Harrison et al., 2000; Fisher et al., 2004) and depression as measured with the Geriatric Depression Scale (GDS; Yesavage, 1988)], and inflammation markers (TNFα).
Magnetic Resonance Imaging
All studies were performed within the Center for Advanced MR Imaging at the BIDMC on the same 3Tesla GE HDx MRI scanner using a quadrature and phase array head coils (GE Medical Systems, Milwaukee, WI). Anatomical images were acquired using 3-D magnetization prepared rapid gradient echo (MP-RAGE) (TR/TE/TI = 7.8/3.1/600 ms, 3.0 mm slice thickness, 52 slices, bandwidth = 122 Hz per pixel, flip angle = 10°, 24 cm × 24 cm FOV, 256 × 192 matrix size) and fluid attenuated inversion recovery (FLAIR) (TR/TE/TI = 11000/161/2250 ms, 5 mm slice thickness, 30 slices, bandwidth = 122 Hz per pixel, flip angle = 90°, 24 cm × 24 cm FOV, 256 × 160 matrix size) sequences.
Preprocessing of MRI Data and Data Reduction
Preprocessing of the T1-weighted images was done using the SPM8 package (http://www.fil.ion.ucl.ac.uk/spm) and the VBM8 toolbox (http://dbm.neuro.uni-jena.de), running under MATLAB. All T1-weighted images were corrected for bias-field inhomogeneities, then spatially normalized and segmented into gray matter (GM), white matter (WM), and cerebrospinal fluid (CSF) within the same generative model (Ashburner and Friston, 2005). The segmentation procedure was extended by accounting for partial volume effects (Tohka et al., 2004), by applying adaptive maximum a posteriori estimations (Rajapakse et al., 1997), and by using a hidden Markov random field model (Cuadra et al., 2005; Gaser, 2009). The images were processed with affine registration and smoothed with 8-mm full-width-at-half-maximum smoothing kernels. Spatial resolution was set to 8 mm. For further data reduction, principal component analysis (PCA) was performed on the training sample with subsequently applying the estimated transformation parameters to the test sample. PCA was done using the “MATLAB Toolbox for Dimensionality Reduction” (http://homepage.tudelft.nl/19j49/Matlab_
Toolbox_for_Dimensionality_Reduction.html), running under MATLAB.
Age Estimation Framework
The BrainAGE framework utilizes a machine-learning pattern recognition method, namely relevance vector regression (RVR; Tipping, 2001). It was recently developed to estimate individual brain ages based on T1-weighted images (Franke et al., 2010). In general, the model is trained with preprocessed whole brain structural MRI data of the training sample (here: the IXI sample). Subsequently, the brain age of each test subject can be estimated using the individual tissue-classified MRI data, aggregating the complex, multidimensional aging pattern across the whole brain into one single value (Figure 1A). The difference between estimated and true chronological age will reveal the individual brain age gap estimation (BrainAGE) score. Consequently, the BrainAGE score directly quantifies the amount of acceleration or deceleration of brain aging. For example, if a 70 years old individual has a BrainAGE score of +5 years, this means that this individual shows the typical atrophy pattern of a 75 years old individual (Figure 1B). Recent work has demonstrated that this method provides reliable and stable estimates (Franke et al., 2012a). Specifically, the BrainAGE scores calculated from two shortly delayed scans on the same MRI scanner, as well as on separate 1.5T and 3.0T scanners, produced intraclass correlation coefficients (ICC) of 0.93 and 0.90, respectively.
Within this study, the BrainAGE framework was applied using the linear combination of preprocessed (as described in the section “Preprocessing of MRI data and data reduction”) GM and WM images. For training the model as well as for predicting individual brain ages, we used “The Spider” (http://www.kyb.mpg.de/bs/people/spider/main.html), a freely available toolbox running under MATLAB. For an illustration of the most important features (i.e., the importance of voxel locations for regression with age) that were used by the RVR to model normal brain aging and more detailed information please refer to Franke et al. (2010).
Statistical Analysis
Descriptive statistics were used to summarize all variables. Demographic and laboratory data were compared between the control and the DM groups using analysis of variance (ANOVA) for continuous variables or Kruskal–Wallis tests for categorical variables and variables that were not normally distributed. Normality was tested using Shapiro–Wilk tests. Cross-sectionally, within-group differences between estimated brain age and chronological age were tested using Student's t-test.
The effect of DM on BrainAGE was determined with ANOVA. The dependent variable was the BrainAGE score. Model effects included group (i.e., DM and non-DM controls), hypertension (i.e., with/without hypertension), and gender.
Relationships between BrainAGE and clinical parameters were then analyzed in the whole sample (i.e., DM and non-DM subjects together), controlling for age, gender, and diabetes duration (with diabetes duration = 0 years for non-DM controls). As not all subjects had values for all clinical variables, univariate correlation analyses were used (instead of multivariate models) to assess the relationships between BrainAGE and distinguished lifestyle measures (i.e., BMI, smoking duration, alcohol intake), clinical laboratory data (i.e., fasting blood glucose level, TNFα) and functional measures (i.e., T-score for verbal fluency, total GDS score for depression). In order to control for covariates, Pearson's pairwise correlation were used for normally distributed variables, and Spearman's correlations were used for variables that are not normally distributed, with adjustment for age, gender, and diabetes duration (right-tailed for verbal fluency, left-tailed for all others). To control for multiple comparisons, Bonferroni–Holm correction (Holm, 1979) was applied, adjusting the p-value for the number of variables analyzed (i.e., 7).
The effect of diabetes-status within the relationships between BrainAGE and lifestyle parameters, clinical laboratory data and outcome measures were investigated by performing analysis of covariance (ANCOVA). Each specific ANCOVA included all those subjects who were measured in each specific clinical variable, sub-grouped by DM. Since fasting blood glucose levels were provided for only three non-DM control subjects, this variable was excluded from this analysis. For all other variables, the model fitted separate lines for both groups, thus, allowing the intercept as well as the slopes to vary between both groups.
To further explore the relationship between BrainAGE and clinical parameters, the whole sample was divided into quartiles for each of the significantly related lifestyle measures (i.e., smoking duration, alcohol intake), clinical laboratory data (i.e., fasting blood glucose level, TNFα), and outcome measures (i.e., verbal fluency, depression). To illustrate the relationships between individual brain aging and extreme levels in each of these variables, the BrainAGE scores in the 1st quartile (lowest 25% of values) of each lifestyle and functionality measure were tested against the BrainAGE scores in 4th quartile (highest 25% of values) of each lifestyle and functionality measure, using one-tailed t-tests (right-tailed for verbal fluency, left-tailed for all others). Bonferroni–Holm-adjusted p-values were used to determine significance.
Within the subsample that completed two MRI scans, the longitudinal changes in individual BrainAGE scores were fitted against time between both scans with a multivariate linear regression model. BrainAGE scores at baseline and follow-up visit, as well as longitudinal changes in BrainAGE were compared between both groups using ANOVA.
The Shapiro–Wilk test was performed using JMP 9.0 (www.jmp.com). All other testing was performed using MATLAB 7.11. (www.mathworks.com).
Results
Group Characteristics
All variables except diabetes duration, BMI, alcohol intake and GDS scores were normally distributed. Age, gender, GM, WM, and total brain volumes did not differ between groups (Table 1). The DM group had higher BMI (p < 0.0001), higher non-fasting blood glucose levels (p < 0.0001), greater prevalence of hypertension (p < 0.05), and worse performance in verbal fluency (p < 0.0001) than controls (Table 1).
Cross-Sectional BrainAGE Analyses
Although brain volumes did not differ between the groups, the DM subjects had significantly higher BrainAGE scores than controls (F = 17.2; p = 0.0001; Figure 2). Additionally, BrainAGE scores did not correlate to brain volumes (Figure 3). Within the control group, estimated brain age was similar to chronological age [t(0.975, 86) = 0.0; p = 1.0]. In DM subjects, however, the average BrainAGE score was 4.6 years (SD = 7.2); i.e., their estimated brain age was 4.6 years greater than their chronological age [t(0.975, 97) = 6.4; p = 0.0001]. Additionally, within the DM group, those with longer diabetes duration had higher BrainAGE scores (r = 0.31, p = 0.019). This relationship was independent of age, gender, and duration of hypertension history.
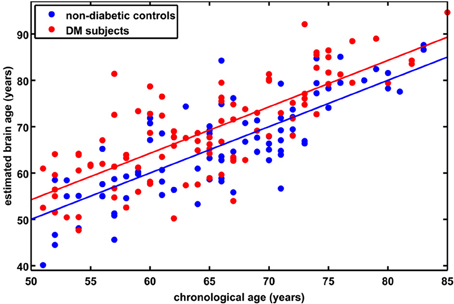
Figure 2. Estimated brain age vs. chronological age for controls and subjects with type 2 DM. The BrainAGE scores (i.e., the difference between the estimated and the chronological age) differed between groups, with mean (± SD) BrainAGE scores of 0.0 ± 6.7 years in healthy controls (blue) and 4.6 ± 7.2 years in type 2 DM subjects (red; p < 0.0001).
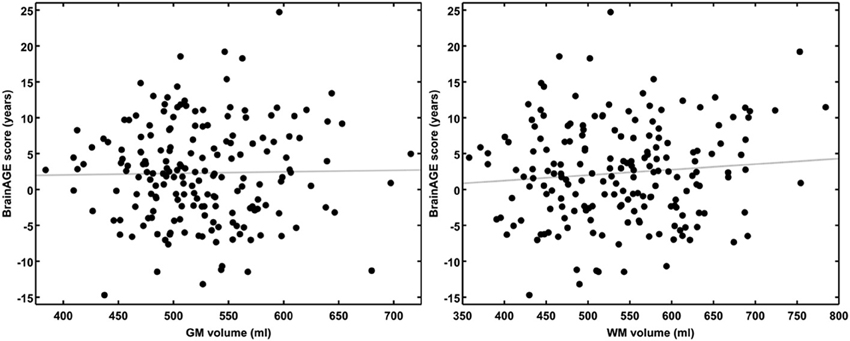
Figure 3. BrainAGE scores plotted against GM and WM volumes for all subjects. BrainAGE scores did not correlate to either GM (left; r = 0.02, p = 0.81) or WM volumes (right; r = 0.09, p = 0.20).
Across all subjects, BrainAGE scores were higher in males as compared to females (F = 7.7; p = 0.006). There were no effects for hypertension (F = 0.0; p = 0.9), or any interaction (group * hypertension: F = 0.6; p = 0.46; group * gender: F = 0.7; p = 0.41; hypertension * gender: F = 0.1; p = 0.79).
Across all subjects, higher BrainAGE scores were significantly correlated with lifestyle factors, i.e., increased duration of smoking (r = 0.20, p = 0.007) and greater alcohol consumption (r = 0.24, p = 0.001), as well as clinical laboratory data, i.e., higher fasting blood glucose (r = 0.34, p = 0.025) and TNFα (r = 0.29, p = 0.01) levels. Higher BrainAGE scores were also correlated with lower verbal fluency (r = −0.25, p = 0.006) and higher depression scores (r = 0.23, p = 0.012). All correlations were independent of age, gender, and diabetes duration.
Additionally, ANCOVAs were performed to investigate the effects of DM status on the relationships between BrainAGE scores and distinguished lifestyle factors, clinical variables, and outcome measures. Although BrainAGE scores were generally higher in DM subjects, higher BrainAGE scores were also related to increased smoking duration (F = 5.13, p < 0.05), increased alcohol intake (F = 7.63, p < 0.01), increased TNFα (F = 6.24, p < 0.05), decreased verbal fluency (F = 4.07, p < 0.05), and increased GDS scores (F = 7.17, p < 0.01) in DM subjects as well as in non-DM controls (Table 3, Figure 4).
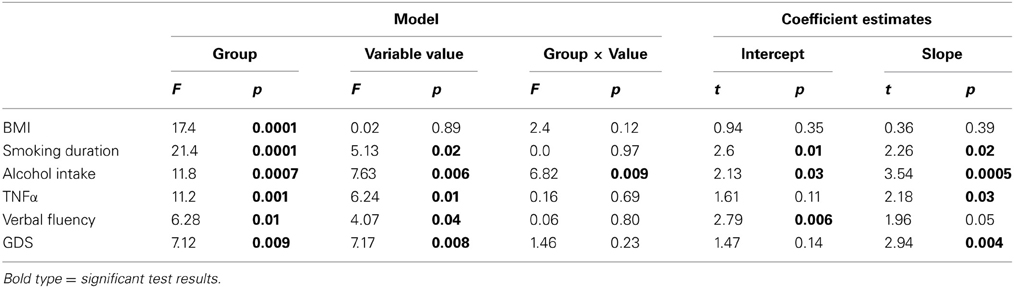
Table 3. ANCOVA results for BrainAGE scores and distinguished variables.
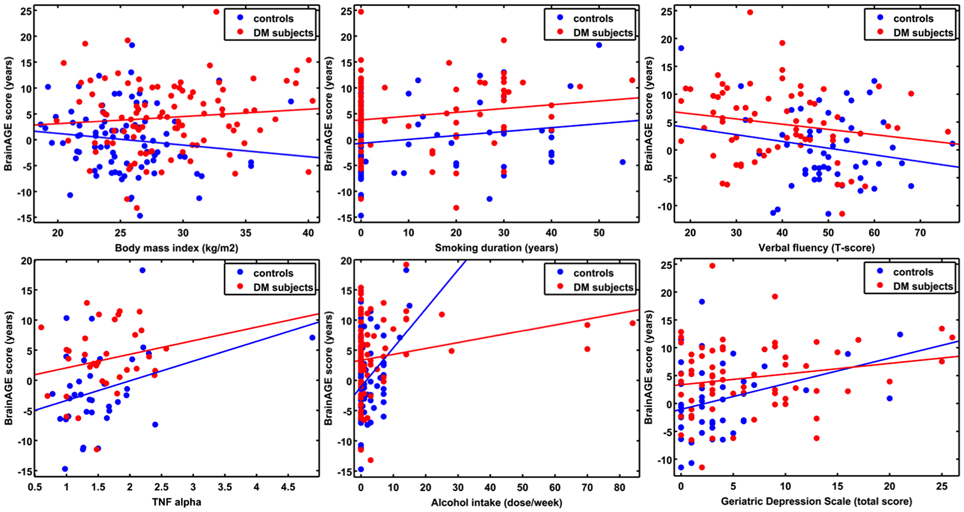
Figure 4. ANCOVA plots for BrainAGE scores and distinguished variables. BrainAGE scores are plotted against BMI, smoking duration, alcohol intake, TNFα, verbal fluency, and GDS scores for non-DM controls (blue) and subjects with type 2 DM (red). In both groups, higher BrainAGE scores were significantly related to increased smoking duration (p < 0.05), increased alcohol intake (p < 0.01), increased TNFα (p < 0.05), decreased verbal fluency (p < 0.05), and increased GDS scores (p < 0.01).
To exemplarily quantify the relationship between brain atrophy and lifestyle factors, clinical laboratory data and functionality, the BrainAGE scores of subjects with the lowest values in those measures (i.e., 1st quartile) vs. subjects with the highest values in those measures (i.e., 4th quartile) were contrasted (Table 4; Figure 5). These analyses resulted in significant differences in BrainAGE of 3.4 years for smoking duration (p = 0.004), 4.1 years for alcohol intake (p = 0.003), 5.5 years for fasting blood glucose (p = 0.02), 5.4 years for TNFα (p = 0.006), 5.6 years for verbal fluency (p = 0.001), and 5.4 years for depression scores (p = 0.002).
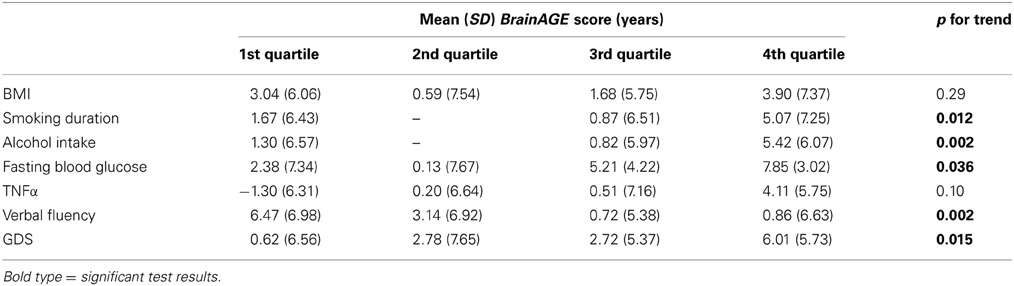
Table 4. Comparison of BrainAGE scores between the quartile groups in the whole sample.
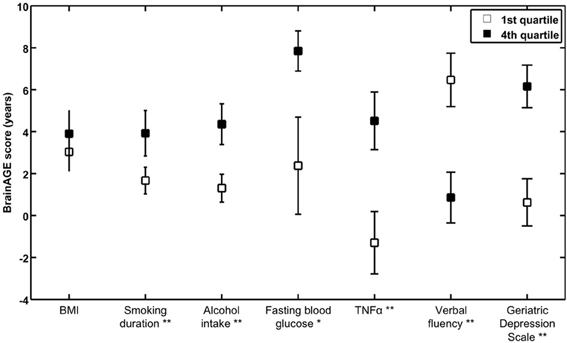
Figure 5. Quartile analyses. Mean BrainAGE scores in subjects with values in the 1st and 4th quartiles of distinguished variables. Error bars depict the standard error of the mean (SEM). *p < 0.05, **p < 0.01.
Longitudinal BrainAGE Analyses
A subsample of 25 subjects (12 DM subjects and 13 controls) completed a second MRI scan 3.8 ± 1.5 years after their baseline assessment. In this subsample, GM, WM as well as total brain volumes did not differ between groups (Table 2), or across time points (GM volume: p = 0.48; WM volume: p = 0.58; total brain volume: p = 0.99). Interestingly, however, we observed a change in BrainAGE over time that was dependent upon group (F = 6.9; p = 0.015; Figure 6). Specifically, as compared to baseline, average BrainAGE scores increased in DM subjects by 0.2 years per follow-up year. Within the control group, as expected, BrainAGE scores were similar to chronological age at baseline and follow-up and therefore, did not change over time. In other words, whereas the BrainAGE scores of patients with DM were on average 5.1 years higher than controls at baseline (F = 6.2; p = 0.020), they were on average 5.9 years higher than controls at follow-up (F = 5.0; p = 0.034).
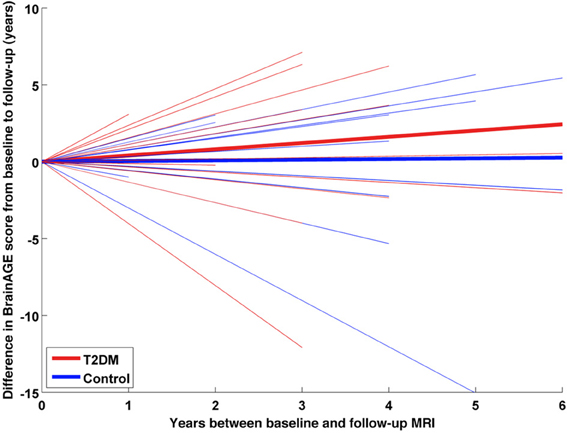
Figure 6. Longitudinal BrainAGE changes in controls and type 2 DM subjects. Longitudinal changes in BrainAGE scores for non-DM control subjects (blue) and type 2 DM subjects (red). Thin lines represent individual changes in BrainAGE over time; thick lines indicate estimated average changes for each group. The change in BrainAGE over time was dependent upon group (p = 0.01), providing preliminary longitudinal evidence that type 2 DM accelerates brain aging.
Discussion
This study implemented a novel MRI-based biomarker that comprises well-established and fully automated steps for processing standard T1-weighted MR images, aggregating the complex, multidimensional aging pattern across the whole brain into one single value; i.e., the BrainAGE score. This method has the advantage of accurately and reliably estimating brain age with minimal preprocessing and parameter optimization (Franke et al., 2010, 2012b), using a single anatomical scan. The BrainAGE score directly quantifies subtle deviations from the normal brain-aging pattern and may therefore provide clinically important prognostic information.
In this study, the BrainAGE approach was used to determine the effects of type 2 DM on brain aging. Although GM, WM, and total brain volumes did not differ between groups, BrainAGE scores were on average 4.6 years greater in DM subjects as compared to non-DM controls. Moreover, BrainAGE scores tended to be higher in those with longer diabetes duration and higher fasting blood glucose levels, suggesting a potential link between worse glycemic control and pathologic brain atrophy. Longitudinal analyses further indicated that DM might result in greater increases in BrainAGE scores over time (despite no detectable change in global brain tissue volumetrics). Together, these results suggest that the BrainAGE score may be sensitive to subtle, glucose-mediated structural brain changes that reflect a pattern of premature brain aging (Araki et al., 1994; Gispen and Biessels, 2000; Biessels et al., 2006; Van Elderen et al., 2010; Velayudhan et al., 2010; Tan et al., 2011).
This study also revealed that individual brain aging was correlated with numerous clinical outcomes. Across all subjects, and independently of diabetes duration, age, and gender, those with higher BrainAGE scores consumed more alcohol. This observation is supported by recent studies suggesting a U-shaped relationship between alcohol consumption and cognitive impairment (Anttila et al., 2004; Solfrizzi et al., 2008). Higher BrainAGE scores were also linked to increased TNFα levels, which are now believed to play a central role in the pathogenesis of AD (Tobinick and Gross, 2008). To this end, those with higher BrainAGE scores also tended to have worse verbal fluency. Finally, those subjects with higher BrainAGE scores were more likely to have more severe depressive symptoms, which is in line with recent studies linking depression to both advanced brain aging (Heuser, 2002; Wolkowitz et al., 2010, 2011) as increased risk of dementia (Katon et al., 2012).
The BrainAGE approach was designed to recognize and indicate deviations in age-related spatiotemporal brain changes. Subjects with a high BrainAGE score may thus be at risk for several neurodegenerative diseases and related functional declines. Higher BrainAGE scores as well as profound correlations to disease severity and prospective worsening of cognitive functions have already been observed in subjects with mild cognitive impairment and AD (Franke et al., 2012a). The BrainAGE approach was even capable of identifying subjects who will be diagnosed with AD up to three years in advance, with each additional year in the BrainAGE score being associated with a 10% greater risk of developing AD (Gaser et al., 2013). As such, larger prospective trials are warranted to confirm our initial observation that type 2 DM leads to premature brain aging, and to determine whether this pattern is similar to those of other neurodegenerative diseases. In future research, we aim to further explore and disentangle age- and unrelated disease-based processes of brain atrophy in neurodegenerative diseases (e.g., vascular dementia, AD) as well as its effects on BrainAGE estimations.
In the present study, there was considerable variance associated with individual BrainAGE scores, as well as intra-individual changes in BrainAGE scores over time. As we have previously reported (Franke et al., 2013), and confirmed in this study, a number of nutrition, lifestyle, and health parameters likely contribute to this variance. For example, in older male adults without major disease, 39% of the inter-subject variance in BrainAGE was explained by the set of clinical markers under consideration, with markers of the metabolic syndrome mainly contributing to this variance (Franke et al., 2013). As individual changes in lifestyle (e.g., smoking cessation, physical activity, intake of unsaturated fatty acids, moderate alcohol intake) were shown to lower the risk of cognitive decline and dementia (Erickson et al., 2010; Frisardi et al., 2010; Nepal et al., 2010), such lifestyle changes may be also related to a decrease in individual BrainAGE. Future research is therefore warranted to determine the effects of individual health and lifestyle modification, as well as improved DM control (e.g., a lowering of blood glucose levels), on longitudinal changes in individual BrainAGE scores.
It is of note that WM lesions, which occur primarily due to cerebro-vascular diseases (Hadjidemetriou et al., 2008; Zhan et al., 2009), are not detected in the segmentation approach used within the BrainAGE analysis. Such lesions segmented as GM may therefore influence the RVR. However, as the prevalence of WM lesions was minimal in the current cohort, it is unlikely that this limitation influenced the training of “normal brain aging.” Thus, even though the current BrainAGE method has high test-retest reliability (Franke et al., 2012a), it may benefit from the development and implementation of segmentation methods that enable automated detection of WM lesions even without any additional FLAIR sequence (Klöppel et al., 2011).
As not all subjects had values for all clinical variables, we were unable to utilize multivariate models to examine the relationship between BrainAGE and health-related outcomes, as this approach would have resulted in an extreme reduction in sample size (n = 17). Future studies with larger samples are therefore needed to enable multivariate analyses designed to identify the complex interactions between brain aging, lifestyle factors, and clinical outcomes. Moreover, as our prospective cohort was rather small, it still remains unclear whether the presence of type 2 DM and/or lifestyle risk factors represents the cause or consequence of observed associations. Further research is therefore needed to extend our results on the longitudinal relationships between individual brain aging and miscellaneous risk factors (e.g., diabetes, lifestyle, depression) in a larger population-based sample. Furthermore, the relationship between the duration of exposure to risk factors and accelerated brain aging, and whether reversal of modifiable factors might decelerate the progression of brain aging, should be explored.
As BrainAGE scores are calculated from a single T1-weighted MRI per subject, using processing techniques that can be fully automated with multi-center data, this approach may be easily implemented into clinical practice in order to encourage the identification of subtle, yet clinically-significant, changes in brain structure. With regards to type 2 DM, the implications of this study may lead to a clinical tool that identifies people at risk of faster degradation of brain structure and function and potential risk for dementias, thus, contributing to an early diagnosis of neurodegenerative diseases and facilitating early treatment or preventative interventions.
Author Contributions
Katja Franke is the guarantor of this work and, as such, had full access to all the data in the study and takes responsibility for the integrity of the data and the accuracy of the data analysis. Katja Franke analyzed data, wrote the manuscript, and edited the manuscript. Christian Gaser contributed to discussion and reviewed manuscript. Brad Manor researched data, contributed to discussion and reviewed/edited manuscript. Vera Novak researched data, contributed to discussion and reviewed/edited manuscript.
Conflict of Interest Statement
The authors declare that the research was conducted in the absence of any commercial or financial relationships that could be construed as a potential conflict of interest.
Acknowledgments
Katja Franke MA and Christian Gaser PhD—are funded by grants from Bundesministerium für Bildung und Forschung (BMBF) 01EV0709 and the European Community FP7 HEALTH, Project 279281 (BrainAge). Novak Vera MD PhD—is funded by grants from NIH-NIA 1R01- AG0287601A2, NIH-NIDDK 5R21 DK084463, and was funded by grants from American Diabetes Association, Clinical 1-03-CR-23 and 1-06-CR-25 related to this study. Brad Manor—is supported by a KL2 Medical Research Investigator Training (MeRIT) award (1KL2RR025757-04) from Harvard Catalyst. The content of this article is solely the responsibility of the authors and does not necessarily represent the official views of the BMBF, National Center for Research Resources, or NIH. No potential conflicts of interest to this article were reported. Part of the study was presented at the 18th Annual Meeting of the Organization for Human Brain Mapping to be held June 10-14, 2012 in Beijing, China.
References
Ali, S., Stone, M. A., Peters, J. L., Davies, M. J., and Khunti, K. (2006). The prevalence of co-morbid depression in adults with Type 2 diabetes: a systematic review and meta-analysis. Diabet. Med. 23, 1165–1173. doi: 10.1111/j.1464-5491.2006.01943.x
Anderson, R. J., Freedland, K. E., Clouse, R. E., and Lustman, P. J. (2001). The prevalence of comorbid depression in adults with diabetes: a meta-analysis. Diabetes Care 24, 1069–1078. doi: 10.2337/diacare.24.6.1069
Anttila, T., Helkala, E. L., Viitanen, M., Kareholt, I., Fratiglioni, L., Winblad, B., et al. (2004). Alcohol drinking in middle age and subsequent risk of mild cognitive impairment and dementia in old age: a prospective population based study. BMJ 329, 539. doi: 10.1136/bmj.38181.418958.BE
Araki, Y., Nomura, M., Tanaka, H., Yamamoto, H., Yamamoto, T., Tsukaguchi, I., et al. (1994). MRI of the brain in diabetes mellitus. Neuroradiology 36, 101–103. doi: 10.1007/BF00588069
Ashburner, J., and Friston, K. J. (2005). Unified segmentation. Neuroimage 26, 839–851. doi: 10.1016/j.neuroimage.2005.02.018
Biessels, G. J., Staekenborg, S., Brunner, E., Brayne, C., and Scheltens, P. (2006). Risk of dementia in diabetes mellitus: a systematic review. Lancet Neurol. 5, 64–74. doi: 10.1016/S1474-4422(05)70284-2
Cheng, G., Huang, C., Deng, H., and Wang, H. (2012). Diabetes as a risk factor for dementia and mild cognitive impairment: a meta-analysis of longitudinal studies. Intern. Med. J. 42, 484–491. doi: 10.1111/j.1445-5994.2012.02758.x
Cuadra, M. B., Cammoun, L., Butz, T., Cuisenaire, O., and Thiran, J. P. (2005). Comparison and validation of tissue modelization and statistical classification methods in T1-weighted MR brain images. IEEE Trans. Med. Imaging 24, 1548–1565. doi: 10.1109/TMI.2005.857652
De Bresser, J., Tiehuis, A. M., Van Den Berg, E., Reijmer, Y. D., Jongen, C., Kappelle, L. J., et al. (2010). Progression of cerebral atrophy and white matter hyperintensities in patients with type 2 diabetes. Diabetes Care 33, 1309–1314. doi: 10.2337/dc09-1923
Erickson, K. I., Raji, C. A., Lopez, O. L., Becker, J. T., Rosano, C., Newman, A. B., et al. (2010). Physical activity predicts gray matter volume in late adulthood: the cardiovascular health study. Neurology 75, 1415–1422. doi: 10.1212/WNL.0b013e3181f88359
Fisher, N. J., Tierney, M. C., Rourke, B. P., and Szalai, J. P. (2004). Verbal fluency patterns in two subgroups of patients with Alzheimer's disease. Clin. Neuropsychol. 18, 122–131. doi: 10.1080/13854040490507235
Franke, K., Gaser, C., and for the Alzheimer's Disease Neuroimaging Initiative. (2012a). Longitudinal changes in individual BrainAGE in healthy aging, mild cognitive impairment, and Alzheimer's disease. GeroPsych 25, 235–245. doi: 10.1024/1662-9647/a000074
Franke, K., Luders, E., May, A., Wilke, M., and Gaser, C. (2012b). Brain maturation: predicting individual BrainAGE in children and adolescents using structural MRI. Neuroimage 63, 1305–1312. doi: 10.1016/j.neuroimage.2012.08.001
Franke, K., Ristow, M., Gaser, C., and for the Alzheimer's Disease Neuroimaging Initiative. (2013). “Gender-specific effects of health and lifestyle markers on individual BrainAGE,” International Workshop on Pattern Recognition in Neuroimaging (PRNI), IEEE Conference Proceedings (Philadelphia, PA), 94–97. doi: 10.1109/PRNI.2013.33
Franke, K., Ziegler, G., Klöppel, S., Gaser, C., and the Alzheimer's Disease Neuroimaging Initiative. (2010). Estimating the age of healthy subjects from T1-weighted MRI scans using kernel methods: exploring the influence of various parameters. Neuroimage 50, 883–892. doi: 10.1016/j.neuroimage.2010.01.005
Frisardi, V., Panza, F., Seripa, D., Imbimbo, B. P., Vendemiale, G., Pilotto, A., et al. (2010). Nutraceutical properties of Mediterranean diet and cognitive decline: possible underlying mechanisms. J. Alzheimers Dis. 22, 715–740. doi: 10.3233/JAD-2010-100942
Gaser, C. (2009). Partial volume segmentation with adaptive maximum a posteriori (MAP) approach. Neuroimage 47, S121. doi: 10.1016/S1053-8119(09)71151-6
Gaser, C., Franke, K., Kloppel, S., Koutsouleris, N., and Sauer, H. (2013). BrainAGE in mild cognitive impaired patients: predicting the conversion to Alzheimer's Disease. PLoS ONE 8:e67346. doi: 10.1371/journal.pone.0067346
Gispen, W. H., and Biessels, G. J. (2000). Cognition and synaptic plasticity in diabetes mellitus. Trends Neurosci. 23, 542–549. doi: 10.1016/S0166-2236(00)01656-8
Good, C. D., Johnsrude, I. S., Ashburner, J., Henson, R. N., Friston, K. J., and Frackowiak, R. S. (2001). A voxel-based morphometric study of ageing in 465 normal adult human brains. Neuroimage 14, 21–36. doi: 10.1006/nimg.2001.0786
Hadjidemetriou, S., Lorenzen, P., Schuff, N., Mueller, S., and Weiner, M. (2008). Computational atlases of severity of white matter lesions in elderly subjects with MRI. Med. Image Comput. Comput. Assist. Interv. 11, 450–458. doi: 10.1007/978-3-540-85988-8_54
Harrison, J. E., Buxton, P., Husain, M., and Wise, R. (2000). Short test of semantic and phonological fluency: normal performance, validity and test-retest reliability. Br. J. Clin. Psychol. 39, 181–191. doi: 10.1348/014466500163202
Heuser, I. (2002). Depression, endocrinologically a syndrome of premature aging? Maturitas 41(Suppl. 1), S19–S23. doi: 10.1016/S0378-5122(02)00012-9
Holm, S. (1979). A simple sequentially rejective multiple test procedure. Scand. J. Statist. 6, 65–70.
Janson, J., Laedtke, T., Parisi, J. E., O'brien, P., Petersen, R. C., and Butler, P. C. (2004). Increased risk of type 2 diabetes in Alzheimer disease. Diabetes 53, 474–481. doi: 10.2337/diabetes.53.2.474
Katon, W., Lyles, C. R., Parker, M. M., Karter, A. J., Huang, E. S., and Whitmer, R. A. (2012). Association of depression with increased risk of dementia in patients with type 2 diabetes: the diabetes and aging study. Arch. Gen. Psychiatry 69, 410–417. doi: 10.1001/archgenpsychiatry.2011.154
Klöppel, S., Abdulkadir, A., Hadjidemetriou, S., Issleib, S., Frings, L., Thanh, T. N., et al. (2011). A comparison of different automated methods for the detection of white matter lesions in MRI data. Neuroimage 57, 416–422. doi: 10.1016/j.neuroimage.2011.04.053
Last, D., Alsop, D. C., Abduljalil, A. M., Marquis, R. P., De Bazelaire, C., Hu, K., et al. (2007). Global and regional effects of type 2 diabetes on brain tissue volumes and cerebral vasoreactivity. Diabetes Care 30, 1193–1199. doi: 10.2337/dc06-2052
Nepal, B., Brown, L., and Ranmuthugala, G. (2010). Modelling the impact of modifying lifestyle risk factors on dementia prevalence in Australian population aged 45 years and over, 2006–2051. Australas. J. Ageing 29, 111–116. doi: 10.1111/j.1741-6612.2010.00392.x
Novak, V., Zhao, P., Manor, B., Sejdic, E., Alsop, D., Abduljalil, A., et al. (2011). Adhesion molecules, altered vasoreactivity, and brain atrophy in type 2 diabetes. Diabetes Care 34, 2438–2441. doi: 10.2337/dc11-0969
Rajapakse, J. C., Giedd, J. N., and Rapoport, J. L. (1997). Statistical approach to segmentation of single-channel cerebral MR images. IEEE Trans. Med. Imaging 16, 176–186. doi: 10.1109/42.563663
Reijmer, Y. D., Van Den Berg, E., De Bresser, J., Kessels, R. P., Kappelle, L. J., Algra, A., et al. (2011). Accelerated cognitive decline in patients with type 2 diabetes: MRI correlates and risk factors. Diabetes Metab. Res. Rev. 27, 195–202. doi: 10.1002/dmrr.1163
Schmidt, R., Launer, L. J., Nilsson, L. G., Pajak, A., Sans, S., Berger, K., et al. (2004). Magnetic resonance imaging of the brain in diabetes: the Cardiovascular Determinants of Dementia (CASCADE) Study. Diabetes 53, 687–692. doi: 10.2337/diabetes.53.3.687
Schölkopf, B., and Smola, A. (2002). Learning with Kernels: Support Vector Machines, Regularization, Optimization, and Beyond. Cambridge, MA: MIT Press.
Solfrizzi, V., Capurso, C., D'introno, A., Colacicco, A. M., Santamato, A., Ranieri, M., et al. (2008). Lifestyle-related factors in predementia and dementia syndromes. Expert Rev. Neurother. 8, 133–158. doi: 10.1586/14737175.8.1.133
Stewart, R., and Liolitsa, D. (1999). Type 2 diabetes mellitus, cognitive impairment and dementia. Diabet. Med. 16, 93–112. doi: 10.1046/j.1464-5491.1999.00027.x
Tan, Z. S., Beiser, A. S., Fox, C. S., Au, R., Himali, J. J., Debette, S., et al. (2011). Association of metabolic dysregulation with volumetric brain magnetic resonance imaging and cognitive markers of subclinical brain aging in middle-aged adults: the Framingham offspring study. Diabetes Care 34, 1766–1770. doi: 10.2337/dc11-0308
Tipping, M. E. (2001). Sparse bayesian learning and the relevance vector machine. J. Mach. Learn. Res. 1, 211–244. doi: 10.1162/15324430152748236
Tobinick, E. L., and Gross, H. (2008). Rapid improvement in verbal fluency and aphasia following perispinal etanercept in Alzheimer's disease. BMC Neurol. 8:27. doi: 10.1186/1471-2377-8-27
Tohka, J., Zijdenbos, A., and Evans, A. (2004). Fast and robust parameter estimation for statistical partial volume models in brain MRI. Neuroimage 23, 84–97. doi: 10.1016/j.neuroimage.2004.05.007
Tomlinson, D. R., and Gardiner, N. J. (2008). Glucose neurotoxicity. Nat. Rev. Neurosci. 9, 36–45. doi: 10.1038/nrn2294
Van Elderen, S. G., De Roos, A., De Craen, A. J., Westendorp, R. G., Blauw, G. J., Jukema, J. W., et al. (2010). Progression of brain atrophy and cognitive decline in diabetes mellitus: a 3-year follow-up. Neurology 75, 997–1002. doi: 10.1212/WNL.0b013e3181f25f06
Velayudhan, L., Poppe, M., Archer, N., Proitsi, P., Brown, R. G., and Lovestone, S. (2010). Risk of developing dementia in people with diabetes and mild cognitive impairment. Br. J. Psychiatry 196, 36–40. doi: 10.1192/bjp.bp.109.067942
Wolkowitz, O. M., Epel, E. S., Reus, V. I., and Mellon, S. H. (2010). Depression gets old fast: do stress and depression accelerate cell aging? Depress. Anxiety 27, 327–338. doi: 10.1002/da.20686
Wolkowitz, O. M., Reus, V. I., and Mellon, S. H. (2011). Of sound mind and body: depression, disease, and accelerated aging. Dialogues Clin. Neurosci. 13, 25–39. doi: 10.1002/da.20686
Xu, W. L., Qiu, C. X., Wahlin, A., Winblad, B., and Fratiglioni, L. (2004). Diabetes mellitus and risk of dementia in the Kungsholmen project: a 6-year follow-up study. Neurology 63, 1181–1186. doi: 10.1212/01.WNL.0000140291.86406.D1
Zhan, W., Zhang, Y., Mueller, S. G., Lorenzen, P., Hadjidemetriou, S., Schuff, N., et al. (2009). Characterization of white matter degeneration in elderly subjects by magnetic resonance diffusion and FLAIR imaging correlation. Neuroimage 47(Suppl. 2), T58–T65. doi: 10.1016/j.neuroimage.2009.02.004
Keywords: aging, BrainAGE, diabetes mellitus (DM), magnetic resonance imaging (MRI), voxel-based morphometry (VBM)
Citation: Franke K, Gaser C, Manor B and Novak V (2013) Advanced BrainAGE in older adults with type 2 diabetes mellitus. Front. Aging Neurosci. 5:90. doi: 10.3389/fnagi.2013.00090
Received: 13 August 2013; Accepted: 22 November 2013;
Published online: 17 December 2013.
Edited by:
P. Hemachandra Reddy, Oregen Health and Science University, USAReviewed by:
Nikolaos Koutsouleris, Ludwig-Maximilian-University, GermanySubbiah Pugazhenthi, Denver VA Medical Center, USA
Copyright © 2013 Franke, Gaser, Manor and Novak. This is an open-access article distributed under the terms of the Creative Commons Attribution License (CC BY). The use, distribution or reproduction in other forums is permitted, provided the original author(s) or licensor are credited and that the original publication in this journal is cited, in accordance with accepted academic practice. No use, distribution or reproduction is permitted which does not comply with these terms.
*Correspondence: Katja Franke, Structural Brain Mapping Group, Department of Psychiatry, Jena University Hospital, Jahnstr. 3, D – 07743 Jena, Germany e-mail: katja.franke@uni-jena.de