Application of a MRI based index to longitudinal atrophy change in Alzheimer disease, mild cognitive impairment and healthy older individuals in the AddNeuroMed cohort
 Carlos Aguilar1*
  J-Sebastian Muehlboeck1,2
  Patrizia Mecocci3
  Bruno Vellas4
  Magda Tsolaki5
  Iwona Kloszewska6
  Hilkka Soininen7
  Simon Lovestone2,8
  Lars-Olof Wahlund1
  Andrew Simmons2,8†
  Eric Westman1† for the AddNeuroMed Consortium
- 1Division of Clinical Geriatrics, Department of Neurobiology, Care Sciences and Society, Karolinska Institutet, Stockholm, Sweden
- 2Department of Neuroimaging and Department of Old Age Psychiatry, Institute of Psychiatry, King's College London, London, UK
- 3Institute of Gerontology and Geriatrics, University of Perugia, Perugia, Italy
- 4INSERM U 558, University of Toulouse, Toulouse, France
- 5Department of Classics, Aristotle University of Thessaloniki, Thessaloniki, Greece
- 6Department of Old Age Psychiatry and Psychotic Disorders, Medical University of Lodz, Lodz, Poland
- 7Department of Neurology, University and University Hospital of Kuopio, Finland
- 8NIHR Biomedical Research Centre for Mental Health and NIHR Biomedical Research Unit for Dementia, London, UK
Cross sectional studies of patients at risk of developing Alzheimer disease (AD) have identified several brain regions known to be prone to degeneration suitable as biomarkers, including hippocampal, ventricular, and whole brain volume. The aim of this study was to longitudinally evaluate an index based on morphometric measures derived from MRI data that could be used for classification of AD and healthy control subjects, as well as prediction of conversion from mild cognitive impairment (MCI) to AD. Patients originated from the AddNeuroMed project at baseline (119 AD, 119 MCI, 110 controls (CTL)) and 1-year follow-up (62 AD, 73 MCI, 79 CTL). Data consisted of 3D T1-weighted MR images, demographics, MMSE, ADAS-Cog, CERAD and CDR scores, and APOE e4 status. We computed an index using a multivariate classification model (AD vs. CTL), using orthogonal partial least squares to latent structures (OPLS). Sensitivity, specificity and AUC were determined. Performance of the classifier (AD vs. CTL) was high at baseline (10-fold cross-validation, 84% sensitivity, 91% specificity, 0.93 AUC) and at 1-year follow-up (92% sensitivity, 74% specificity, 0.93 AUC). Predictions of conversion from MCI to AD were good at baseline (77% of MCI converters) and at follow-up (91% of MCI converters). MCI carriers of the APOE e4 allele manifested more atrophy and presented a faster cognitive decline when compared to non-carriers. The derived index demonstrated a steady increase in atrophy over time, yielding higher accuracy in prediction at the time of clinical conversion. Neuropsychological tests appeared less sensitive to changes over time. However, taking the average of the two time points yielded better correlation between the index and cognitive scores as opposed to using cross-sectional data only. Thus, multivariate classification seemed to detect patterns of AD changes before conversion from MCI to AD and including longitudinal information is of great importance.
Introduction
Alzheimer disease (AD) is one of the most common forms of neurodegenerative disorders characterized by a gradual loss of cognitive functions such as episodic memory. A revision of the National Institute of Neurological and Communicative Disorders and Stroke (NINCDS) and the Alzheimer disease and related Disorders Association (ADRDA) criterion (McKhann et al., 1984) for the diagnosis of AD has been suggested. The new research criterion is still centered on a clinical core of early and significant episodic memory impairment, but also includes at least one abnormal biomarker among magnetic resonance imaging (MRI), positron emission tomography (PET) and cerebrospinal fluid (CSF) (Albert et al., 2011; McKhann et al., 2011; Sperling et al., 2011). Since evidence for use of these biomarkers is growing, it strengthens their role in the diagnosis of AD. MRI provides structural information about the brain and has for many years been widely used for early detection and diagnosis of AD (O'Brien, 2007; Ries et al., 2008; Tondelli et al., 2012). With this technique it is possible to measure both regional (hippocampus/entorhinal cortex) and global (whole brain) atrophy, which are considered sensitive surrogate markers, capable of quantifying the extent of brain degeneration in dementia (Apostolova et al., 2006). However, more atypical patterns of AD have also been observed with different clinical presentations. Brain atrophy patterns characterized by hippocampal volume loss in limbic-predominant cases and increased temporoparietal and frontal atrophy in hippocampal sparing cases, with typical AD cases showing atrophy in all regions (Whitwell et al., 2012). A goal of structural neuroimaging analysis in AD is to identify a pattern of atrophy (regional and/or global) that can help predict further cognitive decline or establish a probable diagnosis. It is possible to obtain multiple volumetric and cortical thickness measures from high resolution MRI by automated segmentation techniques. Multivariate techniques enable utilization of information from different regions of the brain to distinguish between different dementias and patient groups (Teipel et al., 2007; Davatzikos et al., 2008; Klöppel et al., 2008; Vemuri et al., 2008; Magnin et al., 2009; Plant et al., 2010; Westman et al., 2011). Moreover, it has been proposed that structural information can be condensed into an index by using multivariate techniques (Fan et al., 2008; Mattila et al., 2011; Spulber et al., 2013).
We have previously introduced an index derived from a multivariate discrimination model [orthogonal partial least squares to latent structures (OPLS)] (Spulber et al., 2013). The index was characterized based on cross-sectional data from the AddNeuroMed and ADNI cohorts. In the present study we expand the analysis to longitudinal MRI data with the aim to longitudinally evaluate the index. For this purpose; (1) a multivariate classification model was trained using baseline AD and control (CTL) MRI scans; (2) the derived classification model was applied to AD, CTL (1-year follow-up) and MCI individuals (baseline and 1-year follow-up); (3) resulting in an individual index which was used to compute descriptive statistics and perform group analysis; (4) finally, the index annual rate of change was calculated and compared to the cognitive scores' annual rate of change, and the average index was calculated and compared to average cognitive scores for each diagnostic group, and after stratification by atrophy pattern and APOE e4 status.
Materials and Methods
Subjects and Inclusion Criteria
All patients originated from the AddNeuroMed project, part of InnoMed (Innovative Medicines in Europe), a European Union programme designed to make drug discovery more efficient. The project is designed to develop and validate novel surrogate markers in AD and includes a human neuroimaging strand (Simmons et al., 2009, 2011) which combines MRI data with other biomarkers and clinical data. Data was collected from six different sites across Europe: University of Kuopio, Finland, University of Perugia, Italy, Aristotle University of Thessaloniki, Greece, King's College London, United Kingdom, University of Lodz, Poland, and University of Toulouse, France. MR images from a total of 119 AD patients, 119 MCI patients, and 110 healthy controls (CTL) were available. Only a subsample of 62 AD patients, 73 MCI patients and 79 CTL individuals were followed longitudinally however. Table 1 provides demographics of the whole and longitudinal datasets, Table 2 summarizes the cognitive scores per diagnostic group, and Figure 1 depicts the disposition of the diagnostic groups. All AD and MCI subjects were recruited from local memory clinics of the six participating sites while the control subjects were recruited from non-related members of the patient's families, caregiver's relatives or social centers for the elderly. Written consent was obtained where the research participant had capacity, and in those cases where dementia compromised capacity then assent from the patient and written consent from a relative, according to local law and process, was obtained. This study was approved by ethical review boards in each participating country. The inclusion and exclusion criteria were as follows. Alzheimer disease: Inclusion criteria: (1) ADRDA/NINCDS and DSM- IV criteria for probable AD. (2) Mini Mental State Examination score range between 12 and 28. (3) Age 65 years or above. Exclusion criteria: (1) Significant neurological or psychiatric illness other than AD. This would exclude patients with vascular dementia or large infarcts, for example. (2) Significant unstable systematic illness or organ failure. All AD subjects had a Clinical Dementia Rating (CDR) scale score of 0.5 or above. Mild Cognitive Impairment and controls: Inclusion criteria: (1) Mini Mental State Examination score range between 24 and 30. (2) Geriatric Depression Scale score less than or equal to 5. (3) Age 65 years or above. (4) Medication stable. (5) Good general health. Exclusion criteria: (1) Meet the DSM- IV criteria for Dementia. (2) Significant neurological or psychiatric illness. (3) Significant unstable systematic illness or organ failure. The distinction between MCI and controls was based on: the subject scores 0 on Clinical Dementia Rating Scale = control. The subject scores 0.5 on Clinical Dementia Rating scale = MCI. Additionally, for the MCI subjects it was preferable that the subject and informant reported occurrence of memory problems. There is an overlap regarding CDR-sum-of-boxes and MMSE scores between AD and MCI patients.
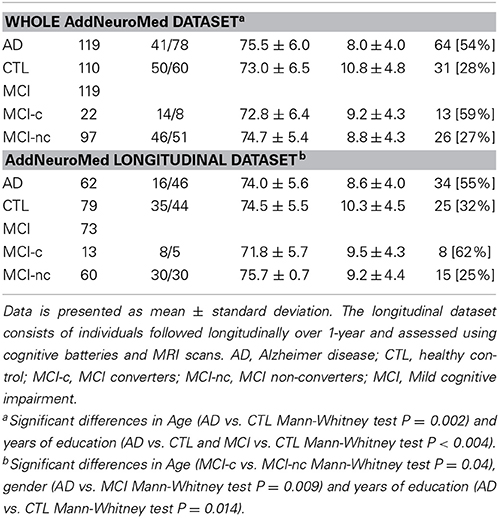
Table 1. Subject demographics at baseline.
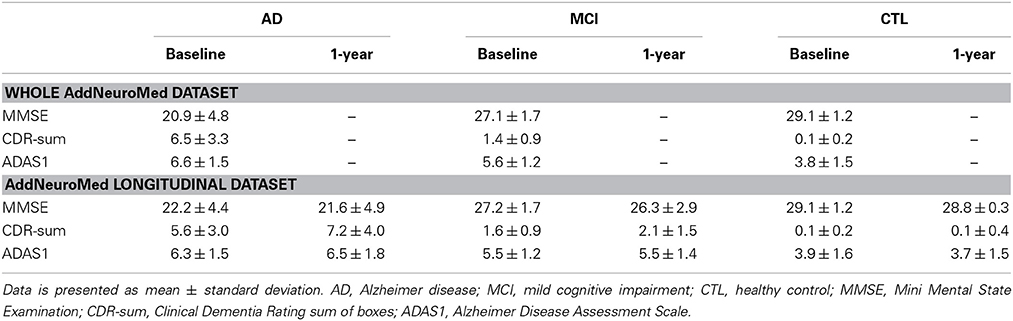
Table 2. Cognitive scores at baseline and 1-year follow-up.
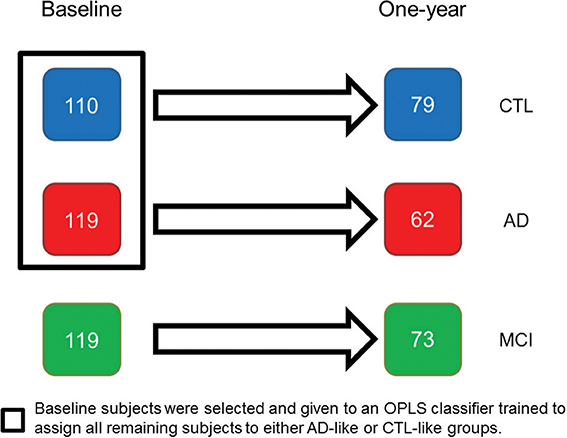
Figure 1. AddNeuroMed longitudinal population: at baseline 348 individuals were assessed using cognitive and MRI methods, with 214 individuals subsequently followed longitudinally. AD, Alzheimer disease; MCI, mild cognitive impairment; CTL, healthy control.
At baseline, a health interview was administrated to all participants following a standardized protocol available at http://www.innomed-addneuromed.com and data on demographics, medical history, current health status, medication use and family history were collected. For AD and MCI cases, information on the duration and severity of cognitive decline was obtained from the subjects or informants through a detailed questionnaire: the presence of memory problems, time of their onset, subsequent course, and investigations performed.
For all participants, cognition, behavior, functional status, and global severity were assessed and the MMSE (Folstein et al., 1975) and the Clinical Dementia Rating scale (CDR) (Hughes et al., 1982) were administered. Evaluation of AD included the Hachinski ischemic scale (Hachinski et al., 1975), the AD assessment scale-cognitive subscale (ADAS-Cog) (Rosen et al., 1984), Neuropsychiatric Inventory (Cummings et al., 1994), and the Alzheimer disease Cooperative Study (ADCS)-activities of daily living scale (Galasko et al., 1997). Evaluation of MCI and CTL individuals comprised the Consortium to Establish a Registry for Alzheimer Disease (CERAD) Cognitive Battery (Morris et al., 1989) and the Geriatric Depression Scale (GDS) (Yesavage and Sheikh, 1986). The same procedure was used at 12 month follow-up. MRI findings were not known to clinicians, so as not to influence the clinical diagnosis.
The ADAS-cog and the CERAD battery use the same 10-word recall task. The only difference is that the scoring is inverted. The mean number of words not recalled in the CERAD word list immediate recall task was calculated. The variable obtained was named ADAS1, corresponding to the first subtest of ADAS-Cog. This was performed to obtain comparable measures between groups. CDR global was used for diagnosis as described above, but CDR sum of boxes were used in relation to the index.
MRI Acquisition
Data acquisition for the AddNeuroMed study was designed to be compatible with the Alzheimer Disease Neuroimaging Initiative (ADNI) (Jack et al., 2008). Data was collected from 4 General Electric, 1 Siemens, and 1 Picker MR-scanner. The imaging protocol for both studies included a high resolution sagittal 3D T1-weighted MPRAGE volume (voxel size 1.1 × 1.1 × 1.2 mm3) and axial proton density/T2-weighted fast spin echo images. The MPRAGE volume was acquired using a custom pulse sequence specifically designed for the ADNI study to ensure compatibility across scanners. Full brain and skull coverage was required and detailed quality control carried out on all MR images according to the AddNeuroMed quality control procedures (Simmons et al., 2009, 2011).
Regional Volume Segmentation and Cortical Thickness Parcellation
FreeSurfer (version 4.5.0) was used for image processing and analysis. The pipeline produces regional cortical thickness and volumetric measures. Cortical reconstruction and volumetric segmentation includes removal of non-brain tissue using a hybrid watershed/surface deformation procedure (Segonne et al., 2004), automated Talairach transformation, segmentation of the subcortical white matter and deep gray matter volumetric structures (including hippocampus, amygdala, caudate, putamen, ventricles) (Fischl et al., 2002, 2004; Segonne et al., 2004), intensity normalization (Sled et al., 1998), tessellation of gray matter and white matter boundary, automated topology correction (Fischl et al., 2001; Ségonne et al., 2007) and deformation following intensity gradients to optimally place the gray/white and gray/CSF borders at the location where the greatest shift in intensity defines the transition to the other tissue class (Dale and Sereno, 1993; Dale et al., 1999; Fischl and Dale, 2000). Once the cortical models are complete, registration to a spherical atlas takes place, which utilizes individual cortical folding patterns to match cortical geometry across subjects (Fischl et al., 1999). This is followed by parcellation of the cerebral cortex into units based on gyral and sulcal structure (Fischl et al., 2004; Desikan et al., 2006). The pipeline generated 68 cortical thickness measures (34 from each hemisphere) and 50 regional volumes. Volumes of white matter hypointensities, optic chiasm, right and left vessel, and right and left choroid plexus were excluded from further analysis. White matter hypointensities were excluded since most subjects were characterized by zero values. Cortical thickness and volumetric measures from the right and left side were averaged. In total 57 MRI measures were used as input variables for multivariate analysis, see Table 3. Using tkmedit, the image processing steps were visually inspected to ensure they had been carried out correctly and corrected for skull-stripping errors and gray/white matter boundary (cases where significant image artifacts or gross brain abnormalities result in segmentation errors were excluded). These segmentation approaches have been used for multivariate classification of Alzheimer's disease and healthy controls (Westman et al., 2010; Mangialasche et al., 2013), neurophysiological image analysis (Liu et al., 2011; Ferreira et al., 2014), imaging-genetic analysis (Liu et al., 2010b; Velayudhan et al., 2013), and biomarker discovery (Thambisetty, 2008; Thambisetty et al., 2010).
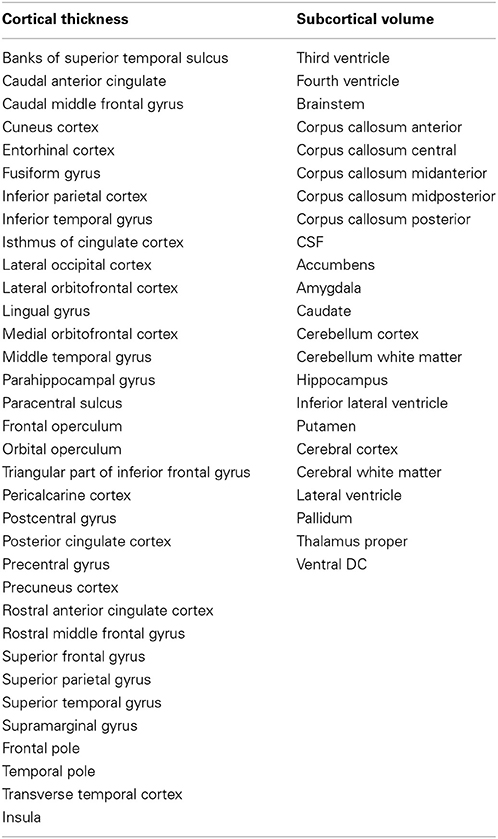
Table 3. FreeSurfer variables included in the study.
Data Preprocessing
All volumetric measures from each subject were normalized by the subject's intracranial volume (ICV). The ICV was estimated based on an affine transform in Freesurfer, while cortical thickness measures were not normalized (Westman et al., 2013). Preprocessing of each variable was performed using mean centering and unit-variance scaling.
Orthogonal Partial Least Squares to Latent Structures
Orthogonal partial least squares to latent structures (OPLS) (Trygg and Wold, 2002; Bylesjö et al., 2006; Wiklund et al., 2008) is a supervised multivariate data analysis method included in the software package SIMCA (Umetrics AB, Umea, Sweden). In OPLS, the information related to class separation is found in the first component of the model, the predictive component. The orthogonal components in the model, if any, relate to variation in the data not connected to class separation. Focusing the information related to class separation on the first component makes data interpretation easier (Wiklund et al., 2008).
Each OPLS model receives a Q2(Y) value that describes its statistical significance for separating groups. Q2(Y) values > 0.05 are regarded as statistically significant (Eriksson et al., 2006), where
PRESS (predictive residual sum of squares) = ∑ (yactual − ypredicted)2 and SSY is the total variation of the Y matrix after scaling and mean centering (Eriksson et al., 2006). Q2(Y) is the fraction of the total variation of the Ys (expected class values) that can be predicted by a component according to cross-validation (CV).
Index: High-Dimensional Classification from Multiple MRI Features
An OPLS model was created at baseline for AD vs. CTL (119 AD and 110 CTL). Cortical thickness measures and subcortical volumes were analyzed separately, which means a separate OPLS model is created for each set of variables. The two models are then combined using hierarchical modeling (Westman et al., 2012). The OPLS model creates an index for each individual subject, which tends to be close to 1 for AD patients and 0 for CTL individuals. Index values above 0.5 indicate a more AD-like characteristic while values below 0.5 a more CTL-like characteristic. The AD vs. CTL OPLS model derived from the training data was applied on the longitudinal data of AD, CTL, and MCI individuals. This produced an index reflecting the degree to which the individual's pattern resembled the pattern of AD patients or the pattern of CTL individuals. Although age and education were significantly different between groups, the model did not consider them as confounding variables since multivariate models seemed to be robust to the presence of differences in age and/or years of education because the overall pattern of atrophy is a strong predictor of AD in and of itself (Klöppel et al., 2008; Vemuri et al., 2008; Misra et al., 2009; Aguilar et al., 2013).
Statistical Comparisons
Basic descriptive statics were used to characterize diagnostic groups and stratified according to a specific criterion (e.g., gender or time point). Linear regression was used to illustrate dependences and quantified by computing linear correlation coefficients. Statistical significance was determined by applying repeated One-Way ANOVA and non-parametric matched-paired test. Area under the ROC (receiver operating characteristic) curve (AUC) was calculated using the web-based application JROCFIT (Eng J. ROC analysis: web-based calculator for ROC curves. Baltimore: Johns Hopkins University; www.jrocfit.org).
Results
OPLS Model Creation
The resulting classification model enabled high discrimination between AD and CTL individuals (7-fold CV: 84% sensitivity, 91% specificity, 0.93 AUC). As part of the model, the top 10 most important variables for discrimination were: hippocampus, entorhinal cortex, amygdala, temporal pole, superior temporal gyrus, inferior lateral ventricle, middle temporal gyrus, fusiform gyrus, inferior temporal gyrus, and parahippocampal gyrus (see Table 3 for a list of all variables included in the analysis).
Index
The index was computed for all individuals in the longitudinal dataset. Figure 2A and Table 4 summarize the distribution of the index per diagnostic group, per time-point; and Figure 2B summarizes the distribution of the index annual rate of change per diagnostic group. Overall, we observed increased atrophy over time, AD patients showed the fastest increase (One-Way ANOVA P = 0.044). The index was highest in the AD group, followed by MCI converters (MCI-c), MCI non-converters (MCI-nc), and the CTL group. CTL subjects had values below 0.5. However, in older individuals with normal cognition AD-like values (>0.5) were more frequent (Figure 3).
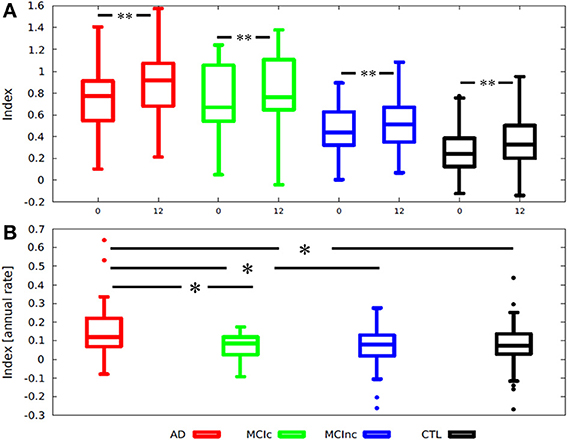
Figure 2. Box-plots illustrating the distribution of (A) an MRI index according to diagnosis and stratified by time point; (B) Index annual rate of change stratified by diagnosis. Index annual rate of change = index at 1-year − index at baseline. *One-tailed T-test p < 0.002; **One-tailed paired T-test p < 0.003; AD, Alzheimer disease; MCI-c, MCI converter; MCI-nc, MCI non-converter (stable); MCI, mild cognitive impairment; CTL, healthy control.
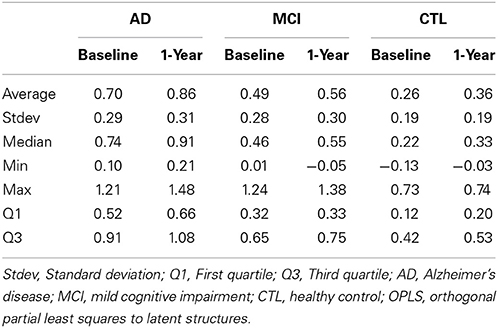
Table 4. MRI index computed for the longitudinal dataset.
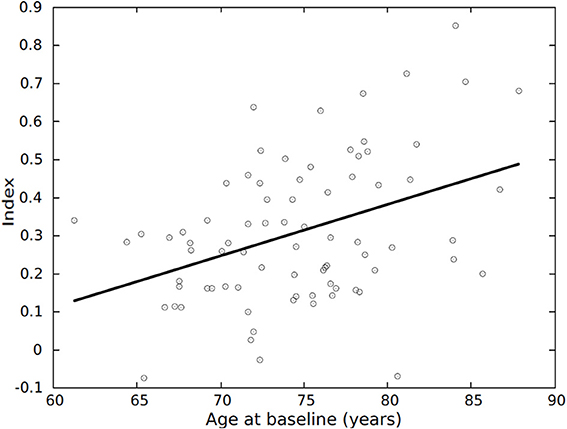
Figure 3. Average index vs. age, for the 79 CTL individuals part of the longitudinal dataset. Average index = (index at baseline + index at 1-year)/2. CTL, healthy control.
Taking the average index from baseline and follow-up data and stratifying the diagnostic groups according to pattern of atrophy resulted in good separation of AD-like AD patients and CTL-like CTL subjects, as well as AD-like MCI-c and CTL-like MCI-nc patients, and revealed subgroups of subjects with values in between (Figure 4A). Also, for each diagnostic group, having a different pattern of atrophy resulted in a different index of annual rate of change, although non-significant, except for the CTL group (Figure 4B). Those CTL individuals having an AD-like pattern of atrophy had a significantly higher rate of atrophy (Index annual rate of change: AD-like > CTL-like; Mann-Whitney p = 0.028).
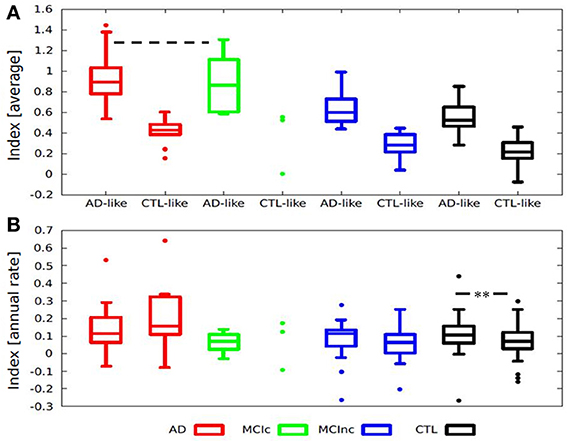
Figure 4. Box-plots illustrating the distribution of (A) Average index according to diagnosis and stratified by pattern of atrophy, all groups are significantly different except for AD-like AD and AD-like MCI-c (--- Two-sided T-test p = 0.76). (B) Index annual rate of change stratified by diagnosis and pattern of atrophy. Index annual rate of change = index at 1-year − index at baseline. **Mann-Whitney p = 0.028; Average index = (Index at baseline + index at 1-year)/2. AD, Alzheimer disease; MCI-c, MCI converter; MCI-nc, MCI non-converter (stable); MCI, mild cognitive impairment; CTL, healthy control.
OPLS Classification and MCI Predictions
Sensitivity, specificity and AUC are reported for classification (AD vs. CTL) and prediction of MCI conversion to AD (Table 5).
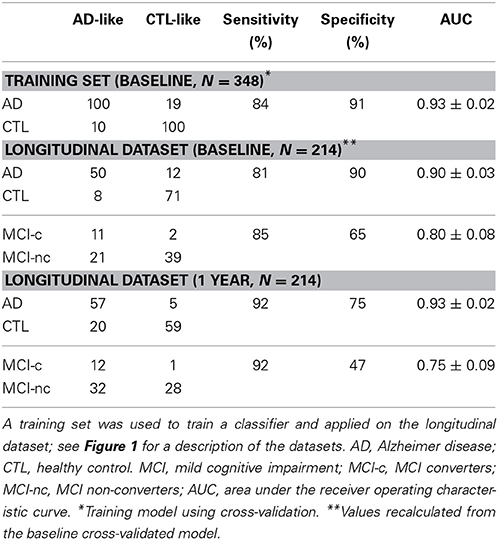
Table 5. Performance and prediction based on the AD vs. CTL classification model.
Individual classification accuracy was significantly lower (p < 0.001) at baseline (7-fold CV: sensitivity 81%, specificity 90%, 0.90 AUC) compared to 1-year follow-up (sensitivity 92%, specificity 75%, 0.93 AUC). Classification accuracy increased due to an increase in sensitivity, but there was a decrease in specificity as well.
MCI individuals were labeled as AD-like or CTL-like based on their individual index. Furthermore, they were stratified as converters (MCI-c) or non-converters (MCI-nc) based on the 1-year follow-up diagnosis. We report the number of MCI-c subjects identified as AD-like. Out of 13 MCI-c subjects 11 were predicted as AD-like from baseline data, while 12 were classified as AD at follow-up.
Cognitive Scores and MRI Index
Given that changes in brain structure (e.g., atrophy) should relate to cognitive performance, an exploratory statistical analysis was carried out on the cognitive data available. After stratification by diagnostic group, only CDR-sum showed significantly differences between baseline and 1-year scores for AD (P < 0.001) and MCI (P < 0.001) patients, reflecting an increased impairment; there were no significant changes in ADAS1 or MMSE.
The association between the index and CDR-sum was assessed based on the linear correlation coefficient for each diagnostic group at each time point. At baseline, there was no correlation for MCI patients (Spearman's r = 0.220; P = 0.093), while a mild non-significant correlation was found for AD patients (Spearman's r = 0.29; P = 0.063) (Figure 5A). At 1-year follow-up, there was a fair correlation for MCI patients (Spearman's r = 0.40; P = 0.001), and a good correlation for AD patients (Spearman's r = 0.59; P < 0.001) (Figure 5B). This suggests that at 1-year follow-up AD and MCI patients became more atrophied and more impaired, and the index and CDR-sum scores became more correlated.
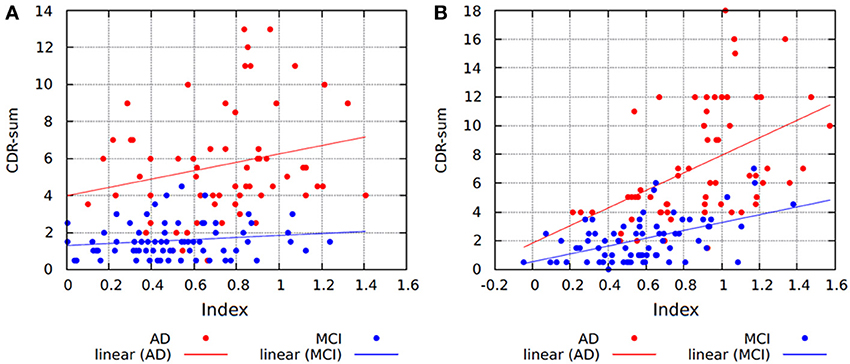
Figure 5. Scatter plots and regression lines showing the relationship between the index and CDR-sum scores for (A) baseline and; (B) 1-year follow-up data. AD, Alzheimer disease; MCI, mild cognitive impairment; CDR-sum, clinical dementia rating sum of boxes.
Since computing the average index from baseline and follow-up data and stratifying by diagnostic groups yielded significant differences for the index analysis, this procedure was also applied on the cognitive measures. Computing the average index and average cognitive scores, there were significant correlations between the index and MMSE (Figure 6A; Spearman's r = −0.614, p < 0.001), ADAS1 (Figure 6B; Spearman's r = 0.562, p < 0.001) and CDR-sum (Figure 6C; Spearman's r = 0.679, p < 0.001). When the analysis was restricted to the AD group, significant correlations were found between the average index and average MMSE (Spearman's r = −0.438, p < 0.001), average ADAS1 (Spearman's r = 0.549, p < 0.001) and average CDR-sum (Spearman's r = 0.412, p = 0.001). In the CTL group there was significant correlation only between the average index and average CDR-sum (Spearman's r = 0.236, p = 0.036). For the MCI groups there were no significant correlations.
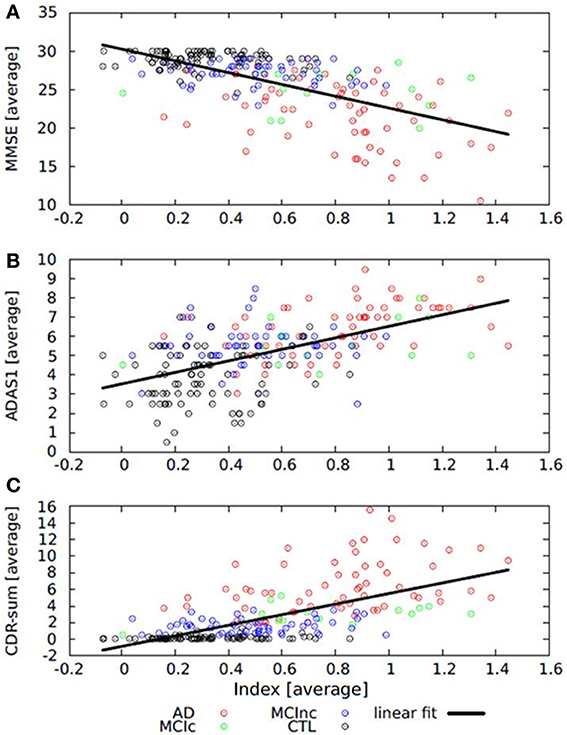
Figure 6. Scatter plots and regression lines showing the relationship between (A) average index and average MMSE; (B) average index and average ADAS1, and (C) average index and average CDR-sum. Average index = (average index at baseline + average index at 1-year)/2. MMSE, Mini Mental State Examination; CDR-sum, Clinical Dementia Rating sum of boxes; ADAS1, Alzheimer Disease Assessment Scale.
Having a different pattern of atrophy may be reflected in having a different cognitive performance. In particular, there was a faster rate of cognitive decline in AD-like subjects compared to CTL-like in MMSE (for AD Mann-Whitney p = 0.035; for CTL Mann-Whitney p = 0.05, one-sided T-test p = 0.03), ADAS1 (for MCI-c Mann-Whitney p = 0.013) and CDR-sum (for AD Mann-Whitney p < 0.001). Additionally, stratification of CTL individuals by pattern of atrophy resulted in significant correlations between the average index and average MMSE (only AD-like CTL Spearman's r = −0.465, p = 0.039), average ADAS1 (only AD-like CTL Spearman's r = 0.504, p = 0.023) and average CDR-sum (only CTL-like CTL Spearman's r = 0.351, p = 0.006).
Effect of APOE on the MCI Population
Carrying the APOE e4 allele is the strongest genetic risk factor associated with AD. This was used to stratify individuals as carriers vs. non-carriers and look for an association in cognitive decline consistent with AD pathology. Carriers showed a higher index compared to non-carriers at baseline and follow-up (baseline P = 0.041; 1-year P = 0.014) indicative of an AD-like atrophy pattern. Moreover, carriers showed an increase in ADAS1 (P = 0.017) and CDR-sum (P = 0.013) score compared to non-carriers at 1-year follow-up (Figure 7). Therefore, MCI carriers of the APOE e4 allele seemed to be more atrophied and presented a faster cognitive decline compared to non-carriers.
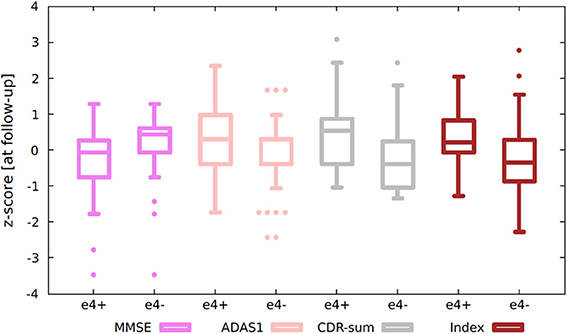
Figure 7. Box-plots showing stratification by APOE status of (standardized) MCI's index and cognitive scores. Standardized values were calculated by computing z-scores from average data. Average data = (data at baseline + data at 1-year)/2. e4+, APOE e4 carrier; e4−, APOE e4 non-carrier; MCI, mild cognitive impairment; MMSE, Mini Mental State Examination; CDR-sum, clinical dementia rating sum of boxes; ADAS1, Alzheimer Disease assessment scale.
Discussion
The approach taken in the present study was to extend previous work on a MRI based severity index to include longitudinal MRI data, to investigate changes in the index over time, and its relationship with cognitive performance measures. The approach enabled individual patient classification for identification of AD and CTL subjects with accuracies ranging from 80 to 90%. This classification performance is in agreement with previous results (Aguilar et al., 2013; Spulber et al., 2013). The main regions important for the differentiation of AD vs. CTL were primarily located in the medial temporal lobe as reported in the literature (Davatzikos et al., 2009; Cuingnet et al., 2011; Tondelli et al., 2012; Aguilar et al., 2013; Spulber et al., 2013).
Each individual is predicted by applying the AD vs. CTL classification model which produced an index reflecting the degree to which the individual's MRI pattern of atrophy resembles that of an AD subject or CTL subject, in line with results from similar approaches reported in the literature (Davatzikos et al., 2009; Mattila et al., 2011; Clark et al., 2012).
The number of AD patients identified as AD increased when follow-up data was used. Likewise, the number of MCI patients that would convert to AD identified as AD-like based on their atrophy pattern increased when follow-up data was used. This indicates that the model derived from baseline data captures brain changes, thus convergence to actual diagnosis becomes more accurate with disease progression. However, the number of CTL individuals identified as CTL decreased, and similarly the number of MCI-nc identified as CTL-like decreased. In other words, the index increased indicating that the pattern of brain atrophy resembled more that of an AD patient. Probably due to a natural consequence of aging each individual's index increases over time, and for some individuals, compensatory mechanisms enabled them to cope with brain degeneration and remain cognitively normal. For instance, some older individuals seemed to present a pattern typical of AD pathology even though they had normal cognition, an observation also previously reported (Davatzikos et al., 2009). Further, subjects with a more AD-like pattern at follow-up, may also convert at an even later time-point. There are also important factors such as age to consider which can influence the results, although age provided no significant additional information to the multivariate models (Aguilar et al., 2013). This could be because the multivariate models are robust to the addition of demographic variables. Another possible explanation could be that the overall pattern of atrophy is a strong predictor of AD in itself (Klöppel et al., 2008; Misra et al., 2009; Vemuri et al., 2009), without the need for any additional information such as age. The use of correction methods for age, for example, have also been previously proposed by others (Dukart et al., 2011).
Stratifying each diagnostic group by their pattern of atrophy resulted in significant differences, indicating that a composite index has captured part of the individual variability present in the sample. The subgroup of older CTL with an AD-like pattern of atrophy presented a faster annual rate of atrophy compared to the CTL-like CTL individuals, while the subgroup of AD-like MCI-c and AD-like AD patients showed no significant differences in their average index. These results confirm that MCI patients that will convert to AD (at 1-year follow-up) presented with a pattern of atrophy indistinguishable from that of AD patients. Control subjects presented a heterogeneous distribution of atrophy, some having a more AD-like pattern of atrophy with a faster annual rate of atrophy and faster cognitive decline compared to CTL individuals having a CTL-like pattern of atrophy. Whether this group of healthy individual showing a more AD-like pattern of atrophy represents preclinical AD (Sperling et al., 2013) is difficult to determine and would require a longer follow-up and additional AD biomarkers.
Analysis based on the application of a MRI-based index to track longitudinal atrophy changes suggests that a composite measure consisting of multiple regional brain measures condensed into an index could be used to monitor disease progression. This is in contrast to the observed longitudinal change in cognitive performance over the same period, which resulted in no or mild decrease in cognitive scores. Cognitive tests showed inconclusive proof of further deterioration over 1-year, perhaps because they are based on limited and finite scales insensitive to subtle changes. The index however seemed capable of capturing subtle structural decline thanks to a richer atrophy distribution, thus being able to handle biological and disease heterogeneity. For instance, we observed that CDR-sum score increased at a steeper rate compared to the index. Thus, to overcome this limitation, it has been proposed to create richer cognitive distributions by constructing novel composite scores employing machine learning algorithms, that are able to predict conversion from MCI to AD better than standard cognitive scores (Llano et al., 2011).
The significant association between atrophy and cognition was captured by taking the average index and average cognitive scores, reflecting longitudinal changes rather than cross-sectional measures. More impaired individuals displayed a higher index, therefore reflecting greater severity. Besides severity, when patients were stratified based on patterns of atrophy, having an AD-like pattern of atrophy was associated with a faster rate of cognitive decline when compared to patients having a CTL-like pattern of atrophy. In individuals with preserved cognition stratification by pattern of atrophy revealed associations between cognitive scores and severity of AD. This association may reflect very early mild cognitive decline, since AD-like CTL individuals with higher index values and higher rate of atrophy had an associated cognitive decline. As discussed above, using average values increased the correlation between the index and cognition. Atrophy and cognitive decline are separate but yet tightly connected processes. These processes do not occur simultaneously so by including the longitudinal information, the relationship becomes more evident. Further, the sensitivity of correctly classified AD and MCI-c subjects increases over time, supporting the inclusion of longitudinal information. The increased rate of atrophy observed in AD-like CTL subjects could potentially be used to identify preclinical AD. This again highlights the importance of longitudinal information.
The analysis seems to support the idea that significant atrophy in brain morphology (neurodegeneration) occurs at preclinical stages of dementia and that this does not correlate well with cognitive decline (Burns and Iliffe, 2009; Smith, 2012; Jack et al., 2013), maybe because precise measures of cognitive decline are particularly difficult at this stage, and also because of individual variation due to cognitive reserve and genetic background (Small et al., 2004; Koppel and Goldberg, 2009; Wisdom et al., 2011; Bogdan et al., 2012). In line with these observations, APOE-status seemed to explain some of the individual variability observed in MCI individuals, carriers of the APOE e4 allele seemed not only more impaired, but also more atrophied when compared to non-carriers, suggesting that the APOE e4 allele (Corder et al., 1993, 1995; Lambert and Amouyel, 2011) could modulate the degree of phenotypic expression even in cases of mild cognitive decline (Liu et al., 2010a; Sun et al., 2012). Some of the individual variation in the MCI group could be partially explained by stratifying the sample into carriers and non-carriers. While for AD and CTL individuals there was no significant association with APOE e4 status, possibly indicating that cognitively normal individuals seemed to be well preserved irrespectively of their APOE status (Ferencz et al., 2013; Khan et al., 2014), and AD patients would show a high degree of cognitive decline and atrophy independent of their APOE status (Aguilar et al., 2013). The effect of APOE status has also been investigated in animal models of AD showing that the combination of genetic and lifestyle factors are important (Maioli et al., 2012).
Multivariate methods such as OPLS provide a way to separate groups based on the simultaneous contribution of several input morphometric variables. Such multivariate methods offer the advantage of requiring few statistical comparisons to obtain good generalization and good estimates of confidence (OPLS and SVM). The clinical value of such techniques can be demonstrated by producing models with high predictive value that help identify individuals at risk of cognitive decline atypical of normal aging and closer to dementia patients, either independently or in combination with other established methods (Hampel et al., 2010; Tondelli et al., 2012).
Study Limitations
Only 1-year longitudinal data was available for analysis, and this short follow-up is a limitation that needs to be considered when interpreting the results. For instance, it is difficult to establish the correct final diagnosis for MCI-nc patients due to the short follow-up, some of these patients may convert to AD in the future, while some may revert to cognitively normal. It is also difficult to determine whether CTL subjects are not already in a preclinical stage of AD, or whether this is part of normal variation in healthy aging; however, in addition to a longer follow-up, the inclusion of other biomarkers would be needed to establish whether a cognitively normal subject is already in a preclinical stage. Finally, none of the AD patients is known to have changed diagnosis to another dementia type; however information is only available up to 1-year follow-up.
Conclusion
MRI as a measure of neurodegeneration shows dynamic and independent atrophy in several brain areas. As an alternative to monitoring individual patterns of brain degeneration from multiple individual regions, the temporal evolution of brain degeneration can be characterized by a condensed index. This approach offers the advantage of facilitating the integration of other clinical biomarkers into a simplified and integrated dynamic model of individual progression. Based on a descriptive statistical analysis, it was possible to identify correlates of cognition and severity, as well as identify potential modulators of individual variation such as genetic background. This interaction can be positively correlated with AD pathology and explains some inter individual variability (APOE e4 allele carriers). However, even if it was possible to observe an increase in the severity level over time, neither the knowledge of baseline severity nor its rate of change could predict future rate of cognitive decline. Great variation was observed: patients having high index and preserved cognitive status, as well as patients having poor cognitive performance and low index. Stratification by pattern of atrophy reduced part of the variation observed and adding the longitudinal information markedly increased the relationship between the index and cognition. Of both research and clinical interest, a longer follow-up will be necessary to determine whether CTL individuals with unusually high index values are at greater risk for memory impairment and eventual conversion to AD. The higher rate of change in the index in AD-like control subjects represents an interesting group for further study to determine if they harbor pre-clinical AD. This is relevant both in the context of clinical trials and early clinical diagnosis. Further studies should focus on individual tracking of disease development using cognitive, structural, functional, and metabolic biomarkers and test whether the proposed index remains valid as a surrogate of neurodegeneration, or more broadly as a proxy of brain integrity.
Conflict of Interest Statement
The authors declare that the research was conducted in the absence of any commercial or financial relationships that could be construed as a potential conflict of interest.
Acknowledgments
This study was supported by InnoMed, (Innovative Medicines in Europe) an Integrated Project funded by the European Union of the Sixth Framework program priority FP6-2004-LIFESCIHEALTH-5, Life Sciences, Genomics and Biotechnology for Health. We would also like to thank Swedish Brain Power, the Strategic Research Programme in Neuroscience at Karolinska Institutet (StratNeuro), the regional agreement on medical training, clinical research (ALF) between Stockholm County Council and Karolinska Institutet, Loo och Hans Ostermans stiftelse för medicinsk forskning, Stiftelsen för ålderssjukdomar vid Karolinska Institutet, Karolinska Institutets forskningsbidrag, Axel och Signe Lagermans donationsstiftelse. Andrew Simmons and Simon Lovestone were supported by funds from NIHR Biomedical Research Centre for Mental Health and NIHR Biomedical Research Unit for Dementia at the South London and Maudsley NHS Foundation Trust and Institute of Psychiatry, Kings College London, as well as the IMI funded European Medical Information Framework and Alzheimer Research UK.
References
Aguilar, C., Westman, E., Muehlboeck, J., Mecocci, P., Vellas, B., Tsolaki, M., et al. (2013). Different multivariate techniques for automated classification of MRI data in Alzheimer's disease and mild cognitive impairment. Psychiatry Res. 212, 89–98. doi: 10.1016/j.pscychresns.2012.11.005
Albert, M. S., DeKosky, S. T., Dickson, D., Dubois, B., Feldman, H. H., Fox, N. C., et al. (2011). The diagnosis of mild cognitive impairment due to Alzheimer's disease: recommendations from the national institute on aging-Alzheimer's association workgroups on diagnostic guidelines for Alzheimer's disease. Alzheimer's Dement. 7, 270–79. doi: 10.1016/j.jalz.2011.03.008
Apostolova, L. G., Dutton, R. A., Dinov, I. D., Hayashi, K. M., Toga, A. W., Cummings, J. L., et al. (2006). Conversion of mild cognitive impairment to Alzheimer disease predicted by hippocampal atrophy maps. Arch. Neurol. 63, 693. doi: 10.1001/archneur.63.5.693
Bogdan, R., Hyde, L. W., and Hariri, A. R. (2012). A neurogenetics approach to understanding individual differences in brain, behavior, and risk for psychopathology. Mol. Psychiatry 18, 288–299. doi: 10.1038/mp.2012.35
Bylesjö, M., Rantalainen, M., Cloarec, O., Nicholson, J. K., Holmes, E., and Trygg, J. (2006). OPLS discriminant analysis: combining the strengths of PLS-DA and SIMCA classification. J. Chemometr. 20, 341–351. doi: 10.1002/cem.1006
Clark, V. H., Resnick, S. M., Doshi, J., Beason-Held, L. L., Zhou, Y., Ferrucci, L., et al. (2012). Longitudinal imaging pattern analysis (SPARE-CD Index) detects early structural and functional changes before cognitive decline in healthy older adults. Neurobiol. Aging 33, 2733–2745. doi: 10.1016/j.neurobiolaging.2012.01.010
Corder, E. H., Saunders, A. M., Strittmatter, W. J., Schmechel, D. E., Gaskell, P. C., Rimmler, J. B., et al. (1995). Apolipoprotein E, survival in Alzheimer's Disease patients, and the competing risks of death and Alzheimer's disease. Neurology 45, 1323–1328. doi: 10.1212/WNL.45.7.1323
Corder, E. H., Saunders, A. M., Strittmatter, W. J., Schmechel, D. E., Gaskell, P. C., Small, G., et al. (1993). Gene dose of apolipoprotein E Type 4 allele and the risk of alzheimer's disease in late onset families. Science 261, 921–923. doi: 10.1126/science.8346443
Cuingnet, R., Gerardin, E., Tessieras, J., Auzias, G., Lehéricy, S., Habert, M.-O., et al. (2011). Automatic classification of patients with Alzheimer's disease from structural MRI: a comparison of ten methods using the ADNI database. Neuroimage 56, 766–781. doi: 10.1016/j.neuroimage.2010.06.013
Cummings, J. L., Mega, M., Gray, K., Rosenberg-Thompson, S., Carusi, D. A., and Gornbein, J. (1994). The neuropsychiatric inventory comprehensive assessment of psychopathology in dementia. Neurology 44, 2308. doi: 10.1212/WNL.44.12.2308
Dale, A. M., Fischl, B., and Sereno, M. I. (1999). Cortical surface-based analysis: I. Segmentation and surface reconstruction. Neuroimage 9, 179–194. doi: 10.1006/nimg.1998.0395
Dale, A. M., and Sereno, M. I. (1993). Improved localizadon of cortical activity by combining EEG and MEG with MRI cortical surface reconstruction: a linear approach. J. Cogn. Neurosci. 5, 162–176. doi: 10.1162/jocn.1993.5.2.162
Davatzikos, C., Fan, Y., Wu, X., Shen, D., and Resnick, S. M. (2008). Detection of prodromal Alzheimer's disease via pattern classification of magnetic resonance imaging. Neurobiol. Aging 29, 514–523. doi: 10.1016/j.neurobiolaging.2006.11.010
Davatzikos, C., Xu, F., An, Y., Fan, Y., and Resnick, S. M. (2009). Longitudinal progression of Alzheimer's-like patterns of atrophy in normal older adults: the SPARE-AD index. Brain 132, 2026–2035. doi: 10.1093/brain/awp091
Desikan, R. S., Ségonne, F., Fischl, B., Quinn, B. T., Dickerson, B. C., Blacker, D., et al. (2006). An automated labeling system for subdividing the human cerebral cortex on MRI scans into gyral based regions of interest. Neuroimage 31, 968–80. doi: 10.1016/j.neuroimage.2006.01.021
Dukart, J., Schroeter, M. L., Mueller, K., and The Alzheimer's Disease Neuroimaging Initiative. (2011). Age correction in dementia – matching to a healthy brain. PLoS ONE 6:e22193. doi: 10.1371/journal.pone.0022193
Eriksson, L., Johansson, E., Kettaneh-Wold, N., Trygg, J., Wikström, C, and Wold, S. (2006). Multi- and Megavariate Data Analysis Part I Basic Principles and Applications. Umeå: MKS Umetrics AB.
Fan, Y., Batmanghelich, N., Clark, C. M., and Davatzikos, C. (2008). Spatial patterns of brain atrophy in MCI patients, identified via high-dimensional pattern classification, predict subsequent cognitive decline. Neuroimage 39, 1731–1743. doi: 10.1016/j.neuroimage.2007.10.031
Ferencz, B., Laukka, E. J., Lövdén, M., Kalpouzos, G., Keller, L., Graff, C., et al. (2013). The influence of APOE and TOMM40 polymorphisms on hippocampal volume and episodic memory in old age. Front. Hum. Neurosci. 7:198. doi: 10.3389/fnhum.2013.00198
Ferreira, D., Molina, Y., Machado, A., Westman, E., Wahlund, L.-O., Nieto, A., et al. (2014). Cognitive decline is mediated by gray matter changes during middle age. Neurobiol. Aging 35, 1086–1094. doi: 10.1016/j.neurobiolaging.2013.10.095
Fischl, B., and Dale, A. M. (2000). Measuring the thickness of the human cerebral cortex from magnetic resonance images. Proc. Natl. Acad. Sci. 97, 11050–11055. doi: 10.1073/pnas.200033797
Fischl, B., Liu, A., and Dale, A. M. (2001). Automated manifold surgery: constructing geometrically accurate and topologically correct models of the human cerebral cortex. IEEE Trans. Med. Imaging 20, 70–80. doi: 10.1109/42.906426
Fischl, B., Salat, D. H., Busa, E., Albert, M., Dieterich, M., Haselgrove, C., et al. (2002). Whole brain segmentation: automated labeling of neuroanatomical structures in the human brain. Neuron 33, 341–355. doi: 10.1016/S0896-6273(02)00569-X
Fischl, B., Salat, D. H., van der Kouwe, A. J. W., Makris, N., Ségonne, F., Quinn, B. T., et al. (2004). Sequence-independent segmentation of magnetic resonance images. Neuroimage 23, S69–S84. doi: 10.1016/j.neuroimage.2004.07.016
Fischl, B., Sereno, M. I., Tootell, R. B. H., and Dale, A. M. (1999). High-resolution intersubject averaging and a coordinate system for the cortical surface. Hum. Brain Mapp. 8, 272–284.
Folstein, M. F., Folstein, S. E., and McHugh, P. R. (1975). Mini-mental state: a practical method for grading the cognitive state of patients for the clinician. J. Psychiatr. Res. 12, 189–198. doi: 10.1016/0022-3956(75)90026-6
Galasko, D., Bennett, D., Sano, M., Ernesto, C., Thomas, R., Grundman, M., et al. (1997). An inventory to assess activities of daily living for clinical trials in alzheimer's disease. Alzheimer Dis. Assoc. Disord. 11, 33–39. doi: 10.1097/00002093-199700112-00005
Hachinski, V. C., Iliff, L. D., Zilhka, E., Du Boulay, G. H., McAllister, V. L., Marshall, J., et al. (1975). Cerebral blood flow in dementia. Arch. Neurol. 32, 632. doi: 10.1001/archneur.1975.00490510088009
Hampel, H., Frank, R., Broich, K., Teipel, S. J., Katz, R. G., Hardy, J., et al. (2010). Biomarkers for Alzheimer's disease: academic, industry and regulatory perspectives. Nat. Rev. Drug Discov. 9, 560–574. doi: 10.1038/nrd3115
Hughes, C. P., Berg, L., Danziger, W. L., Coben, L. A., and Martin, R. L. (1982). A new clinical scale for the staging of dementia. Br. J. Psychiatry 140, 566–572. doi: 10.1192/bjp.140.6.566
Jack, C. R., Bernstein, M. A., Fox, N. C., Thompson, P., Alexander, G., Harvey, D., et al. (2008). The Alzheimer's Disease Neuroimaging Initiative (ADNI): MRI methods. J. Magn. Reson. Imaging 27, 685–691. doi: 10.1002/jmri.21049
Jack, C. R. Jr., Knopman, D. S., Jagust, W. J., Petersen, R. C., Weiner, M. W., Aisen, P. S., et al. (2013). Tracking pathophysiological processes in Alzheimer's disease: an updated hypothetical model of dynamic biomarkers. Lancet Neurol. 12, 207–216. doi: 10.1016/S1474-4422(12)70291-0
Khan, W., Giampietro, V., Ginestet, C., Dell'Acqua, F., Bouls, D., Newhouse, S., et al. (2014). No differences in hippocampal volume between carriers and non-carriers of the ApoE ε 4 and ε 2 alleles in young healthy adolescents. J. Alzheimer's Dis. 40, 37–43. doi: 10.3233/JAD-131841
Klöppel, S., Stonnington, C. M., Chu, C., Draganski, B., Scahill, R. I., Rohrer, J. D., et al. (2008). Automatic classification of MR scans in Alzheimer's disease. Brain 131, 681–689. doi: 10.1093/brain/awm319
Koppel, J., and Goldberg, T. (2009). The genetics of episodic memory. Cogn. Neuropsychiatry 14, 356–376. doi: 10.1080/13546800902990438
Lambert, J.-C., and Amouyel, P. (2011). Genetics of Alzheimer's disease: new evidences for an old hypothesis? Curr. Opin. Genet. Dev. 21, 295–301. doi: 10.1016/j.gde.2011.02.002
Liu, Y., Paajanen, T., Westman, E., Wahlund, L.-O., Simmons, A., Tunnard, C., et al. (2010a). Effect of APOE ε 4 allele on cortical thicknesses and volumes: the AddNeuroMed study. J. Alzheimer's Dis. 21, 947–966. doi: 10.3233/JAD-2010-100201
Liu, Y., Paajanen, T., Westman, E., Zhang, Y., Wahlund, L.-O., Simmons, A., et al. (2010b). APOE ε 2 Allele is associated with larger regional cortical thicknesses and volumes. Dement. Geriatr. Cogn. Disord. 30, 229–237. doi: 10.1159/000320136
Liu, Y., Paajanen, T., Zhang, Y., Westman, E., Wahlund, L.-O., Simmons, A., et al. (2011). Combination analysis of neuropsychological tests and structural MRI measures in differentiating AD, MCI and Control groups—The AddNeuroMed study. Neurobiol. Aging 32, 1198–1206. doi: 10.1016/j.neurobiolaging.2009.07.008
Llano, D. A., Laforet, G., and Devanarayan, V. (2011). Derivation of a new ADAS-Cog composite using tree-based multivariate analysis: prediction of conversion from mild cognitive impairment to Alzheimer disease. Alzheimer Dis. Assoc. Disord. 25, 73–84. doi: 10.1097/WAD.0b013e3181f5b8d8
Magnin, B., Mesrob, L., Kinkingnéhun, S., Pélégrini-Issac, M., Colliot, O., Sarazin, M., et al. (2009). Support vector machine-based classification of Alzheimer's disease from whole-brain anatomical MRI. Neuroradiology 51, 73–83. doi: 10.1007/s00234-008-0463-x
Maioli, S., Puerta, E., Merino-Serrais, P., Fusari, L., Gil-Bea, F., Rimondini, R., et al. (2012). Combination of apolipoprotein e4 and high carbohydrate diet reduces hippocampal BDNF and Arc levels and impairs memory in young mice. J. Alzheimer's Dis. 32, 341–355. doi: 10.3233/JAD-2012-120697
Mangialasche, F., Westman, E., Kivipelto, M., Muehlboeck, J.-S., Cecchetti, R., Baglioni, M., et al. (2013). Classification and prediction of clinical diagnosis of Alzheimer's disease based on MRI and plasma measures of A-/γ-Tocotrienols and Γ-Tocopherol. J. Int. Med. 273, 602–621. doi: 10.1111/joim.12037
Mattila, J., Koikkalainen, J., Virkki, A., Simonsen, A., van Gils, M., Waldemar, G., et al. (2011). A disease state fingerprint for evaluation of Alzheimer's disease. J. Alzheimer's Dis. 27, 163–176. doi: 10.3233/JAD-2011-110365
McKhann, G., Drachman, D., Folstein, M., Katzman, R., Price, D., and Stadlan, E. M. (1984). Clinical diagnosis of Alzheimer's disease report of the NINCDS-ADRDA work group* under the auspices of department of health and human services task force on Alzheimer's disease. Neurology 34, 939. doi: 10.1212/WNL.34.7.939
McKhann, G. M., Knopman, D. S., Chertkow, H., Hyman, B. T., Jack, C. R. Jr., Kawas, C. H., et al. (2011). The diagnosis of dementia due to Alzheimer's disease: recommendations from the national institute on aging-Alzheimer's association workgroups on diagnostic guidelines for Alzheimer's disease. Alzheimer's Dement. 7, 263–269. doi: 10.1016/j.jalz.2011.03.005
Misra, C., Fan, Y., and Davatzikos, C. (2009). Baseline and longitudinal patterns of brain atrophy in MCI patients, and their use in prediction of short-term conversion to AD: results from ADNI. Neuroimage 44, 1415–1422. doi: 10.1016/j.neuroimage.2008.10.031
Morris, J. C., Heyman, A., Mohs, R. C., Hughes, J. P., van Belle, G., Fillenbaum, G., et al. (1989). The consortium to establish a registry for Alzheimer's disease (CERAD). Part I. Clinical and neuropsychological assessment of Alzheimer's disease. Neurology 39, 1159–1165. doi: 10.1212/WNL.39.9.1159
O'Brien, J. T. (2007). Role of imaging techniques in the diagnosis of dementia. Br. J. Radiol. 80, S71–S77. doi: 10.1259/bjr/33117326
Plant, C., Teipel, S. J., Oswald, A., Böhm, C., Meindl, T., Mourao-Miranda, J., et al. (2010). Automated detection of brain atrophy patterns based on MRI for the prediction of Alzheimer's disease. Neuroimage 50, 162–174. doi: 10.1016/j.neuroimage.2009.11.046
Ries, M. L., Carlsson, C. M., Rowley, H. A., Sager, M. A., Gleason, C. E., Asthana, S., et al. (2008). Magnetic resonance imaging characterization of brain structure and function in mild cognitive impairment: a review. J. Am. Geriatr. Soc. 56, 920–934. doi: 10.1111/j.1532-5415.2008.01684.x
Rosen, W. G., Mohs, R. C., and Davis, K. L. (1984). A new rating scale for Alzheimer's disease. Am. J. Psychiatry 141, 1356–1364.
Segonne, F., Dale, A. M., Busa, E., Glessner, M., Salat, D., Hahn, H. K., et al. (2004). A hybrid approach to the skull stripping problem in MRI. Neuroimage 22, 1060–1075. doi: 10.1016/j.neuroimage.2004.03.032
Ségonne, F., Pacheco, J., and Fischl, B. (2007). Geometrically accurate topology-correction of cortical surfaces using nonseparating loops. IEEE Trans. Med. Imaging 26, 518–529. doi: 10.1109/TMI.2006.887364
Simmons, A., Westman, E., Muehlboeck, S., Mecocci, P., Vellas, B., Tsolaki, M., et al. (2009). MRI measures of Alzheimer's disease and the AddNeuroMed study. Ann. N.Y. Acad. Sci. 1180, 47–55. doi: 10.1111/j.1749-6632.2009.05063.x
Simmons, A., Westman, E., Muehlboeck, S., Mecocci, P., Vellas, B., Tsolaki, M., et al. (2011). The AddNeuroMed framework for multi-centre MRI assessment of Alzheimer's disease: experience from the first 24 months. Int. J. Geriatr. Psychiatry 26, 75–82. doi: 10.1002/gps.2491
Sled, J. G., Zijdenbos, A. P., and Evans, A. C. (1998). A nonparametric method for automatic correction of intensity nonuniformity in MRI data. IEEE Trans. Med. Imaging 17, 87–97. doi: 10.1109/42.668698
Small, B. J., Rosnick, C. B., Fratiglioni, L., and Bäckman, L. (2004). Apolipoprotein E and cognitive performance: a meta-analysis. Psychol. Aging 19, 592. doi: 10.1037/0882-7974.19.4.592
Smith, C. D. (2012). Structural imaging in early pre-states of dementia. Biochim. Biophys. Acta 1822, 317–324. doi: 10.1016/j.bbadis.2011.07.002
Sperling, R. A., Aisen, P. S., Beckett, L. A., Bennett, D. A., Craft, S., Fagan, A. M., et al. (2011). Toward defining the preclinical stages of Alzheimer's disease: recommendations from the national institute on aging-Alzheimer's association workgroups on diagnostic guidelines for Alzheimer's disease. Alzheimer's Dement. 7, 280–292. doi: 10.1016/j.jalz.2011.03.003
Sperling, R. A., Karlawish, J., and Johnson, K. A. (2013). Preclinical Alzheimer disease-the challenges ahead. Nature reviews. Neurology 9, 54–58. doi: 10.1038/nrneurol.2012.241
Spulber, G., Simmons, A., Muehlboeck, J.-S., Mecocci, P., Vellas, B., Tsolaki, M., et al. (2013). An MRI-Based index to measure the severity of Alzheimer's disease-like structural pattern in subjects with mild cognitive impairment. J. Int. Med. 273, 396–409. doi: 10.1111/joim.12028
Sun, X., Nicholas, J., Walker, A., Wagner, M. T., and Bachman, D. (2012). APOE genotype in the diagnosis of Alzheimer's disease in patients with cognitive impairment. Am. J. Alzheimer's Dis. Other Dement. 27, 315–320. doi: 10.1177/1533317512452037
Teipel, S. J., Born, C., Ewers, M., Bokde, A. L. W., Reiser, M. F., Möller, H.-J., et al. (2007). Multivariate deformation-based analysis of brain atrophy to predict Alzheimer's disease in mild cognitive impairment. Neuroimage 38, 13–24. doi: 10.1016/j.neuroimage.2007.07.008
Thambisetty, M. (2008). Proteome-based identification of plasma proteins associated with hippocampal metabolism in early Alzheimer's disease. J. Neurol. 255, 1712–1720. doi: 10.1007/s00415-008-0006-8
Thambisetty, M., Simmons, A., Velayudhan, L., Hye, A., Campbell, J., Zhang, Y., et al. (2010). Association of plasma clusterin concentration with severity, pathology, and progression in Alzheimer disease. Arch. Gen. Psychiatry 67, 739. doi: 10.1001/archgenpsychiatry.2010.78
Tondelli, M., Wilcock, G. K., Nichelli, P., De Jager, C. A., Jenkinson, M., and Zamboni, G. (2012). Structural MRI changes detectable up to ten years before clinical Alzheimer's disease. Neurobiol. Aging 33, 825.e25–825.e36. doi: 10.1016/j.neurobiolaging.2011.05.018
Trygg, J., and Wold, S. (2002). Orthogonal Projections to Latent Structures (O-PLS). J. Chemometr. 16, 119–128. doi: 10.1002/cem.695
Velayudhan, L., Proitsi, P., Westman, E., Muehlboeck, J.-S., Mecocci, P., Vellas, B., et al. (2013). Entorhinal cortex thickness predicts cognitive decline in Alzheimer's disease. J. Alzheimer's Dis. 33, 755–766. doi: 10.3233/JAD-2012-121408
Vemuri, P., Gunter, J. L., Senjem, M. L., Whitwell, J. L., Kantarci, K., Knopman, D. S., et al. (2008). Alzheimer's disease diagnosis in individual subjects using structural MR images: validation studies. Neuroimage 39, 1186–97. doi: 10.1016/j.neuroimage.2007.09.073
Vemuri, P., Wiste, H. J., Weigand, S. D., Shaw, L. M., Trojanowski, J. Q., Weiner, M. W., et al. (2009). MRI and CSF biomarkers in Normal, MCI, and AD Subjects: diagnostic discrimination and cognitive correlations. Neurology 73, 287–293. doi: 10.1212/WNL.0b013e3181af79e5
Westman, E., Aguilar, C., Muehlboeck, J.-S., and Simmons, A. (2013). Regional magnetic resonance imaging measures for multivariate analysis in Alzheimer's disease and mild cognitive impairment. Brain Topogr. 26, 9–23. doi: 10.1007/s10548-012-0246-x
Westman, E., Muehlboeck, J., and Simmons, A. (2012). Combining MRI and CSF measures for classification of Alzheimer's disease and prediction of mild cognitive impairment conversion. Neuroimage 62, 229–238. doi: 10.1016/j.neuroimage.2012.04.056
Westman, E., Simmons, A., Zhang, Y., Muehlboeck, J., Tunnard, C., Liu, Y., et al. (2011). Multivariate analysis of MRI Data for Alzheimer's disease, mild cognitive impairment and healthy controls. Neuroimage 54, 1178–1187. doi: 10.1016/j.neuroimage.2010.08.044
Westman, E., Wahlund, L.-O., Foy, C., Poppe, M., Cooper, A., Murphy, D., et al. (2010). Combining MRI and MRS to distinguish between Alzheimer's disease and healthy controls. J. Alzheimer's Dis. 22, 171–181. doi: 10.3233/JAD-2010-100168
Whitwell, J. L., Dickson, D. W., Murray, M. E., Weigand, S. D., Tosakulwong, N., Senjem, M. L., et al. (2012). Neuroimaging correlates of pathologically defined subtypes of Alzheimer's disease: a case-control study. Lancet Neurol. 11, 868–877. doi: 10.1016/S1474-4422(12)70200-4
Wiklund, S., Johansson, E., Sjöström, L., Mellerowicz, E. J., Edlund, U., Shockcor, J. P., et al. (2008). Visualization of GC/TOF-MS-based metabolomics data for identification of biochemically interesting compounds using OPLS class models. Anal. Chem. 80, 115–122. doi: 10.1021/ac0713510
Wisdom, N. M., Callahan, J. L., and Hawkins, K. A. (2011). The effects of apolipoprotein E on non-impaired cognitive functioning: a meta-analysis. Neurobiol. Aging 32, 63–74. doi: 10.1016/j.neurobiolaging.2009.02.003
Keywords: MRI, Alzheimer disease, MCI, APOE4, multivariate statistics, OPLS
Citation: Aguilar C, Muehlboeck J-S, Mecocci P, Vellas B, Tsolaki M, Kloszewska I, Soininen H, Lovestone S, Wahlund L-O, Simmons A and Westman E (2014) Application of a MRI based index to longitudinal atrophy change in Alzheimer disease, mild cognitive impairment and healthy older individuals in the AddNeuroMed cohort. Front. Aging Neurosci. 6:145. doi: 10.3389/fnagi.2014.00145
Received: 10 April 2014; Accepted: 16 June 2014;
Published online: 14 July 2014.
Edited by:
George E. Barreto, Pontificia Universidad Javeriana, ColombiaReviewed by:
Heidi I. L. Jacobs, Research Centre Juelich, GermanyDavide V. Morretti, National Institute of Research and Cure for Mental Disorders and Dementia, Italy
Juan Fortea, Hospital of Sant Pau, Spain
Copyright © 2014 Aguilar, Muehlboeck, Mecocci, Vellas, Tsolaki, Kloszewska, Soininen, Lovestone, Wahlund, Simmons and Westman. This is an open-access article distributed under the terms of the Creative Commons Attribution License (CC BY). The use, distribution or reproduction in other forums is permitted, provided the original author(s) or licensor are credited and that the original publication in this journal is cited, in accordance with accepted academic practice. No use, distribution or reproduction is permitted which does not comply with these terms.
*Correspondence: Carlos Aguilar, Division of Clinical Geriatrics, Department of Neurobiology, Care Sciences and Society, Karolinska Institutet, Hälsovägen 7, Novum, Plan 5, SE-14186, Stockholm, Sweden e-mail: carlos.aguilar@ki.se
†These authors have contributed equally to this work.