A Systems View of the Differences between APOE ε4 Carriers and Non-carriers in Alzheimer’s Disease
 Shan Jiang
 Ling Tang1‡
  Yu Qiu
- 1Department of Pharmacology, Institute of Medical Sciences, Shanghai Jiao Tong University School of Medicine, Shanghai, China
- 2Department of Paediatrics and Adolescent Medicine, Li Ka Shing Faculty of Medicine, The University of Hong Kong, Pokfulam, Hong Kong
APOE ε4 is the strongest genetic risk factor for late-onset Alzheimer’s disease (AD) and accounts for 50–65% of late-onset AD. Late-onset AD patients carrying or not carrying APOE ε4 manifest many clinico-pathological distinctions. Thus, we applied a weighted gene co-expression network analysis to identify specific co-expression modules in AD based on APOE ε4 stratification. Two specific modules were identified in AD APOE ε4 carriers and one module was identified in non-carriers. The hub genes of one module of AD APOE ε4 carriers were ISOC1, ENO3, GDF10, GNB3, XPO4, ACLY and MATN2. The other module of AD APOE ε4 carriers consisted of 10 hub genes including ANO3, ARPP21, HPCA, RASD2, PCP4 and ADORA2A. The module of AD APOE ε4 non-carriers consisted of 16 hub genes including DUSP5, TNFRSF18, ZNF331, DNAJB5 and RIN1. The module of AD APOE ε4 carriers including ISOC1 and ENO3 and the module of non-carriers contained the most highly connected hub gene clusters. mRNA expression of the genes in the cluster of the ISOC1 and ENO3 module of carriers was shown to be correlated in a time-dependent manner under APOE ε4 treatment but not under APOE ε3 treatment. In contrast, mRNA expression of the genes in the cluster of non-carriers’ module was correlated under APOE ε3 treatment but not under APOE ε4 treatment. The modules of carriers demonstrated genetic bases and were mainly enriched in hereditary disorders and neurological diseases, energy metabolism-associated signaling and G protein-coupled receptor-associated pathways. The module including ISOC1 and ENO3 harbored two conserved promoter motifs in its hub gene cluster that could be regulated by common transcription factors and miRNAs. The module of non-carriers was mainly enriched in neurological, immunological and cardiovascular diseases and was correlated with Parkinson’s disease. These data demonstrate that AD in APOE ε4 carriers involves more genetic factors and particular biological processes, whereas AD in APOE ε4 non-carriers shares more common pathways with other types of diseases. The study reveals differential genetic bases and pathogenic and pathological processes between carriers and non-carriers, providing new insight into the mechanisms of the differences between APOE ε4 carriers and non-carriers in AD.
Introduction
Alzheimer’s disease (AD) is one of the leading causes of dementia and is characterized by cognitive decline with distinctive brain pathology such as amyloid plaques and neurofibrillary tangles (Selkoe, 2003). Rare familial AD (FAD) is an early onset disease and is caused by several definite and specific genes, such as amyloid precursor protein (APP) and presenilin 1 and 2 (PSEN1, PSEN2) (Scheuner et al., 1996; Campion et al., 1999). In contrast, the etiology of the most common form of non-familial late-onset AD appears to be more complicated. Thus far, many genetic loci have been identified to be risk factors of late-onset AD through genome-wide association studies (GWAS) (Harold et al., 2009; Naj et al., 2011; Kauwe et al., 2014). Moreover, alterations in many molecules and biological processes have been recognized in AD (Mattson, 2004). A biological process may involve dozens and even hundreds of molecules, and a molecule may participate in multiple biological processes. It seems impractical to uncover the relationships among all of these molecules and biological processes one by one. Thus, the exploration of the pathogenic and pathological mechanisms of AD in a systematic view may be more appropriate.
APOE is the strongest susceptible gene of late-onset AD (Wijsman et al., 2011). APOE exists as three polymorphic alleles ε2, ε3, and ε4. Individuals with one or two copies of APOE ε4 have a higher risk of developing AD than the carriers of other isoforms (Corder et al., 1993). AD patients carrying or not carrying APOE ε4 manifest many clinico-pathological distinctions. Patients who are APOE ε4 carriers perform worse on memory tasks than non-carriers (Marra et al., 2004). Patients of APOE ε4 non-carriers exhibit impairments in naming, mental speed and executive function (van der Vlies et al., 2007; Wolk et al., 2010). A positron emission tomography study indicated different perfusion profiles in the brains of APOE ε4 carriers and non-carriers during a working memory task (Scarmeas et al., 2004). Moreover, AD APOE ε4 carrier’s display significantly reduced blood flow in the temporal and hippocampal areas (Suwa et al., 2015). In addition, APOE ε4 carriers have greater amyloid deposition and APOE ε4 can predict the atrophy rates across brain regions affected by AD (Jack et al., 2015; Hua et al., 2016). Moreover, previous studies have demonstrated that different drug responses are observed in APOE ε4 carriers and non-carriers. A neuroprotective agent facilitating brain noradrenergic and vasopressinergic activities have been shown to improve the Minimum Mental State Examination (MMSE) score in APOE ε4 carriers but not in non-carriers (Richard et al., 1997). A higher dose of bapineuzumab, an anti-β-amyloid peptide (Aβ) monoclonal antibody, is needed to decrease cerebrospinal fluid phospho-tau concentration in APOE ε4 non-carriers than in carriers (Salloway et al., 2014). All the evidence indicates that different pathogenic and pathologic processes are involved in the disease progression of AD patients with different APOE ε4 statuses. APOE ε4 has been shown to affect Aβ aggregation, promote neurofibrillary tangle formation and impair synaptic plasticity (Bu, 2009), which are all pathological hallmarks of AD. However, these harmful effects of APOE ε4 do not fully explain the clinico-pathological phenotypic distinctions between APOE ε4 carriers and non-carriers of AD patients. Furthermore, APOE ε4 only accounts for 50–65% of late-onset AD. Therefore, patient stratification based on APOE ε4 status can allow for the exploration of the underlying mechanisms of clinico-pathological distinctions between APOE ε4 carriers and non-carriers and may further help to elucidate the molecular mechanisms of AD which could be masked when combining APOE ε4 carriers and non-carriers together.
The transcriptome bridges the gap between genetic variation and the function of the molecules. Knowing its structure permits the exploration of the comprehensive function of molecules that could be influenced by genetic and non-genetic factors. With the availability of a transcriptome dataset (Webster et al., 2009), we analyzed the transcription profiles of AD patients based on APOE ε4 status by applying a systems biology approach, weighted gene co-expression network analysis (WGCNA) (Langfelder and Horvath, 2008). WGCNA allows for the identification of groups of genes (called modules) whose expression is highly correlated within a network. Then, specific co-expression modules can be obtained by comparing the modules identified in different sub-datasets. Using this method, we identified different co-expression modules and revealed different biological processes involved in AD APOE ε4 carriers and non-carriers.
Materials and Methods
Microarray Dataset
The microarray dataset was downloaded from Gene Expression Ominibus (GEO)1. The dataset, GSE15222, measured on GPL2700 using Illumina Sentrix Human Ref-8 Expression Bead Chip which covers 24354 probesets consists of human cerebral cortex samples of 188 controls and 176 patients with diagnosis of late-onset AD. The original expression data were rank-invariant by BeadStudio software available from Illumina and the Illumina custom error model was used. Rank-invariant-normalized expression data were log10 transformed, and missing data were encoded as missing, rather than as a zero level of expression. Chips with average detection scores less than 0.99 (5% of control chips, 8% of late-onset AD chips) were excluded from the analysis. Transcripts that were detected in less than 90% of the case or 90% of the control series were excluded from our study. Finally 8650 high quality transcripts were obtained (Webster et al., 2009). Of the 188 controls, 40 were APOE ε4 carriers and 148 were non-carriers. Of the 176 patients, 121 were APOE ε4 carriers and 55 were non-carriers.
Sub-dataset-specific Co-expression Module Detection by WGCNA
The WGCNA package which provides a robust set of R functions was used to detect sub-dataset-specific modules (Langfelder and Horvath, 2008). GSE15222 was divided into four sub-datasets: patients carrying APOE ε4, patients not carrying APOE ε4, controls carrying APOE ε4 and controls not carrying APOE ε4. Outliers were filtered out using Euclidian distance as the similarity measure and average linkage as an agglomeration method. For each sub-group, subjects were clustered based on their dissimilarity, and any arrays with average inter-subject correlation less than 2 standard deviations below the mean were removed. This process was repeated until no arrays needed to be removed (Oldham et al., 2008). One outlier was detected in AD APOE ε4 non-carriers and was excluded before the construction. A demographic depiction of the subjects was performed to examine the similarity of sub-datasets. To construct the network, Pearson correlation coefficients were calculated for all possible gene pairs, and then the coefficients were powered by an exponent β in each sub-group stratified by APOE ε4 and phenotypes. A high β maintains high adjacencies but pushes lower adjacencies toward zero. An optimal exponent β can reduce the false positive rate within the network to the utmost extent (Zhang and Horvath, 2005). The dynamic tree-cutting algorithm was then used to identify modules after the summarization of similar patterns of connectivity among genes as topological overlap matrix (TOM) (Langfelder et al., 2008). Modules with similar module eigengenes (ME) were merged together. Unsupervised average linkage hierarchical clustering identified 18 modules in AD APOE ε4 carriers, 21 modules in AD APOE ε4 non-carriers, 10 modules in control APOE ε4 carriers and 8 modules in control APOE ε4 non-carriers. Next, consensus modules (AD APOE ε4 carriers and non-carriers, AD and control APOE ε4 carriers, and AD and control APOE ε4 non-carriers) were constructed with a similar procedure to that illustrated above. A detailed description of consensus module construction can be found at the WGCNA tutorial website2.
The modules constructed using the sub-dataset of AD APOE ε4 carriers were compared with the consensus modules of AD APOE ε4 carriers and non-carriers, and with the consensus modules of AD and control APOE ε4 carriers to detect specific modules of AD APOE ε4 carriers. The modules constructed using the sub-dataset of AD APOE ε4 non-carriers were compared with the consensus modules of AD APOE ε4 carriers and non-carriers, and with the consensus modules of AD and control APOE ε4 non-carriers to detect specific modules of AD APOE ε4 non-carriers. Then, the module preservation statistic Zsummary was utilized to further examine the sub-dataset-specificity of the modules (Langfelder et al., 2011). Unlike the cross-tabulation test, Zsummary takes into account both overlaps in module membership and the density and connectivity patterns of the modules. The following recommended significant thresholds for Zsummary were adopted: Zsummary <2 implies no evidence of module preservation, 2 < Zsummary < 10 implies weak to moderate evidence of module preservation, and Zsummary > 10 implies strong evidence for module preservation. Greater module preservation corresponds to lesser specificity of the module to the sub-dataset. Thus, a Zsummary less than 2 indicates strong evidence of specificity of the module, a Zsummary between 2 and 10 indicates modest evidence of specificity of the module and a Zsummary more than 10 indicates no evidence of specificity of the module. Module networks were graphically depicted using the program Cytoscape3.
Then random samplings with two different levels (50 and 75%) were performed with each level carried out five times. The criterion of replication is that more than 80% of genes within one of the modules (violet, dark magenta and light cyan) detected among the total samples should be included in one module detected in random samplings. Moreover, modules that were obtained from random samplings and whose genes are overlapped more than 80% with violet, dark magenta or light cyan modules should be AD APOE ε4 carrier or non-carrier-specific.
Hub genes were identified by WGCNA via measures of intramodular connectivity and module membership (Zhang and Horvath, 2005; Dewey et al., 2011; Langfelder et al., 2011; de Jong et al., 2012). Intramodular connectivity measures how a given gene is connected, or co-expressed, with the genes of a particular module. Module membership measures the membership of the i-th gene with respect to a given module. Hub genes tend to own high values of intramodular connectivity and module membership.
Module eigengene values adjusted for phenotype, age and sex were used to test differential expression of conserved modules between AD and control APOE ε4 carriers and between AD and control APOE ε4 non-carriers, and the values adjusted for APOE ε4 status, age and sex were used to test differential expressions of conserved modules between AD APOE ε4 carriers and non-carriers.
Hub Gene Complete Graph Detection
R package graph was utilized to detect whether there was/were complete graph(s) comprised of hub genes in sub-dataset-specific modules.
Primary Neuron Culture and Quantitative RT-PCR
Primary neurons were derived from the hippocampus of Sprague–Dawley (SD) rats at postnatal day 1 as previously described (Kam et al., 2010). Neurons were plated at a density of 2 × 10⁶ cells/well on poly-L-lysine-treated 6-well plate. The neurons were treated with recombinant human APOE ε4 or ε3 at a concentration of 5 μg/ml or without APOE treatment on DIV19 and collected for RNA extraction after 24, 48, and 72 h of treatment. Total RNA was extracted using a Total RNA kit 1 from Sigma (St. Louis, MO, USA). RNA was reverse transcribed to synthesize cDNA by using M-MLV reverse transcriptase (Invitrogen, Carlsbad, CA, USA). Real-time PCR was performed using SYBR Green (Roche Diagnostics, Basel, Switzerland). GAPDH was used as the normalization control. The relative mRNA levels were calculated by a comparative Cp value. The primers used were: ENO3: sense: AGCTGCTACCTAGGCAC TCT, antisense: GGTTCCGTCCAGCTCAATCA; GNB3: sense: TTTCACTGGCCACGAGTCAG, antisense: CTCTCGTGGGAG TAGGCTGT; XPO4: sense: GGAATTCAGCAGACGGGAGA, antisense: TAGTGTTTTGGAGGGAGAAAATTCC; GDF10: sense: AATCATCAAGGCTGCCCGAA, antisense: CTGGACC AGAACTCGTGCTT; ISOC1: sense: GCTGCACTAACAAAAC GCCA, antisense: TCATGGGACGGCAGGATAGA; ACLY: sense: GGTAAGCTGGTGCTTACGGA, antisense: TCTGGA TGGCTGAGGTGGTA; DUSP5: sense: GCCGACATTAGCTCC CACTT, antisense: GCCAAAGTTGGGAGAGACCA; TNFR SF18: sense: CACGTGTCCCCGAGATACC, antisense: GTCCC CCAGACGACACTTTT; DNAJB5: sense: CTCCTCACCGCA GCACC, antisense: TTCTCCTCAGCGTTGGGTTC; HILPDA: sense: GCCTGCACGATCTAGTGTGA, antisense: GCACTCC TCTGGATGGATGG; TBC1D8: sense: TGTATTCTCCCATAGC ATGTGGT, antisense: GTCTCCTCAGCGATCAGAGC; BDNF: sense: ACTGTCCTGCTACCGCAGTTG, antisense: GGGTCGC AGAACCGCTAAA; ST8SIA5: sense: ACTTCGTCTTCCGGTG CAAT, antisense: GGAAGTCGTCCAGCATGTACT; CHST12: sense: GGTCTCCTTCGCCAACTTCA, antisense: AGCATCC TCATCCAGGGTCT; ATF5: sense: GTGCCTAGGGTACAGGA GGA, antisense: GCAGAGGGGAGACCTAGACA; CSNK1D: sense: CACCTCACAGATTCCCGGTC, antisense: GCTCTTG GAGCCTGTCCATT; PLIN2: sense: ATTCGCCAGGAAGAAT GTGC, antisense: TGGCATGTAGTGTGGAGCTG.
Functional Annotations of Sub-dataset-specific Modules
Functional annotations of sub-dataset-specific modules were obtained by applying ingenuity pathway analysis (IPA)4. IPA is a large manually curated database of published information on mammalian biology and diseases. It is widely used for high quality gene set enrichment analyses. Fisher’s exact tests were utilized to calculate the P-values for each functional annotation by comparing the number of genes from the module of interest that participated in the specified IPA term against the total number of genes from the term in the background set (Khatri et al., 2012).
GWAS Dataset Preparation and Module-Based GWAS Signal Enrichment Test
The GWAS (Myers) was carried out in the same population as that of the microarray dataset we utilized, and the dataset was directly downloaded from the Myers laboratory5. For replication, the GWAS dataset from the Multi-Site Collaborative Study for Genotype-Phenotype Associations in Alzheimer’s Disease (GenADA) (Li et al., 2008) was downloaded from dbGaP6, the GWAS dataset from the Alzheimer’s Disease Neuroimaging Initiative (ADNI) (Mueller et al., 2005) was downloaded from the ADNI database7, and the dataset from the International Genomics of Alzheimer’s Project (IGAP) (Lambert et al., 2013) was downloaded from http://www.pasteur-lille.fr/en/recherche/u744/igap/igap_download.php.
We excluded single nucleotide polymorphisms (SNPs) with a missing genotype rate > 0.1, a minor allele frequency (MAF) < 0.01 and a Hardy–Weinberg equilibrium (HWE) < 0.001. Finally, after quality control, 364048, 431284, and 567199 SNPs from the Myers, GenADA and ADNI datasets, respectively, were included for APOE ε4 carriers, and 374149, 427678, and 566459 SNPs from the Myers, GenADA and ADNI datasets, respectively, were included for APOE ε4 non-carriers. GWAS dataset preparation and quality control procedures were performed using the software package PLINK8, release v 1.07 (Purcell et al., 2007). Processed data of IGAP were downloaded from the following link: http://www.pasteur-lille.fr/en/recherche/u744/igap/igap_download.php.
A previously reported procedure of GWAS signal enrichment test, called i-GSEA4GWAS, was employed (Zhang et al., 2010). First, the maximum -log(P-value) of the SNPs located between 20 kb upstream and downstream of a gene boundary was assigned to represent the gene, and the min P-value method, which does not excessively penalize large genes if causative associations are proportionally more common in smaller genes, has been widely used in systems biology (Baranzini et al., 2009; Jia et al., 2010). Instead of the commonly used phenotype label permutation, SNP label permutations were implemented to generate the distribution of the enrichment score (ES), and then the gene set’s significance proportion based enrichment score (SPES) was calculated based on genes’ rank using the following equation: SPES = k/K ×ES, where k is the proportion of significant genes of the gene set and K is the proportion of significant genes of the total number of genes in the GWAS (Zhang et al., 2010). Gene-length bias was eliminated by applying adaptive permutation in PLINK before i-GSEA4GWAS. False discovery rate was applied for multiple comparison correction. Then, a comparative quantile-quantile (QQ) plot was used to demonstrate the differences among all genes and genes within the interested modules of APOE ε4 carriers, and the genomic dispersion factor, λ, was used to assess the strengths of genetic association signals and to quantify the differences when compared with the signals of all genes. The comparative QQ plot was produced by plotting the ranked -log10(P-value) against the expected order statistic, -log10[i/(L+1)], where i is the rank for each SNP P-value (1 = smallest and L = largest), and L is the number of SNPs. Function estlambda() within the R package GenABEL was utilized to estimate the genomic dispersion factor λ. If a co-expression module was genetically associated, significant SNPs within 20 kb upstream and downstream of the gene boundaries within the module in the sub-group in which it belongs (APOE ε4 carrier sub-group or APOE ε4 non-carrier sub-group) were identified, and the significance of these SNPs in its opposite sub-group were also calculated.
Phylogenetically Conserved Promoter Motif Identification in Hub Genes of the Complete Graph
The conserved promoter motif(s) was/were identified by PhyloCon. PhyloCon, which stands for Phylogenetic Consensus, is one of the first motif-finding algorithms to combine the power of phylogenetic conservation and gene co-regulation (Wang and Stormo, 2003; Wang, 2007). PhyloCon first aligns conserved regions of orthologous sequences into multiple sequence alignments, or profiles, and then compares profiles representing non-orthologous sequences. Then, motifs represented by matrices or IUPAC strings emerge as common regions in these profiles (Wang, 2007). An online web server named WebLogo was used to generate the sequence logos of the motifs (Crooks et al., 2004). In the present study, orthologous sequences of the species Homo sapiens, Rattus norvegicus, Mus musculus, and Canis lupus familiaris were utilized. For promoter regions, the 4 kb segments centered on the annotated transcription start site (TSS) of each human RefSeq gene were extracted according to a previous study’s method (Xie et al., 2005). If the annotated translation start codon was within 2 kb of the TSS, the shorter region that did not overlap the protein-coding sequence was selected. For genes with alternatively spliced first exons, all promoters were included. Details for promoter region detection are given in a previous study (Xie et al., 2005).
JASPAR CORE database and miRWalk were utilized to identify common human transcription factors (TFs), TF binding sites (TFBS) and common miRNAs of the conserved motif(s) and these highly connected genes. The JASPAR CORE database, which contains a curated, non-redundant set of profiles, is derived from published collections of experimentally defined transcription factor binding sites for eukaryotes, The matrices and IUPAC strings were then input into the JASPAR CORE database to identify common human TFs and the TF binding sites (TFBS) of these co-expressed genes (Mathelier et al., 2014). miRWalk, a comprehensive database that incorporates miRNA-targets interactions information produced by eight established miRNA prediction programs on 3′ UTRs of all known genes, was utilized to evaluate whether some miRNAs exist as the common regulators of the mRNAs of genes within the same complete graph post-transcriptionally (Dweep et al., 2011). In the present study, five default prediction programs, miRanda, miRDB, miRWalk, RNA22, and TargetScan, were used. If a miRNA was predicted by at least two prediction programs, it was regarded to bind to the gene with high probability.
AD and Parkinson’s Disease (PD), Bipolar Disease (BD) Consensus Pathogenic Module Identification
GEO dataset GSE202959 for PD and GSE1265410 for BD were extracted. The procedures for PD and BD co-expression network construction and module detection were the same as those of AD. Then, each PD- or BD-specific module was compared with AD-specific modules via hypergeometric tests which examined whether the number of genes overlapped between PD or BD and AD was significantly larger than that expected by chance.
Results
Specific Co-expression Module Detection in AD APOE ε4 Carriers and Non-carriers
The demographic characteristics of the enrolled subjects after excluding outlier samples demonstrated no differences (Supplementary Table S1). By applying WGCNA, we identified two specific co-expression modules (violet and dark magenta) in AD APOE ε4 carriers and one module (light cyan) in AD APOE ε4 non-carriers (Figure 1). The permutation-based preservation statistic, Zsummary, demonstrated that the Zsummary statistics of the identified three modules were all less than 2 when assessing the violet and dark magenta modules of AD APOE ε4 carriers in AD APOE ε4 non-carriers and control APOE ε4 carriers and when assessing the light cyan module of AD APOE ε4 non-carriers in AD APOE ε4 carriers and control APOE ε4 non-carriers, showing no evidence of module preservation in these sub-datasets (Figure 1; Supplementary Table S2). These results strongly indicated that the three co-expression modules were sub-dataset-specific. Network visualizations of the violet and dark magenta modules in AD APOE ε4 carriers and the light cyan module in AD APOE ε4 non-carriers are shown in Figures 2A–C, respectively (Supplementary Tables S3–S5 for full list of genes of violet, dark magenta and light cyan modules respectively). The identified hub genes (most centered genes) are shown in Supplementary Tables S3–S5. Moreover, six of the seven hub genes (ISOC1, ENO3, GDF10, GNB3, XPO4 and ACLY, Supplementary Table S3) of the violet module and all the hub genes of the light cyan module (Supplementary Table S5) were found to be highly connected as demonstrated to form a complete graph respectively, which represents the most highly connected gene cluster in biological network and tends to be very important (Jeong et al., 2001; Horvath and Dong, 2008) (Figure 2D; Supplementary Table S6 for the pairwise Pearson correlation coefficients for the violet module and Figure 2E; Supplementary Table S7 for the pairwise Pearson correlation coefficients for the light cyan module).
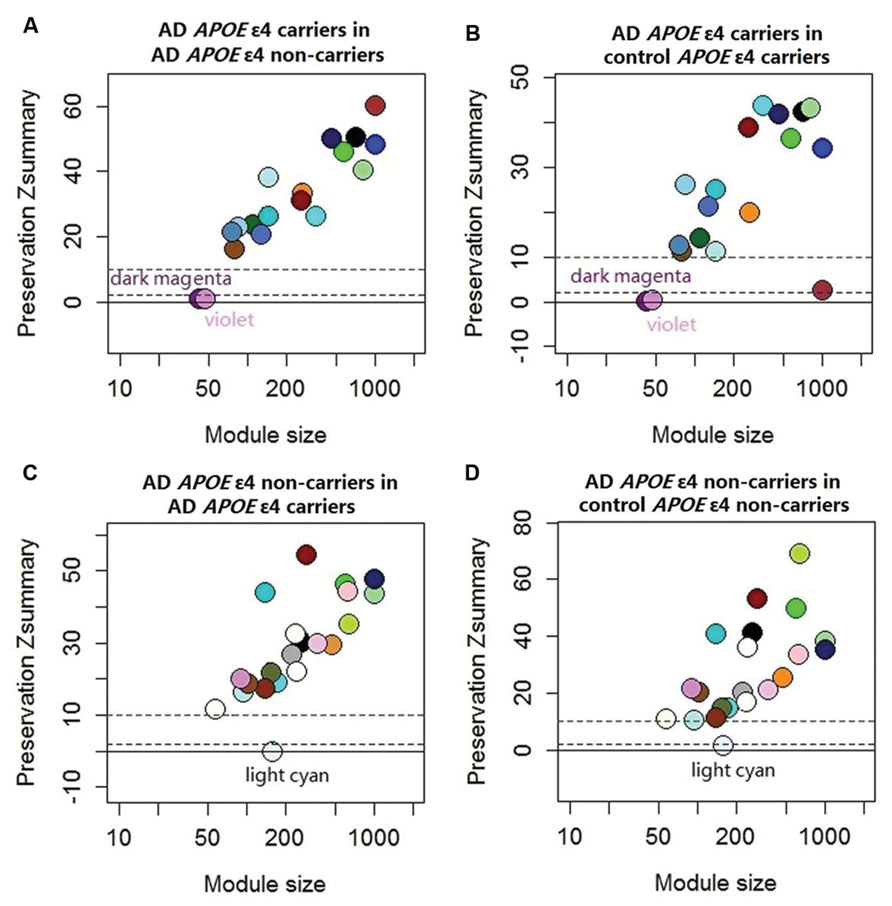
FIGURE 1. Preservation statistic of modules detected in the test sub-dataset in the reference sub-dataset. The Zsummary = 2 and Zsummary = 10 thresholds are indicated by dashed lines. Zsummary less than 2 implies no evidence of module preservation, which indicates strong evidence of module specificity. Zsummary between 2 and 10 implies modest evidence of module preservation and Zsummary more than 10 implies strong evidence of module preservation, which indicates modest or no evidence of module specificity. (A) Module preservation of AD APOE ε4 carriers in AD APOE ε4 non-carriers; (B) Module preservation of AD APOE ε4 carriers in control APOE ε4 carriers; (C) Module preservation of AD APOE ε4 non-carriers in AD APOE ε4 carriers; (D) module preservation of AD APOE ε4 non-carriers in control APOE ε4 non-carriers. See Supplementary Table S2 for exact Zsummary statistics.
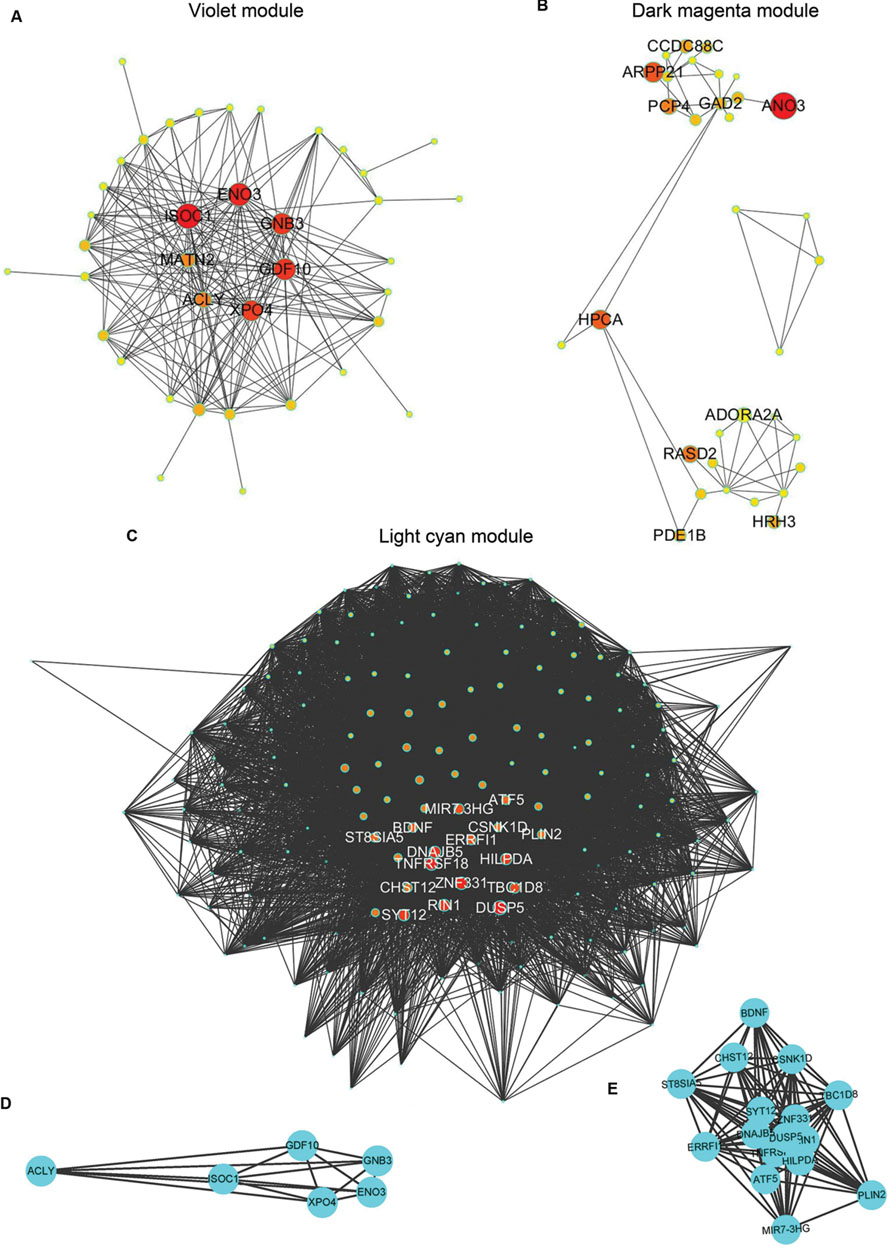
FIGURE 2. Graphic visualization of modules and complete graphs identified in AD APOE ε4 carriers and non-carriers. (A–C) Graphic visualization of the violet (A), and dark magenta (B) modules for AD APOE ε4 carriers and the light cyan module (C) for AD APOE ε4 non-carriers with hub genes. Nodes were filled with different intermediate colors varying from red to ivory white, where red represents high intramodular connectivity and ivory white represents low connectivity. Edges were weighted by the strengths of the connections between two nodes, for which shorter edges correspond to stronger relationships and vice versa. (D) Complete graph of the top six hub genes in the violet module of AD APOE ε4 carriers. (E) Complete graph of the top sixteen hub genes in the light cyan module of AD APOE ε4 non-carriers.
Furthermore, we examined whether the non-specific co-expression modules were differentially expressed between AD and control APOE ε4 carriers, between AD and control APOE ε4 non-carriers, and between AD APOE ε4 carriers and non-carriers. In the results, no differences were found (data not shown), demonstrating that these non-specific co-expression modules were completely conserved.
Due to the unavailability of other AD-associated datasets with APOEε4 status, we carried out random samplings for replication. All three modules could be replicated (Supplementary Table S8).
Highly Connected Hub Genes Detected in the Violet and Light Cyan Modules Co-expressed in a Time-Dependent Manner Dependent on APOE Types
The highly connected hub genes in the complete graph implicate that the expression of these genes is correlated. Thus, we examined the co-expression patterns of these genes in primary cultured neurons treated with APOE ε3 or APOE ε4. As shown in Figure 3A, the mRNA expressions of all six genes (ISOC1, ENO3, GDF10, GNB3, XPO4 and ACLY) in the complete graph of the violet module of AD APOE ε4 carriers demonstrated a similar time-dependent patterns in neurons treated with physiological concentration of APOE ε4, whereas, no such patterns were observed in neurons treated with APOE ε3 or in untreated neurons (Figures 3B,C). The pairwise Pearson correlation coefficient matrix of the expressions showed the high correlations between either two genes expressed in the APOE ε4-treated neurons (Supplementary Table S9) with a mean absolute Pearson correlation coefficient of 0.902, which is markedly higher than the mean absolute Pearson correlation coefficients for neurons treated with APOE ε3 (0.613) or for untreated neurons (0.571) (Supplementary Tables S10 and S11 for the pairwise Pearson correlation coefficient matrices for APOE ε3-treated neurons and for untreated neurons, respectively). These results confirm the co-expression of these six genes detected in the violet module.
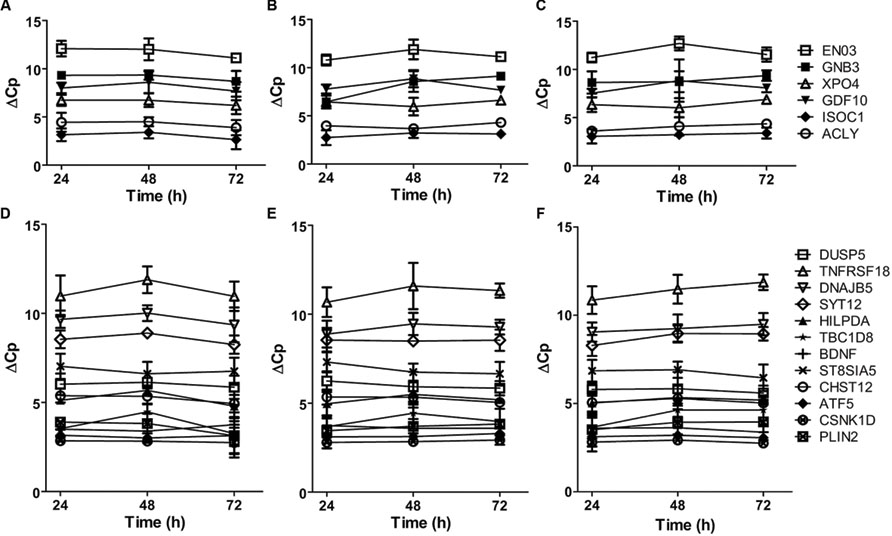
FIGURE 3. Time-dependent mRNA expression of genes within the complete graphs of the violet and light cyan modules. (A–C) The mRNA expression of six genes within the complete graph of the violet module of AD APOE ε4 carriers. The legends of the six genes are shown on the right. (D–F) The mRNA expression of twelve genes within the complete graph of the light cyan module of AD APOE ε4 non-carriers. The legends of the 12 genes are shown on the right. The primary cultured neurons were treated with recombinant human APOE ε4 (A,D) or ε3 (B,E) at the concentrations of 5 μg/ml or without APOE treatment (C,F) on DIV19 and collected for quantitative RT-PCR after 24, 48, and 72 h of treatment. The relative mRNA levels were calculated by a comparative Cp value. The data are presented as the mean ± SD from at least three independent experiments.
The mRNA expression of 12 genes in the complete graph of light cyan module of AD APOE ε4 non-carriers displayed similar or opposite time-dependent patterns in primary cultured neurons treated with APOE ε3 (Figure 3E). The pairwise Pearson correlation coefficient matrix showed positive or negative correlations between most gene pairs (Supplementary Table S12), with a mean absolute Pearson correlation coefficient of 0.834. These results validated the co-expression of genes in the complete graph of the light cyan module. The co-expression patterns were much weaker in neurons treated with APOE ε4 and in untreated neurons (Figure 3D, Supplementary Table S13 for the pairwise Pearson correlation coefficient matrix for APOE ε4-treated neurons and Figure 3F, Supplementary Table S14 for untreated neurons, the mean Pearson correlation coefficients were 0.616 and 0.629, respectively).
Differential Biological Processes Enriched in Specific Modules
Co-expressed genes in a module may directly interact with each other or take part in the same biological processes and signaling pathways. Hub genes within each module may play pivotal roles in module function. Thus, IPA was employed for further analysis.
As shown in Figure 4A, the genes of the violet module identified in AD APOE ε4 carriers were enriched in hereditary disorders, neurological diseases, psychological disorders, and nervous system development and function (Supplementary Table S15). The first two hub genes, ISOC1 and ENO3, were enriched in the first annotation, hereditary disorders. These two hub genes and another hub gene GNB3 were enriched in neurological diseases (Supplementary Table S16). The primarily enriched signaling pathways were acetyl-CoA biosynthesis III (from citrate), NAD biosynthesis III, NAD salvage pathway III and NAD biosynthesis from 2-amino-3-carboxymuconate semialdehyde (Figure 4B; Supplementary Table S17), which are mainly energy metabolism-associated signaling pathways. Two relatively important energy metabolism-associated signaling pathways, gluconeogenesis I and glycolysis I, were enriched by the hub gene ENO3 (Supplementary Table S17). Genes of the dark magenta module were mostly enriched in hereditary disorders, neurological diseases, psychological disorders, and G protein-coupled receptors (GPCRs) and second messenger-associated signaling pathways of GPCRs (Figures 4C,D, see Supplementary Tables S18–S20 for all enriched IPA terms). The protein level of the hub gene, GAD2, which catalyzes glutamate to γ-aminobutyric acid, has been reported to be reduced in some cerebral regions of AD patients (Schwab et al., 2013).
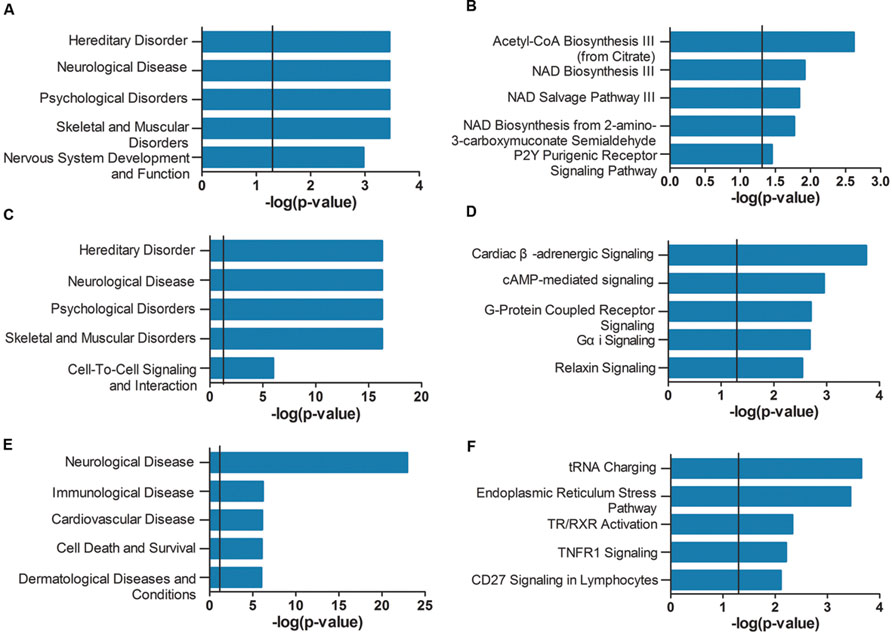
FIGURE 4. Ingenuity pathway analysis (IPA) gene set enrichment analysis of the modules identified in AD APOE ε4 carriers and non-carriers. IPA-identified top five diseases and functions (A,C,E) and top five canonical pathways (B,D,F) of the violet (A,B) and dark magenta (C,D) modules of AD APOE ε4 carriers and of the light cyan module (E,F) of AD APOE ε4 non-carriers. The verticals indicate the significant thresholds set by IPA.
Unlike the modules identified in AD APOE ε4 carriers, genes of the light cyan module identified in AD APOE ε4 non-carriers were enriched in some other types of diseases, such as immunological and cardiovascular diseases, in addition to the primarily enriched neurological diseases (Figure 4E, see also Supplementary Table S21). The top-ranked hub gene, DUSP5, was enriched in neurological diseases (Supplementary Table S22). Moreover, another hub gene, BDNF, has been widely reported to be related to AD (Tapia-Arancibia et al., 2008). Our analysis also demonstrated that approximately 66% of enriched genes found in either immunological or cardiovascular diseases were also found in neurological diseases (Supplementary Figure S1). However, genes within the two modules of AD APOE ε4 carriers were not highly enriched in immunological and cardiovascular diseases (Supplementary Tables S16 and S19). In addition, genes of the light cyan module were mainly enriched in the following signaling pathways: tRNA charging, endoplasmic reticulum (ER) stress pathway, TR/RXR (thyroid hormone receptor/retinoid X receptor) activation and TNFR1 (tumor necrosis factor receptor type 1) signaling (Figure 4F; Supplementary Table S23).
Module-Based Enrichment of Genetic Association Signals
Next, we examined whether the three sub-dataset-specific co-expression modules had genetic bases. The violet module in AD APOE ε4 carriers showed significant enrichment of signals from the GWAS dataset of Myers of the corresponding APOE ε4 carriers in the gene expression data [P < 0.001 and P < 0.001 after false discovery rate (FDR) correction, Figure 5A]. Moreover, the significant enrichment of signals was replicated in the other two GWAS datasets of APOE ε4 carriers (P = 0.014 for the data from GenADA and P = 0.034 for the data from ADNI, Figures 5B,C). The dark magenta module of AD APOE ε4 carriers only showed a significant enrichment of signals from the GenADA GWAS dataset of APOE ε4 carriers (P = 0.015, Supplementary Figure S2). Comparative QQ plots showed that genes within violet and dark magenta modules, especially the violet module, deviated from the expected values even further compared with the black dots, which represent all genes (Figures 5D–F). The larger genomic dispersion factors (λviolet and λdarkmagenta) further validated their genetic bases (Figures 5D–F). Furthermore, genes in these two modules showed significant enrichment of signals from the IGAP GWAS dataset, which is the biggest AD-associated GWAS dataset to date (FDR-corrected P-value < 1 × 10⁻⁴ for the violet module and P-value = 0.009 for the dark magenta module, Supplementary Figure S3). The QQ plots also showed a deviation of genes from the expected values (Supplementary Figure S4). Moreover, almost all significant SNPs within the 20 kb gene boundaries of the violet module in APOE ε4 carriers were insignificant in non-carriers (Supplementary Table S24). The light cyan module in AD APOE ε4 non-carriers did not show a significant enrichment of signals.
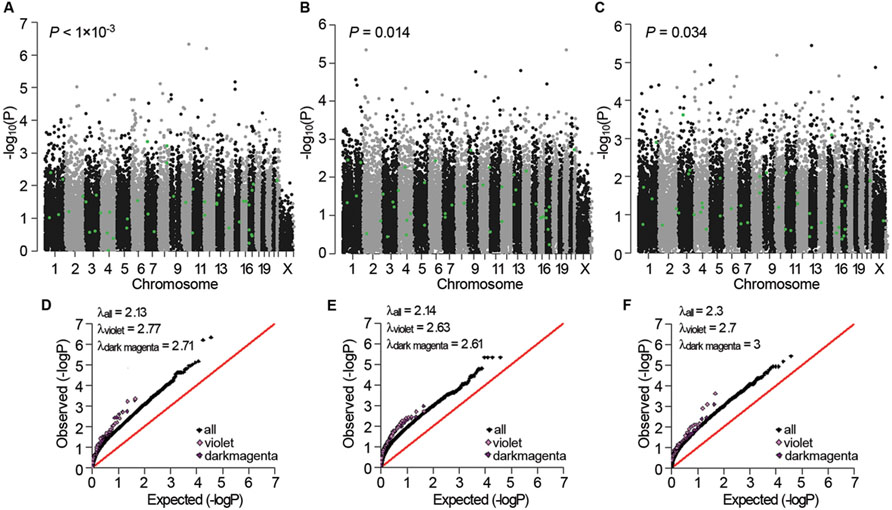
FIGURE 5. Genetic association signals for the violet and dark magenta modules of AD APOE ε4 carriers. (A–C) Manhattan plots of the enrichment analyses of the genetic association signals from the Myers GWAS (A), GenADA GWAS (B), and ADNI GWAS (C) datasets for the violet module of AD APOE ε4 carriers. The green dots represent genes within the violet module. (D–F) Comparative QQ plots of the genetic association signals from the Myers GWAS (D), GenADA GWAS (E) and ADNI GWAS (F) datasets for the violet and dark magenta module of AD APOE ε4 carriers. The black dots represent all genes, the violet dots represent genes within the violet module and the dark magenta dots represent genes within the dark magenta module. Values of the genomic dispersion factor λ are given in the top-left of each comparative QQ plot.
Analysis of Possible Transcription Modulation of Complete Graphs in Specific Modules
Complete graphs were detected and validated in the violet module of AD APOE ε4 carriers and in the light cyan module of AD APOE ε4 non-carriers, suggesting common transcription modulation. Thus, we first identified conserved promoter motif(s) by employing promoter homologous sequences of these genes from four species, Homo sapiens, Rattus norvegicus, Mus musculus, and Canis lupus familiaris. Two conserved promoter motifs with extremely low conservative P-values (P = 6.539 × 10-122 for the 49-base motif and P = 1.003 × 10-74 for the 14-base motif) were detected for the genes of the complete graph of the violet module of AD APOE ε4 carriers (Figures 6A,B), and an adenine-rich conserved promoter motif was identified with a P-value of 1.935 × 10-125 among the genes of the complete graph of the light cyan module of AD APOE ε4 non-carriers (Figure 6C).
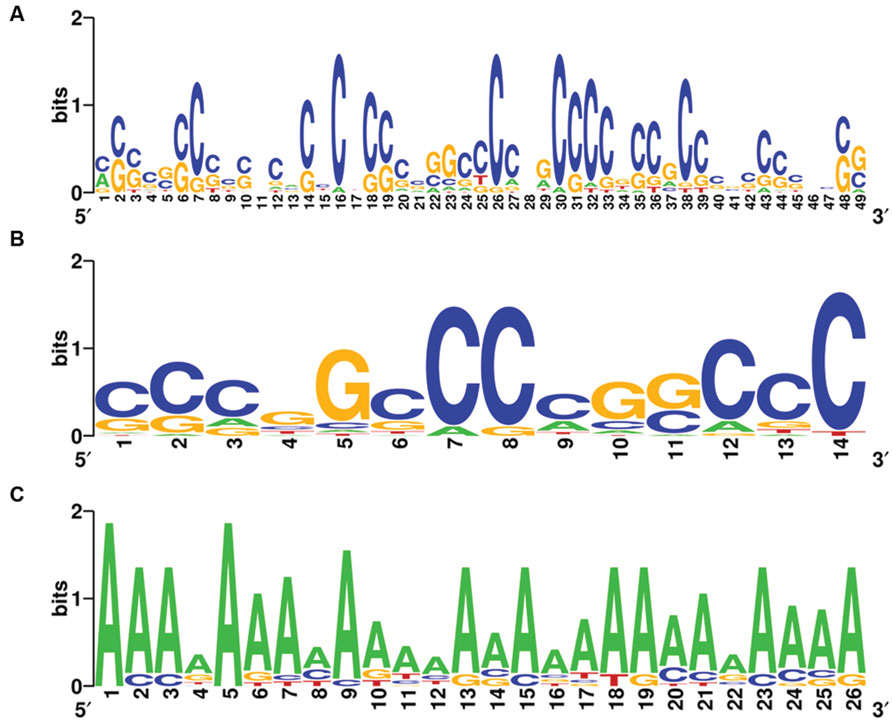
FIGURE 6. Conserved promoter motifs of genes within the complete graphs of the violet and light cyan modules. WebLogo representations of conserved promoter motifs in the violet module (A,B) of AD APOE ε4 carriers and in the light cyan module (C) of AD APOE ε4 non-carriers. The height of a letter at a particular position is proportional to the frequency of that nucleotide substitution in that position.
Then, common human TFs of two motifs in the violet module were identified (Table 1). Interestingly, two TFs, ZNF263 and ESR1, were shared by the two motifs, and SNPs within ESR1 have been widely reported to be associated with AD (Mattila et al., 2000; Corbo et al., 2006). RREB1, a TF of 49-base motif, which can potentiate the transcriptional activity of NeuroD1/β2 (Ray et al., 2003), has been reported to be related with AD and potentially with the NFκB1 gene (Pasluosta et al., 2011). Another neuro-associated TF of 49-base motif, named REST, which can repress neuronal genes in non-neuronal tissues (Yeo et al., 2005), has been demonstrated to both silence and repress neuronal genes (Greenway et al., 2007). SNPs proximal to TP63, a TF of 14-base motif, which is present in the aging human hippocampus (Yang and Wang, 1994), are reported to be associated with brain morphometric measures of AD (Shen et al., 2010). Another TF of 14-base motif, named EGR1, up-regulates the PSEN2 gene in neuronal cells (Renbaum et al., 2003). However, currently no highly scored human TFs could be predicted for the motif identified in the light cyan module of AD APOE ε4 non-carriers.
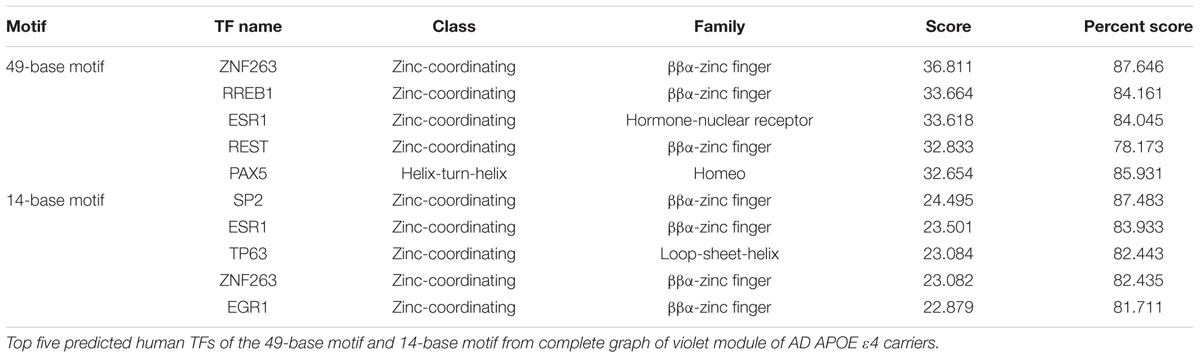
TABLE 1. Human TFs predicted for the two conserved promoter motifs in the violet module.
Furthermore, we investigated whether the mRNAs of these genes in the complete graph could be regulated by some common miRNAs. For the six genes in the violet module of AD APOE ε4 carriers, hsa-miR-194, hsa-miR-199a-5p, hsa-miR-199b-5p, hsa-miR-30a, hsa-miR-30d, and hsa-miR-30e were indicated to bind with at least four of the five hub genes except GNB3 (Supplementary Table S25). hsa-miR-194 has been reported to be down-regulated in white matter of AD patients and to be negatively associated with neurofibrillary tangles in gray matter and in neuritic plaques and neurofibrillary tangles in white matter of AD patients (Wang et al., 2011). miRNAs in the hsa-miR-199 family have been shown to target genes involved in neurodegenerative diseases (Roshan et al., 2009). Five members of the miR-30 family are up-regulated in AD patients (Leidinger et al., 2013). However, currently no highly scored common miRNAs were predicted for the genes in the complete graph of the light cyan module of AD APOE ε4 non-carriers.
Correlated Modules between AD and PD
Parkinson’s disease is also a neurodegenerative disorder with Lewy bodies deposited in neurons. Approximately 41.3% of PD patients are complicated with dementia according to a large population-based investigation (Mayeux et al., 1992). Pathologically, many PD patients show senile plaques and fibrillary tangles within the cerebral cortex (Boller et al., 1980), and many AD patients display Lewy bodies in cortical and subcortical regions (Hansen et al., 1990). BD is associated with an increased risk of dementia (Wu et al., 2013). Some symptoms and neuropathology of AD and BD overlap, such as brain atrophy, cognitive impairment, and emotional disturbances (Rao et al., 2012), however, no plaques and fibrillary tangles have been reported to be characteristic of BD. Thus, to further validate the identified modules, we applied the WGCNA analysis to these two neurological diseases to investigate whether the three identified co-expression modules were related to these diseases.
Transcriptomic data from three brain regions– Brodmann area 9 (BA9) of the prefrontal cortex, the putamen (PT) and the entire substantia nigra (SN) of PD patients were available for analysis. Among the detected PD-specific co-expression modules, only the purple module detected in BA9 of the prefrontal cortex which is the most PD-specific module (Supplementary Figure S5) was significantly correlated with the light cyan module of AD APOE ε4 non-carriers with an extremely low P-value (Figure 7A, P = 9.522 × 10⁻²⁴, Supplementary Table S26 for detailed overlapped genes). Two of the overlapping genes, DUSP5 and TBC1D8, were hub genes of the light cyan module, and DUSP5 was the top hub gene of the light cyan module (Supplementary Table S5). Furthermore, many annotations were the same between the two modules. The top diseases and functions and canonical pathways enriched in the light cyan module were also enriched in the purple module (Figures 7B,C). However, no BD-specific modules were found to be related to the three modules identified in AD (data not shown).
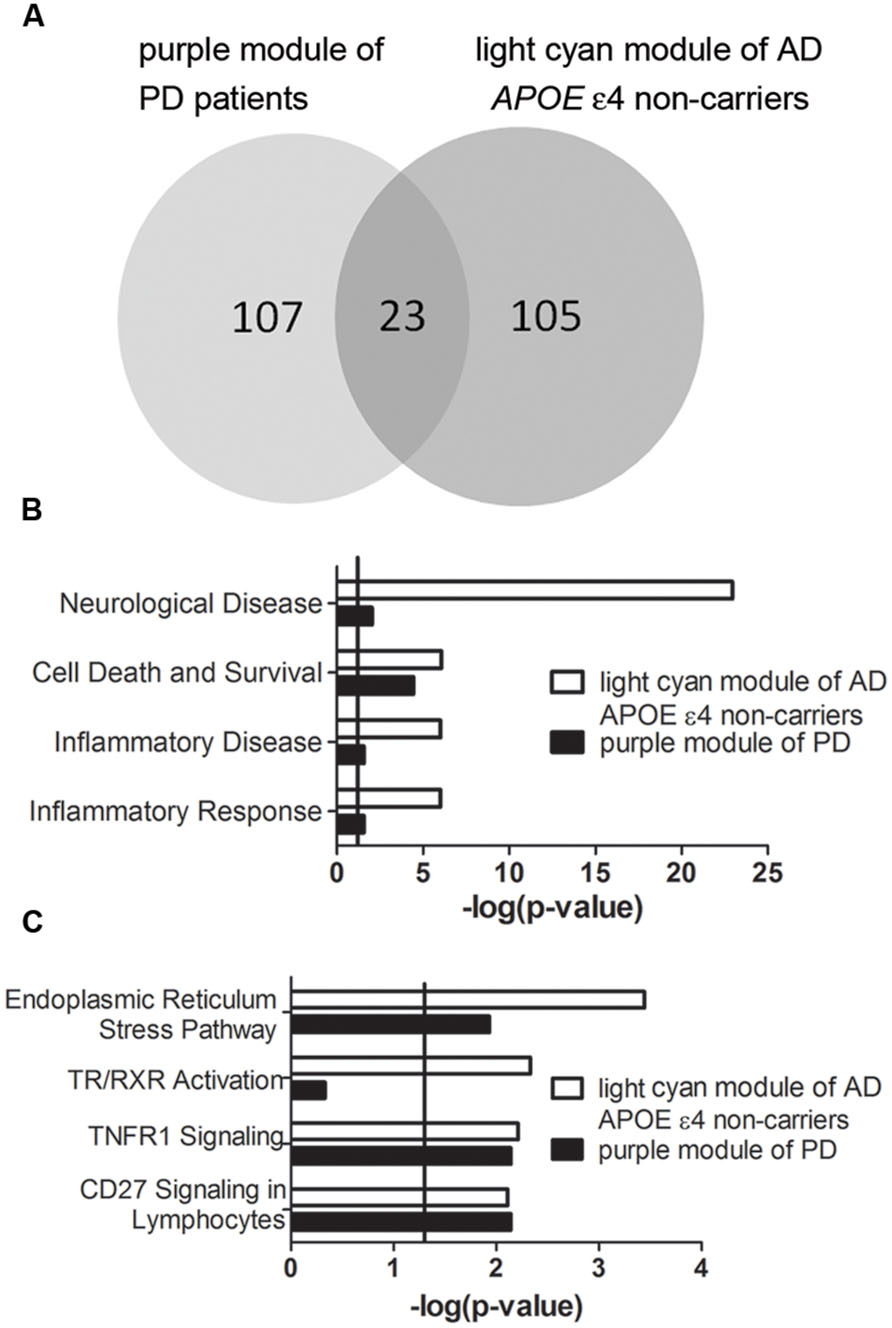
FIGURE 7. Correlation between purple module of PD patients and light cyan module of AD APOE ε4 non-carriers. (A) The overlapped gene numbers between these two modules shown in a venn diagram. (B,C) The top-shared diseases and functions (B) and canonical pathways (C) between the two modules. The verticals indicate the significant thresholds set by IPA.
Discussion
Unlike the analysis at the single-gene level, which can be influenced by co-expressed genes and thus give biased information, WGCNA, a systems biology approach which identifies co-expression gene modules, may better uncover the pathogenic and pathological mechanisms of complex diseases. In the present study, we identified two specific co-expression modules (violet and dark magenta) in AD APOE ε4 carriers and one specific module (light cyan) in AD APOE ε4 non-carriers. The most highly connected hub gene clusters (complete graph) were further identified in the violet and light cyan modules. Furthermore, the expression of these highly connected hub genes in the violet module was demonstrated to be correlated time-dependently under APOE ε4 treatment, whereas the expression of genes in the light cyan module was highly correlated time-dependently under APOE ε3 treatment. These experimental data verified the results of the WGCNA and further demonstrated the specificity and existence of the identified gene clusters.
The functional analysis of the identified modules in AD APOE ε4 carriers and non-carriers showed that the identified modules were enriched in distinct biological functions and signaling pathways, demonstrating that different biological processes could take part in disease progression with different APOE ε4 statuses, and thus they likely underlie distinctive clinical and pathological manifestations. Moreover, the expression patterns of conserved modules were the same in the AD APOE ε4 carriers and non-carriers. These results further highlight the significance of the three identified modules in the distinct characteristics between AD APOE ε4 carriers and non-carriers.
Our analysis demonstrated that the genes in both the violet and dark magenta modules of AD APOE ε4 carriers were strongly enriched in hereditary disorders, which was listed as the first among the diseases and functions of the IPA annotations. More importantly, a further analysis of enrichment with GWAS signals demonstrated that the expression patterns of these two modules had genetic bases in APOE ε4 carriers. Moreover, the significant SNPs of genes within both modules could not be replicated in APOE ε4 non-carriers. All these results demonstrated the genetic basis of APOE ε4 carriers for the development of AD.
The most highly connected hub gene cluster in the violet module was demonstrated to contain two phylogenetically conserved promoter motifs which could be targeted by some common TFs. Moreover, the mRNAs of these hub genes could be co-regulated by some common miRNAs. It is still unknown how the co-regulating feature in transcription is associated with the co-regulating feature in translation, however, the predicted conserved promoter motifs and common miRNAs suggest that some regulatory elements within these genes are phylogenetically conserved. This is consistent to the finding that the violet module has a genetic basis. Interestingly, three hub genes (ENO3, ISOC1 and GNB3) in this cluster were enriched in the first annotation (hereditary disorder) and/or the second annotation (neurological disease) of diseases and functions. Moreover, they were three highly ranked hub genes of the violet module and some SNPs around them were APOE ε4 carrier-specific (Supplementary Tables S3 and S24). One SNP, rs5443 within GNB3, has been reported to correlate with increased APP expression (Bullido et al., 2004). In addition, this SNP is located within one of the ten most interesting genetic linkage regions related to AD (Guerreiro et al., 2012). Thus, we propose that these three genes could play important roles in AD APOE ε4 carriers with a genetic basis and also in a co-regulated manner.
Genes within the violet module of AD APOE ε4 carriers were mainly enriched in energy metabolism-associated signaling pathways. Energy metabolism and the expression of energy metabolism-associated genes are reported to be decreased in AD patients (Liang et al., 2008). However, the decrease in energy metabolism is even worse in APOE ε4 carriers who manifest it before AD development (Reiman et al., 2005; Wolf et al., 2013). Acetyl-CoA is a key intermediate in energy metabolism and also a key precursor for acetylcholine synthesis. It is almost exclusively synthesized in mitochondria from the pyruvate dehydrogenase complex (PDHC) reaction in the brain. It has been found that the activities of PDHC and choline acetyl transferase for acetylcholine synthesis are strongly suppressed in the brain cortexes of AD APOE ε4 carriers (Gibson et al., 2000; Bubber et al., 2005). Moreover, decreased acetyl-CoA for acetylcholine synthesis is responsible for decreased transmitter functions in cholinergic neurons of AD patients (Szutowicz et al., 2013). Furthermore, in mice expressing human APOE ε4, evoked hippocampal acetylcholine release is reduced (Dolejsi et al., 2016). Thus, our findings explain the pathological differences between AD APOE ε4 carriers and non-carriers.
Genes within the dark magenta module of AD APOE ε4 carriers were mainly enriched in GPCRs and their second messengers-associated signaling pathways. Actually, many GPCRs have been validated to take part in the pathological process of AD, such as muscarinic acetylcholine receptors (M receptors) and metabotropic glutamate receptors (Albasanz et al., 2005; Wess et al., 2007). M2 and M4 receptors seem to inhibit the soluble amino-terminal ectodomain of APP (sAPPα) release and potentially aggravate Aβ generation (Farber et al., 1995). Deletion of M1 receptors is responsible for increased amyloid pathology (Davis et al., 2010). However, some specific phenomena are observed in APOE ε4 carriers. The density of M2 receptor is specifically higher in some cerebral regions of healthy APOE ε4 carriers compared to non-carriers (Cohen et al., 2003). Facilitating brain noradrenergic and vasopressinergic activities improves cognitive function only in AD APOE ε4 carriers (Richard et al., 1997). Defects in GPCRs, especially M receptors, have been widely reported in AD; however, the related signaling pathways were specifically enriched in AD APOE ε4 carriers. Thus, we hypothesize that alterations in GPCRs could play critical pathogenic and pathological roles in APOE ε4 carriers.
The genes in the light cyan module identified in AD APOE ε4 non-carriers were enriched not only in neurological diseases but also in some other types of diseases, such as immunological and cardiovascular diseases with high rankings. Furthermore, many genes were enriched in all of these diseases. However, these phenomena were not observed in AD APOE ε4 carriers. The involvement of the immune system in the pathogenesis of AD has long been demonstrated (Akiyama, 1994). Cardiovascular diseases have been reported to share some common risk factors and common signaling pathways with AD (Martins et al., 2006). Moreover, this module was enriched in various signaling pathways. tRNA charging is part of protein synthesis, TR/RXR regulates gene expression, and TNFR1 is a receptor for TNFα which is a potent proinflammatory cytokine. ER stress, retinoid signaling and TNFR1 are reported to be associated with AD (Corcoran et al., 2004; de la Monte et al., 2012; Laske et al., 2013). ER stress could enhance the production of Aβ (Liu et al., 2014). ER stress is also involved in tauopathy (Sakagami et al., 2013). Activation of retinoid acid receptors and RXR can up-regulate α-secretase ADAM10 (Tippmann et al., 2009). RXR can form heterodimers with peroxisome proliferator-activated receptor γ (PPARγ), and their combined activation cooperatively enhances the microglial uptake of Aβ (Yamanaka et al., 2012). TR and RXR can up-regulate the mRNA of an AD-associated gene (Ishida et al., 2013). TNFR1 is up-regulated in AD brains and is required in Aβ-induced neuronal apoptosis and cognitive impairment (Li et al., 2004; Cheng et al., 2010; Lourenco et al., 2013). However, these signaling pathways are not limited to AD. They are also involved in many pathological processes of various diseases such as cardiovascular diseases, immunological diseases, PD, and inflammation (Yoshida, 2007; Van Hauwermeiren et al., 2011; Nizamutdinova et al., 2013). Thus, these data indicate that the development of AD in APOE ε4 non-carriers may not stem from unique pathogenic processes, but rather, AD shares some common pathways or develops concomitantly with other types of diseases. However, our findings do not preclude the probable effects of APOE ε4 on these signaling pathways, such as pathways of the immune systems, which have been previously demonstrated (Keene et al., 2011).
To further validate our results, we selected PD and BD, two brain diseases with some common clinical or pathological relationships with AD. Pathologically PD and AD are very similar, as both types of patients exhibit senile plaques and fibrillary tangles. Cognitive deficits in PD are attributed to the prefrontal cortex (Fuster, 2000), and PT and SN are responsible for extrapyramidal signs (Rinne et al., 1989). Our results demonstrated that the purple module detected in BA9 of the prefrontal cortex of PD patients was highly correlated with the light cyan module of AD APOE ε4 non-carriers, and such a correlation was not observed in PT and SN, suggesting the relationship of cognitive deficits between AD and PD. Thus, our data not only provide the evidence of the validity of the light cyan module but also demonstrate a relationship between PD and AD, especially the close relationship between PD and AD of APOE ε4 non-carriers. However, our data are not consistent with a previous study, which failed to detect any overlapping genes between AD and PD (Talwar et al., 2014). Because we demonstrated the difference between AD APOE ε4 carriers and non-carriers and because no risk genes were found in PD to play such a significant role as APOE ε4 in AD, the disparity could be attributed to the fact that the authors of the previous study did not stratify the AD samples according to APOE status. Although BD also shares some common characteristics with AD, especially at a later stage during disease progression, few studies have reported overlapping genes between AD and BD. In our study, disease-specific modules displayed no correlations between BD and AD. Thus, we propose that the clinical and pathological overlap between AD and BD could be due to downstream cascades from pathogenic factors of each disease. However, our study does not preclude the possible harmful effects of APOE ε4 on PD and BD which have been reported even though APOE ε4 is unlikely a strong risk factor for PD and BD (Soeira-de-Souza et al., 2010; Monsell et al., 2014).
The three modules identified did not show any evidence of correlation with aging (data not shown), the commonly acknowledged risk factor for AD. Infants carrying APOE ε4 have different temporal cortex structures compared to APOE ε4 non-carriers (Knickmeyer et al., 2014), and a similar difference was also observed in adults (Hua et al., 2008). Multiple approaches utilizing mice and humans have demonstrated that APOE ε4 can affect normal brain function even very early in life (DiBattista et al., 2016). Thus, the identified modules may exert roles in an age-independent manner which may take effect or promote disease progression at an early age.
In summary, the present study demonstrated that AD APOE ε4 carriers involve more genetic factors and that particular biological processes may exert pathogenic effects, whereas AD APOE ε4 non-carriers share more common pathways with other types of diseases, and AD may develop accompanying these diseases. Although some of the identified hub genes, signaling pathways, TFs and miRNAs are known to be AD-associated, our data further demonstrated that they are likely specifically associated with AD APOE ε4 carriers or non-carriers. Moreover, our study may help to uncover the function of poorly characterized hub gene(s), as WGCNA may reveal the functions of genes if they are in a module highly enriched in a particular biological process (Chen et al., 2013). Our study provides new insights into the pathogenic and pathological mechanisms other than those of APOE4, underlying the different characteristics of AD APOE ε4 carriers and non-carriers, which may open a new avenue for the further investigation of AD and might promote the differential treatment of AD based on APOE ε4 status.
Author Contributions
SJ drafted the manuscript and contributed to the analytical approach and to the presentation and interpretation of the results. LT contributed to the experimental study and results analysis. NZ contributed to the experimental study. WY contributed to the analytical approach and discussion. YQ conceived of the study and contributed to the assembly and interpretation of the data, manuscript writing and the final approval of manuscript. H-ZC contributed to the critical review of manuscript, the supervision of the study and final approval of manuscript. All authors read and approved the final manuscript.
Funding
This work was supported by International Science and Technology Cooperation Program of China (2011DFA33180) and National Comprehensive Technology Platforms for Innovative Drug R&D of China (2012ZX09303-003).
Conflict of Interest Statement
The authors declare that the research was conducted in the absence of any commercial or financial relationships that could be construed as a potential conflict of interest.
Acknowledgments
We thank Miranda Myers and her colleagues in Miami University for their generous offering of transcriptomic and GWAS data. We thank GlaxoSmithKline, R&D Limited for its providing of GenADA GWAS dataset. We also thank ADNI and IGAP for GWAS dataset. For detailed Acknowledgments for ADNI and IGAP, please refer to Supplementary Acknowledgments.
Supplementary Material
The Supplementary Material for this article can be found online at: https://www.frontiersin.org/article/10.3389/fnagi.2016.00171
Footnotes
- ^http://www.ncbi.nlm.nih.gov/geo/query/acc.cgi?acc=GSE15222
- ^http://labs.genetics.ucla.edu/horvath/htdocs/CoexpressionNetwork/Rpackages/WGCNA/Tutorials/index.html
- ^http://www.cytoscape.org
- ^http://www.ingenuity.com
- ^http://labs.med.miami.edu/myers/LFuN/data%20ajhg.html
- ^http://www.ncbi.nlm.nih.gov/projects/gap/cgi-bin/study.cgi?study_id=phs000219.v1.p1
- ^http://adni.loni.usc.edu/
- ^http://pngu.mgh.harvard.edu/~purcell/plink/
- ^http://www.ncbi.nlm.nih.gov/geo/query/acc.cgi?acc=GSE20295
- ^http://www.ncbi.nlm.nih.gov/geo/query/acc.cgi?acc=GSE12654
References
Albasanz, J. L., Dalfo, E., Ferrer, I., and Martin, M. (2005). Impaired metabotropic glutamate receptor/phospholipase C signaling pathway in the cerebral cortex in Alzheimer’s disease and dementia with Lewy bodies correlates with stage of Alzheimer’s-disease-related changes. Neurobiol. Dis. 20, 685–693. doi: 10.1016/j.nbd.2005.05.001
Baranzini, S. E., Galwey, N. W., Wang, J., Khankhanian, P., Lindberg, R., Pelletier, D., et al. (2009). Pathway and network-based analysis of genome-wide association studies in multiple sclerosis. Hum. Mol. Genet. 18, 2078–2090. doi: 10.1093/hmg/ddp120
Boller, F., Mizutani, T., Roessmann, U., and Gambetti, P. (1980). Parkinson disease, dementia, and Alzheimer disease: clinicopathological correlations. Ann. Neurol. 7, 329–335. doi: 10.1002/ana.410070408
Bu, G. (2009). Apolipoprotein E and its receptors in Alzheimer’s disease: pathways, pathogenesis and therapy. Nat. Rev. Neurosci. 10, 333–344. doi: 10.1038/nrn2620
Bubber, P., Haroutunian, V., Fisch, G., Blass, J. P., and Gibson, G. E. (2005). Mitochondrial abnormalities in Alzheimer brain: mechanistic implications. Ann. Neurol. 57, 695–703. doi: 10.1002/ana.20474
Bullido, M. J., Ramos, M. C., Ruiz-Gomez, A., Tutor, A. S., Sastre, I., Frank, A., et al. (2004). Polymorphism in genes involved in adrenergic signaling associated with Alzheimer’s. Neurobiol. Aging 25, 853–859. doi: 10.1016/j.neurobiolaging.2003.10.006
Campion, D., Dumanchin, C., Hannequin, D., Dubois, B., Belliard, S., Puel, M., et al. (1999). Early-onset autosomal dominant Alzheimer disease: prevalence, genetic heterogeneity, and mutation spectrum. Am. J. Hum. Genet. 65, 664–670. doi: 10.1086/302553
Chen, C., Cheng, L., Grennan, K., Pibiri, F., Zhang, C., Badner, J. A., et al. (2013). Two gene co-expression modules differentiate psychotics and controls. Mol. Psychiatry 18, 1308–1314. doi: 10.1038/mp.2012.146
Cheng, X., Yang, L., He, P., Li, R., and Shen, Y. (2010). Differential activation of tumor necrosis factor receptors distinguishes between brains from Alzheimer’s disease and non-demented patients. J. Alzheimers Dis. 19, 621–630. doi: 10.3233/JAD-2010-1253
Cohen, R. M., Podruchny, T. A., Bokde, A. L., Carson, R. E., Herscovitch, P., Kiesewetter, D. O., et al. (2003). Higher in vivo muscarinic-2 receptor distribution volumes in aging subjects with an apolipoprotein E-epsilon4 allele. Synapse 49, 150–156. doi: 10.1002/syn.10225
Corbo, R. M., Gambina, G., Ruggeri, M., and Scacchi, R. (2006). Association of estrogen receptor alpha (ESR1) PvuII and XbaI polymorphisms with sporadic Alzheimer’s disease and their effect on apolipoprotein E concentrations. Dement. Geriatr. Cogn. Disord. 22, 67–72. doi: 10.1159/000093315
Corcoran, J. P., So, P. L., and Maden, M. (2004). Disruption of the retinoid signalling pathway causes a deposition of amyloid beta in the adult rat brain. Eur. J. Neurosci. 20, 896–902. doi: 10.1111/j.1460-9568.2004.03563.x
Corder, E. H., Saunders, A. M., Strittmatter, W. J., Schmechel, D. E., Gaskell, P. C., Small, G. W., et al. (1993). Gene dose of apolipoprotein E type 4 allele and the risk of Alzheimer’s disease in late onset families. Science 261, 921–923. doi: 10.1126/science.8346443
Crooks, G. E., Hon, G., Chandonia, J. M., and Brenner, S. E. (2004). WebLogo: a sequence logo generator. Genome Res. 14, 1188–1190. doi: 10.1101/gr.849004
Davis, A. A., Fritz, J. J., Wess, J., Lah, J. J., and Levey, A. I. (2010). Deletion of M1 muscarinic acetylcholine receptors increases amyloid pathology in vitro and in vivo. J. Neurosci. 30, 4190–4196. doi: 10.1523/JNEUROSCI.6393-09.2010
de Jong, S., Boks, M. P., Fuller, T. F., Strengman, E., Janson, E., De Kovel, C. G., et al. (2012). A gene co-expression network in whole blood of schizophrenia patients is independent of antipsychotic-use and enriched for brain-expressed genes. PLoS ONE 7:e39498. doi: 10.1371/journal.pone.0039498
de la Monte, S. M., Re, E., Longato, L., and Tong, M. (2012). Dysfunctional pro-ceramide, ER stress, and insulin/IGF signaling networks with progression of Alzheimer’s disease. J. Alzheimers Dis. 30(Suppl 2), S217–S29. doi: 10.3233/JAD-2012-111728
Dewey, F. E., Perez, M. V., Wheeler, M. T., Watt, C., Spin, J., Langfelder, P., et al. (2011). Gene coexpression network topology of cardiac development, hypertrophy, and failure. Circ. Cardiovasc. Genet. 4, 26–35. doi: 10.1161/CIRCGENETICS.110.941757
DiBattista, A. M., Heinsinger, N. M., and William Rebeck, G. (2016). Alzheimer’s disease genetic risk factor APOE-epsilon4 also affects normal brain function. Curr. Alzheimer Res. doi: 10.2174/1567205013666160401115127 [Epub ahead of print].
Dolejsi, E., Liraz, O., Rudajev, V., Zimcik, P., Dolezal, V., and Michaelson, D. M. (2016). Apolipoprotein E4 reduces evoked hippocampal acetylcholine release in adult mice. J. Neurochem. 136, 503–509. doi: 10.1111/jnc.13417
Dweep, H., Sticht, C., Pandey, P., and Gretz, N. (2011). miRWalk–database: prediction of possible miRNA binding sites by “walking” the genes of three genomes. J. Biomed. Inform. 44, 839–847. doi: 10.1016/j.jbi.2011.05.002
Farber, S. A., Nitsch, R. M., Schulz, J. G., and Wurtman, R. J. (1995). Regulated secretion of beta-amyloid precursor protein in rat brain. J. Neurosci. 15, 7442–7451.
Fuster, J. M. (2000). Prefrontal neurons in networks of executive memory. Brain Res. Bull. 52, 331–336. doi: 10.1016/S0361-9230(99)00258-0
Gibson, G. E., Haroutunian, V., Zhang, H., Park, L. C., Shi, Q., Lesser, M., et al. (2000). Mitochondrial damage in Alzheimer’s disease varies with apolipoprotein E genotype. Ann. Neurol. 48, 297–303. doi: 10.1002/1531-8249(200009)48:3%3C297::AID-ANA3%3E3.3.CO;2-Q
Greenway, D. J., Street, M., Jeffries, A., and Buckley, N. J. (2007). RE1 Silencing transcription factor maintains a repressive chromatin environment in embryonic hippocampal neural stem cells. Stem Cells 25, 354–363. doi: 10.1634/stemcells.2006-0207
Guerreiro, R. J., Gustafson, D. R., and Hardy, J. (2012). The genetic architecture of Alzheimer’s disease: beyond APP, PSENs and APOE. Neurobiol. Aging 33, 437–456. doi: 10.1016/j.neurobiolaging.2010.03.025
Hansen, L., Salmon, D., Galasko, D., Masliah, E., Katzman, R., Deteresa, R., et al. (1990). The Lewy body variant of Alzheimer’s disease: a clinical and pathologic entity. Neurology 40, 1–8. doi: 10.1212/WNL.40.1.1
Harold, D., Abraham, R., Hollingworth, P., Sims, R., Gerrish, A., Hamshere, M. L., et al. (2009). Genome-wide association study identifies variants at CLU and PICALM associated with Alzheimer’s disease. Nat. Genet. 41, 1088–1093. doi: 10.1038/ng.440
Horvath, S., and Dong, J. (2008). Geometric interpretation of gene coexpression network analysis. PLoS Comput. Biol. 4:e1000117. doi: 10.1371/journal.pcbi.1000117
Hua, X., Ching, C. R., Mezher, A., Gutman, B. A., Hibar, D. P., Bhatt, P., et al. (2016). MRI-based brain atrophy rates in ADNI phase 2: acceleration and enrichment considerations for clinical trials. Neurobiol. Aging 37, 26–37. doi: 10.1016/j.neurobiolaging.2015.09.018
Hua, X., Leow, A. D., Parikshak, N., Lee, S., Chiang, M. C., Toga, A. W., et al. (2008). Tensor-based morphometry as a neuroimaging biomarker for Alzheimer’s disease: an MRI study of 676 AD, MCI, and normal subjects. Neuroimage 43, 458–469. doi: 10.1016/j.neuroimage.2008.07.013
Ishida, E., Hashimoto, K., Okada, S., Satoh, T., Yamada, M., and Mori, M. (2013). Thyroid hormone receptor and liver X receptor competitively up-regulate human selective Alzheimer’s disease indicator-1 gene expression at the transcriptional levels. Biochem. Biophys. Res. Commun. 432, 513–518. doi: 10.1016/j.bbrc.2013.02.023
Jack, C. R. Jr., Wiste, H. J., Weigand, S. D., Knopman, D. S., Vemuri, P., Mielke, M. M., et al. (2015). Age, sex, and APOE epsilon4 effects on memory, brain structure, and beta-amyloid across the adult life span. JAMA Neurol. 72, 511–519. doi: 10.1001/jamaneurol.2014.4821
Jeong, H., Mason, S. P., Barabasi, A. L., and Oltvai, Z. N. (2001). Lethality and centrality in protein networks. Nature 411, 41–42. doi: 10.1038/35075138
Jia, P., Wang, L., Meltzer, H. Y., and Zhao, Z. (2010). Common variants conferring risk of schizophrenia: a pathway analysis of GWAS data. Schizophr. Res. 122, 38–42. doi: 10.1016/j.schres.2010.07.001
Kam, A. Y., Liao, D., Loh, H. H., and Law, P. Y. (2010). Morphine induces AMPA receptor internalization in primary hippocampal neurons via calcineurin-dependent dephosphorylation of GluR1 subunits. J. Neurosci. 30, 15304–15316. doi: 10.1523/JNEUROSCI.4255-10.2010
Kauwe, J. S., Bailey, M. H., Ridge, P. G., Perry, R., Wadsworth, M. E., Hoyt, K. L., et al. (2014). Genome-wide association study of CSF levels of 59 alzheimer’s disease candidate proteins: significant associations with proteins involved in amyloid processing and inflammation. PLoS Genet. 10:e1004758. doi: 10.1371/journal.pgen.1004758
Keene, C. D., Cudaback, E., Li, X., Montine, K. S., and Montine, T. J. (2011). Apolipoprotein E isoforms and regulation of the innate immune response in brain of patients with Alzheimer’s disease. Curr. Opin. Neurobiol. 21, 920–928. doi: 10.1016/j.conb.2011.08.002
Khatri, P., Sirota, M., and Butte, A. J. (2012). Ten years of pathway analysis: current approaches and outstanding challenges. PLoS Comput. Biol. 8:e1002375. doi: 10.1371/journal.pcbi.1002375
Knickmeyer, R. C., Wang, J., Zhu, H., Geng, X., Woolson, S., Hamer, R. M., et al. (2014). Common variants in psychiatric risk genes predict brain structure at birth. Cereb. Cortex 24, 1230–1246. doi: 10.1093/cercor/bhs401
Lambert, J. C., Ibrahim-Verbaas, C. A., Harold, D., Naj, A. C., Sims, R., Bellenguez, C., et al. (2013). Meta-analysis of 74,046 individuals identifies 11 new susceptibility loci for Alzheimer’s disease. Nat. Genet. 45, 1452–1458. doi: 10.1038/ng.2802
Langfelder, P., and Horvath, S. (2008). WGCNA: an R package for weighted correlation network analysis. BMC Bioinformatics 9:559. doi: 10.1186/1471-2105-9-559
Langfelder, P., Luo, R., Oldham, M. C., and Horvath, S. (2011). Is my network module preserved and reproducible? PLoS Comput. Biol. 7:e1001057. doi: 10.1371/journal.pcbi.1001057
Langfelder, P., Zhang, B., and Horvath, S. (2008). Defining clusters from a hierarchical cluster tree: the dynamic tree cut package for R. Bioinformatics 24, 719–720. doi: 10.1093/bioinformatics/btm563
Laske, C., Schmohl, M., Leyhe, T., Stransky, E., Maetzler, W., Berg, D., et al. (2013). Immune profiling in blood identifies sTNF-R1 performing comparably well as biomarker panels for classification of Alzheimer’s disease patients. J. Alzheimers Dis. 34, 367–375. doi: 10.3233/JAD-121558
Leidinger, P., Backes, C., Deutscher, S., Schmitt, K., Mueller, S. C., Frese, K., et al. (2013). A blood based 12-miRNA signature of Alzheimer disease patients. Genome Biol. 14:R78. doi: 10.1186/gb-2013-14-7-r78
Li, H., Wetten, S., Li, L., St Jean, P. L., Upmanyu, R., Surh, L., et al. (2008). Candidate single-nucleotide polymorphisms from a genomewide association study of Alzheimer disease. Arch. Neurol. 65, 45–53. doi: 10.1001/archneurol.2007.3
Li, R., Yang, L., Lindholm, K., Konishi, Y., Yue, X., Hampel, H., et al. (2004). Tumor necrosis factor death receptor signaling cascade is required for amyloid-beta protein-induced neuron death. J. Neurosci. 24, 1760–1771. doi: 10.1523/JNEUROSCI.4580-03.2004
Liang, W. S., Reiman, E. M., Valla, J., Dunckley, T., Beach, T. G., Grover, A., et al. (2008). Alzheimer’s disease is associated with reduced expression of energy metabolism genes in posterior cingulate neurons. Proc. Natl. Acad. Sci. U.S.A. 105, 4441–4446. doi: 10.1073/pnas.0709259105
Liu, B., Zhu, Y., Zhou, J., Wei, Y., Long, C., Chen, M., et al. (2014). Endoplasmic reticulum stress promotes amyloid-beta peptides production in RGC-5 cells. Cell Stress Chaperones 19, 827–835. doi: 10.1007/s12192-014-0506-7
Lourenco, M. V., Clarke, J. R., Frozza, R. L., Bomfim, T. R., Forny-Germano, L., Batista, A. F., et al. (2013). TNF-alpha mediates PKR-dependent memory impairment and brain IRS-1 inhibition induced by Alzheimer’s beta-amyloid oligomers in mice and monkeys. Cell Metab. 18, 831–843. doi: 10.1016/j.cmet.2013.11.002
Marra, C., Bizzarro, A., Daniele, A., De Luca, L., Ferraccioli, M., Valenza, A., et al. (2004). Apolipoprotein E epsilon4 allele differently affects the patterns of neuropsychological presentation in early- and late-onset Alzheimer’s disease patients. Dement. Geriatr. Cogn. Disord. 18, 125–131. doi: 10.1159/000079191
Martins, I. J., Hone, E., Foster, J. K., Sunram-Lea, S. I., Gnjec, A., Fuller, S. J., et al. (2006). Apolipoprotein E, cholesterol metabolism, diabetes, and the convergence of risk factors for Alzheimer’s disease and cardiovascular disease. Mol. Psychiatry 11, 721–736. doi: 10.1038/sj.mp.4001854
Mathelier, A., Zhao, X., Zhang, A. W., Parcy, F., Worsley-Hunt, R., Arenillas, D. J., et al. (2014). JASPAR 2014: an extensively expanded and updated open-access database of transcription factor binding profiles. Nucleic Acids Res. 42, D142–D147. doi: 10.1093/nar/gkt997
Mattila, K. M., Axelman, K., Rinne, J. O., Blomberg, M., Lehtimaki, T., Laippala, P., et al. (2000). Interaction between estrogen receptor 1 and the epsilon4 allele of apolipoprotein E increases the risk of familial Alzheimer’s disease in women. Neurosci. Lett. 282, 45–48. doi: 10.1016/S0304-3940(00)00849-1
Mattson, M. P. (2004). Pathways towards and away from Alzheimer’s disease. Nature 430, 631–639. doi: 10.1038/nature02621
Mayeux, R., Denaro, J., Hemenegildo, N., Marder, K., Tang, M. X., Cote, L. J., et al. (1992). A population-based investigation of Parkinson’s disease with and without dementia. Relationship to age and gender. Arch. Neurol. 49, 492–497.
Monsell, S. E., Besser, L. M., Heller, K. B., Checkoway, H., Litvan, I., and Kukull, W. A. (2014). Clinical and pathologic presentation in Parkinson’s disease by apolipoprotein e4 allele status. Parkinsonism Relat. Disord. 20, 503–507. doi: 10.1016/j.parkreldis.2014.02.001
Mueller, S. G., Weiner, M. W., Thal, L. J., Petersen, R. C., Jack, C. R., Jagust, W., et al. (2005). Ways toward an early diagnosis in Alzheimer’s disease: the Alzheimer’s Disease Neuroimaging Initiative (ADNI). Alzheimers Dement. 1, 55–66. doi: 10.1016/j.jalz.2005.06.003
Naj, A. C., Jun, G., Beecham, G. W., Wang, L. S., Vardarajan, B. N., Buros, J., et al. (2011). Common variants at MS4A4/MS4A6E, CD2AP, CD33 and EPHA1 are associated with late-onset Alzheimer’s disease. Nat. Genet. 43, 436–441. doi: 10.1038/ng.801
Nizamutdinova, I. T., Guleria, R. S., Singh, A. B., Kendall, J. A. Jr., Baker, K. M., and Pan, J. (2013). Retinoic acid protects cardiomyocytes from high glucose-induced apoptosis through inhibition of NF-kappaB signaling pathway. J. Cell. Physiol. 228, 380–392. doi: 10.1002/jcp.24142
Oldham, M. C., Konopka, G., Iwamoto, K., Langfelder, P., Kato, T., Horvath, S., et al. (2008). Functional organization of the transcriptome in human brain. Nat. Neurosci. 11, 1271–1282. doi: 10.1038/nn.2207
Pasluosta, C. F., Dua, P., and Lukiw, W. J. (2011). “Nearest hyperplane distance neighbor clustering algorithm applied to gene co-expression analysis in Alzheimer’s disease,” in Proceedings of the Annual International Conference of the IEEE: Engineering in Medicine and Biology Society, EMBC, 2011 (Piscataway, NJ: IEEE), 5559–5562.
Purcell, S., Neale, B., Todd-Brown, K., Thomas, L., Ferreira, M. A., Bender, D., et al. (2007). PLINK: a tool set for whole-genome association and population-based linkage analyses. Am. J. Hum. Genet. 81, 559–575. doi: 10.1086/519795
Rao, J. S., Keleshian, V. L., Klein, S., and Rapoport, S. I. (2012). Epigenetic modifications in frontal cortex from Alzheimer’s disease and bipolar disorder patients. Transl. Psychiatry 2:e132. doi: 10.1038/tp.2012.55
Ray, S. K., Nishitani, J., Petry, M. W., Fessing, M. Y., and Leiter, A. B. (2003). Novel transcriptional potentiation of BETA2/NeuroD on the secretin gene promoter by the DNA-binding protein Finb/RREB-1. Mol. Cell. Biol. 23, 259–271. doi: 10.1128/MCB.23.1.259-271.2003
Reiman, E. M., Chen, K., Alexander, G. E., Caselli, R. J., Bandy, D., Osborne, D., et al. (2005). Correlations between apolipoprotein E epsilon4 gene dose and brain-imaging measurements of regional hypometabolism. Proc. Natl. Acad. Sci. U.S.A. 102, 8299–8302. doi: 10.1073/pnas.0500579102
Renbaum, P., Beeri, R., Gabai, E., Amiel, M., Gal, M., Ehrengruber, M. U., et al. (2003). Egr-1 upregulates the Alzheimer’s disease presenilin-2 gene in neuronal cells. Gene 318, 113–124. doi: 10.1016/S0378-1119(03)00766-2
Richard, F., Helbecque, N., Neuman, E., Guez, D., Levy, R., and Amouyel, P. (1997). APOE genotyping and response to drug treatment in Alzheimer’s disease. Lancet 349:539. doi: 10.1016/S0140-6736(97)80089-X
Rinne, J. O., Rummukainen, J., Paljarvi, L., Sako, E., Molsa, P., and Rinne, U. K. (1989). Neuronal loss in the substantia nigra in patients with Alzheimer’s disease and Parkinson’s disease in relation to extrapyramidal symptoms and dementia. Prog. Clin. Biol. Res. 317, 325–332.
Roshan, R., Ghosh, T., Scaria, V., and Pillai, B. (2009). MicroRNAs: novel therapeutic targets in neurodegenerative diseases. Drug Discov. Today 14, 1123–1129. doi: 10.1016/j.drudis.2009.09.009
Sakagami, Y., Kudo, T., Tanimukai, H., Kanayama, D., Omi, T., Horiguchi, K., et al. (2013). Involvement of endoplasmic reticulum stress in tauopathy. Biochem. Biophys. Res. Commun. 430, 500–504. doi: 10.1016/j.bbrc.2012.12.007
Salloway, S., Sperling, R., Fox, N. C., Blennow, K., Klunk, W., Raskind, M., et al. (2014). Two phase 3 trials of bapineuzumab in mild-to-moderate Alzheimer’s disease. N. Engl. J. Med. 370, 322–333. doi: 10.1056/NEJMoa1304839
Scarmeas, N., Anderson, K. E., Hilton, J., Park, A., Habeck, C., Flynn, J., et al. (2004). APOE-dependent PET patterns of brain activation in Alzheimer disease. Neurology 63, 913–915. doi: 10.1212/01.WNL.0000137274.93125.46
Scheuner, D., Eckman, C., Jensen, M., Song, X., Citron, M., Suzuki, N., et al. (1996). Secreted amyloid beta-protein similar to that in the senile plaques of Alzheimer’s disease is increased in vivo by the presenilin 1 and 2 and APP mutations linked to familial Alzheimer’s disease. Nat. Med. 2, 864–870. doi: 10.1038/nm0896-864
Schwab, C., Yu, S., Wong, W., Mcgeer, E. G., and Mcgeer, P. L. (2013). GAD65, GAD67, and GABAT immunostaining in human brain and apparent GAD65 loss in Alzheimer’s disease. J. Alzheimers Dis. 33, 1073–1088. doi: 10.3233/JAD-2012-121330
Selkoe, D. J. (2003). Toward a remembrance of things past: deciphering Alzheimer disease. Harvey Lect. 99, 23–45.
Shen, L., Kim, S., Risacher, S. L., Nho, K., Swaminathan, S., West, J. D., et al. (2010). Whole genome association study of brain-wide imaging phenotypes for identifying quantitative trait loci in MCI and AD: a study of the ADNI cohort. Neuroimage 53, 1051–1063. doi: 10.1016/j.neuroimage.2010.01.042
Soeira-de-Souza, M. G., Bio, D. S., Dias, V. V., Martins Do Prado, C., Campos, R. N., Costa, L. F., et al. (2010). SHORT COMMUNICATION: apolipoprotein E genotype and cognition in bipolar disorder. CNS Neurosci. Ther. 16, 316–321. doi: 10.1111/j.1755-5949.2010.00153.x
Suwa, A., Nishida, K., Utsunomiya, K., Nonen, S., Yoshimura, M., Takekita, Y., et al. (2015). Neuropsychological evaluation and cerebral blood flow effects of apolipoprotein E4 in alzheimer’s disease patients after one year of treatment: an exploratory study. Dement. Geriatr. Cogn. Dis. Extra 5, 414–423. doi: 10.1159/000440714
Szutowicz, A., Bielarczyk, H., Jankowska-Kulawy, A., Pawelczyk, T., and Ronowska, A. (2013). Acetyl-CoA the key factor for survival or death of cholinergic neurons in course of neurodegenerative diseases. Neurochem. Res. 38, 1523–1542. doi: 10.1007/s11064-013-1060-x
Talwar, P., Silla, Y., Grover, S., Gupta, M., Agarwal, R., Kushwaha, S., et al. (2014). Genomic convergence and network analysis approach to identify candidate genes in Alzheimer’s disease. BMC Genomics 15:199. doi: 10.1186/1471-2164-15-199
Tapia-Arancibia, L., Aliaga, E., Silhol, M., and Arancibia, S. (2008). New insights into brain BDNF function in normal aging and Alzheimer disease. Brain Res. Rev. 59, 201–220. doi: 10.1016/j.brainresrev.2008.07.007
Tippmann, F., Hundt, J., Schneider, A., Endres, K., and Fahrenholz, F. (2009). Up-regulation of the alpha-secretase ADAM10 by retinoic acid receptors and acitretin. FASEB J. 23, 1643–1654. doi: 10.1096/fj.08-121392
van der Vlies, A. E., Pijnenburg, Y. A., Koene, T., Klein, M., Kok, A., Scheltens, P., et al. (2007). Cognitive impairment in Alzheimer’s disease is modified by APOE genotype. Dement. Geriatr. Cogn. Disord. 24, 98–103. doi: 10.1159/000104467
Van Hauwermeiren, F., Vandenbroucke, R. E., and Libert, C. (2011). Treatment of TNF mediated diseases by selective inhibition of soluble TNF or TNFR1. Cytokine Growth Factor Rev. 22, 311–319. doi: 10.1016/j.cytogfr.2011.09.004
Wang, T. (2007). Using PhyloCon to identify conserved regulatory motifs. Curr. Protoc. Bioinformatics Chapter 2, Unit 2.12.
Wang, T., and Stormo, G. D. (2003). Combining phylogenetic data with co-regulated genes to identify regulatory motifs. Bioinformatics 19, 2369–2380. doi: 10.1093/bioinformatics/btg329
Wang, W. X., Huang, Q., Hu, Y., Stromberg, A. J., and Nelson, P. T. (2011). Patterns of microRNA expression in normal and early Alzheimer’s disease human temporal cortex: white matter versus gray matter. Acta Neuropathol. 121, 193–205. doi: 10.1007/s00401-010-0756-0
Webster, J. A., Gibbs, J. R., Clarke, J., Ray, M., Zhang, W., Holmans, P., et al. (2009). Genetic control of human brain transcript expression in Alzheimer disease. Am. J. Hum. Genet. 84, 445–458. doi: 10.1016/j.ajhg.2009.03.011
Wess, J., Eglen, R. M., and Gautam, D. (2007). Muscarinic acetylcholine receptors: mutant mice provide new insights for drug development. Nat. Rev. Drug Discov. 6, 721–733. doi: 10.1038/nrd2379
Wijsman, E. M., Pankratz, N. D., Choi, Y., Rothstein, J. H., Faber, K. M., Cheng, R., et al. (2011). Genome-wide association of familial late-onset Alzheimer’s disease replicates BIN1 and CLU and nominates CUGBP2 in interaction with APOE. PLoS Genet. 7:e1001308. doi: 10.1371/journal.pgen.1001308
Wolf, A. B., Caselli, R. J., Reiman, E. M., and Valla, J. (2013). APOE and neuroenergetics: an emerging paradigm in Alzheimer’s disease. Neurobiol. Aging 34, 1007–1017. doi: 10.1016/j.neurobiolaging.2012.10.011
Wolk, D. A., Dickerson, B. C., and Alzheimer’s Disease Neuroimaging Initiative. (2010). Apolipoprotein E (APOE) genotype has dissociable effects on memory and attentional-executive network function in Alzheimer’s disease. Proc. Natl. Acad. Sci. U.S.A. 107, 10256–10261. doi: 10.1073/pnas.1001412107
Wu, K. Y., Chang, C. M., Liang, H. Y., Wu, C. S., Chia-Hsuan Wu, E., Chen, C. H., et al. (2013). Increased risk of developing dementia in patients with bipolar disorder: a nested matched case-control study. Bipolar Disord. 15, 787–794. doi: 10.1111/bdi.12116
Xie, X., Lu, J., Kulbokas, E. J., Golub, T. R., Mootha, V., Lindblad-Toh, K., et al. (2005). Systematic discovery of regulatory motifs in human promoters and 3′ UTRs by comparison of several mammals. Nature 434, 338–345.
Yamanaka, M., Ishikawa, T., Griep, A., Axt, D., Kummer, M. P., and Heneka, M. T. (2012). PPARgamma/RXRalpha-induced and CD36-mediated microglial amyloid-beta phagocytosis results in cognitive improvement in amyloid precursor protein/presenilin 1 mice. J. Neurosci. 32, 17321–17331. doi: 10.1523/JNEUROSCI.1569-12.2012
Yang, G., and Wang, E. (1994). Terminin (Tp 63/60), a novel cell senescence-related protein, is present in the aging human hippocampus. Brain Res. 644, 188–196. doi: 10.1016/0006-8993(94)91679-9
Yeo, M., Lee, S. K., Lee, B., Ruiz, E. C., Pfaff, S. L., and Gill, G. N. (2005). Small CTD phosphatases function in silencing neuronal gene expression. Science 307, 596–600. doi: 10.1126/science.1100801
Yoshida, H. (2007). ER stress and diseases. FEBS J. 274, 630–658. doi: 10.1111/j.1742-4658.2007.05639.x
Zhang, B., and Horvath, S. (2005). A general framework for weighted gene co-expression network analysis. Stat. Appl. Genet. Mol. Biol. 4:17. doi: 10.2202/1544-6115.1128
Keywords: Alzheimer’s disease, APOE ε4, APOE ε4 carriers and non-carriers, weighted gene co-expression network analysis (WGCNA), hub gene cluster
Citation: Jiang S, Tang L, Zhao N, Yang W, Qiu Y and Chen HZ (2016) A Systems View of the Differences between APOE ε4 Carriers and Non-carriers in Alzheimer’s Disease. Front. Aging Neurosci. 8:171. doi: 10.3389/fnagi.2016.00171
Received: 27 April 2016; Accepted: 27 June 2016;
Published: 12 July 2016.
Edited by:
Catarina Oliveira, University of Coimbra, PortugalReviewed by:
Michael Lardelli, University of Adelaide, AustraliaNeha Sehgal, Wisconsin Institutes for Discovery, USA
Copyright © 2016 Jiang, Tang, Zhao, Yang, Qiu and Chen. This is an open-access article distributed under the terms of the Creative Commons Attribution License (CC BY). The use, distribution or reproduction in other forums is permitted, provided the original author(s) or licensor are credited and that the original publication in this journal is cited, in accordance with accepted academic practice. No use, distribution or reproduction is permitted which does not comply with these terms.
*Correspondence: Yu Qiu, yu_qiu@hotmail.com Hong-Zhuan, Chen hongzhuan_chen@hotmail.com
†Present address: Shan Jiang, Department of Psychiatry, University of Illinois at Chicago, Chicago, IL, USA
‡These authors have contributed equally to this work.