Laboratório de Neuroanatomia Comparada, Instituto de Ciências Biomédicas, Universidade Federal do Rio de Janeiro, Rio de Janeiro-RJ, Brazil
While larger brains possess concertedly larger cerebral cortices and cerebella, the relative size of the cerebral cortex increases with brain size, but relative cerebellar size does not. In the absence of data on numbers of neurons in these structures, this discrepancy has been used to dispute the hypothesis that the cerebral cortex and cerebellum function and have evolved in concert and to support a trend towards neocorticalization in evolution. However, the rationale for interpreting changes in absolute and relative size of the cerebral cortex and cerebellum relies on the assumption that they reflect absolute and relative numbers of neurons in these structures across all species – an assumption that our recent studies have shown to be flawed. Here I show for the first time that the numbers of neurons in the cerebral cortex and cerebellum are directly correlated across 19 mammalian species of four different orders, including humans, and increase concertedly in a similar fashion both within and across the orders Eulipotyphla (Insectivora), Rodentia, Scandentia and Primata, such that on average a ratio of 3.6 neurons in the cerebellum to every neuron in the cerebral cortex is maintained across species. This coordinated scaling of cortical and cerebellar numbers of neurons provides direct evidence in favor of concerted function, scaling and evolution of these brain structures, and suggests that the common notion that equates cognitive advancement with neocortical expansion should be revisited to consider in its stead the coordinated scaling of neocortex and cerebellum as a functional ensemble.
When comparing different species, the number of neurons in a structure, that is, its number of information-processing units, is generally assumed to be a determinant of its computational power (Williams and Herrup, 1988
). For instance, a decrease in the number of neurons in salamander larvae caused by genetic manipulation causes a marked slowing in learning, although their locomotion is normal (Fankhauser et al., 1955
); in birds, seasonal oscillations in neuron number in the song nuclei of canaries correlates well with singing ability (Goldman and Nottebohm, 1983
); and in mammals, experimental doubling of the number of visual cortical neurons excited by one eye is associated with smaller receptive fields and improved discrimination abilities (Shook et al., 1984
), and experimental reduction of the size of somatosensory and motor cortices in mice greatly reduces their performance in somatomotor tests (Leingärtner et al., 2007
). Instances in which increased numbers of neurons may be maladaptive seem to be limited to pathological changes in specific populations that disturb neuronal excitability and lead to hyperactivity, such as in epilepsy (Maurin et al., 1985
; Shapiro et al., 2008
; Vaccarino et al., 2009
).
The number of neurons in the cerebral cortex is today considered a better correlate of cognitive abilities across species than absolute or relative size of the brain (Roth and Dicke, 2005
). The cerebral cortex is the structure that exhibits the most remarkable increase in relative size with increasing brain size, coming to be the predominant structure (in terms of size) in large brains (Clark et al., 2001
). For instance, the cerebral cortex (with the underlying white matter) represents 28% of total brain mass in the least shrew, 43% in the tree shrew, 66% in the marmoset, 76% in the macaque, 84% in humans, and 73% in the pilot whale (Hofman, 1988
; Clark et al., 2001
). Exclusion of the subcortical white matter from the analysis does not change the results (Wang et al., 2002
). While larger brains possess relatively larger cerebral cortices, the relative size of the cerebellum fails to increase with brain size (Clark et al., 2001
), as if these two structures did not evolve in concert. Since relatively larger structures are expected to hold increasingly larger percentages of brain neurons across species, the discrepancy in the scaling of relative cerebral cortical and cerebellar size in larger brains has been used as an argument against the hypothesis that the cerebellum acts as a computational engine serving the neocortex, or functionally related to it (Clark et al., 2001
), and thus favoring the traditional view that emphasizes the importance of relative neocortex expansion in brain function and evolution (Hofman, 1985a
; Clark et al., 2001
; Jerison, 2007
).
Strikingly, in contrast with the volumetric preponderance of the cerebral cortex in most mammals, the vast majority of brain neurons are located in the cerebellum across a range of mammals. For instance, the cerebellum holds 60% of all brain neurons in the mouse, small shrews, and marmoset; 70% in the rat, guinea pig and macaque; and 80% in the agouti, galago, and human (Andersen et al., 1992
; Herculano-Houzel et al., 2006
, 2007
; Azevedo et al., 2009
; Sarko et al., 2009
). Recent models of brain function consider that the cerebellar and cerebral cortices work in conjunction (Leiner et al., 1989
; Ramnani, 2006
; Ito, 2008
), instead of endorsing a functional preponderance of the cerebral cortex over other brain structures. In the absence of evidence on numbers of neurons in these structures, this view of a coordinated function of the cerebral cortex and cerebellum is supported by the correlated increase in absolute mass of the cerebral cortex and cerebellum across species of several mammalian orders (Stephan et al., 1981
; Whiting and Barton, 2003
) and, more recently, by the concerted increase in size of the prefrontal cerebral cortex, prefrontal inputs to the cortico-pontine system, and prefrontal-projecting cerebellar lobules in primates (Ramnani et al., 2006
; Balsters et al., 2010
). Surface area, usually considered as a proxy for numbers of neurons and hence as a measure of the information processing capacity of cortical structures (Hofman, 1985b
; Sultan, 2002
), also increases concertedly in both structures across species (Sultan, 2002
).
No consensus, however, has been reached in the literature so far regarding the (un)coordinated scaling of cerebral cortex and cerebellum. Remarkably, whether emphasis is placed on relative or absolute size of the cerebral cortex and cerebellum leads to opposing conclusions, which are based on interpretations of the same dataset that rely on untested assumptions: respectively, that relative size is a measure of relative number of neurons; and that the absolute surface area of these structures reflects in the same fashion their absolute numbers of neurons. Establishing whether the cerebral cortex and cerebellum scale coordinately, increasing their numbers of neurons at the same pace, requires solving this discrepancy by analyzing numbers of neurons in the cerebral cortex and cerebellum directly.
A novel method developed recently in our laboratory, the isotropic fractionator (Herculano-Houzel and Lent, 2005
), has made possible the determination of total numbers of neurons in the cerebral cortex and cerebellum of 19 species of the orders Eulipotyphla (insectivores), Rodentia, Scandentia, and Primata (including humans; see Materials and Methods). These numbers provide the first opportunity to test directly the hypothesis that, if the cerebral cortex and cerebellum are functionally related and are subject to concerted changes in evolution, then their numbers of neurons should be positively correlated within and perhaps even across mammalian orders. Such an investigation in rodent and primate brains is particularly interesting since we have shown that different cellular scaling rules apply to these mammalian orders: both the cerebral cortex and the cerebellum increase in mass as linear functions of their numbers of neurons in primates (Herculano-Houzel et al., 2007
), but as steep and different power functions of their numbers of neurons in rodents (Herculano-Houzel et al., 2006
), and as a combination of these in Eulipotyphla (Sarko et al., 2009
).
All data analyzed here have been published previously, and consist of mass of and numbers of neurons found in the whole cerebral cortex (including white matter) and whole cerebellum (including white matter and deep cerebellar nuclei) of a total of 19 species (Figure 1
): six rodent species (Herculano-Houzel et al., 2006
), six primate species and one scandentia (Herculano-Houzel et al., 2007
), five Eulipotyphla (insectivore) species (Sarko et al., 2009
), and humans (Azevedo et al., 2009
). All experiments were conducted in accordance with US and Brazilian guidelines regarding the use of animals and human subjects in research. All values refer to species averages, which guarantees that analyses regard relationships across species only, and are not confounded by intraspecific variability. Although ideally a quantitative comparison of cerebral and cerebellar cortices should not include subcortical nuclei of any kind, the deep cerebellar nuclei correspond typically to 2–3% and at most 4% of the total cerebellar volume in primates (Matano et al., 1985
). Therefore, even in the unlikely scenario that neuronal density in these nuclei were as elevated as in the cerebellar cortex, they would still amount to less than 4% of the cerebellar neurons. The number of neurons found in the whole cerebellum can thus be considered as a useful and quite accurate estimate of the number of neurons in the cerebellar cortex.
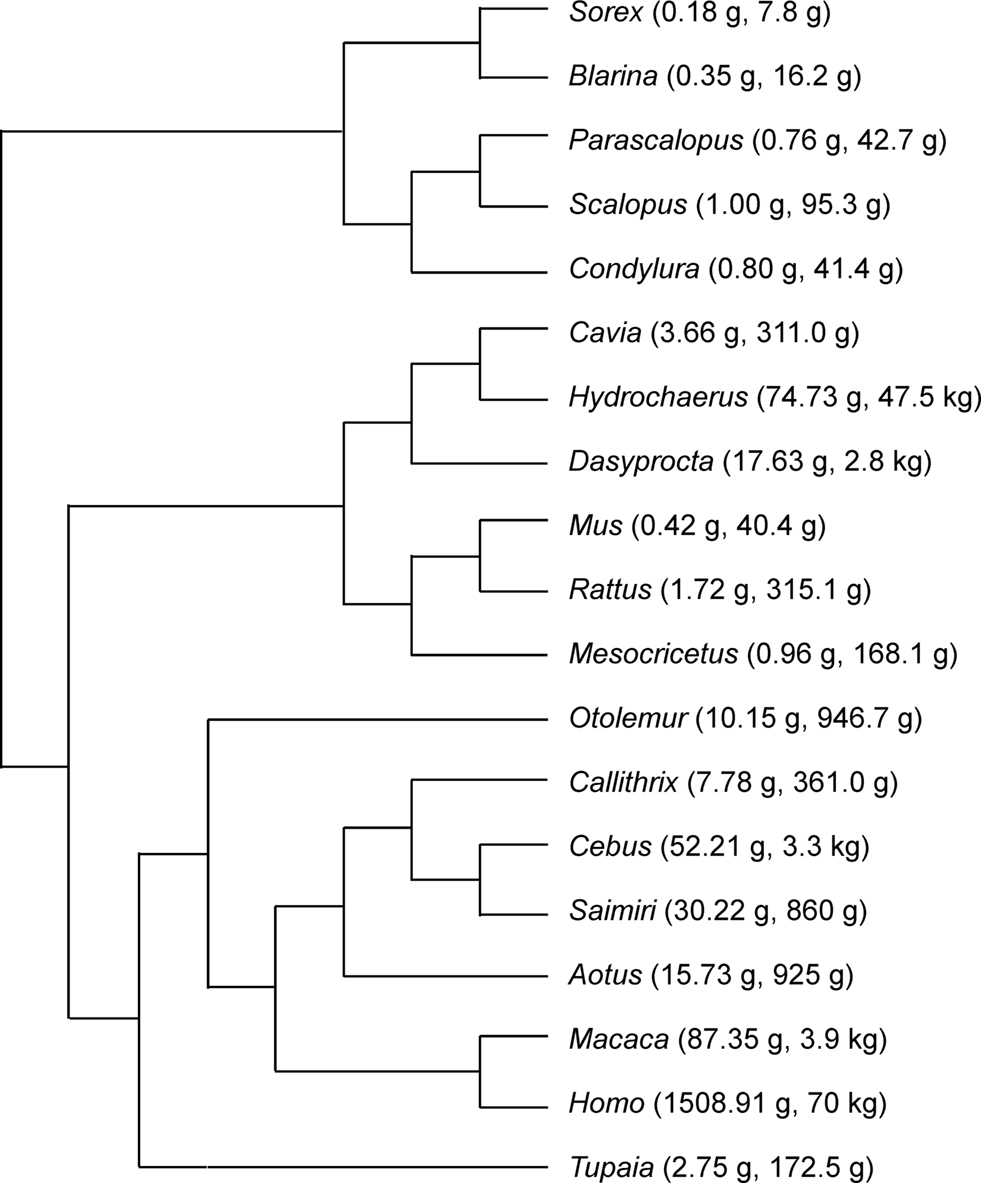
Figure 1. Phylogenesis of the 19 species analyzed. Numbers in parentheses refer to brain mass (excluding olfactory bulb), and body mass. Data from Herculano-Houzel et al. (2006
, 2007
), Sarko et al. (2009) and Azevedo et al. (2009)
.
Briefly, the method employed to determine numbers of neurons in the cerebral cortex and cerebellum of these species, the isotropic fractionator (Herculano-Houzel and Lent, 2005
), consists of mechanically dissociating the fixed and dissected structures in a saline detergent solution, such that cell membranes are disrupted, but nuclear membranes remain intact. This allows the free cell nuclei to be collected in a suspension of known volume that is made isotropic by agitation. Samples of the suspension are counted in a hemocytometer to determine the number of nuclei per unit volume of the suspension, and in the total suspension volume. This is referred to as the total number of cells in the structure.
The total number of neurons is then determined by applying to the total number of cells the percentage of nuclei that express NeuN, a neuronal-specific antigen that is found in all cortical and cerebellar neurons, to the exception of Purkinje cells (Mullen et al., 1992
). These, however, represent such a small minority of all cerebellar neurons (between 1 in 700 and 1 in 3000 granule cell neurons for the species analyzed here; Lange, 1975
) that the number of neurons estimated in the cerebellum is not significantly affected by their exclusion from the pool of NeuN-labeled, neuronal nuclei. In the cerebral cortex, NeuN labeling has been shown to give similar quantitative results as morphological analysis of cresyl violet-stained cells, being particularly useful in distinguishing small neurons from glia (Gittins and Harrison, 2004
). Additionally, because labeled nuclei are identified by visual inspection under the microscope and not by automated methods, we could confirm that all NeuN-labeled nuclei in each sample were indeed of neuronal morphology and that all nuclei of a particular labeled morphology were labeled in the sample.
The relative structure mass and numbers of neurons reported here refer to the percentage of average mass or numbers of neurons for each species relative to average whole brain mass and numbers of neurons in that species, also reported previously. Intraspecific variability in numbers of neurons in the cerebral cortex and cerebellum is typically below 10% in rodents (Herculano-Houzel et al., 2006
), insectivores (Sarko et al., 2009
), and primates (Herculano-Houzel et al., 2007
, 2008
), including humans (Azevedo et al., 2009
). Non-parametrical Spearman correlation coefficients and least-squares regressions to linear and power functions were calculated with Statview (SAS, USA). To test for common slopes, an ANCOVA was performed on the dataset using PASW18 (IBM, USA).
Phylogenetic independent contrasts were also calculated to examine the scaling of cerebellar mass and number of neurons as a function of cerebral cortical mass and number of neurons across the 19 species while controlling for effects of phylogenetic relatedness in the dataset (Felsenstein, 1985
). Standardized independent contrasts were calculated using the PDAP:PDTREE module of Mesquite software version 2.7 (Maddison and Maddison, 2005
). Since the relationships approach linearity, contrasts were calculated both from log-transformed and original values. Phylogenies, shown in Figure 1
, are based on Purvis (1995)
, Murphy et al. (2001)
, Brant and Ortí (2002) and Shinohara et al. (2003)
. Branch lengths were transformed according to the method of Pagel (1992)
, which assigns all branch lengths to 1 with the constraint that tips are contemporaneous. The reported values for the linear regressions of independent contrasts on log-transformed or original data are reduced major axis (RMA) slope, r2 and p-value, which are similar to the results obtained with least-square regression of independent contrasts for this dataset.
A combined analysis of the insectivore, rodent and primate species in our published datasets shows that the cerebellum and cerebral cortex increase in mass together (Figure 2
A), while relative cortical mass increases but relative cerebellar mass fails to change significantly within each order or even decreases in the combined dataset with increasing total brain mass (Figure 2
B). Our dataset thus repeats the discrepancy observed previously (Stephan et al., 1981
; Clark et al., 2001
; Sultan, 2002
).
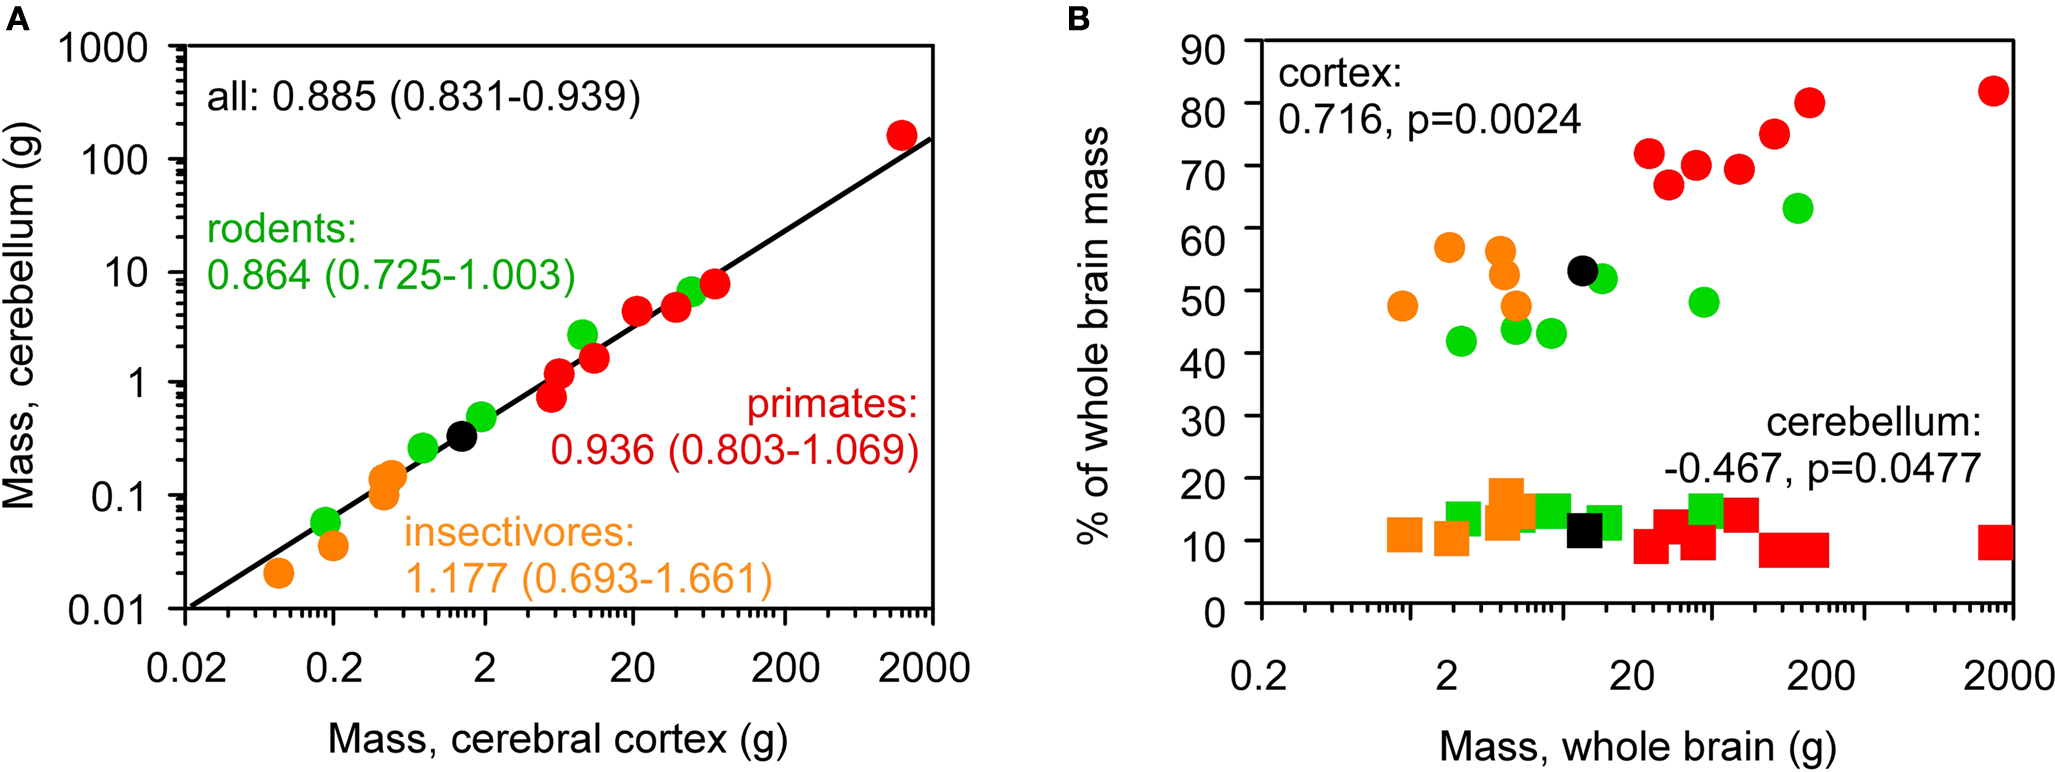
Figure 2. Discrepancy between the scaling of absolute and relative cortical and cerebellar mass. Each point represents the average values for one species (insectivores, orange; rodents, green; primates, red; scandentia, black), (A) cerebellar mass covaries with cerebral cortical mass in a similar fashion across Eulipotyphla (insectivore), rodent, scandentia and primate species. Power function exponents and 95% confidence intervals are indicated; all values of p < 0.01. The plotted power function applies to all species. The relationship for the ensemble of data is equally well fit with a linear function of slope 0.125 (p < 0.0001, r2 = 1.000; not shown), (B) relative mass of the cerebral cortex (circles), shown as % of total brain mass, increases with total brain mass across all species, but relative cerebellar mass (squares) decreases slightly. Spearman correlation coefficients and p-values are shown. All data are from Herculano-Houzel et al. (2006
, 2007
), Azevedo et al. (2009) and Sarko et al. (2009)
.
The relative mass of the cerebral cortex and cerebellum does not, however, reflect the relative numbers of neurons in these structures, calculated as percentages of the total number of neurons in insectivore, rodent, primate (including human) and scandentia brains, since relative mass and relative number of neurons within each structure are not correlated across species (Figure 3
; all p-values above 0.05). The increase in relative cortical size in larger brains in the absence of a correlated change in relative cerebellar size therefore cannot be used as a proxy for a similar lack of correlation between relative numbers of neurons in these structures.
How do actual numbers of neurons scale across the cerebral cortex and cerebellum, then? We have shown previously that different cellular scaling rules apply to rodent and primate brain structures: both the cerebral cortex and the cerebellum increase in mass as linear functions of their numbers of neurons in primates and one scandentia (Herculano-Houzel et al., 2007
), but gain mass as steep and different power functions of their numbers of neurons in rodents (Herculano-Houzel et al., 2006
; Figure 4
A). In Eulipotyphla, the mass of the cerebellum varies linearly with the number of neurons in the structure, while the mass of the cerebral cortex increases faster than the structure gains neurons (Sarko et al., 2009
). Strikingly, despite the different neuronal scaling rules across orders and structures, the number of neurons in the cerebellum covaries with the number of neurons in the cerebral cortex across species of the four orders, and does so in a similar fashion in Eulipotyphla, Rodentia, Primata, and Scandentia (Figure 4
B).
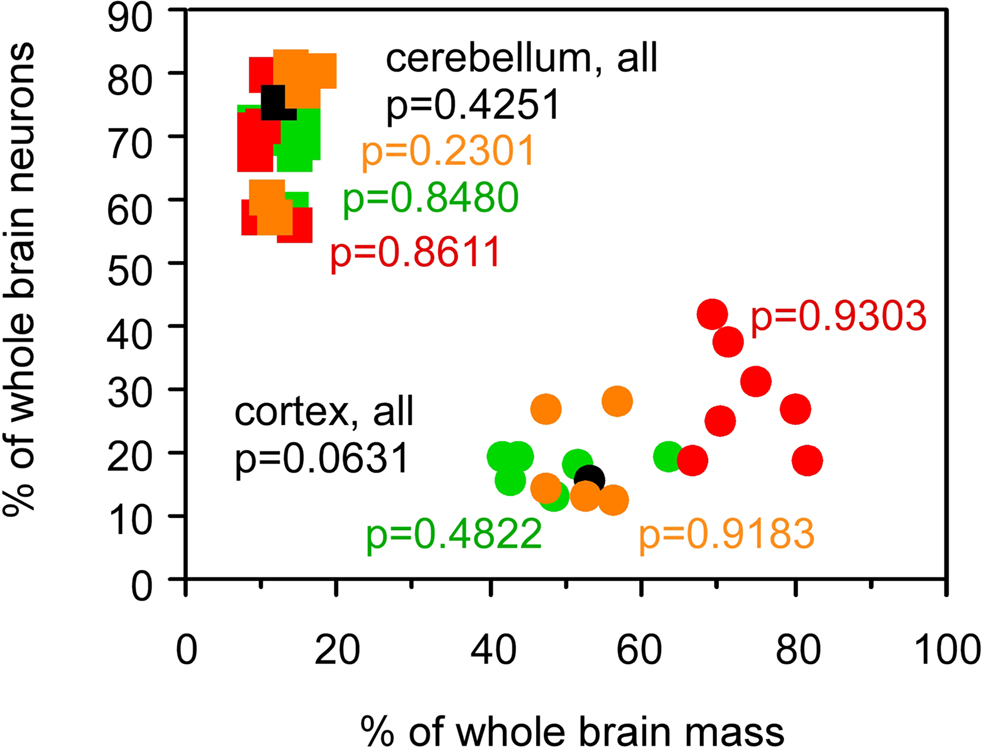
Figure 3. Relative cortical and cerebellar mass does not reflect the relative number of brain neurons that each contains. Each point represents the average values for one species (insectivores, orange; rodents, green; primates, red; scandentia, black). Circles, relative mass and relative number of brain neurons in the cerebral cortex; squares, relative values for cerebellum. Spearman correlation coefficients and p-values are indicated. All data are from Herculano-Houzel et al. (2006
, 2007
), Azevedo et al. (2009) and Sarko et al. (2009)
.
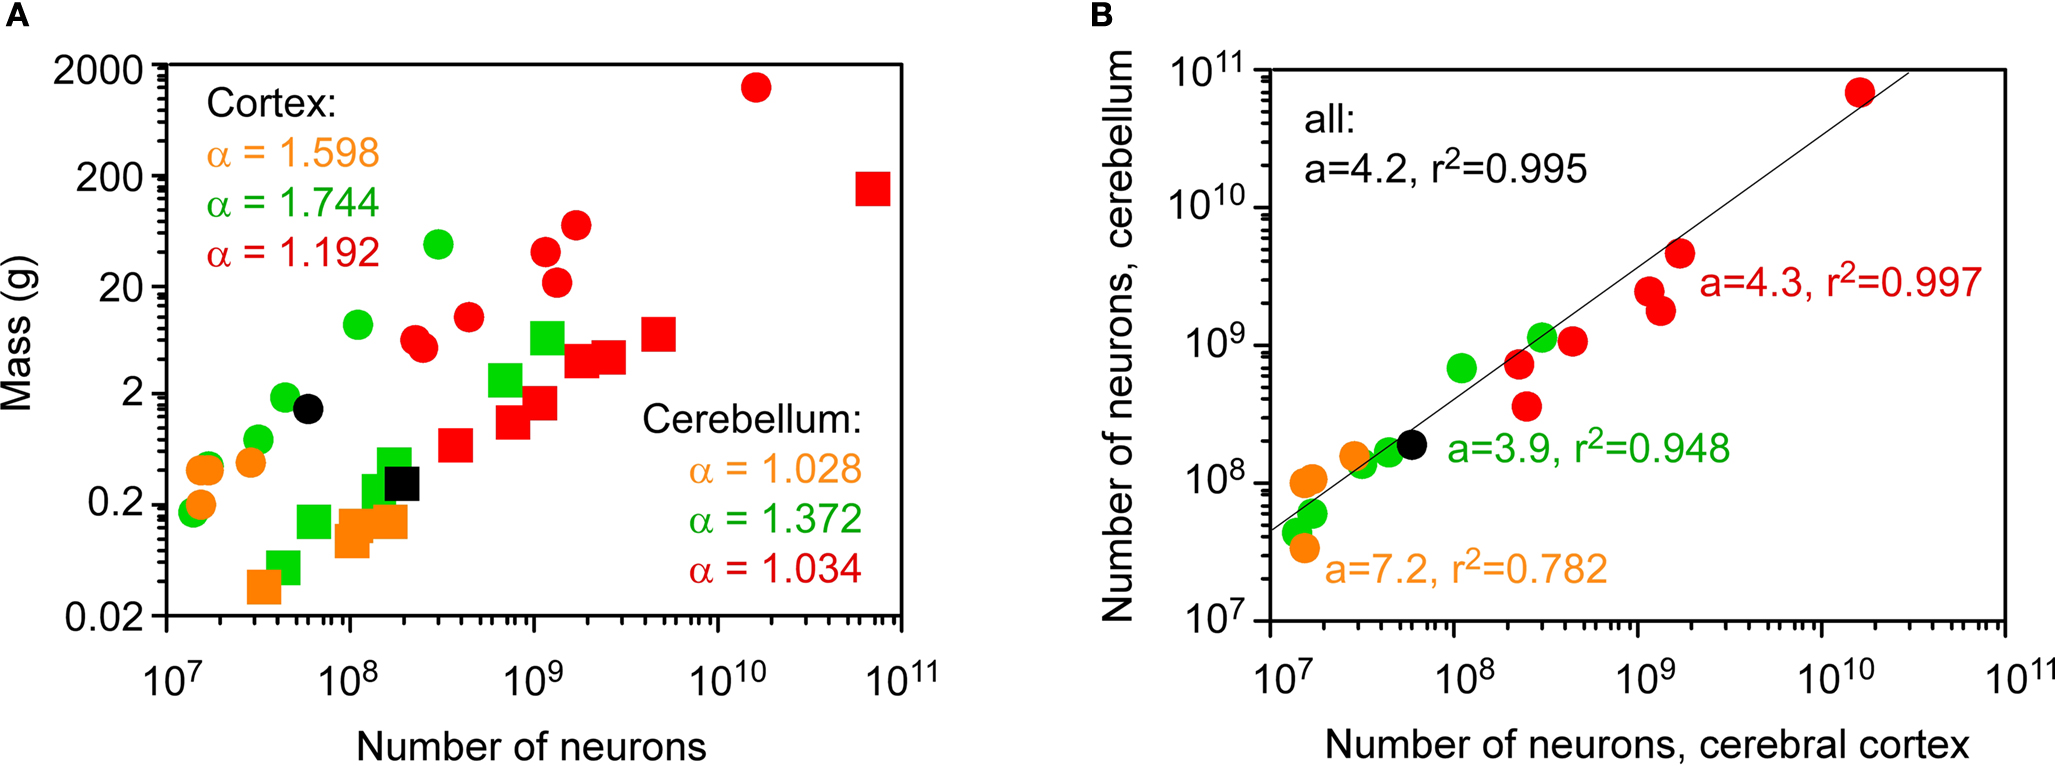
Figure 4. Coordinated scaling of the number of neurons in the cerebral cortex and cerebellum of mammals. Each point represents the average values for one species. Eulipotyphla (insectivores), orange; rodents, green; primates, red; scandentia, black. (A) neuronal scaling rules relating structure mass and number of neurons (cerebral cortex, circles; cerebellum, squares). Power law exponents are indicated in the appropriate colors for Eulipotyphla, rodents, and combined scandentia and primates (all values of p < 0.01). (B) the number of neurons in the cerebellum covaries with the number of neurons in the cerebral cortex across all species in a way that can be described as a linear function of slope 4.2 (p < 0.0001, r2 = 0.995). Slopes and r2 values for insectivores, rodents, and combined scandentia and primates are indicated in different colors (all p < 0.01, except insectivores, for which p = 0.0463). All data are from Herculano-Houzel et al. (2006
, 2007
), Azevedo et al. (2009) and Sarko et al. (2009)
.
The coordinated scaling of numbers of cortical and cerebellar neurons across all Eulipotyphla, rodents, primates and one scandentia species analyzed can be described as a single linear function of slope 4.2 (ANCOVA test for the interaction between order and number of neurons in the cortex, F = 0.008, p = 0.992; Figure 4
B, Table 1
). Similar slopes of 4.3 and 3.9 are obtained for the ensemble of scandentia and primates, and for rodents. A larger slope of 7.2 is obtained for Eulipotyphla, although with a very large 95% confidence interval (0.2–14.2). Analysis of independent contrasts of the raw values yields similar slopes (Table 1
), showing that the scaling of numbers of neurons in the cerebellum and cerebral cortex is not affected by phylogenetic relationships. The finding that data from all 19 species from four mammalian orders can be described by a single linear function, and that the slopes for individual orders are comparable, suggests that, roughly, for every neuron added to the cerebral cortex in evolution, four neurons are added to the cerebellum. Indeed, across the 19 species analyzed here, the average ratio between the numbers of neurons in the cerebellum and in the cerebral cortex is 3.6 ± 1.6, and does not covary with brain size (Spearman correlation −0.082, p = 0.7265; Figure 5
).
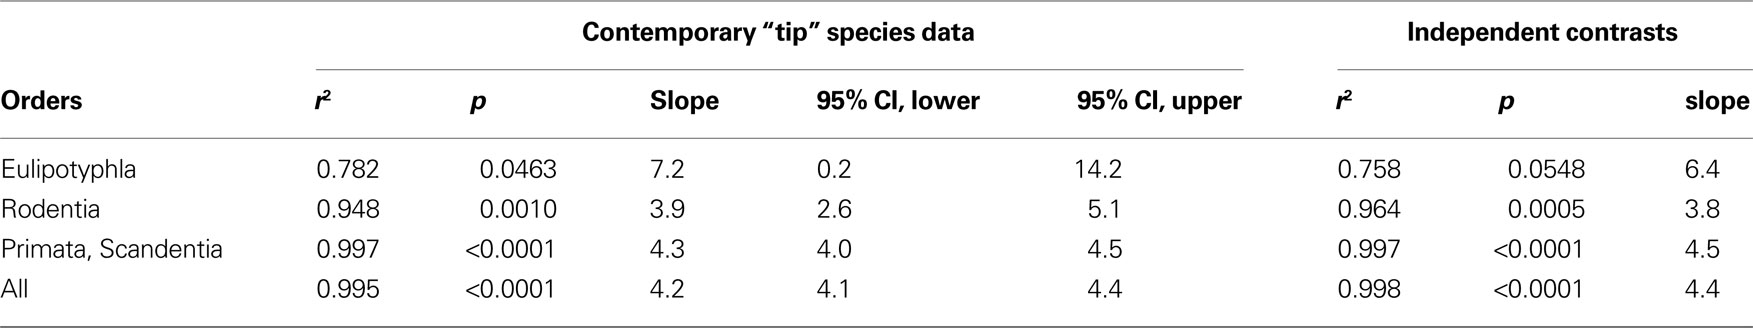
Table 1. Regression coefficients for the linear scaling of numbers of neurons in the cerebellum as a function of numbers of neurons in the cerebral cortex across species within each order, and across the combined 19 species.
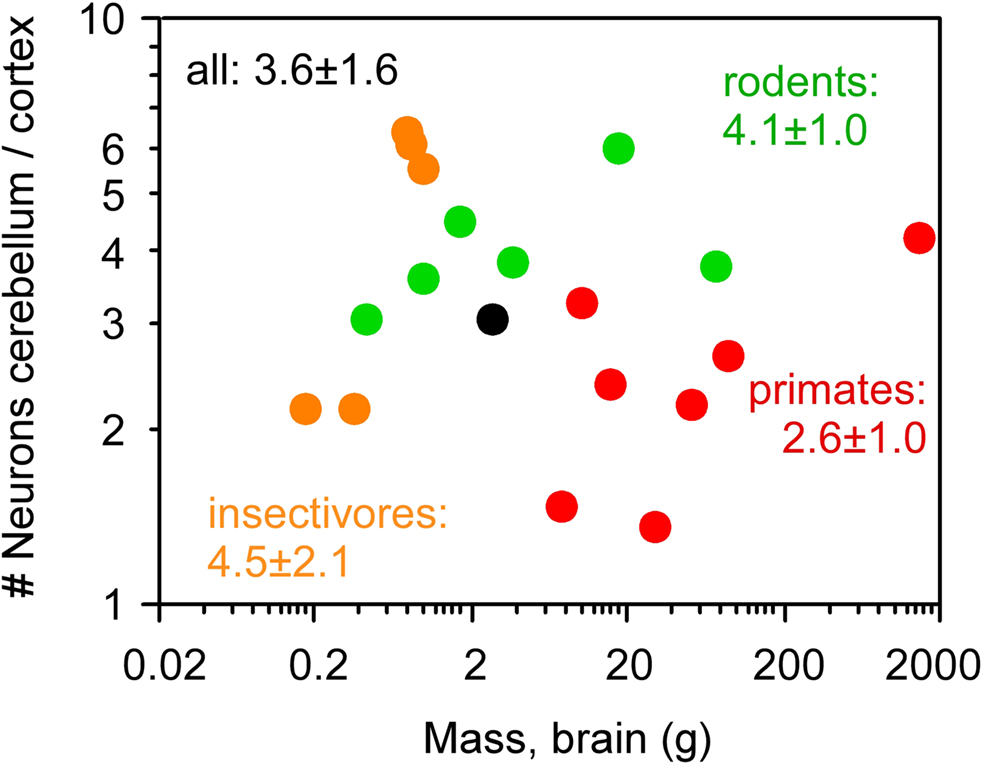
Figure 5. Average ratio between numbers of neurons in the cerebellum and in the cerebral cortex does not correlate with brain mass across species. Each point represents the average values for one species. Eulipotyphla (insectivores), orange; rodents, green; primates, red; scandentia, black. The average ratio ± standard deviation between number of neurons in the cerebellum and in the cerebral cortex within each order and among all 20 species are indicated in the corresponding colors. No correlation between cortex/cerebellar neuronal ratio and brain mass reaches significance (Spearman correlation, all p > 0.1). All data are from Herculano-Houzel et al. (2006
, 2007
), Azevedo et al. (2009) and Sarko et al. (2009)
.
Despite the abundant connectivity between the cerebral and cerebellar cortices, the increase in relative size of the cerebral cortex in the face of a constant relative size of the cerebellum across species has been used as an argument against the functional coordination of these structures and their joint evolution (Clark et al., 2001
). The rationale for considering relative size as a proxy for functionality or even “functional evolution” of a brain structure, however, is questionable. First, even though the function of any given structure may depend on how much information it receives from others, its capabilities should ultimately reflect its own number of processing units, or neurons and their synapses, regardless of how large the remaining structures are – and, hence, regardless of the relative size of the structure at issue. Furthermore, the use of relative structure size as a proxy for function across species is based on the assumption that the relative size of a structure reflects the relative number of brain neurons it contains – and this assumption, which could now be tested directly, does not hold.
Rather, the direct comparison of the numbers of neurons in the cerebral and cerebellar cortices across species presented here indicates that these are not only correlated, but vary together in the same way across mammalian orders with a relatively stable numerical preponderance of 3–4 neurons in the cerebellum to every neuron in the cerebral cortex, even though these structures change in size following different cellular scaling rules across rodents, primates, and Eulipotyphla (insectivores). These results are consistent with the findings that, in primates, the cerebellum, neocortex, vestibular nuclei and relays between them exhibit concerted volumetric evolution, even after removing the effects of change in other structures (Whiting and Barton, 2003
), and increased size of the prefrontal cerebral cortex is accompanied by an increased prefrontal cortico-pontine system and prefrontal-projecting cerebellar lobules (Ramnani et al., 2006
; Balsters et al., 2010
). If extensive to all mammals, such a universal numerical relationship as observed here would account for why, across mammalian species, the number of neurons seems to be always larger in the cerebellum than in the cerebral cortex, even when cortical mass is relatively large, such as in humans (Azevedo et al., 2009
).
The numbers of neurons analyzed here encompass all neurons (interneurons and pyramidal projection neurons) in the cerebral cortex, and, in the cerebellum, consist of granule cells and interneurons. As observed in the Methods, Purkinje cells are not labeled with NeuN, and are therefore not included in the count; however, since they are a very small proportion of all cerebellar neurons (Lange, 1975
), their absence is unlikely to affect significantly the final neuron count of cerebellar neurons. In this way, the coordinate scaling of the cerebellum and cerebral cortex does not refer to the projection neurons that interconnect these structures, but rather to the ensemble of neurons that process information in them, and therefore determine how they function and generate the information that will be, as a result, communicated to other structures.
Remarkably, our quantitative analysis shows that the cerebral cortex can become enlarged, coming to represent over 80% of total brain mass, without the correlated increase in the percentage of neurons that it contains relative to the whole brain that would be required to give support to the presumed trend towards neocorticalization in evolution. Rather, for a variation in brain size of five orders of magnitude, the present analysis indicates that the ratio between numbers of cerebral cortical and cerebellar neurons varies relatively little, averaging 3.6 across all 19 species analyzed, and does not correlate with brain size. This is a strong argument against neocorticalization (in what concerns numbers of neurons) and, rather, in favor of the coordinated increase in numbers of neurons across the cortex and cerebellum, as brain size increases. The finding that such coordinated increase occurs with similar rates across insectivore, rodent, and primate species, including humans, suggests that it reflects a general principle in mammalian brain evolution, rather than a particularity of primates.
The coordinated scaling of the number of neurons in the cerebral cortex and cerebellum stresses the importance of analyzing numbers of neurons directly instead of using absolute or relative mass as proxies in comparative studies, specially across animal orders, whose brain structures may scale differently in size as a function of their numbers of neurons. The coordinated scaling of numbers of neurons across the cortex and cerebellum also argues strongly in favor of the integrated function of these two structures, the conservation of their functional relationship across mammalian orders, and their coordinated subjection to selective pressures in evolution. In light of the present findings, the traditional focus on the enlarged neocortex as the main event in brain evolution seems excessive and should be reevaluated across all mammals, as proposed by Whiting and Barton (2003)
based on primate data, with more attention now dedicated to the concerted evolution of cortico-cerebellar circuits and of the behavioral and cognitive (not only sensorimotor) functions they mediate.
The seemingly paradoxical relative enlargement of the cerebral cortex concurrent to a coordinated increase in numbers of neurons in the cerebral and cerebellar cortices across species may be explained by a combination of at least three factors: the faster increase in volume of the cerebral subcortical white matter than of the cerebellar white matter in larger brains (Zhang and Sejnowski, 2000
; Bush and Allman, 2003
); the small relative size of the cerebellum (about 10–14% of brain size), because of which variations of even 50% in its relative size may fail to reach significance across species; and a faster increase in overall neuronal size (including dendrites and axons) in the cerebral cortex than in the cerebellum predicted to occur in rodents and insectivores of increasing brain size (Herculano-Houzel et al., 2006
; Sarko et al., 2009
). The faster increase in neocortical than in cerebellar white matter in larger brains probably reflects the functional importance of long-range connectivity through the subcortical white matter for the operation of associative networks in the cerebral cortex (Wen and Chklovskii, 2005
), while associative connections in the cerebellum, in contrast, consist mostly of shorter-range connections within the gray matter (Bush and Allman, 2003
).
It is important to bear in mind, however, that the interspecific numeric relationships described here, both between numbers of neurons in the cerebral cortex and in the cerebellum, and between each structure’s mass and its number of neurons, do not necessarily apply to variation across individuals within the same species. First, while structure mass and numbers of neurons vary across species in the present sample by about 10,000-fold, variation within each of these species is typically of less than 0.3-fold (Herculano-Houzel et al., 2006
, 2007
). Such comparatively small intraspecific variations in brain size may not be correlated with variations in number of neurons (P. Morterá and S. Herculano-Houzel, unpublished observations), but rather reflect individual variations in the size of neuronal arborizations and in numbers of synapses. Therefore, while the number of neurons in the cerebral cortex is today considered a good correlate of cognitive abilities across species (Roth and Dicke, 2005
), and absolute brain size has been found to be the best predictor of cognitive abilities across non-human primate species (Deaner et al., 2007
), a larger brain or structure size or even number of neurons is not necessarily accompanied by better cognitive abilities within a species. Across these individuals, other factors such as variations in number and identity of synaptic connections within and across structures, building on a statistically normal, albeit variable, number of neurons, and depending on genetics and life experiences such as learning, are more likely to be determinant of the individual cognitive abilities (see, for instance, Mollgaard et al., 1971
; Black et al., 1990
; Irwin et al., 2000
; Draganski et al., 2004
).
Finally, the coordinated increase in numbers of cortical and cerebellar neurons across adult brains of different sizes in evolution raises the possibility that a direct mechanism may be in place that adjusts the number of neurons in the cerebellum and cerebral cortex to one another during development, such that, when the number of neurons in the cerebral cortex undergoes a major evolutionary change, the number of neurons in the cerebellum is changed accordingly in a self-organizing fashion, although probably not through direct coupling of neurogenesis, since the two structures originate from different progenitor populations (reviewed in Goldowitz and Hamre, 1998
; Jones, 2009
). It is well established that the number of granule cells is regulated by the number of Purkinje cells, while the number of Purkinje cells themselves seems to be subject to regulation by cell death (reviewed in Goldowitz and Hamre, 1998
), which might in turn be subject to afferent-dependent regulation (reviewed in Linden, 1994
; Sherrard and Bower, 1998
). The neuronal populations in the cerebral cortex and in the cerebellum might therefore be matched numerically through afferent- or target-dependent regulation via their thalamic and pontine relay nuclei, even though they are not directly connected with each other. Given that the adult number of cerebellar neurons is only established well into postnatal development, and after the adult complement of neurons in the cerebral cortex has been reached, the cortico-ponto-cerebellar projection is a likely candidate to mediate the numerical matching of cerebral and cerebellar cortical neurons. In this manner, even if small variations in the number of neurons in the cerebral cortex turn out not to correlate with variations in the number of neurons in the cerebellum across normal individuals of a same species, larger changes resulting from genetic alterations in evolution that affect the size of the neuronal population of the cerebral cortex alone might conceivably result in a coordinated increase in numbers of neurons in the cerebellum. Circumstantial support for this hypothesis is provided by several reports of crossed cerebrocerebellar atrophy in humans, considered to reflect secondary degeneration of the cerebellar hemisphere caused by massive disconnection with the contralateral cerebral hemisphere (Tien and Ashdown, 1992
; Kozic and Kostic, 2001
) and accompanied by pontine atrophy (Tan and Urich, 1984
). We are currently testing this hypothesis experimentally.
The author declares that the research was conducted in the absence of any commercial or financial relationships that could be construed as a potential conflict of interest.
Thanks to Chet Sherwood and Camilla Butti for help with the phylogenetic analysis, to the colleagues who participated in the original studies that yielded the data analyzed here, and to Roberto Lent and Jon Kaas for continued support. Supported by CNPq (Edital Universal) and FAPERJ (Jovem Cientista do Estado do Rio de Janeiro).
Maddison, W. P., and Maddison, D. R. (2005). Mesquite: a modular system for evolutionary analysis. Version 2.7. Available at: http://mesquite project.org.
Ramnani, N., Behrens, T. E., Johansen-Berg, H., Richter, M. C., Pinsk, M. A., Andersson, J. L., Rudebeck, P., Ciccarelli, O., Richter, W., Thompson, A. J., Gross, C. G., Robson, M. D., Kastner, S., and Matthews, P. M. (2006). The evolution of prefrontal inputs to the cortico-pontine system: Diffusion imaging evidence from macaque monkeys and humans. Cereb. Cortex 16, 811–818.