Biomedizinische NMR Forschungs GmbH am Max-Planck-Institut für biophysikalische Chemie, Göttingen, Germany
The human visual system comprises elongated fiber pathways that represent a serious challenge for diffusion tensor imaging (DTI) and fiber tractography: while tracking of frontal fiber bundles may be compromised by the nearby presence of air-filled cavities, nerves, and eye muscles, the anatomic courses of the three main fiber bundles of the optic radiation are subject to pronounced inter-subject variability. Here, tractography of the entire visual pathway was achieved in six healthy subjects at high spatial accuracy, that is, at 1.8 mm isotropic spatial resolution, without susceptibility-induced distortions, and in direct correspondence to anatomic MRI structures. Using a newly developed diffusion-weighted single-shot STEAM MRI sequence, we were able to track the thin optic nerve including the nasal optic nerve fibers, which cross the optic chiasm, and to dissect the optic radiation into the anterior ventral bundle (Meyer’s loop), the central bundle, and the dorsal bundle. Apart from scientific applications these results in single subjects promise advances in the planning of neurosurgical procedures to avoid unnecessary damage to the visual fiber system.
In humans the visual pathway extends from the eyes to the calcarine fissure and thereby passes through the entire brain in a roughly transverse orientation. As schematically indicated in Figure 1
ganglion cells of the retina converge to the optic nerve in each hemisphere and travel as a well-defined fiber bundle through the optic chiasm. The chiasm is a flattened commissural bundle, formed by the fusion of both optic nerves including nasal retinal fibers that cross to the opposite optic tract. The optic tract begins in the postero-lateral angle of the chiasm and enters the lateral geniculate nucleus (LGN) where the layered input maintains a topographic order. The LGN serves as a major bi-hemispheric relay structure that transmits optic impulses to the visual cortex via the optic radiation. This latter structure consists of three large fiber bundles: the anterior ventral fiber bundle also termed Meyer’s loop, the central bundle, and the dorsal bundle. Meyer’s loop runs anteriorly around the tip of the inferior horn, passes posteriorly along the lateral wall of the ventricle, and converges on the lower lip of the calcarine fissure. The central bundle leaves the LGN in a lateral direction and then follows a posterior direction along the lateral wall of the ventricle to radiate into the visual cortex. The dorsal bundle moves straight into a posterior direction to meet the upper part of the primary visual cortex.
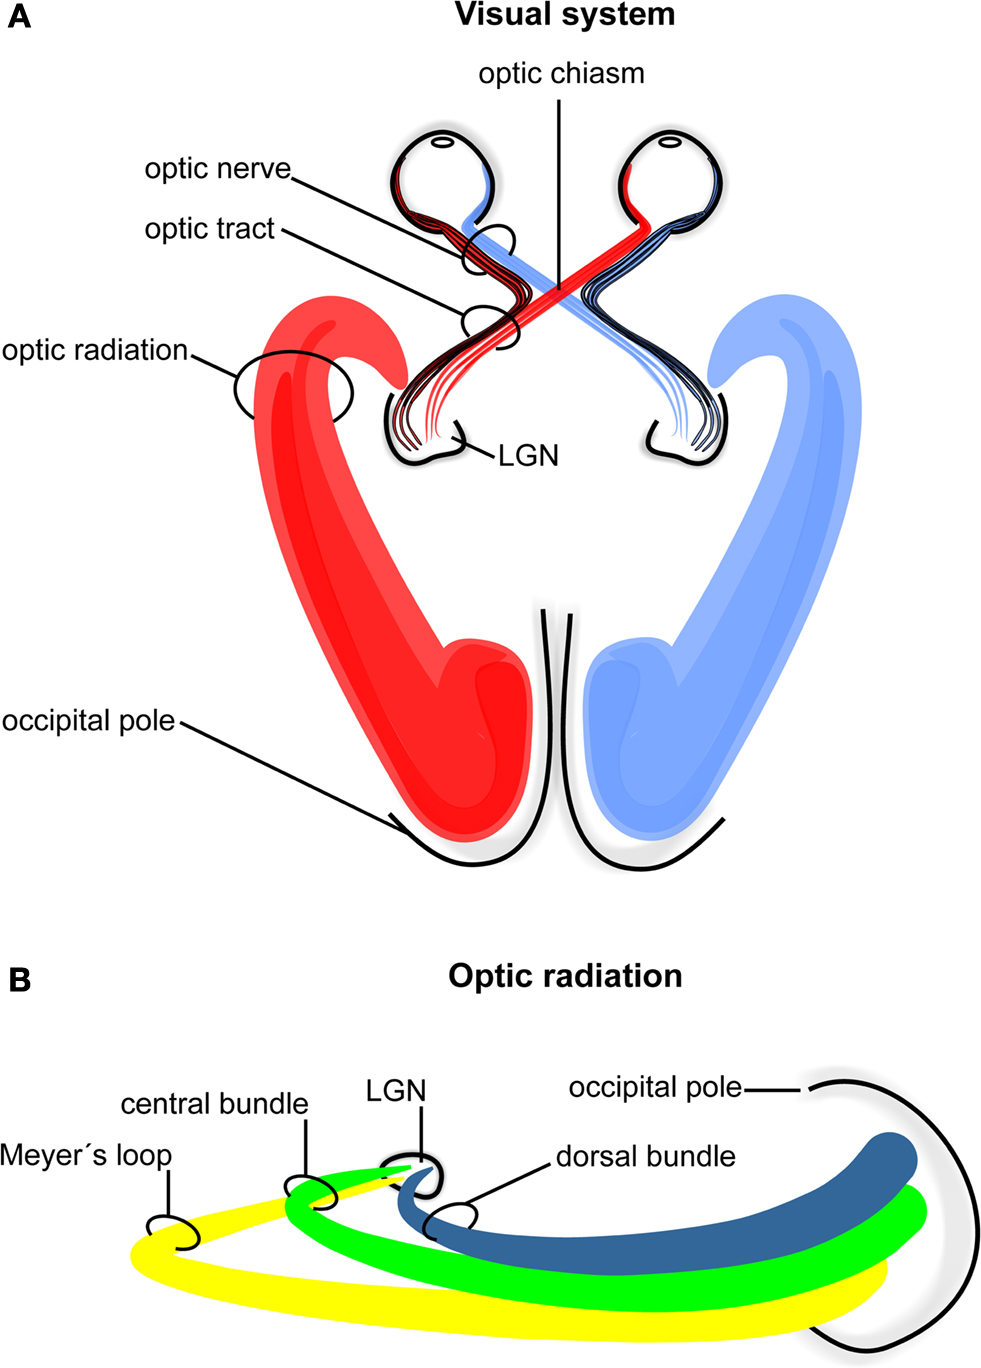
Figure 1. Schematic drawing of the human visual system. (A) Right- and left-hemispheric fiber pathways. (B) Left-hemispheric optic radiation comprising the anterior bundle termed Meyer’s loop (yellow), the central bundle (green), and the dorsal bundle (blue). LGN, lateral geniculate nucleus.
The anatomic course of the optic radiation, especially Meyer’s loop, exhibits considerable intersubject variability (Ebeling and Reulen, 1988
; Sherbondy et al., 2008
). Hence, it is essential to determine its exact anatomy in individual subjects in order to minimize damage to the visual fiber system during neurosurgery. In fact, the risk of damage to the optic radiation is substantial, because it is not visible under the operative microscope. Several attempts have been made to localize the optic radiation with the use of either anatomic landmarks (Ebeling and Reulen, 1988
) or complex normative brain atlases (Bürgel et al., 1999
). However, if normal variations or pathologic processes cause a positional displacement or deformation of the optic nerve, optic tract, or optic radiation, then anatomic landmarks and normative templates are only of limited value.
Fiber tractography based on diffusion tensor imaging (DTI) has become a valuable tool for mapping white matter structures and to assess their structural integrity in the human brain (e.g., see Ramnani et al., 2004
; Dougherty et al., 2005
; Hofer and Frahm, 2006
). Instead of using standard brains to predict individual brain anatomy, it is now possible to resolve fiber systems in single subjects in vivo. While most clinical DTI studies rely on invariant scalar measures such as radial and axial diffusivities as well as fractional anisotropy to characterize white matter, there is an increasing use of DTI-based tractography methods to reconstruct complete fiber tracts in three dimensions. The approach has already been integrated into pre-surgical planning and exploited for intra-operative guidance using neuro-navigational systems (Coenen et al., 2005
). Nevertheless, and apart from the general DTI limitations such as relatively poor spatial resolution, tractography of the optic fiber pathway remains a problem. Several difficulties contribute to this challenge. First of all, the human optic nerve is only 3–4 mm thick and embedded in orbital bone, fat, and cerebrospinal fluid, while susceptibility differences are caused by air in nearby structures. Moreover, although the optic radiation consists of large axons with thick myelin sheaths, it has only a low fiber density and wide translucent spaces (Kitajima et al., 1996
) which impair the DTI data quality and subsequent fiber tracking. Thus, acquisition techniques are required that are insensitive to susceptibility-induced signal losses or geometric distortions and further allow for high spatial resolution and an adequate signal-to-noise ratio (SNR). The former condition is fulfilled by diffusion-weighted single-shot stimulated echo acquisition mode (STEAM) MRI sequences which rely on radiofrequency-refocused stimulated echoes that are free from any sensitivity to magnetic field inhomogeneities (Nolte et al., 2000
). Its lower SNR in comparison to EPI-based DTI could recently be ameliorated by combining partial Fourier and parallel imaging strategies (Karaus et al., 2009
).
MRI
A total of six male human subjects (age range 26–29 years) participated in the study. None of them had any history of neurologic abnormality. All subjects gave written informed consent before each examination.
MRI studies were conducted on a 3 T system (Tim Trio; Siemens Healthcare, Erlangen, Germany) using a 32-channel phased-array head coil. DTI was performed at 1.8 mm isotropic spatial resolution using diffusion-weighted single-shot STEAM MRI with 24 diffusion gradient directions and b values of 0 and 1000 s mm−2. In contrast to gradient-echo MRI sequences such as echo-planar imaging, the main advantage of STEAM MRI is the use of radiofrequency-refocused stimulated echoes (STEs) that fully compensate any off-resonance effects, water–fat chemical shift differences, and magnetic field inhomogeneities and thereby eliminate corresponding image artifacts (Nolte et al., 2000
).
A generic single-shot STEAM sequence for diffusion-weighted MRI reads,
Briefly, a spin-echo (SE) diffusion module (underlined) generates a diffusion-weighted SE signal at echo time TESE, which replaces the initial 90° radiofrequency pulse of a single-shot STEAM sequence. The readout interval of the STEAM sequence (in square brackets) is repeated with a repetition time TRSTE in order to excite a sufficiently large number of differently phase-encoded STE signals at echo time TESTE. It comprises a low-flip angle readout pulse, an incremented phase-encoding gradient, a frequency-encoding gradient, and an acquisition window centered at the STE. The middle interval TM contains spoiler gradients that preclude the formation of unwanted transverse coherences. All radiofrequency pulses are slice-selective to allow for multi-slice imaging. The entire sequence is repeated to acquire images for all diffusion gradient directions, one image without diffusion weighting, and one set of external reference lines required for parallel imaging.
This newly developed sequence version combines centric reordering of the Cartesian phase-encoding scheme with 6/8 partial Fourier encoding and partially parallel imaging using the GRAPPA technique with an acceleration factor of 2. Relative to full Fourier acquisitions without parallel imaging, the significantly lower number of Fourier lines shortens the image acquisition time by more than a factor of 2 and simultaneously increases the SNR by almost a factor of 3 due to the possibility of using higher flip angles (for more details see Karaus et al., 2009
).
Here, a total of 41 transverse sections of 1.8 mm thickness covered the entire visual pathway in an oblique orientation that followed the course of the optic nerve, optic chiasm, and optic tract to reduce the influence of partial volume effects in respective areas. The 191 mm × 151 mm field of view (FOV) was sampled by a Cartesian 106 × 84 acquisition matrix yielding 1.8 mm in-plane resolution. The measurement time per dataset was approximately 5 min. To increase the SNR, the acquisition was repeated five times. The achieved image quality and, in particular, the lack of susceptibility-induced geometric distortions or signal losses is demonstrated in Figure 2
. These contiguous sections refer to the original diffusion-weighted images (averaged across gradient directions) and color-code FA maps of the optic nerve, chiasm and tract.
Anatomic images were based on a T1-weighted 3D fast low angle shot (FLASH) MRI sequence (repetition time TR = 11 ms, echo time TE = 4.9 ms, flip angle 15°).
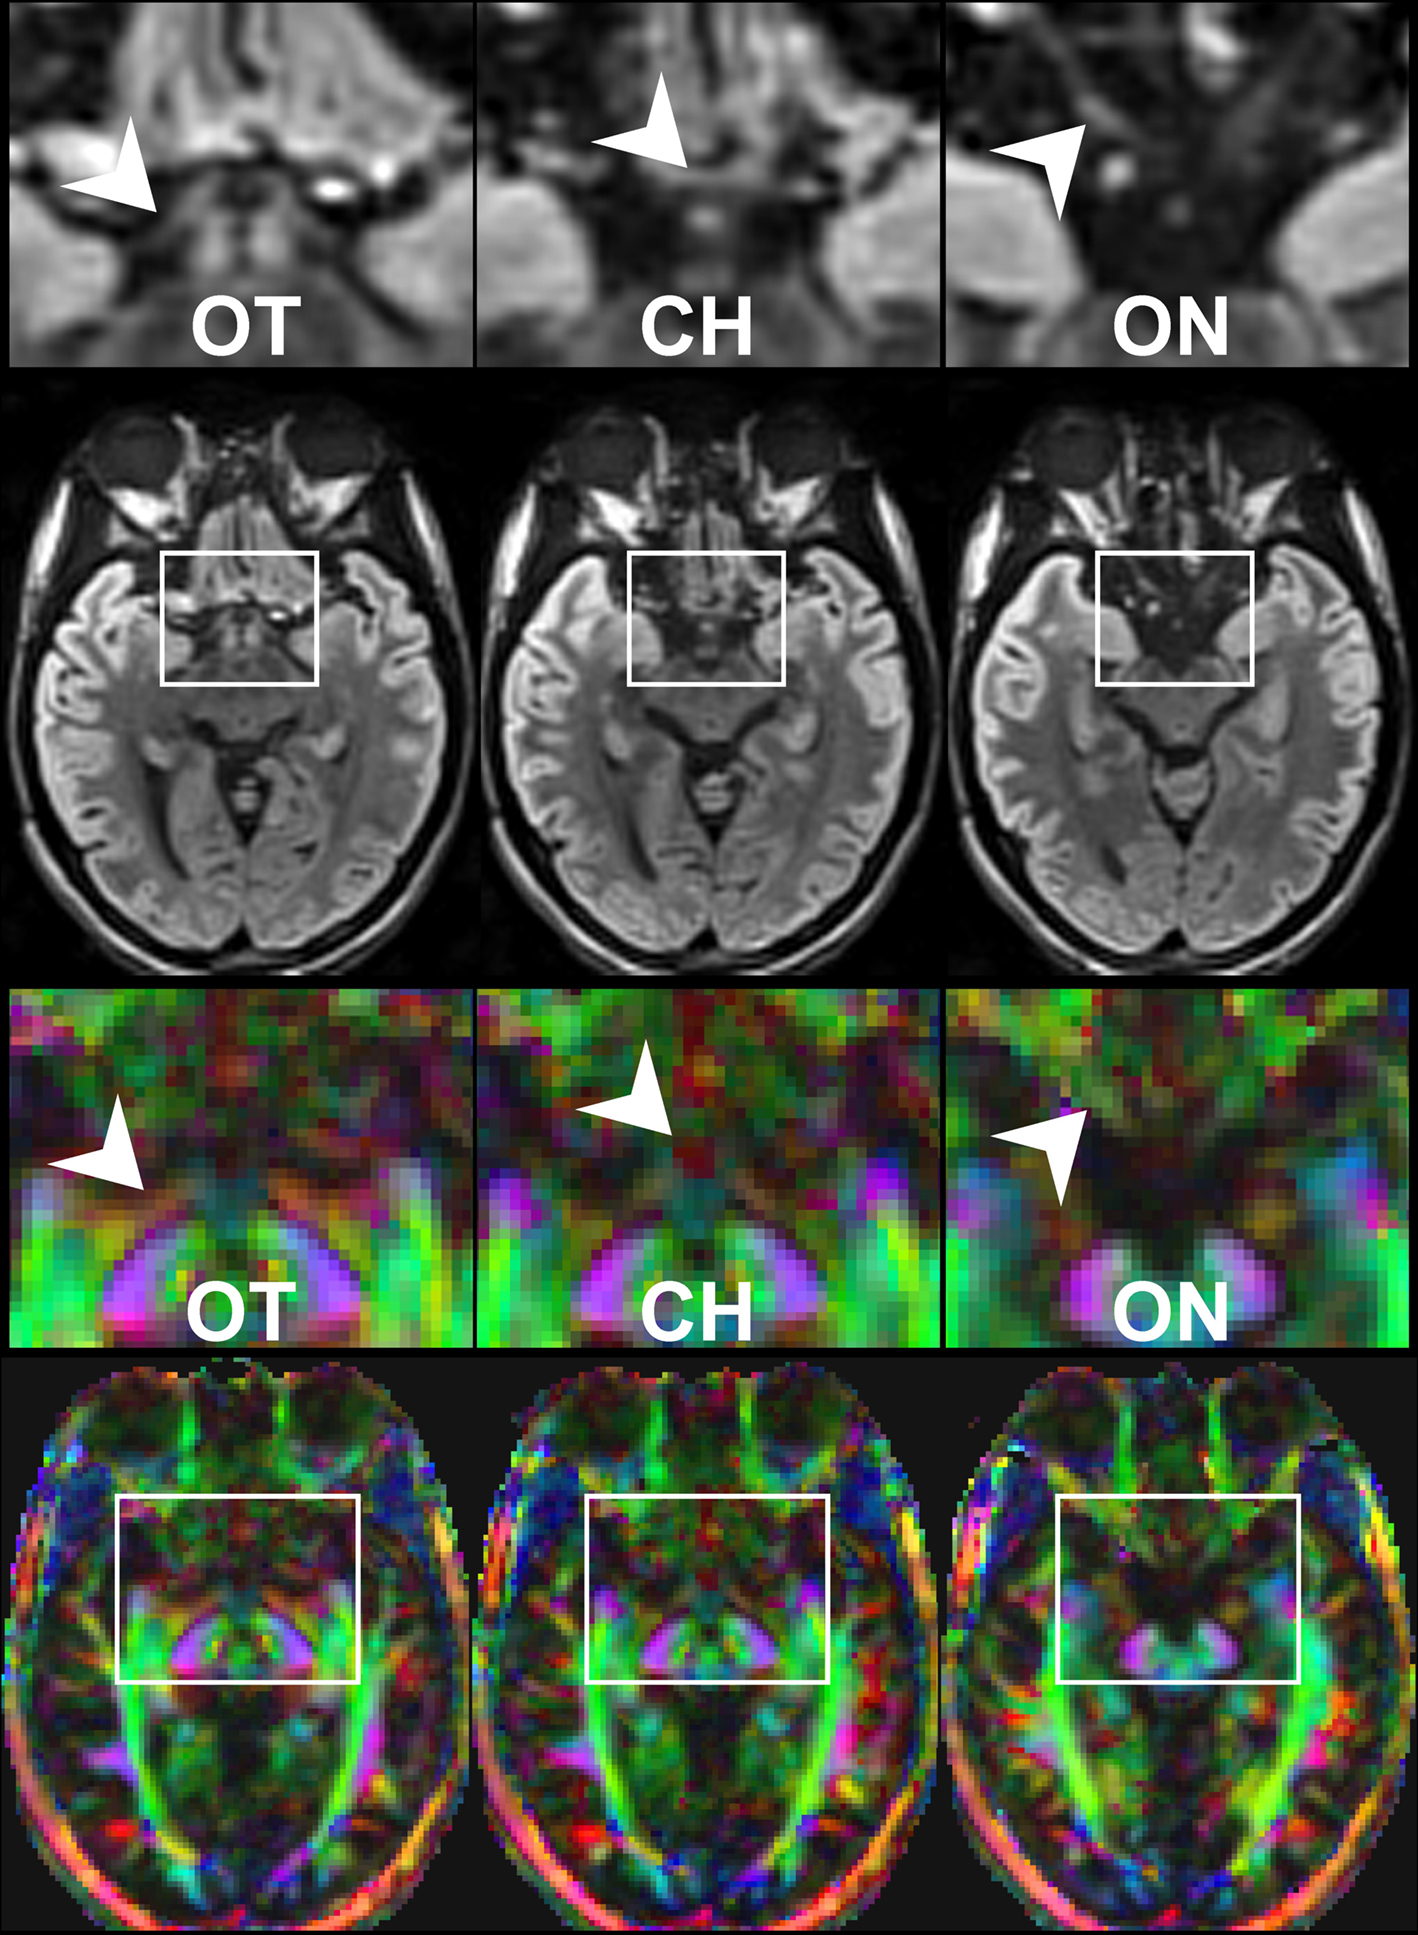
Figure 2. Contiguous diffusion-weighted STEAM images (averaged across gradient directions) and color-coded FA maps covering the area of the optic nerve and chiasm without susceptibility artifacts at 1.8 mm isotropic spatial resolution (magnified views on top, arrowheads indicate respective areas). OT, optic tract; CH, chiasm; ON, optic nerve. Green = anterior–posterior, blue = superior–inferior, red = right–left.
Fiber Tractography
Before calculation of the diffusion tensor the diffusion-weighted images were interpolated to 0.9 mm isotropic resolution. Estimates of axonal projections were computed by the tensorlines algorithm (Weinstein et al., 1999
) using nine seed points per image voxel. This method was found to be particularly successful for reconstructing extended fiber bundles in both rhesus monkey (Hofer et al., 2008
) and human brain (Karaus et al., 2009
). For a more detailed description of the software developed for DTI analysis see Küntzel (2007)
.
In all cases, the selection of a suitable region of interest (ROI) as a start or target ROI for tractography was directly based on the anatomic MRI data from the same subject. This ability is due to the fact that the STEAM DTI maps are spatially congruent to the anatomic MRI data without the need for a co-registration or alignment technique. It greatly facilitates the tracking process and improves its general reliability as it also lends itself to an accurate anatomic control of reconstructed tracts.
All fiber bundles were identified by ROI-to-ROI tracking. As illustrated in Figure 3
, tractography of the optic nerve and optic tract employed a start ROI covering the optic chiasm, while the target ROI was placed in the lateral geniculate nucleus (LGN). Reconstruction of the optic radiation was accomplished by combining a start ROI in the LGN with a target ROI in the white matter near primary visual areas. Furthermore, for reconstructions of the individual fiber bundles of the optic radiation, the start ROI in the LGN was complemented with a target ROI in a more ventral (Meyer’s loop), central (central bundle), or dorsal location (dorsal bundle). Tracking terminated when the fractional anisotropy was lower than 0.1, or the main diffusion directions in consecutive steps differed by more than 30° to 70°, depending on the curvature of the targeted fiber bundle. These thresholds were chosen in a conservative manner, but needed to be optimized empirically. For example, reconstruction of the anterior portion of Meyer’s loop obviously requires a larger curvature than tracking of the dorsal bundle (compare Figure 1
).
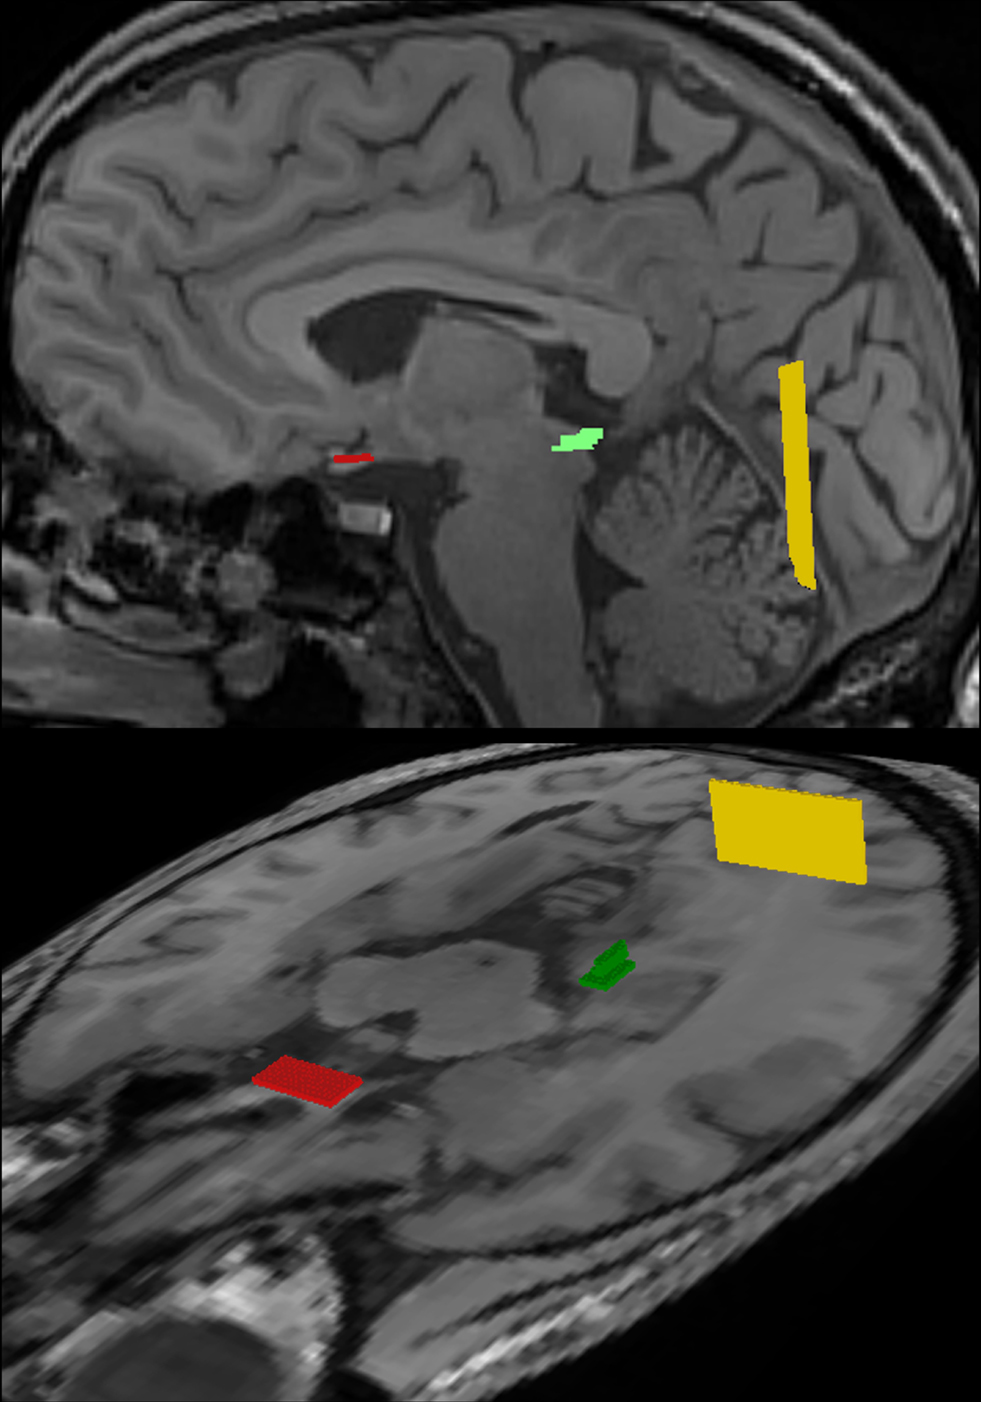
Figure 3. Regions-of-interest (ROI) chosen for fiber tractography of the visual pathway in complementary views. The optic nerve and optic tract were delineated by combining a start ROI in the optic chiasm (red) with a target ROI in the LGN (green). Correspondingly, the optic radiation was obtained by a start ROI in the LGN (green) and a target ROI in the white matter next to primary visual areas (yellow). For further details see text.
The DTI acquisition and fiber tractography techniques chosen here successfully reconstructed the entire visual system in both hemispheres. Table 1
summarizes the results obtained for the nasal and lateral optic nerves, optic tract, Meyer’s loop, central bundle, and dorsal bundle in all six subjects. With the exception of one subject (#3), most fiber bundles were either fully (XX) or partially (X) reconstructed, the latter referring to the identification of only a limited number of tracks. In cases where no reliable reconstruction (0) was achieved, the situation was mainly caused by the occurrence of too many false-positive tracks. In particular, in subject #3 the failure to reconstruct fibers of the optic radiation must be ascribed to the close vicinity and predominance of the inferior longitudinal and fronto-occipital fasciculi.
Table 1. Reconstructed fiber bundles for individual subjects.
Figure 4
shows the components of the entire visual pathway for a single subject (#1) in both hemispheres (top view). Despite the caution to reduce false-positive tracks, it was impossible to avoid fiber tracks that travel along the optic nerve and jump over to a neighboring eye muscle, namely the medial or lateral musculus rectus, the course of which closely parallels that of the optic nerve. On the other hand, because of the absence of susceptibility artifacts, we could differentiate fiber bundles that cross the optic chiasm. As shown in Figure 5
we separately identified fibers connecting the right eye, more precisely the axons of the eye’s ganglion cells, with the right and left LGN, as well as fibers connecting the left eye with the left and right LGN. The approach distinguishes the lateral retinal fibers from the nasal retinal fibers that cross the chiasm and enter the opposite optic tract. Finally, the fiber bundles of the optic radiation are visualized in Figure 6
. The anatomic courses of Meyer’s loop, the central bundle, and the dorsal bundle that all connect the LGN with the primary visual cortex closely follow the expected outline as depicted in Figure 1 and described in Section “Introduction”.
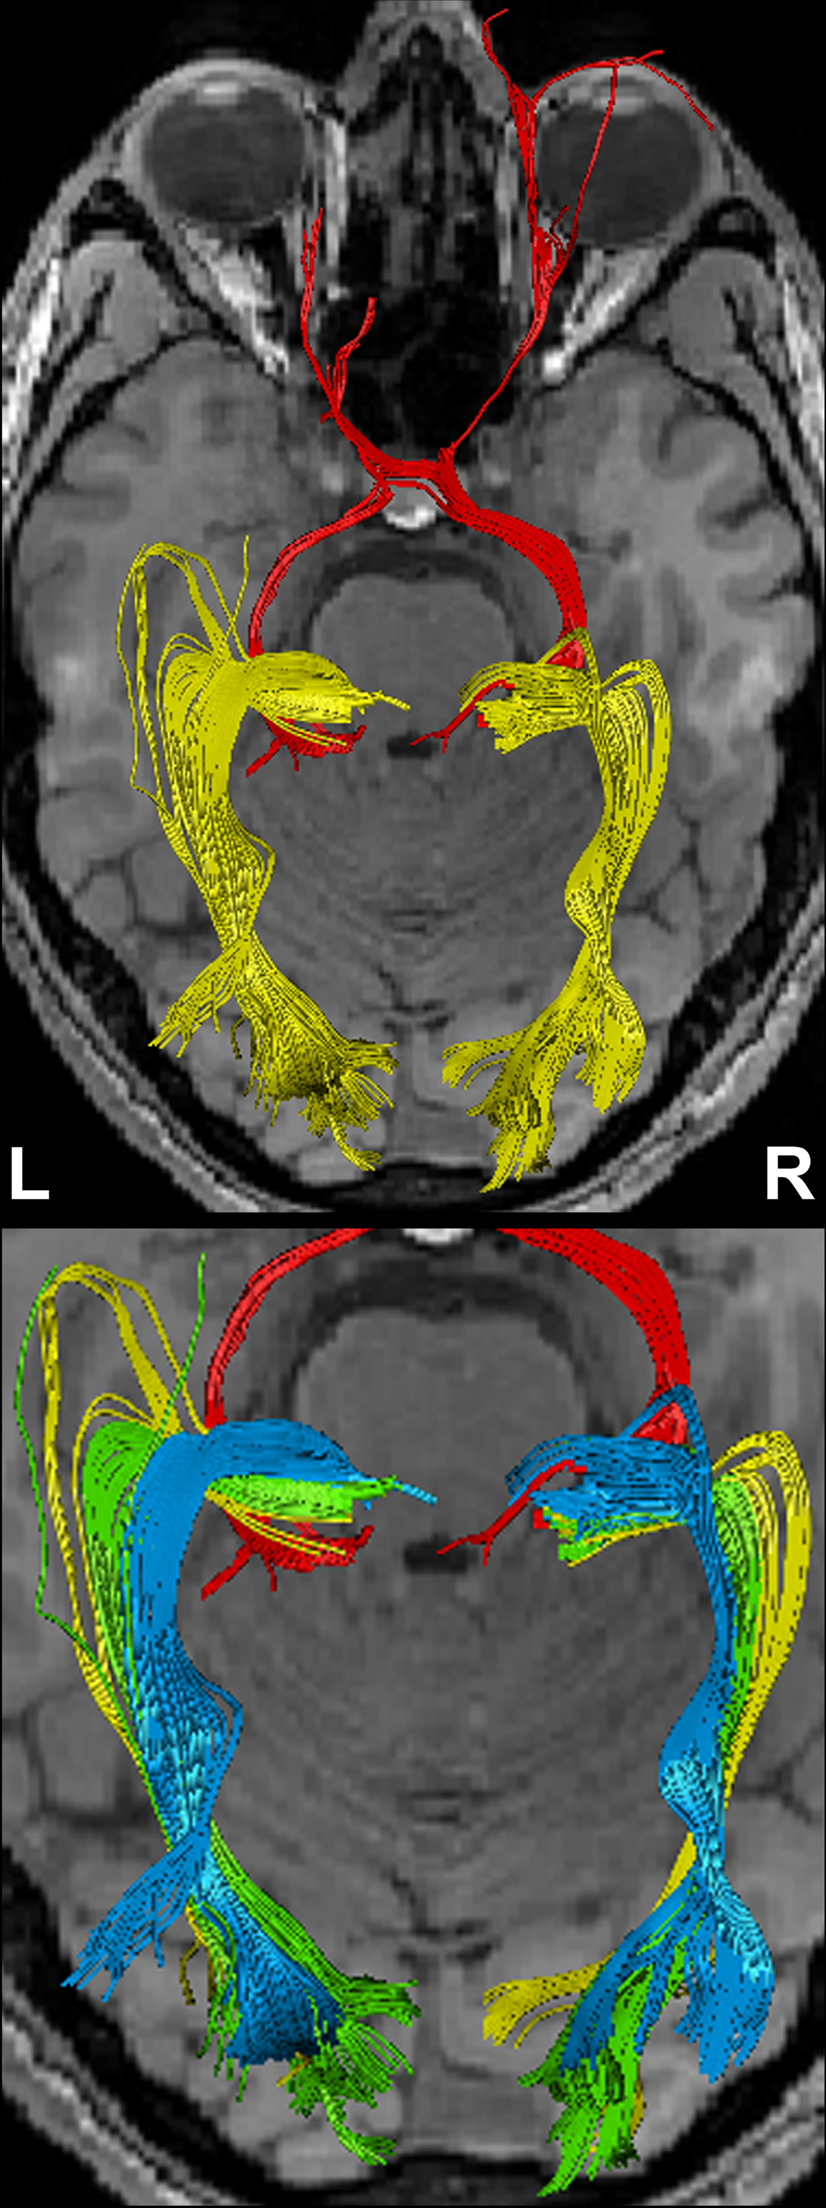
Figure 4. (Top) Bi-hemispheric reconstructions of the optic nerve and tract (red) as well as of the optic radiation (yellow). (Bottom) Dissection of the optic radiation into Meyer’s loop (yellow), central bundle (green), and dorsal bundle (blue). R, right, L, left.
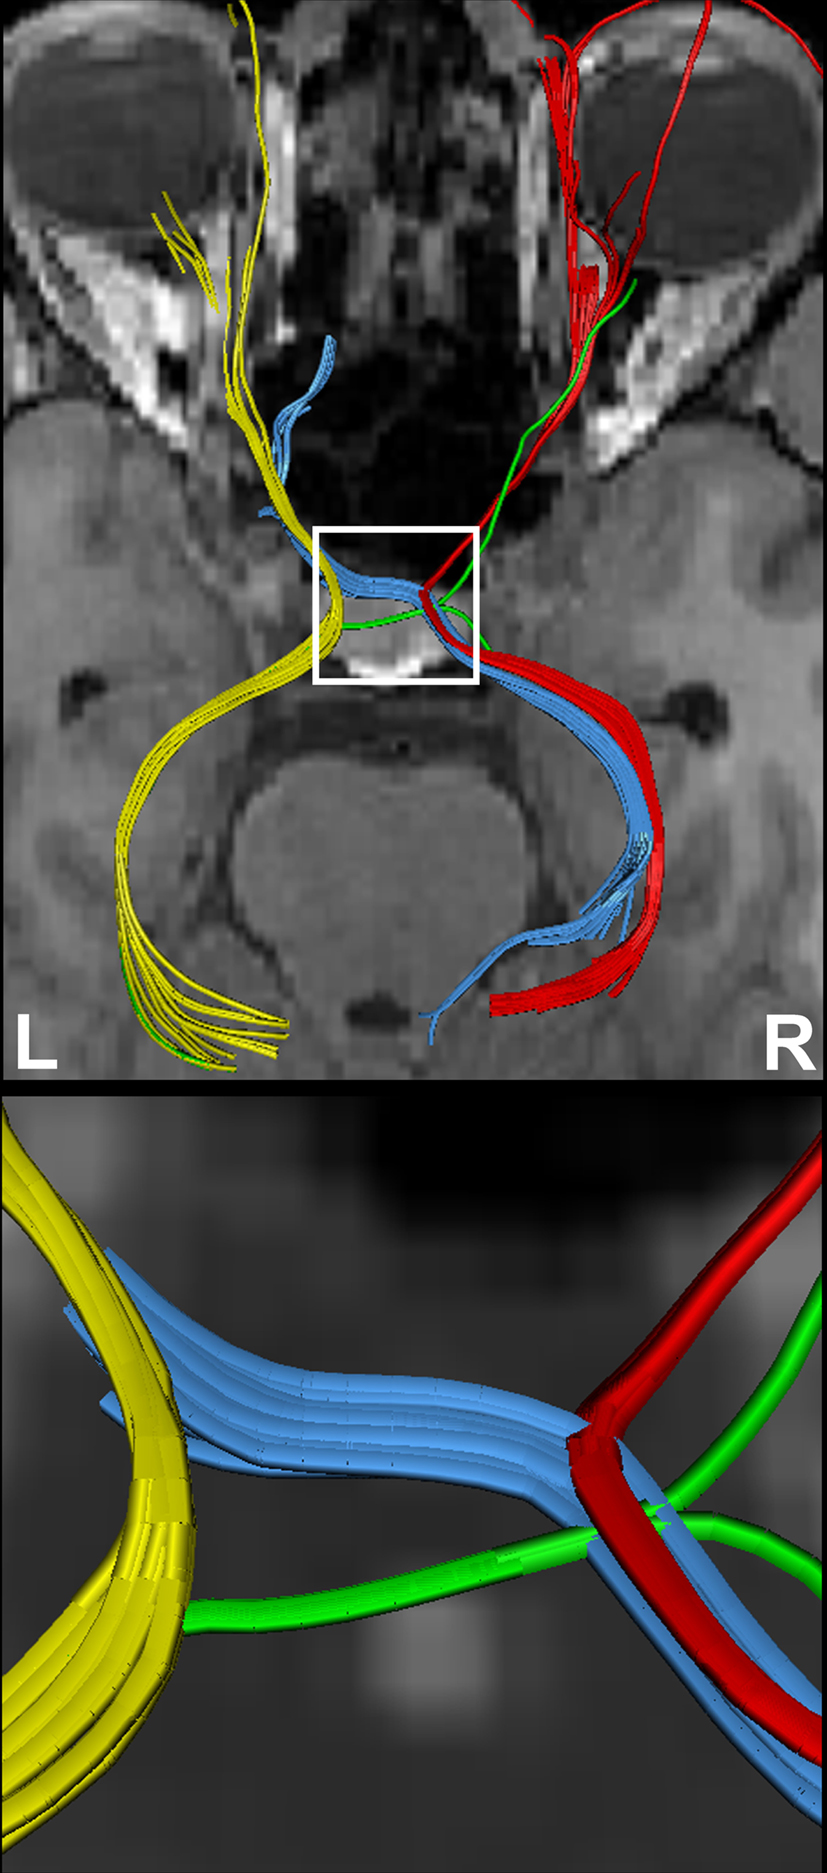
Figure 5. (Top) Separation of right- and left-hemispheric fibers in the optic nerve and optic tract. (Bottom) Magnification of fiber tracks crossing the optic chiasm: tracks from the left eye to the left (yellow) and right LGN (blue), tracks from the right eye to the left (green) and right LGN (red). R, right, L, left.
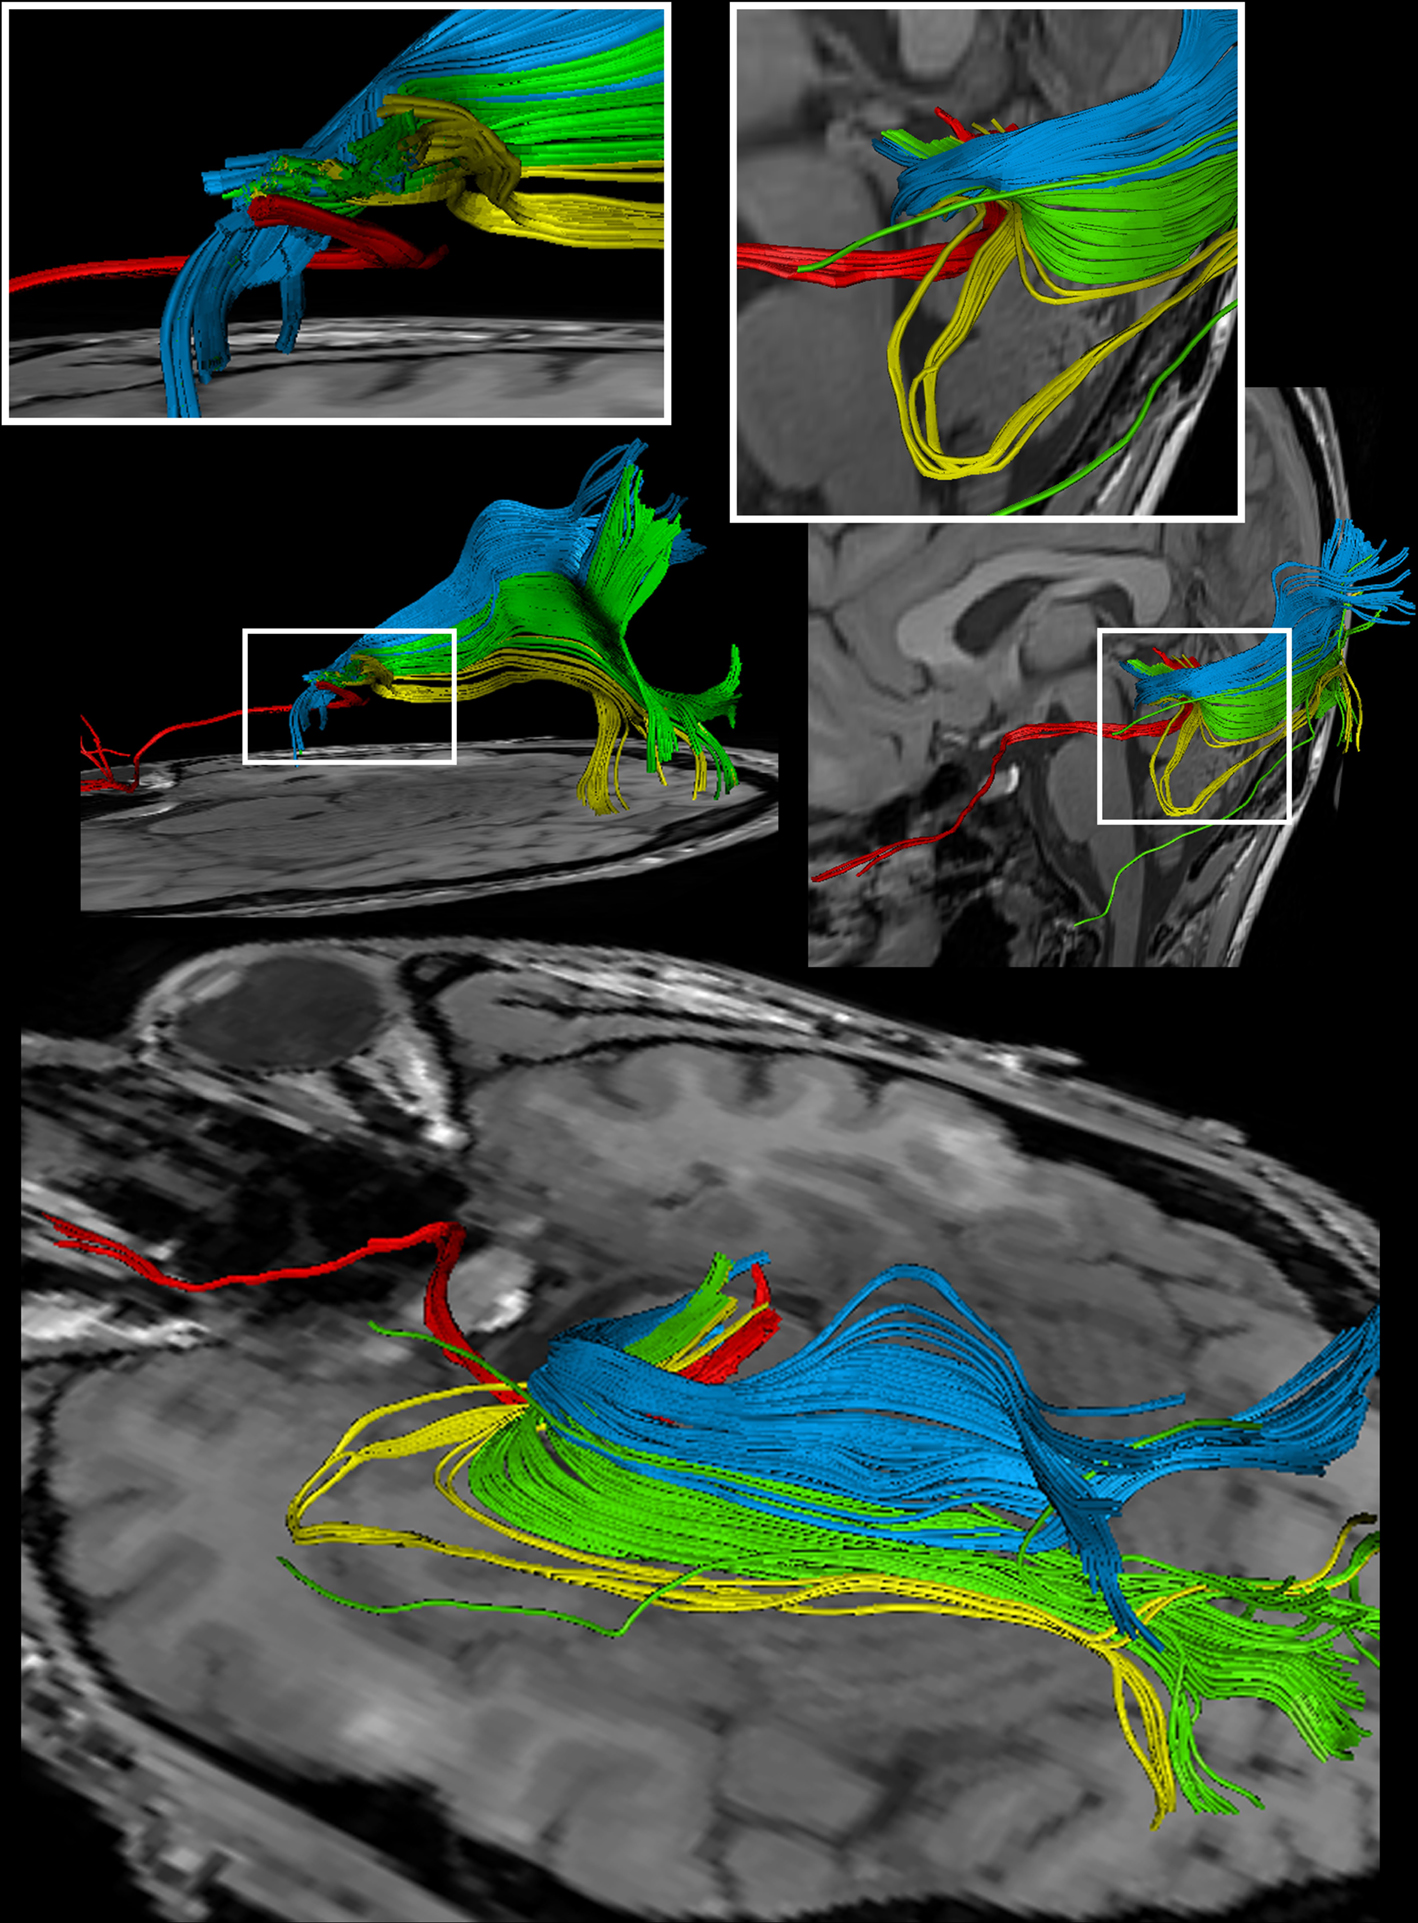
Figure 6. Reconstructions of the optic nerve and tract (red), Meyer’s loop (yellow), central bundle (green), and dorsal bundle (blue) in different views. (White boxes) Magnifications of the area around the LGN. (Upper left) Fiber bundles of the right hemisphere. (Upper right and bottom) Fiber bundles of the left hemisphere.
In contrast to previous studies (Yamamoto et al., 2005
, 2007
; Staempfli et al., 2007
; Sherbondy et al., 2008
; Tao et al., 2009
) we could identify the full anterior–posterior extent of the human visual pathway with the use of a relatively simple and conservative tracking algorithm (Figures 4
–6
). Individual fiber bundles were independently dissected by separate tracking and agree well with classic anatomic studies (Ebeling and Reulen, 1988
; Tamraz and Comair, 2006
).
The most important limitation of state-of-the-art DTI-based fiber tractography is still the lack of adequate spatial resolution as it risks to increase the number of false-positive fibers, for a discussion see Hofer and Frahm (2006
, 2008)
, Hofer et al. (2008)
. Here, the use of 1.8 mm isotropic voxels reduces the voxel size of a more conventional 2.5 mm acquisition by a factor of 2.7. Nevertheless, this resolution is still not good enough to avoid “kissing” effects between the optic nerve and neighboring eye muscles. Moreover, better resolution would further improve the robust identification of fibers crossing the optic chiasm or reduce the probability of false-positive attractions to other dominating fiber pathways (subject #3). Another attempt made to minimize the occurrence of false-positive tracks is the use of a conservative anatomic ROI-to-ROI tracking technique in combination with geometrically undistorted DTI acquisitions. Each of the two ROIs covers the correct position of the respective brain region, while tracking excludes all fiber tracks that do not directly connect both regions. In contrast to the work by Staempfli et al. (2007)
we could therefore easily exclude the large oculomotor nerve (CNIII), which is close to the optic chiasm in a ventral location and travels posteriorly into the nuclei of the brain stem.
The anterior location of Meyer’s loop was previously shown by Yamamoto et al. (2005)
. However, in contrast to the present work, their approach to the visual system was hampered by susceptibility artifacts, geometric distortions, and limited spatial resolution, so that these authors lost parts of the visual pathway in frontal regions. Another study by Staempfli et al. (2007)
visualized the optic path with the help of a fast marching tracking algorithm, which is prone to generate a large number of false-positive fibers. As a consequence, and in contradiction to the true anatomic course, nearly each voxel yielded fiber connections to its left and right neighbors. Another drawback of the study is the missing of Meyer’s loop with its anterior extension.
As indicated earlier, it is important to reliably identify the fiber components of the optic radiation in single subjects. Several lines of evidence indicate a relationship between the intactness of parts of the tip of the temporal horn and specific visual field defects (Van Buren and Baldwin, 1958
; Krolak-Salmon et al., 2000
; Nilsson et al., 2007
). In fact, not all fibers from a given retinal region lie close together in the optic radiation. Or in other words, visual field defects are based on a lesion solely of the optic radiation, because fibers from adjacent retinal elements are spatially separated in this large bundle. Clinical observations indicate that Meyer’s loop contains fibers representing both ipsi- and contralateral retinal halves. A lesion of this fiber bundle inevitably leads to a homonymous hemianopsia of the upper quadrant, a special type of partial blindness (Nilsson et al., 2007
). Because the exact dimension of the anterior extension of Meyer’s loop varies in humans (Krolak-Salmon et al., 2000
; Yamamoto et al., 2005
; Sherbondy et al., 2008
), it is not practical to employ a single fixed position as a safe limit for resection – even if it is statistically evaluated. A resection line behind the temporal pole has a high probability to damage Meyer’s loop and induce hemianopsia (Krolak-Salmon et al., 2000
). With even more posterior resections, the chance to elicit a visual field defect increases considerably. It is therefore important to visualize and identify all parts of the optic radiation in individual patients to preserve the optic radiation during a brain operation.
In conclusion, to the best of our knowledge this is the first visualization of the entire human visual pathway in its full anterior–posterior extension. The chosen strategy ensures the reconstruction of anatomically correct fiber bundles, including the optic nasal nerves, optic chiasm, and Meyer’s loop, and allows for studies of single subjects. Apart from scientific applications these results promise advances in the planning of neurosurgical procedures to avoid unnecessary damage to the visual fiber system.
The authors declare that the research was conducted in the absence of any commercial or financial relationships that could be construed as a potential conflict of interest.
We acknowledge financial support by the German Ministry for Education and Research (BMBF) via the Bernstein Center for Computational Neuroscience (BCCN) Göttingen under Grant No. 01GQ0431.
Küntzel, M. (2007). Parallele Datenakquisition zur Beschleunigung diffusions-gewichteter Kernspintomographie mit stimulierten Echos [Parallel data acquisition for diffusion-weighted MRI using stimulated echoes]. Dissertation. Georg-August-Universität, Göttingen. Online access: http://webdoc.sub.gwdg.de/diss/2007/kuentzel/kuentzel.pdf