


94% of researchers rate our articles as excellent or good
Learn more about the work of our research integrity team to safeguard the quality of each article we publish.
Find out more
ORIGINAL RESEARCH article
Front. Neuroanat. , 17 February 2011
volume 5 - 2011 | https://doi.org/10.3389/fnana.2011.00005
The thick-tufted layer V pyramidal (TTL5) neuron is a key neuron providing output from the neocortex. Although it has been extensively studied, principles governing its dendritic and axonal arborization during development are still not fully quantified. Using 3-D model neurons reconstructed from biocytin-labeled cells in the rat somatosensory cortex, this study provides a detailed morphological analysis of TTL5 cells at postnatal day (P) 7, 14, 21, 36, and 60. Three developmental periods were revealed, which were characterized by distinct growing rates and properties of alterations in different compartments. From P7 to P14, almost all compartments grew fast, and filopodia-like segments along apical dendrite disappeared; From P14 to P21, the growth was localized on specified segments of each compartment, and the densities of spines and boutons were significantly increased; From P21 to P60, the number of basal dendritic segments was significantly increased at specified branch orders, and some basal and oblique dendritic segments were lengthened or thickened. Development changes were therefore seen in two modes: the fast overall growth during the first period and the slow localized growth (thickening mainly on intermediates or lengthening mainly on terminals) at the subsequent stages. The lengthening may be accompanied by the retraction on different segments. These results reveal a differential regulation in the arborization of neuronal compartments during development, supporting the notion of functional compartmental development. This quantification provides new insight into the potential value of the TTL5 morphology for information processing, and for other purposes as well.
The pyramidal cell (also termed the principle cell) is the major excitatory neuron in all cortical layers except layer I, representing 70–85% of the total population of neurons in the mammal cortex as well as in the hippocampus. Typical pyramidal cells are characterized by two distinct dendritic domains emerging from the base and ascending from the apex of a soma, which are all covered by spines and composed of several short basal dendrites and a long apical dendrite. A single axon emerges from the soma, projecting toward the white matter while giving off several collateral stems that further bifurcate and ramify within the neocortex. With few exceptions, pyramidal cells are the only projection neurons of the cerebral cortex (Cajal, 1911; Valverde, 1986; for a review see DeFelipe and Farinas, 1992) and commonly subdivide according to their projection sites. The projection targets of layer V pyramidal cells are correlated to their somatodendritic morphologies, patterns of axonal arborization, and/or electrophysiological properties (Larkman and Mason, 1990; Koester and O’Leary, 1992; Kim and Connors, 1993; Kasper et al., 1994a; Franceschetti et al., 1998; Gao and Zheng, 2004; Larsen and Callaway, 2006; Morishima and Kawaguchi, 2006). Within layer V, pyramidal cells are heterogeneous and project either to the ipsilateral hemisphere, the contralateral hemisphere, or to subcortical targets (Wang and McCormick, 1993; Kasper et al., 1994b). Two major classes of layer V pyramidal neurons have been described. The first class is termed the “thick-tufted” (or “tall-tufted”) type (TTL5), characterized by a thick-tufted apical dendrite. Several oblique dendrites emerge from the main apical dendrite (i.e., “apical trunk”) before bifurcating at a variable distance from the soma to give rise to tuft dendrites, which usually branch extensively in layer I. These TTL5 neurons project to the superior colliculus, spinal cord, and basal pons and tend to discharge bursts of action potentials. The second class is termed the “slender untufted” (or “short”) type, which ends without terminal tuft dendrites and never fires bursts. This class of neurons projects to the ipsilateral hemisphere or to the contralateral hemisphere via the corpus callosum (Chagnac-Amitai et al., 1990; Larkman and Mason, 1990; Mason and Larkman, 1990; Kim and Connors, 1993; Kasper et al., 1994a; Franceschetti et al., 1998; Gao and Zheng, 2004; Morishima and Kawaguchi, 2006; for a review see Molnar and Cheung, 2006).
Dendrites of TTL5 cells run through all cortical layers except layer VI. Different compartments of the neuron (soma; basal, apical trunk, oblique, and tuft dendrites) receive information of various sources from different cortical layers. Excitatory and inhibitory inputs from local sources are commonly received by the soma and basal dendrites. Inputs from more distant cortical and thalamic projections are typically received by oblique and distal tuft dendrites (Petreanu et al., 2009; for review see DeFelipe and Farinas, 1992; Bannister, 2005; Spruston, 2008). Functionally, TTL5 cells display at least two major types of regenerative events based on different dendritic processes. The first type is called a sodium based action potential (Na+-AP) that is initiated close to the soma (i.e., at the initial axonal segment) and propagates back into the dendritic arbor (the backpropagating AP, bAP; Stuart and Sakmann, 1994; Markram et al., 1995). The second type is called a long-lasting calcium-mediated depolarizations (Ca2+-AP) that is initially evoked in distal regions of an apical dendrite by strong distal synaptic input (Amitai et al., 1993; Schiller et al., 1995, 1997; Helmchen et al., 1999) or by a summation of input signals from different tuft branches (Larkum et al., 2009). A number of studies have shown that a bAP can lower the threshold for initiation of a Ca2+-AP, thus enabling TTL5 neurons to couple synaptic inputs from different cortical layers when they coincide within a short time window (Larkum et al., 1999, 2001; Schaefer et al., 2003; for a review see Spruston, 2008). Therefore, the structural compartmentalization enables TTL5 cells to operate as coincidence detectors, which appear critical for cortical information processing.
Different compartments of pyramidal cells are preferentially targeted by different synaptic inputs. For instance, the soma and the axonal initial segment receive only inhibitory γ-aminobutyric acid (GABA)-ergic inputs while dendrites receive both excitatory and inhibitory inputs. Correspondingly, distinct populations of inhibitory interneurons target specific regions of a pyramidal cell (Somogyi and Klausberger, 2005; Silberberg and Markram, 2007; for review, see DeFelipe and Farinas, 1992; Somogyi et al., 1998). Basket cells preferentially target somata, whereas chandelier cells usually target axonal initial segments. Such an arrangement would further refine the compartmentalization of neurons.
Cortical layers are formed in an “inside-out” sequence by neuronal migration along radial glial processes. Neurons generated early on reside in the deepest layer, whereas cells born later on migrate past existing layers to form superficial layers (Miller, 1981; Miller and Peters, 1981; Bayer et al., 1991; for reviews see Nadarajah and Parnavelas, 2002). Pyramidal cells are produced by mitosis in the ventricular germinal zone (between embryonic days E15 and 18 for layer V pyramidal neurons of rats). Following migration in the cortical plate, pyramidal neurons extend an axon toward the ventricle and an apical dendrite toward the pial surface (Miller, 1981; Marin-Padilla, 1992). At P1, axons of pyramidal cells in all layers have reached the vicinity of most targets (i.e., striatum, thalamus, superior colliculus, brainstem, spinal cord, and contralateral cortex; Wise et al., 1979; Kasper et al., 1994b). Meanwhile, layer V pyramidal cells already have a few short, almost spine-free, basal dendrites and, rarely, a few oblique branches on the apical dendrite. The apical dendrite extends to the pial surface and its dendritic branches end in growth cones (Wise et al., 1979). Dendrites of cells in all layers increase in size and branching complexity over the first postnatal week. Basal dendrites develop secondary and tertiary branches and additional oblique branches appear on apical trunks. By postnatal day 14 (P14), all the pyramidal cells have relatively complex, highly branched dendritic trees. Spines also appear on dendrites starting from P4 and quickly increase during this period, but are still not as dense as those in adult animals. Further growth, finer adjustment of dendritic structures and formation of new spines are affected by extrinsic influences such as the projection of afferent fibers (Wise et al., 1979) and input signals originating from environmental stimulations (Butz et al., 2009; Holtmaat and Svoboda, 2009).
The acquisition of mature dendritic morphology may depend on the coordination of a number of extracellular factors. For instance, the semaphorin 3A (Sema3A) is expressed in a gradient throughout the developing cortical plate. It is chemorepellent for axons (Polleux et al., 1998) and chemoattractive for apical dendrites of developing pyramidal neurons (Polleux et al., 2000), making the former grow toward the white matter and the latter toward the pial. Neurotrophins and their tyrosine kinase receptors, the Trks, also play a crucial role in shaping the dendritic arborization (McAllister et al., 1995; Yacoubian and Lo, 2000). They are expressed differentially in cortical layers and trigger distinct, independent responses in basal and apical dendrites (McAllister et al., 1995, 1997). Some endogenous neurotrophins seem to regulate morphogenesis of only basal dendrites. Trk isoforms have distinctive effects on the patterning of different dendritic compartments (Yacoubian and Lo, 2000; for review see McFarlane, 2000; Whitford et al., 2002). Levels of the Trk isoforms change dramatically during development, which may be related to the variation in dendritic growth during different developmental stages (Allendoerfer et al., 1994; Fryer et al., 1996; for a review see McFarlane, 2000). More interestingly, Notch1 induces interactions between neurons by contacting each other, resulting in a mutual restriction of the neurite extension (Qi et al., 1999; Sestan et al., 1999). Thus, the expression of extracellular factors varies depending on the stage of development, the layer location in the cortex, and the growth of neighboring neurons, which subsequently determine the growth of a pyramidal cell.
Numerous studies have been carried out on the structural plasticity of neurons during development using various techniques. These include studies using Golgi staining (Eayrs and Goodhead, 1959; Wise et al., 1979; Miller, 1981; Nicolai, 1981; Petit et al., 1988; Munoz-Cueto et al., 1991; Koenderink and Uylings, 1995), biocytin/fluorescent dye filling (Kasper et al., 1994a,b;Franceschetti et al., 1998; Zhu, 2000; Zhang, 2004; Larsen and Callaway, 2006), and in vivo time-lapse imaging (Wu et al., 1999; Butz et al., 2009; Holtmaat and Svoboda, 2009) to observe developmental alterations of somata, dendrites, and axons. Many molecular mechanisms regulating fine growth and patterning of neuronal structures also start to be revealed (Charych et al., 2006; Zhou et al., 2006; Vizard et al., 2008). However, no quantitative study reports the morphological development of a major cortical neuron type by addressing each compartment of the whole neuron. In the current study, TTL5 cells in the somatosensory cortex were labeled with biocytin during recording using rat brain slices. The TTL5 cells were then reconstructed into 3-D model neurons, which allowed for a detailed quantitative analysis on every neuronal compartment at five postnatal stages from P7 to P60. Multiple parameters were obtained from different neural domains (soma, basal dendrites, apical dendrites, oblique dendrites, tuft dendrites, and axons) as well as dendritic spine and axonal bouton densities. We found that all compartments of a TTL5 cell undergo different developmental changes, supporting the notion that multiple functional compartments receive different inputs and may integrate distinct signal transduction systems. Potential correlations between morphological alterations during development and molecular pathways, and synaptic circuitries are also discussed.
All experimental procedures were carried out according to the Swiss federation guidelines for animal experimentation. Male Wistar rats aged of postnatal day (P) 7, P14, P21, P35–P37 (simplified as P36) and P58–P61 (simplified as P60) were used. Pups were weaned between P22 and P25 and housed (usually by 2–3/cage) under standard laboratory conditions. After decapitation and brain removal, the cerebellum was removed and two hemispheres were split in artificial cerebrospinal fluid (ACSF). The right hemisphere was used for slicing while the left one was weighted after subcortical parts were carefully removed and the left ACSF was dried with a piece of filter paper. As previously described (Markram et al., 1997; Gupta et al., 2000), cortical-slices (sagittal; 300 μm thick) were sectioned on a vibratome (Sigmann Elektronik, HR-2, Heidelberg, Germany) filled with iced ACSF (millimolar): 125 NaCl, 2.5 KCl, 25 glucose, 25 NaHCO3, 1.25 NaH2PO4, 2 CaCl2, and 1 MgCl2, bubbled with 95% O2 and 5% CO2. Typically, a section with visible blood vessels parallel to slice surface has apical dendrites and main axonal stems of pyramidal cells also parallel to the slice surface. In the rat somatosensory cortex, sections with such parallel planes were obtained between 1.5 and 2.40 mm lateral to the midline. Slices were transferred to a submerge-type chamber where they were continuously exposed to ACSF at 32–34°C, saturated with 95% O2 and 5% CO2. Neurons were identified using IR-DIC microscopy as previously described (Stuart et al., 1993). Pyramidal neurons, recognized by their largest somata and apical dendrite apex, were selected for patch-clamp recording from all levels of lamina V (Va and Vb) of the primary somatosensory cortex (S1HL and S1Tr, Figure 1A) at depths between 30 and 90 μm below the cutting surface of the slice. Somatic whole-cell recordings (pipette resistance-5–12 MΩ) were employed to obtain electrophysiological properties and to label recorded neurons by biocytin diffusion. Pipettes were filled with intracellular solution, containing (millimolar): 110 potassium gluconate, 10 KCl, 4 ATP-Mg, 10 phosphocreatine, 0.3 GTP, 10 Hepes (pH 7.3, 300 mOsm, adjusted with sucrose), and 0.5% biocytin (Sigma).
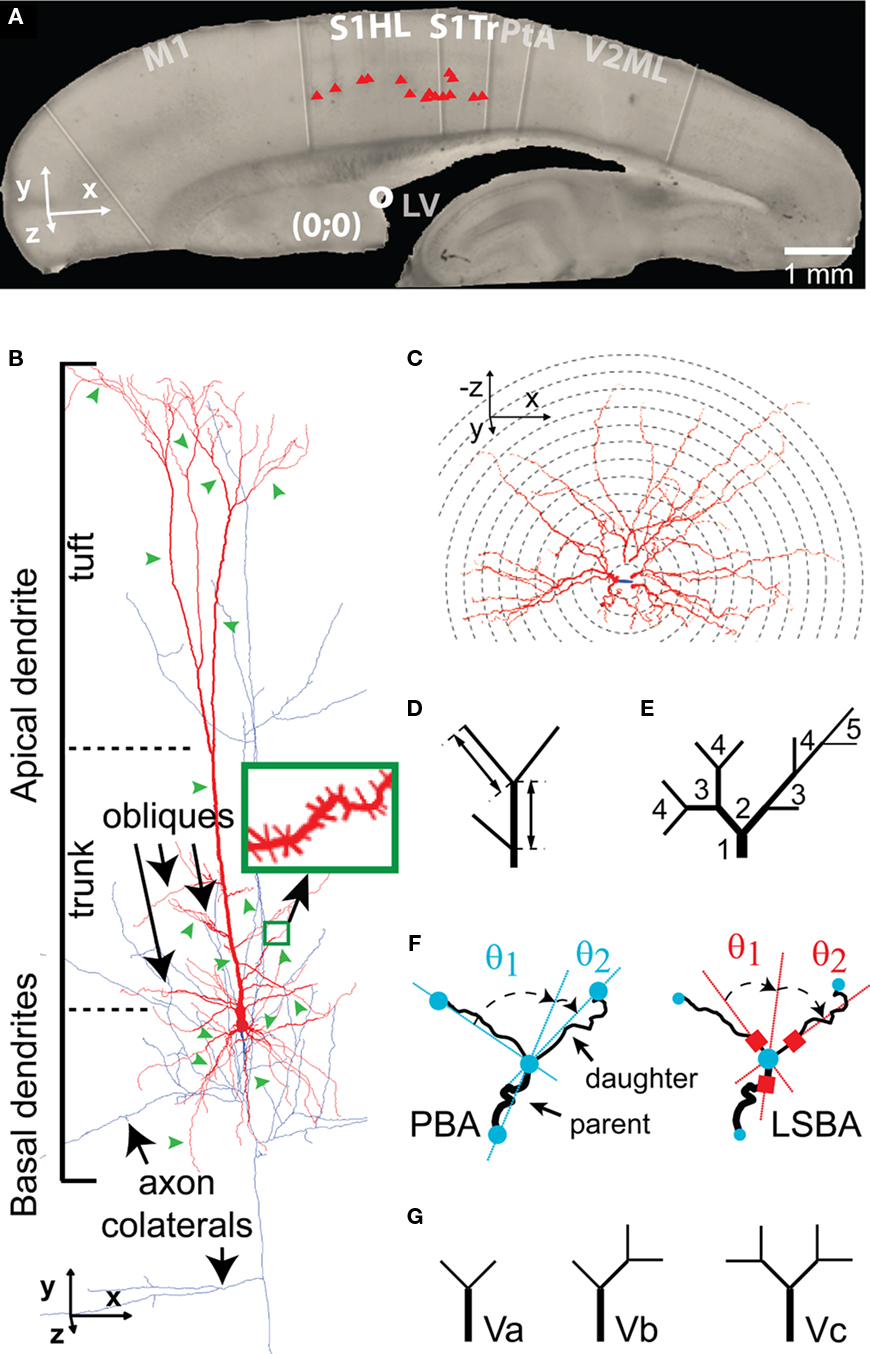
Figure 1. Morphometric analysis of TTL5 neurons. (A) The picture of a typical sagittal slice used for cell recording (here at P14), showing positions of somata (red triangles) of P14 TTL5 cells reconstructed in this study. Neurons at all ages were selected at similar positions, i.e., in the S1HL and S1Tr areas. The superior rostral part of lateral ventricle (white circle) was found in all slices and used as a reference point. S1HL and S1Tr, hindlimb, and trunk regions of primary somatosensory cortex, respectively. Scale bar, 1 mm. (B) Neurolucida reconstruction of a TTL5 neuron with depiction of different neuronal compartments. Note dendrites in red and axon in blue. Green arrowheads illustrate segments randomly selected for spine reconstruction (green inset). (C–G): Different morphometric methods used. (C) Sholl-like analysis. Serial spheres with stepped radii were centered at the soma. Numbers of intersections with each sphere were counted and graphed as a function of distance to the center. (D) Segment length. Length of a segment was measured between two neighboring branch points (intermediate) or between a branch point and an end point (terminal). (E) Centripetal order. Representing the frequency of branching, one order increases following each branch point starting from a stem segment (i.e., the first order segment emerged from the soma or the apical trunk). (F) Branch angles formed between a parent segment and daughter segments. Planar Branch Angle (PBA, Left Panel): angles formed between the distal extending portion of a line passing through the beginning and the ending of a parent segment and the lines passing through the beginning and endings of daughter segments. Local Spline Branch Angle (LSBA, Right Panel): angles formed between the distal extending portion of a line passing through the straight segment portion before the branch point and two lines passing through the straight segment portions after the branch point. (G) Vertex analysis. Terminating vertices were classified based on the pattern of branching at vertices. Three vertice patterns were defined: Va, two terminating branches were bifurcated at a branch point; Vb, one terminating branch was attached to a branch point with an intermediate branch; Vc, zero terminating branch, instead, two intermediate branches were attached to a branch point.
After recording, slices were fixed in 0.1 M phosphate buffer (PB, pH 7.4) containing 4% paraformaldehyde, 1% glutaraldehyde, and 0.3% saturated picric acid. Thereafter, slices were rinsed several times in PBS. Endogenous peroxidases were blocked with 3% H2O2-PBS for 30 min. After several rinses in PBS, slices were permeabilized by immersion in 0.1% Triton X-100-PBS (30 min to 2 h), and were incubated overnight at 4°C in biotinylated horseradish peroxidase conjugated to avidin according to the manufacturer’s protocol (ABC-Elite, Vector Labs, Burlingame, CA, USA): 2% A, 2% B, and 0.1% Triton-100. Following incubation, sections were washed several times in PBS and Tris–HCl and developed with 3,3′-diaminobenzidine (DAB tablets, Sigma, 0.07%) under visual control until all processes of the cells appeared clearly visible (usually after 2–5 min) and mounted in aqueous mounting medium (IMMCO Diagnostics, Inc). TTL5 neurons chosen for 3-D reconstruction were those that were fully and strongly stained with a few cut branches of basal and apical dendrites.
Three-dimensional model neurons were reconstructed from well-stained neurons using the Neurolucida system (MicroBrightField Inc, USA) and a bright-field light microscope (Leica DMRB, Wetzlar, Germany) at a magnification of 100× (oil immersion objective, 1.4–0.7 NA). The finest line traced at the 100×-magnification with the Neurolucida Program is 0.15 μm. Only thick-tufted neurons without any graded loss of staining were selected according to a large tuft dendritic tree spreading in layer I. Spines were marked on selected segments that represent different dendritic branch orders. The selected segments were those where spines could be clearly distinguished (usually close to the cutting surface of a slice). The slice shrinkage due to staining procedure was ∼25% in thickness and ∼10% anisotropic along the X- and Y-axes. Only the shrinkage of thickness was corrected.
A battery of morphological parameters were measured from 64 fully reconstructed cells and 106 reconstructed somata, using Neurolucida, Neuroexplorer, and home-made Matlab programs, to extract features of the development of different neural compartments. Terms used in this study are defined as the following: The basal and apical dendrites descend from the base and ascend from the apex of the soma, respectively (Figure 1B). The apical dendrite has a trunk, from which oblique dendrites emerge before bifurcating to form a tuft dendrite. A segment is the portion between two branch points or between a branch point and an end point or a starting point from soma. A stem segment is a segment that emerges from a soma or an apical trunk (i.e., the initial segment of a basal/oblique/dendritic/axonal tree). Intermediates include all segments except terminals that end in a tip. The path length is a distance along dendritic segments from soma for a basal dendrite or from the trunk for an oblique dendrite. The maximal reach (max. reach) is a radial distance from the soma center to the furthest dendritic tip, which indicates the extent of dendritic field. In general, a maximal reach is shorter than its corresponding maximal path length.
Most parameters were obtained using Neuroexplorer with a few exceptions. Soma height and width were measured directly under light microscope at a magnification of 40× using Neurolucida. “Sholl-like” analysis (Figure 1C) on basal and apical dendrites was done using “Sholl Analysis” in Neuroexplorer (centered at cell body; Sholl, 1956). Lengths and diameters of individual segments were analyzed using Segment Analyses in Neuroexplorer and a home-made Matlab program. Segments were grouped according to their types, intermediates, or terminals (Figure 1D), as their lengths and diameters differ significantly (Hillman, 1979; Uylings et al., 1986). The intermediate and terminal segments were subdivided according to their centripetal order. The centripetal ordering system designates dendritic stems leaving the cell body (basilars) or the apical trunk (obliques) as first-order branches. Each subsequent bifurcation results in two branches of a higher-order (Figure 1E). Incomplete segments (i.e., segments cut off at the surface of the section or running into a dense precipitation) were excluded from the analysis of individual segment length, but included in total length. Branch angles of dendrites and axons were analyzed in two ways (Figure 1F): The planar branching angle (PBA) describes the change in direction from one parent branch to daughter branches, emphasizing the overall structure of the tree; The local spline branching angle (LSBA) describes the change in direction using the line segments closest to the branch point, focusing on the local site around a branch point but disregarding the overall structure of a tree. A vertex analysis was performed on apical dendrite and tuft, which classifies branch points on the connectivity at vertices (connection points for branches). Branch points were assigned as Va, Vb, and Vc respectively according to 2, 1, and 0 terminating segments attached to that branch point following bifurcation (Figure 1G). The number of these different types of branch points was counted. Intact basal dendritic trees, which were not cut at the slice surfaces, were carefully selected. The length distributions of terminal segments of these intact trees were analyzed. Spines were assessed by spotting a marker for each spine, assigned to the corresponding segment. The spine density was calculated as the ratio between the total number of markers and the total length of dendritic segments. Effort was made to present spine densities of individual branching orders within each compartment. Spine densities on different branching orders were analyzed using Segment Analysis in Neuroexplorer and a home-made Matlab program. No correction was made for spines obscured by dendritic shafts (Feldman and Peters, 1979; Larkman, 1991a). Boutons were assessed by spotting another marker for each bouton. The bouton density was calculated as the ratio between the total number of the markers and the total length of axonal segments. According to the maximal diameter, boutons were subjectively sub-classified into small (0.2–0.7 μm) and large (1.0–1.8 μm) subtypes.
The statistical analyses were performed using Mann–Whitney U-test in Matlab. P-values were corrected in the R statistical software for multiple comparisons with the “fdr” method. The significant level was defined at P ≤ 0.05 for all comparisons. Significant differences were shown only to the comparisons between the “closest” ages (for example, if P7 < P14 and P21, only P7 < P14 is noted; if P7 and P14 < P21, only P14 < P21 is noted), except for the comparison between P21 and P60. The analyzed data were shown as mean and standard error.
Hemisphere weight was measured from 61 male Wistar rats ages P7 to P60 (young adult). Seventy-seven brain slices were used to measure cortical dimensions (P7, 13 slices from 12 rats; P14, 13, 10; P21, 9, 7; P36, 19, 16; P60, 23, 16). TTL5 neurons in the primary somatosensory cortex were recorded with patch-clamp electrodes and filled with biocytin. Well-stained cells were reconstructed into 3-D model neurons (n = 64 cells; P7, 9 cells; P14, 15; P21, 15; P36, 13; P60, 12), which enabled a detailed morphometrical analysis with accuracy. Studied compartments of TTL5 neurons include somata, basal dendrites, apical trunks, oblique dendrites, tuft dendrites and entire apical dendritic tree as well as axonal arborization (Figure 1B). Developmental changes of TTL5 neurons were studied with multiple parameters (Figures 1C–G, also see Materials and Methods).
Hemisphere weight, rostro-caudal cortical length, neocortical thickness, and neocortical–callosal thickness were measured from animals at different ages (Figure 2). Cortical measures were taken from 1.5 to 2.4 mm (depending on age) midline-remote sagittal sections after fixation (Figure 2A). Thicknesses were measured at the level of the superior rostral region of the lateral ventricle in all sections (red circle, Figure 2B). Hemisphere weight, rostro-caudal cortical length, neocortical thickness, and neocortical–callosal thickness logarithmically increased from P7 to P60, with a major growth of 50, 66, 76, and 54%, respectively, of the total increase from P7 to P14 (Figures 2C–F). Subsequently, these measurements continued increasing until the adult stage (P60) at a significantly lower rate, with the exception of the neocortical thickness. The latter did not show further significant change until P60 (Figure 2F, Δy1). A developmental constant was calculated for each of these anatomical parameters by fitting the data points from P7 to P60 with logarithmic functions (Figures 2D–F, red curves). This constant represents the time taken for each parameter (with origin at P7) to reach 63.2% of its final (asymptotic) value (in days: 12.15 ± 2.03; 8.53 ± 0.71; 4.83 ± 0.68; 9.27 ± 0.95, respectively). The hemisphere weight increased 2.6-fold from P7 to P60 and already 1.8-fold from P7 to P14 (69% of adult value at P14; 80% at P21). The weight increase was however still statistically significant from P21 to P36 and from P36 to P60 (Figure 2D). The rostro-caudal cortical length increased 1.61-fold from P7 to P60, reaching 84% of the adult length by P14 and 90% by P21 (Figure 2E). In contrast, the neocortex showed early growth, almost reaching adult thickness by P14 (93% of the value at P60). In fact, the neocortex increased only by 1.39-fold from P7 to P14 (Figure 2F, Δy1), suggesting that most of the neocortex develops even before P7. The neocortical–callosal thickness was also close to adult values at P14 (86%) and reached the adult level at P36 (98%; Figure 2F, Δy2). These results revealed a continuing expansion of the hemisphere with an earlier maturation in the neocortical thickness at P14.
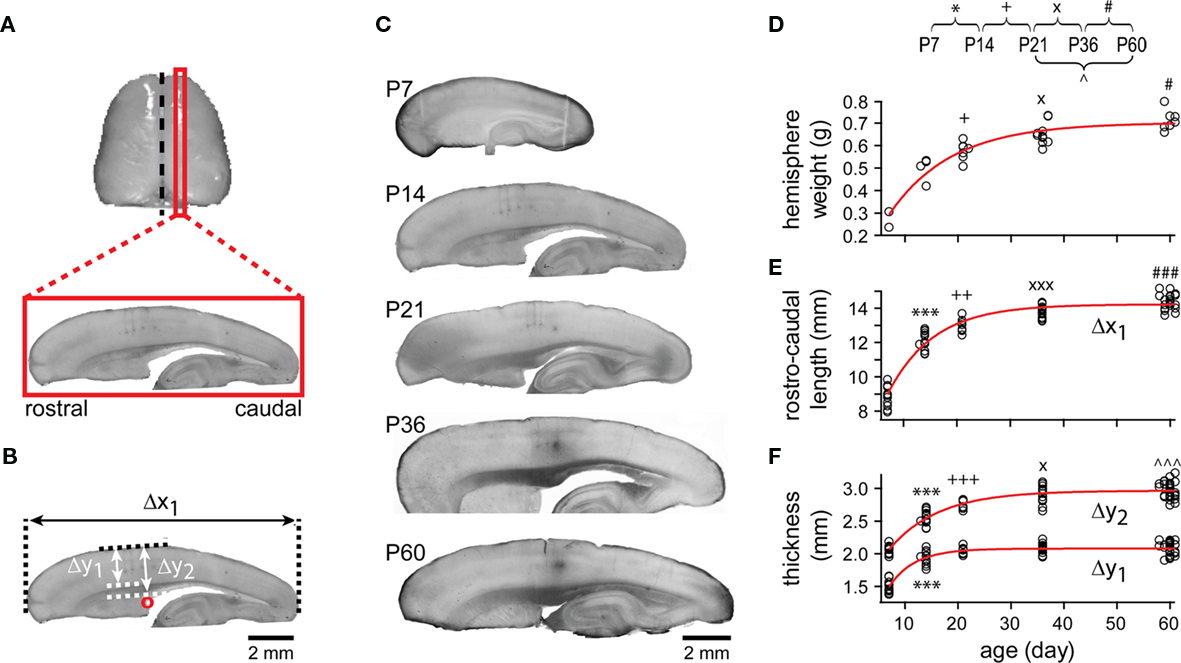
Figure 2. Gross anatomical development. (A) Typical sagittal slices were cut at the cortical region 1.5–2.4 mm from midline (black dashed line). (B) The rostro-caudal cortical length (Δx1) was the maximal length of a section along the rostro-lateral axis. The neocortical thickness (Δy1) was measured vertically between pial and white matter, and the neocortical–callosal (neocortex + corpus callosum, Δy2) thickness was measured vertically from pial to the level of superior rostral part of lateral ventricle (red circle). Scale bar, 2 mm. (C) Representative pictures of sagittal slices at different ages. Scale bar, 2 mm. (D) The weight of all individual cerebral hemispheres examined was plotted as a function of animal age (P7: n = 3, P13–P14, simplified as P14: n = 3, P21–P22, simplified as P21: n = 7, P35–P37, simplified as P36: n = 10, P59–P61, simplified as P60: n = 7). The points were fitted with a single exponential line (red) of length constant (the time taken for each parameter to reach 63.2% of its final value from P7): 12.15 ± 2.03 days. For (E–F), the same conventions are shown as in (D). (E) Rostro-caudal cortical length (P7: n = 11, P14: n = 12, P21: n = 8, P36: n = 14, P60: n = 22). Length constant of exponential fit: 8.53 ± 0.71 days. (F) Neocortical thickness (Δy1) and neocortical–callosal thickness (Δy2; for both Δy1 and Δy2, P7: n = 13, P14: n = 13, P21: n = 8, P36: n = 15, P60: n = 28). Length constant of exponential fits: Δy1, 4.83 ± 0.68 and Δy2, 9.27 ± 0.95 days. Note, for this and subsequent figures, symbols representing statistical significance between ages: *, P7 and P14; +, P14 and P21; ×, P21 and P36; #, P36 and P60; ∧, P21 and P60. Significant levels: 1 (e.g., *), 2 (e.g., **), 3 (e.g., ***) symbols denote 0.01 < P < 0.05, 0.01 < P < 0.001, P < 0.001, respectively.
Somata were subjectively classified into three formats according to shape: triangular, round, and oval (Figure 3A). Although three shapes were found at all ages, somata of TTL5 neurons appeared to be mostly either triangular or round (44% for both, n = 40) at P7 and predominantly triangular thereafter (75 ± 4% triangular somata, n = 50). Somata increased markedly from P7 to P14 in surface area (1.7-fold), height (1.33-fold), and width (1.24-fold; Figures 3B,C). The growth then became slower but still statistically significant in height (1.17-fold) and surface area (1.12-fold) from P14 to P21 by which time the adult size was virtually formed (Figure 3C).
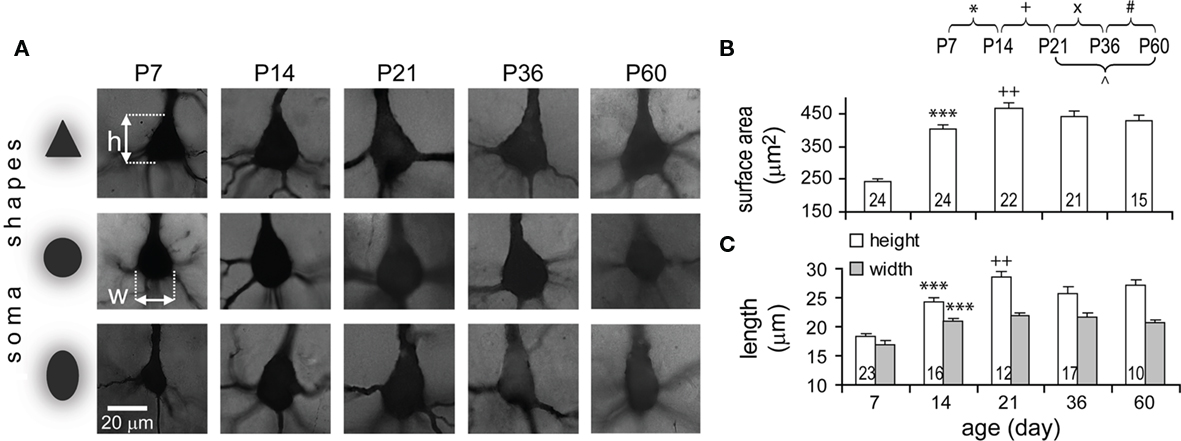
Figure 3. Developmental changes in TTL5 neuronal somata. (A) Representative pictures of somata of different shapes at each age examined. h, height, w, width. (B–C) Developmental changes in surface area, height (white bars), and width (gray bars) of somata. From P7 to P14, all three parameters significantly increased. From P14 to P21, the height and surface area, but not the width, significantly increased. Same cells were used for height and width measures. Note, for this and subsequent figures, numbers in bars of column graphs indicate the numbers of analyzed cells and error bars are SEs.
Throughout the developmental periods studied, significant changes were not detected in parameters crucial for the general structural frame of TTL5 neurons. These parameters include: the numbers of dendritic and axonal stems, the branching angles of both dendrites and axons (Figure A1 in Appendix), the structural ratio of apical dendritic compartments, and the average thickness of apical trunks at individual branching orders (Figure A2 in Appendix). The lack of change in these measurements suggests that the general structural frame of a TTL5 neuron has been well differentiated at P7. On the other hand, further growth of TTL5 neurons is evident in the quantitative morphometric analyses described below.
Dendritic arbors of TTL5 neurons expanded rapidly from P7 to P14 as evidenced by the increase in total length of basal (2.42-fold) and apical (1.47-fold) dendrites, which reached 70 and 88% of the adult length, respectively (Figures 4A,B1). While the total number of basal dendritic segments remained unchanged during this period, the total number of segments of an apical dendritic tree significantly decreased (Figure 4B2). This suggests that an abundance of apical segments existing at P7 were subsequently pruned. This decrease in the number of apical segments did not significantly affect the total length (Figure 4B1), inferring that those pruned segments must be very short segments such as filopodia. Changes became subtle after P14. Total basal dendritic length remained relatively constant at P21 and P36, and then increased further until P60 (Figure 4B1). This later increase could be due to an addition of segments before adulthood (Figure 4B2, see below).
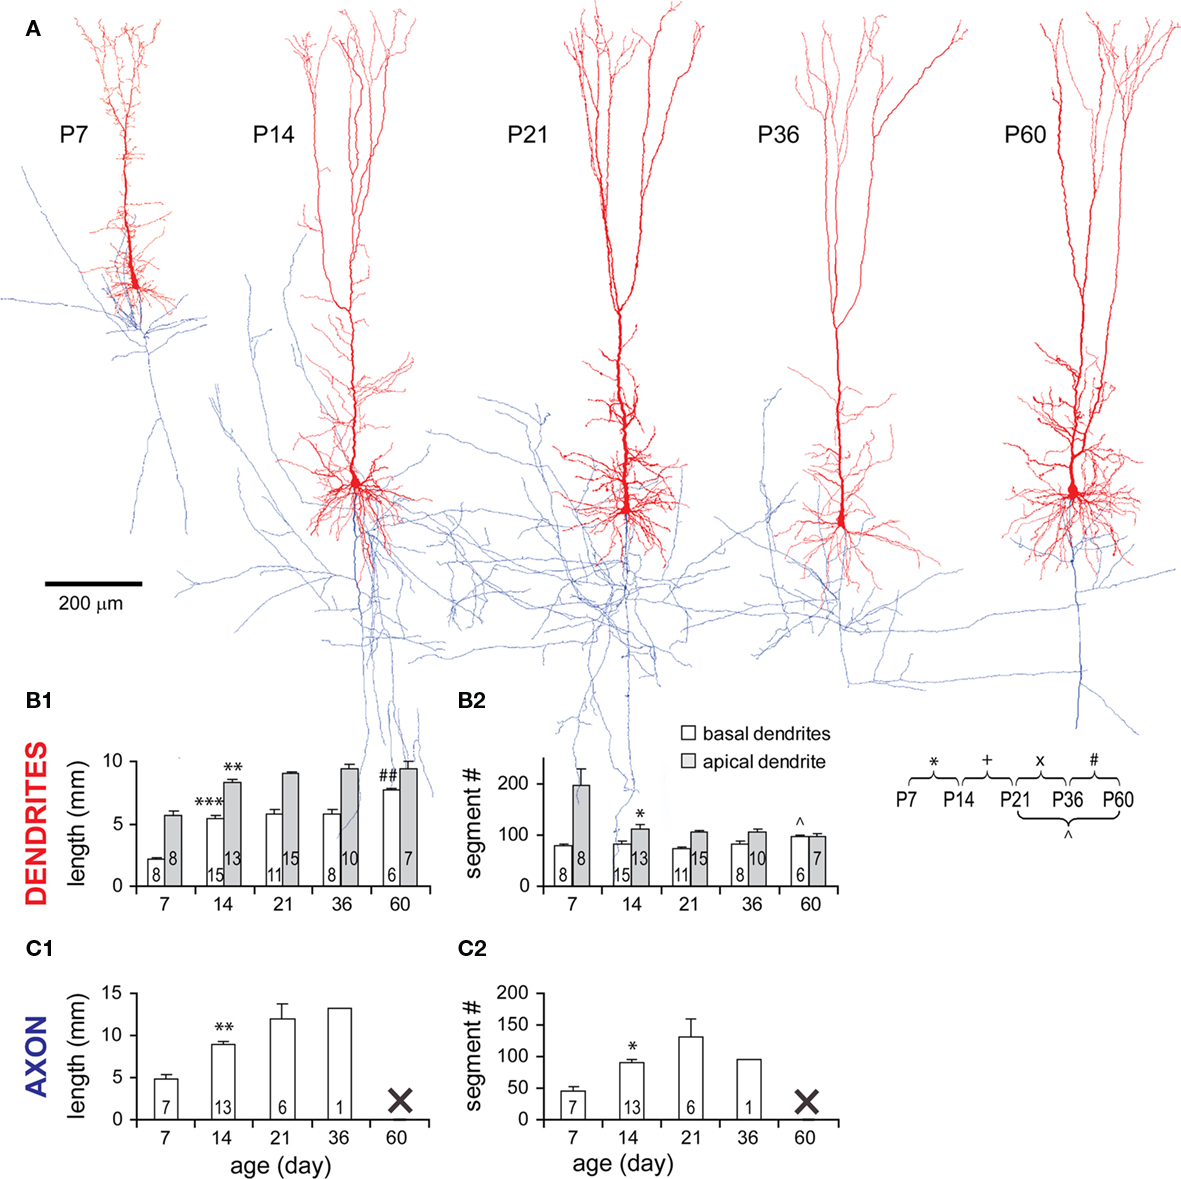
Figure 4. General morphological changes of TTL5 neurons during development. (A) Representative 3-D model neurons reconstructed from biocytin-labeled neurons at all ages examined (dendrites in red, axons in blue). Scale bar, 200 μm. (B1) Total length of both basal (white bars) and apical (gray bars) dendrites significantly increased from P7 to P14. Only the total length of basal dendrites further increased from P36 to P60. (B2) Total number of apical dendritic segments significantly decreased from P7 to P14. From P21 to P60, there was a significant increase in the total number of basal dendritic segments. (C1) Total axonal length significantly increased from P7 to P14. (C2) Total number of axonal segments significantly increased from P7 to P14. Note that the data for the axons of neurons at P36 and P60 are insufficient for the analyses of total length and segment number. This is because axonal collaterals in slices from P36 and P60 rats were often invisible at deep focusing levels under LM.
Axonal arbors of TTL5 neurons also expanded rapidly from P7 to P14 as evidenced by the increase in total length (1.85-fold) and segment number (1.95-fold) of an axon tree (Figures 4C1,C2). Unfortunately, frequently faint staining of axonal collaterals at older ages restricted the detailed analysis of axons.
Basal dendrites grew rapidly from P7 to P14 (Figures 5A,B) expanding the radial reach by 1.7-fold and the path length by 1.9-fold, equivalent to ∼85% of the adult values at P60 (radial reach: 284 ± 51 μm, range 224–368 μm; path length: 316 ± 57 μm, range 250–413 μm). An additional increase from P14 to P21 was also significant (Figure 5B). Both maximal radial reach and path length kept similar developmental trends and similar ratios, suggesting that the growth of basal dendrites is radial and that the tortuosity of segments is unchanged. A Sholl-like analysis revealed a Gaussian form of dendritic intersection distributions with a round peak and a prolonged decline in distal ones at all ages studied (Figure 5C). The distance of maximum intersections increased by 47% from P7 to P60 (Figures 5C,D). The peak density of dendritic intersections laid around 40 μm from the soma at P7, and was shifted to around ∼100 μm at P60. The total number of intersections displayed two markedly developmental jumps: one from P7 to P14 (170 ± 17 to 411 ± 77) and the second from P36 to P60 (460 ± 83 to 593 ± 43; Figure 5E). The former jump indicates the expansion of dendritic clusters as evidenced by the increase in maximal radial reach and path length and a significant peak shift of Gaussian-shape intersection distributions (Figures 5B,C). The latter jump indicates the emergence of new segments due to the fact that the shapes of intersection distributions remained similar while total intersection number and intersection numbers at most mid-range distances significantly increased (Figures 5C,E).
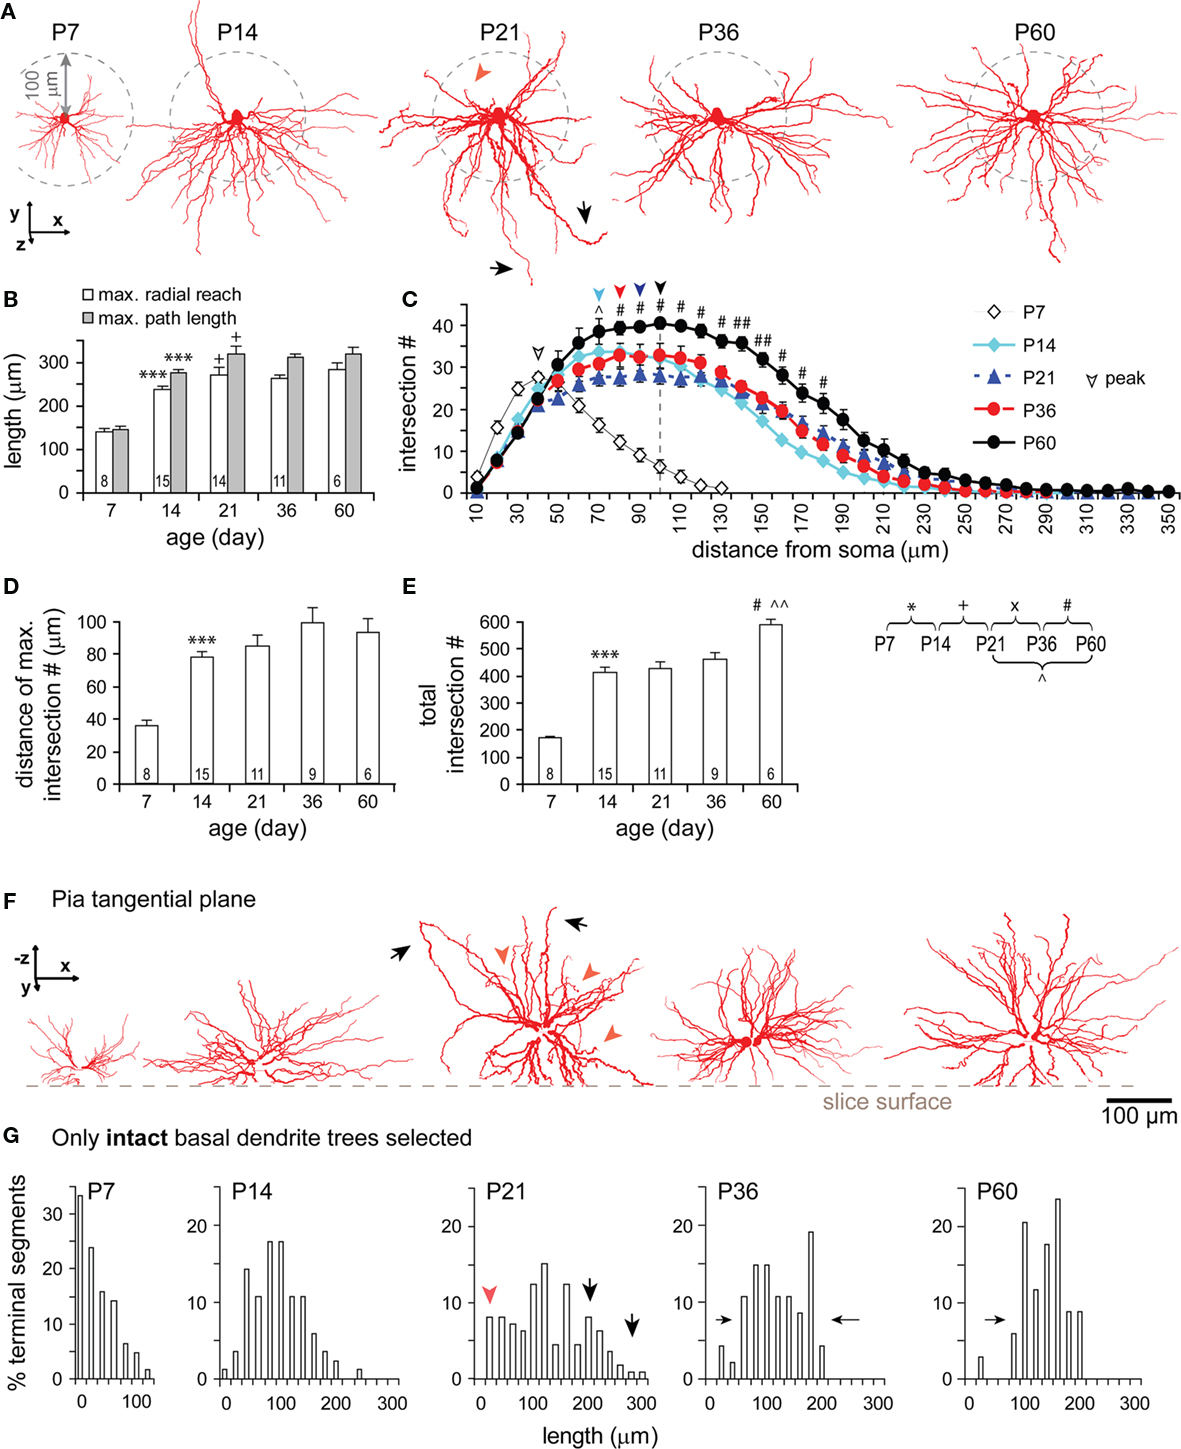
Figure 5. Developmental changes in the morphology of basal dendrites. (A) Representative reconstructions of basal dendrites in sagittal view from all ages examined. Note the rapid growth of the dendritic field between P7 and P14, an extension of a few long branches at P21 (black arrow heads), the appearance of a denser dendritic field with more homogeneous arborization surrounding the soma at P60. (B) Development of maximal radial reach (white bars) and path length (gray bars). Same cells were used for both radial reach and path length. Significant increases in both measures were from P7 to P14 and from P14 to P21. The ratio between the two measures appeared always similar over the five developmental stages, seemingly forming a peak at P21. (C) Sholl-like analysis. The intersection number within serial spheres of 10 μm-stepped radii centered at soma was plotted as a function of radial distance from soma. Two major changes are clearly shown: The peak of the intersection curve lying around 40 μm at P7 was shifted close to 100 μm at P21 and kept around there until P60 (noted with a dash line); The curve dome was significantly raised up from P36 to P60. (D) The distance of maximal intersection number (radius of sphere where the number of intersections is maximal) significantly increased from P7 to P14. (E) The total number of intersections (at all spheres) significantly increased at different periods (from P7 to P14, from P21 to P60, and from P36 to P60). (F) Representative reconstructions of basal dendrites viewed from the pial surface showing the cut of dendrites (same cells as above in sagittal view in A). Note at P21, in both views, the concurrent presence of short (red arrowheads) and exceedingly long (black arrows) branches. (G) The percentage (%) of intact terminal segments as a function of their lengths over different ages (P7: n = 4 cells, 63 terminal segments; P14: 6, 84; P21: 11, 112; P36: 5, 47; P60: 3, 34). Note the distribution kept changing following development, featured with high percentages of short segments at P7, a symmetrical distribution centered around 100 μm at P14, broader distribution with more short (20–40 μm, red arrowhead) as well as long (200–320 μm, black arrows) lengths at P21, gradually narrowed distributions at P36 and P60. Scale bars, 100 μm.
To better examine the developmental change, intact trees of basal dendrites were selectively analyzed (Figures 5F,G). At P7, a peak was displayed at the short lengths of terminal segments, and the maximal length was shortest compared to those at older ages. These results represented the small dendritic clusters of TTL5 cells at this age. By P14, a bell-shape distribution of segment lengths formed a peak around 100–120 μm. The distribution became much broader at P21 with a lowered peak at medium-length segments (40–160 μm) and higher percentages of both shorter (20–40 μm, red arrowheads) and longer segments (180–320 μm, black arrows; Figures 5A,F,G, P21). These changes could be due to a retraction of some segments and a simultaneous lengthening of others since there was no change in the total length (see Figure 4B1) and no new segments appeared (see Figure 4B2) between P14 and P21. From P21 to P60, both total length and number of dendritic segments increased (Figures 4B1,B2). More specifically, the new segments probably emerged between P36 and P60, accounting for the increase of intersections at distances 90–190 μm from the soma (Figure 5C). Toward adulthood, terminal segments tended to have equal projecting distances as revealed by the narrower range in their lengths (Figure 5G, P36, P60). The disappearance of those short and long lengths once again indicates the co-occurrence of the elongation of some of the shortest terminals and the retraction of some of the longest ones.
Intermediate and terminal segments of basal dendrites were further analyzed and compared. In general, terminal segments are longer than intermediate ones at all ages (Figures 6A,B; P < 0.001, P7; P < 0.0001, P14; P < 0.001, P21; P < 0.001, P36; P < 0.01, P60). Both intermediates and particularly terminals were lengthened from P7 to P14 (by 1.90-fold and 2.40-fold respectively). This earlier increase in length occurred in most intermediate branches that were centripetal to soma (at the first–third orders, Figure 6C1), and in almost all terminals at various branching orders (Figure 6C2). Intermediates then remained constant at lengths of ∼25–30 μm (Figure 6B). In contrast, terminals showed significant growth at the third and fourth orders from P14 to P21 and at the fourth order from P36 to P60 (Figures 6B,C2).

Figure 6. Developmental changes in the branching pattern of basal dendrites. (A) Dendrogram of basal dendritic trees of representative cells from all ages examined. The number of tips of each tree was indicated to the right. The segment length was scaled according to real length, but the thickness was not scaled. (B) Average lengths of intermediate and terminal segments versus age (P7: n = 8, P14: n = 15, P21: n = 11, P36: n = 8, P60: n = 6). Intermediates were significantly lengthened from P7 to P14 and thereafter remained constant. Terminals were significantly lengthened from P7 to P14 and from P14 to P21. (C1) The intermediate segment length significantly increased on the first to third orders from P7 to P14. (C2) The terminal segment length significantly increased on the second to sixth orders from P7 to P14, on the third and fourth orders from P14 to P21, and only on the fourth orders from P36 to P60. (D) Average diameters of intermediate and terminal segments versus age [same cells as in (B)]. Before reaching a constant level, a significant increase in thickness was tested from P7 to P14 and from P14 to P21 in intermediates and from P7 to P14 in terminals. (E1) The intermediate segment diameter significantly increased on the first to third orders from P7 to P14 and from P14 to P21. (E2) The terminal segment diameter significantly increased on the second to sixth orders from P7 to P14. (F) Average number of intermediate and terminal segments versus age [same cells as in (B)]. A significant increase in the total segment number was tested between P21 to P60. (G1) The intermediate segment number significantly increased on the fourth orders from P7 to P14, on the fourth and fifth orders from P21 to P60, and on the fifth order from P36 to P60. (G2) The terminal segment number significantly increased on the sixth orders from P21 to P60, which is also significant from P36 to P60.
In a similar pattern, terminal segments were thinner than intermediate ones at all ages (Figure 6D; P = 0.007, P7; P = 0.027, P14; P = 0.016, P21; P = 0.014, P36; P = 0.046, P60). There was also an earlier increase in thickness for both intermediates (1.22-fold) and terminals (1.53-fold) between P7 and P14 (Figure 6D). The thickening change occurred in those intermediate and terminal branches that had an early increase in length (Figures 6C1,C2,E1,E2). Alternatively, the thickness of terminals remained relatively constant for all subsequent developmental stages (Figures 6D,E2), whereas the thickness of intermediate segments continued to increase until P21 before reaching a constant level (Figures 6D,E1).
Interestingly, there was a significant increase in the total number of both intermediate and terminal segments from P21 to P60 (Figure 6F). This later increase in segments was significant at higher-orders, the fourth–fifth orders of intermediates and the sixth order of terminals (Figures 6G1,G2). This continuous order sequence suggests that new terminal segments may bifurcate from some pre-existing terminals, which then became higher-order intermediate segments. This increase in segment number was consistent with the later increase in the total length and segment number (Figures 4B1,B2) as well as in the total intersection number of basal dendrites (Figure 5E).
Apical dendrites at P7 are characterized by numerous short and thin filopodia-like branchlets dispersed along each segment (Figures 7A, P7). These filopodia disappeared by P14, which is clearly shown in the analysis of apical dendritic vertices (Figure 7B). Meanwhile, the apical dendritic maximal reach increased to 92% of the adult value (Figures 7A,C). Lengths of apical dendritic trunks were highly variable for all ages (Figure 7D). In view of the fact that the length of an apical trunk is a key parameter for the identification of different TTL5 subtypes (Wang et al., 2006), the early appearance of apical trunk length diversity suggests that subtypes of TTL5 neurons have already differentiated at very young ages.
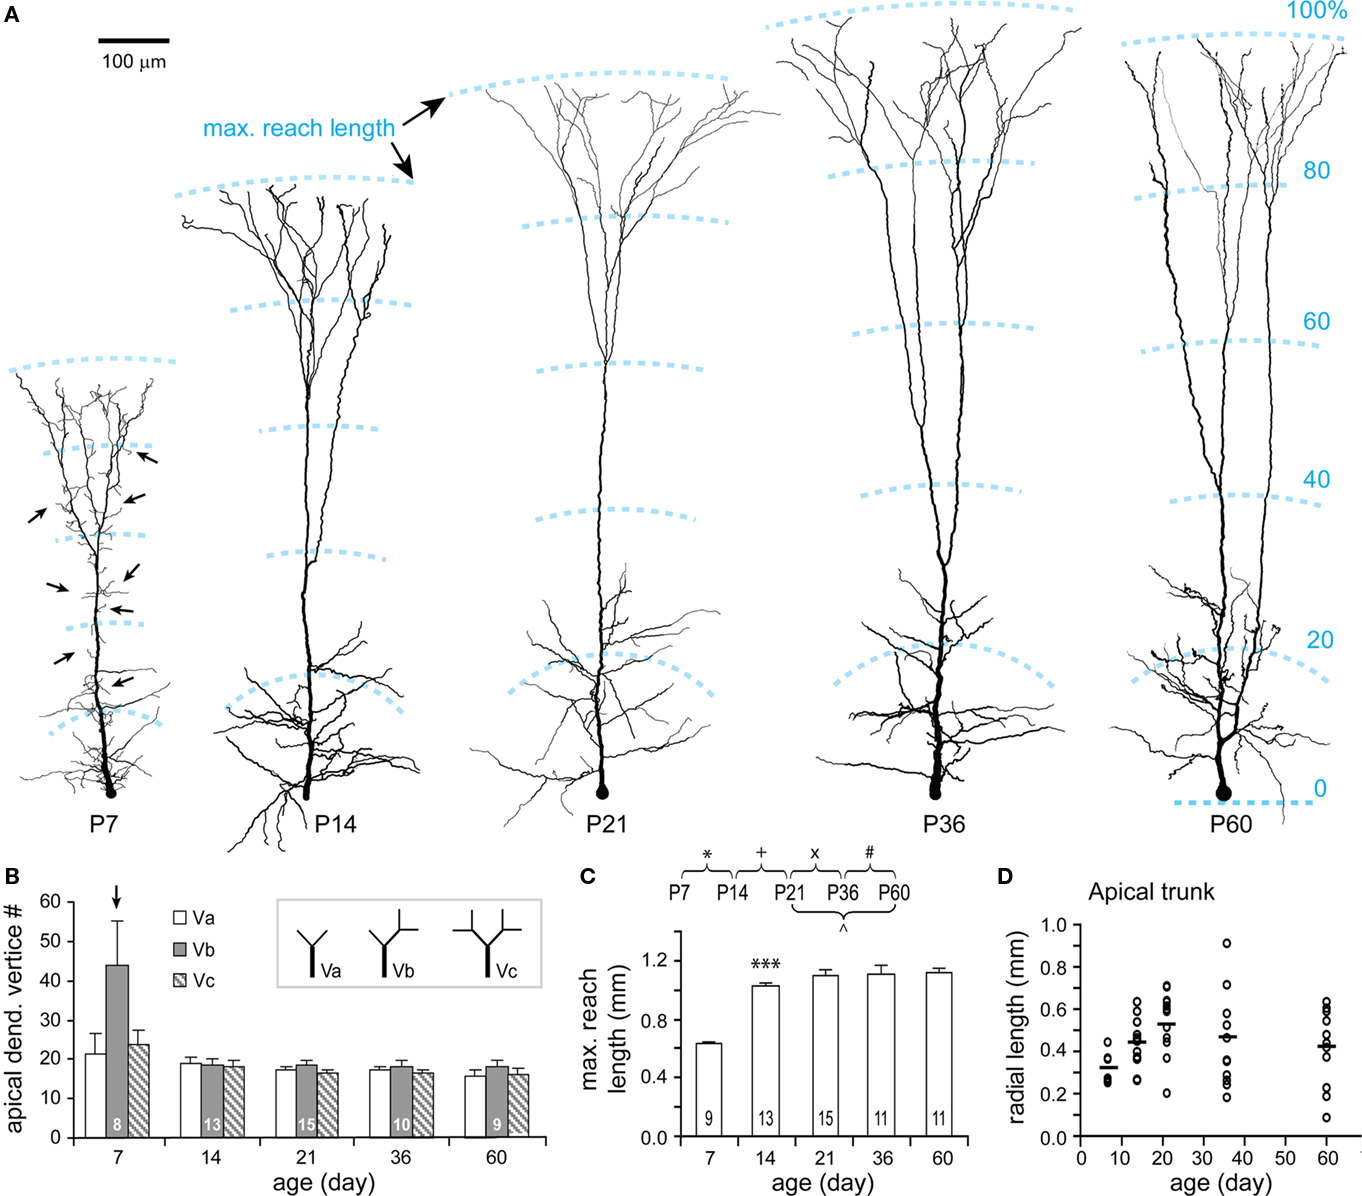
Figure 7. Developmental changes in the morphology of apical dendrite. (A) Representative reconstructions of apical dendrites from each age examined. Note the rapid growth of apical dendrites and the disappearance of filopodia-like branches (arrows) along the apical dendrite from P7 to P14. The structural frame kept similar over all ages with obliques distributed in the approximate 30% and tufts in the distal 20–30% of the maximal reach length. Scale bar, 100 μm. (B) Vertex analysis. A tendency to have more “Vb” vertices was presented at P7. Otherwise, there were no significant changes in the three types of vertices through all ages. (C) The maximal reach length of apical dendrite significantly increased from P7 to P14, and thereafter remained constant. (D) The radial length of apical trunk (from the soma to the first tuft bifurcation) showed a large variation at each age (empty circles, P7: n = 8, P14: n = 15, P21: n = 15, P36: n = 13, P60: n = 12; horizontal bars: mean values).
Oblique apical dendrites emanated from the apical trunk at varying angles across all ages. Although apical dendrites grew, oblique dendrites remained close to only 30% of the maximal apical length (Figure 7A, Figures A2A,B in Appendix). Compared with basal dendrites, oblique dendrites also expanded most significantly from P7 to P14, virtually reaching the adult level in the total length, the maximal path length, the total number of segments and the number of oblique stems (Figures 8A–E). However, oblique trees were usually less complex at all studied ages as evidenced by their maximal branching orders (oblique: 4.18 ± 0.11, n = 51 versus basal: 6.47 ± 0.18, n = 49; P < 0.001). Those further from the soma were often shorter and simpler than the close ones and some of them were even single branches (Figure 9A).
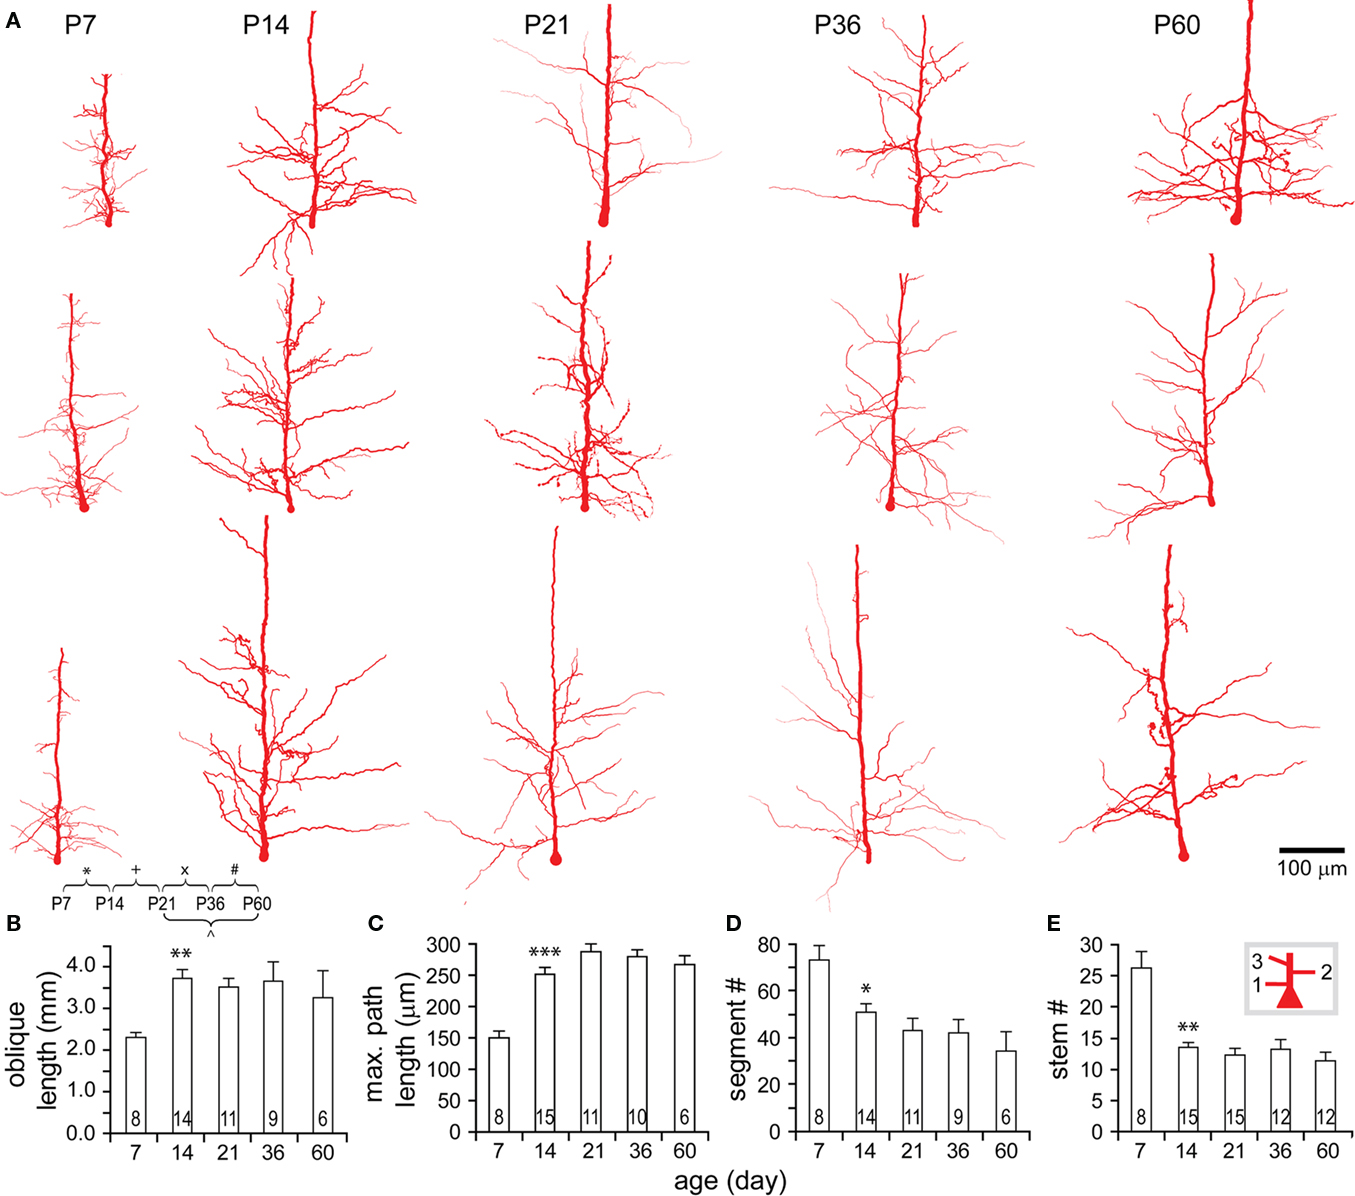
Figure 8. Developmental changes in the morphology of oblique dendrites. (A) Representative reconstructions of oblique dendrites on apical trunks from each age examined. Note that oblique trees closer to soma appear more arborized than those further ones. (B–E) Development of oblique dendrite in the total length (B), the maximal path length (C), the total number of segments (D), and the number of trees (E). Significant changes were tested from P7 to P14, including an increase in the total length and the maximal path length, and a decrease in the total number of segments and the number of oblique trees. Thereafter, all these parameters did not show any further significant changes.
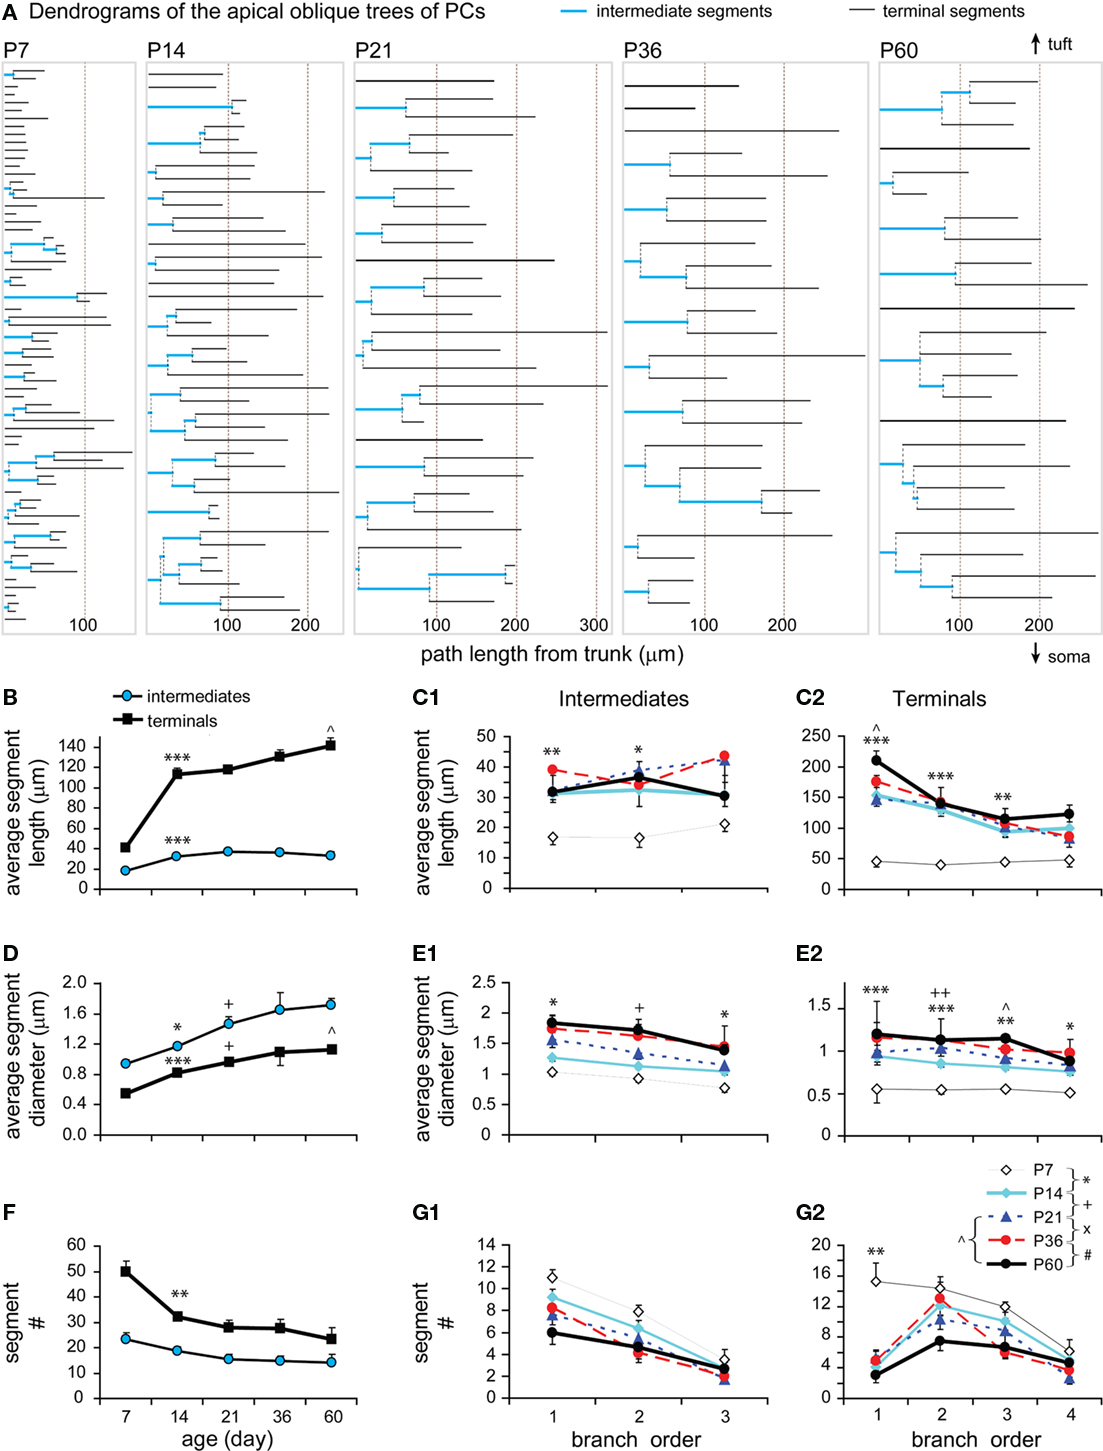
Figure 9. Developmental changes in the branching pattern of oblique dendrites. (A) Dendrogram of representative oblique trees from each age examined. Note less complexity in the arborization compared to basal dendrites (see Figure 6A). Single obliques without branches are mostly further from soma. The segment length was scaled according to real length, but the thickness was not scaled. (B) Average lengths of intermediate and terminal segments versus age (P7: n = 8, P14: n = 14, P21: n = 11, P36: n = 9, P60: n = 6). Significant increases were tested between P7 to P14 in both intermediates and terminals, and between P21 to P60 only in terminals. (C1) The intermediate segment length significantly increased on the first and second orders from P7 to P14. (C2) The terminal segment length significantly increased on the first to third orders from P7 to P14 and only on the first orders from P21 to P60. (D) Average diameters of intermediate and terminal segments versus age [same cells as in (B)]. In general, the average segment diameter kept increasing during the whole period studied. The significant increases were seen between P7 to P14 and P14 to P21 in both intermediates and terminals, and between P21 to P60 only in terminals. (E1) The intermediate segment diameter significantly increased on the first and third orders from P7 to P14 and on the second orders from P14 to P21. (E2) The terminal segment diameter significantly increased on all the orders first to fourth from P7 to P14, only on the second orders from P14 to P21, and only on the third orders from P21 to P60. (F) Average numbers of intermediate and terminal segments versus age [same cells as in (B)]. There was not significant change in the segment number except a decrease in terminal segments from P7 to P14. (G1) The intermediate segment number was not significantly changed during the whole period studied. (G2) The terminal segment number was not significantly changed except a decrease on the first orders from P7 to P14.
A more detailed analysis revealed that the rapid growth of oblique dendrites between P7 and P14 was also due to an increase in length of both intermediates (1.84-fold) and, in particular, terminals (2.75-fold; Figures 9A,B). This earlier increase in length occurred in intermediate and terminal branches at most orders (the first–second orders and the first–third respectively; Figures 9C1,C2). A later increase in length occurred between P21 and P60 to the terminals at the initial order (Figure 9C2). The first order terminals were actually single branches and therefore mostly located further from the soma (Figures 8A,9A). However, the total length and the number of oblique dendrites were not significantly changed during this period (Figures 8B,E). This may be because a retraction occurred in other oblique dendrites. This possibility is indicated by a trend in reduced segment length at the third order of intermediates between P21 and P60 (Figure 9C1). In general, the intermediate segments appeared to have similar lengths at different orders (Figure 9C1). The terminal segments became shorter at higher-orders (Figure 9C2), which is in a pattern opposite to basal dendrites.
The average segment thickness of both oblique intermediates and terminals tended to increase during the entire study period (Figure 9D). The early significant increase between P7 and P14 occurred virtually in all the orders of both intermediates and terminals (Figures 9E1,E2). The later significant increase occurred locally at the second orders of both intermediates and terminals from P14 to P21, and at the third orders of terminals from P21 to P60 (Figures 9E1,E2).
The total number of terminal segments significantly decreased from P7 to P14 while the segment number of intermediates remained relatively constant over all ages studied (Figures 9F,G1). Those terminals that disappeared were unbranched stem segments at the first orders (which were counted as terminal segments in the analysis; Figure 9G2). Most of these terminals were filopodia (Figure 9A, P7). Therefore, the number of real oblique dendritic segments might be unchanged throughout all ages studied.
The tuft dendritic tree bifurcated from an apical trunk and often consisted of a pair of asymmetrical tuft dendrites that extensively arborized in Layer I. At all studied ages, a wide range of tuft shapes was observed (Figure 10A). The diversity of tuft dendrites was therefore already present at P7. Since the shape of a tuft dendrite is another key feature for the identification of neuronal subtypes (Wang et al., 2006), this diversity of tuft dendrites again indicates the early differentiation of TTL5 subtypes. Furthermore, tuft dendrites, like oblique dendrites, also significantly grew in all domains as measured vertically with radial length and horizontally with lateral length and lost filopodia-like segments between P7 and P14 (Figures 10A,B). The disappearance of filopodia was also reflected by the decrease in the number of tuft branch points (Figure 10C) and the number of “Vb” type vertices (Figure 10D) as well as the disappearance of those branch orders that were higher than the maximal branch orders at older ages (Figure 10E).
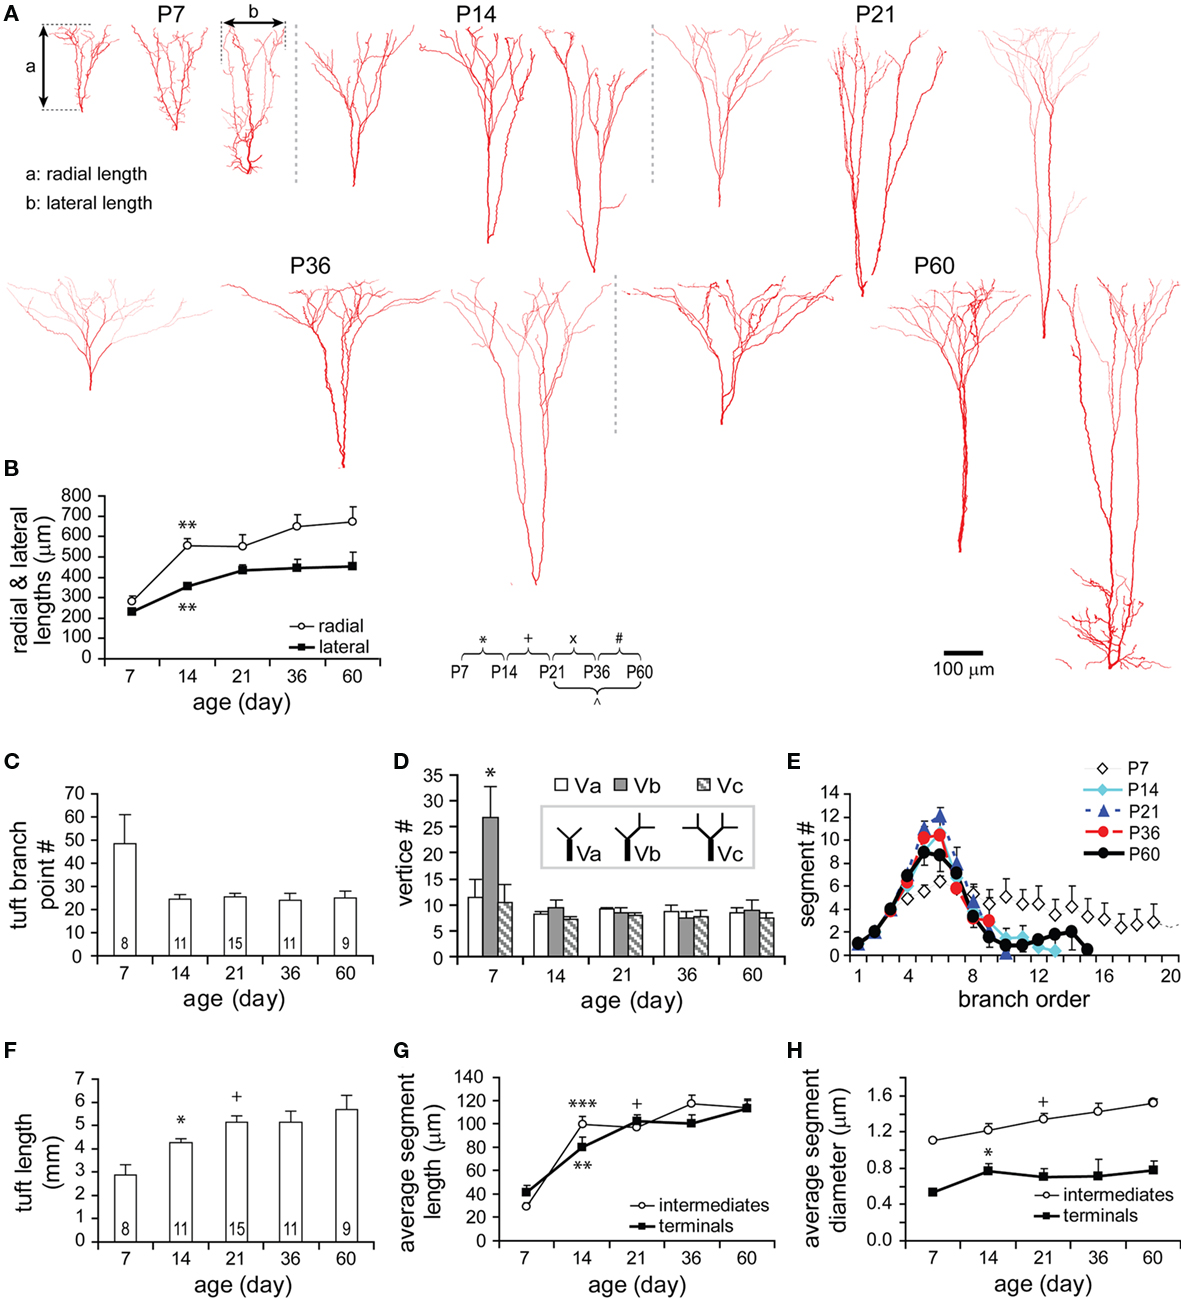
Figure 10. Developmental changes in the morphology of apical tuft. (A) Representative reconstructions of tuft dendritic trees from each age examined. Note the loss of filopodia-like short segments from P7 to P14. The radial length (a) is defined as the vertical distance from the first bifurcation branch point to the furthest tuft branch. The lateral length (b) is defined as the tangential distance between two most remote tuft terminal branches projecting to the pial. (B) Both radial and lateral lengths significantly increased from P7 to P14 (P7: n = 9, P14: n = 14, P21: n = 15, P36: n = 11, P60: n = 9). Thereafter, both measures tended to further increase, but not statistically significant. (C) Tuft branch point number was constant at different ages except at P7. The branch point number at P7 included branches forming filopodia-like segments. (D) Three types of vertices were constant at different ages except at P7. The “Vb” vertices (one terminal with an intermediate segment at a branch point) were significantly higher at P7 due to filopodia-like segments. (E) Tuft segment number versus branch order at different ages. Except at P7, the distribution curves at other ages virtually overlapped each other with their peaks between fifth and sixth orders. At P7, filopodia-like branches were indicated by higher number of segments at higher-orders (>seventh order). (F) The total tuft length significantly increased from P7 to P14 and from P14 to P21 and then remained constant. (G) The average segment length of tuft intermediate and terminal segments significantly increased from P7 to P14. Afterward, a further significant increase from P14 to P21 was tested only in terminals. (H) The average segment thickness of tuft segments significantly increased from P14 to P21 in intermediates and from P7 to P14 in terminals (P7: n = 8, P14: n = 13, P21: n = 13, P36: n = 8, P60: n = 9). Note the average segment thickness of tuft intermediates showed a tendency of increasing.
The total tuft length significantly increased by 1.48-fold from P7 to P14, and by 1.78-fold from P7 to P21 (Figure 10F). The average segment length increased by 3.35-fold in intermediates and by 2.48-fold in terminals from P7 to P21 (Figure 10G). The average lengths of both intermediate and terminal segments significantly increased from P7 to P14, but only terminals were significantly increased from P14 to P21. The development in the thickness of tuft dendrites showed some difference: The thickness of terminals remained relatively constant after a significant increase from P7 to P14, while the thickness of intermediates significantly increased from P14 to P21 and trended to continuously increase until P60 (Figure 10H). However, these significant changes could not be reflected in the analyses of length and thickness as a function of branch order (Figures A3A,B1,B2 in Appendix). This may be due to the large variation among individual values at each branch order as well as the obvious drop in sample size when dispersing a large sample into small samples according to multiple orders.
In summary for the dendritic morphology, three developmental periods appeared in the time window studied: P7–P14, P14–P21, and P21–P60 (Table A1 in Appendix). The growth rate was fastest at the first period (73% of 41 dendritic parameters observed), intermediate at the second period (32%), and slowest at the third period (12%). All basal, oblique, and tuft dendrites of a TTL5 cell grew rapidly in almost all compartments from P7 to P14. Both lengthening and thickening occurred simultaneously to a specified dendritic segment except for tuft intermediates that only lengthened. In the later stages, changes were localized to specific orders of segments of a dendritic compartment, especially the terminals. Either lengthening or thickening, never both concurrently, took place at one segment (Table A2 in Appendix). From P14 to P21, basal and oblique and tuft intermediates thickened at certain specified segments. Basal and tuft terminals lengthened without thickening while oblique terminals thickened without lengthening. From P21 to P60, changes in length and thickness occurred only to oblique dendrites, which were localized at different segments respectively. Additionally, new segments emerged from some specific orders of basal dendrites during this period. Eventually, different dendritic compartments form distinct branching patterns following development. While branching to higher-orders: both basal intermediates and terminals tended to be lengthened; both tuft intermediates and terminals tended to be shortened; oblique intermediates remained similar in length while their terminals tended to be shortened. Furthermore, a rebalance in length between terminals or between terminals and intermediates appeared within a compartment likely by retracting some segments while elongating others in basal and oblique dendrites.
Spines were identified and counted on randomly selected segments from each compartment of well-stained TTL5 neurons (Figure 11A). The spine count was however not corrected for those spines obscured by dendritic shafts. Although there was no statistically significant increase in spine density from P7 to P14, spines did appear to develop during this period (Figure 11B). This is likely that most filopodia at P7 were directly changed to spines at P14 (Yuste and Bonhoeffer, 2004; Mattila and Lappalainen, 2008; Yoshihara et al., 2009). A significant increase in spine density was observed in all compartments from P14 to P21, at which point it reached adult levels (Figure 11B). This indicates that the spine density matures as early as P21.
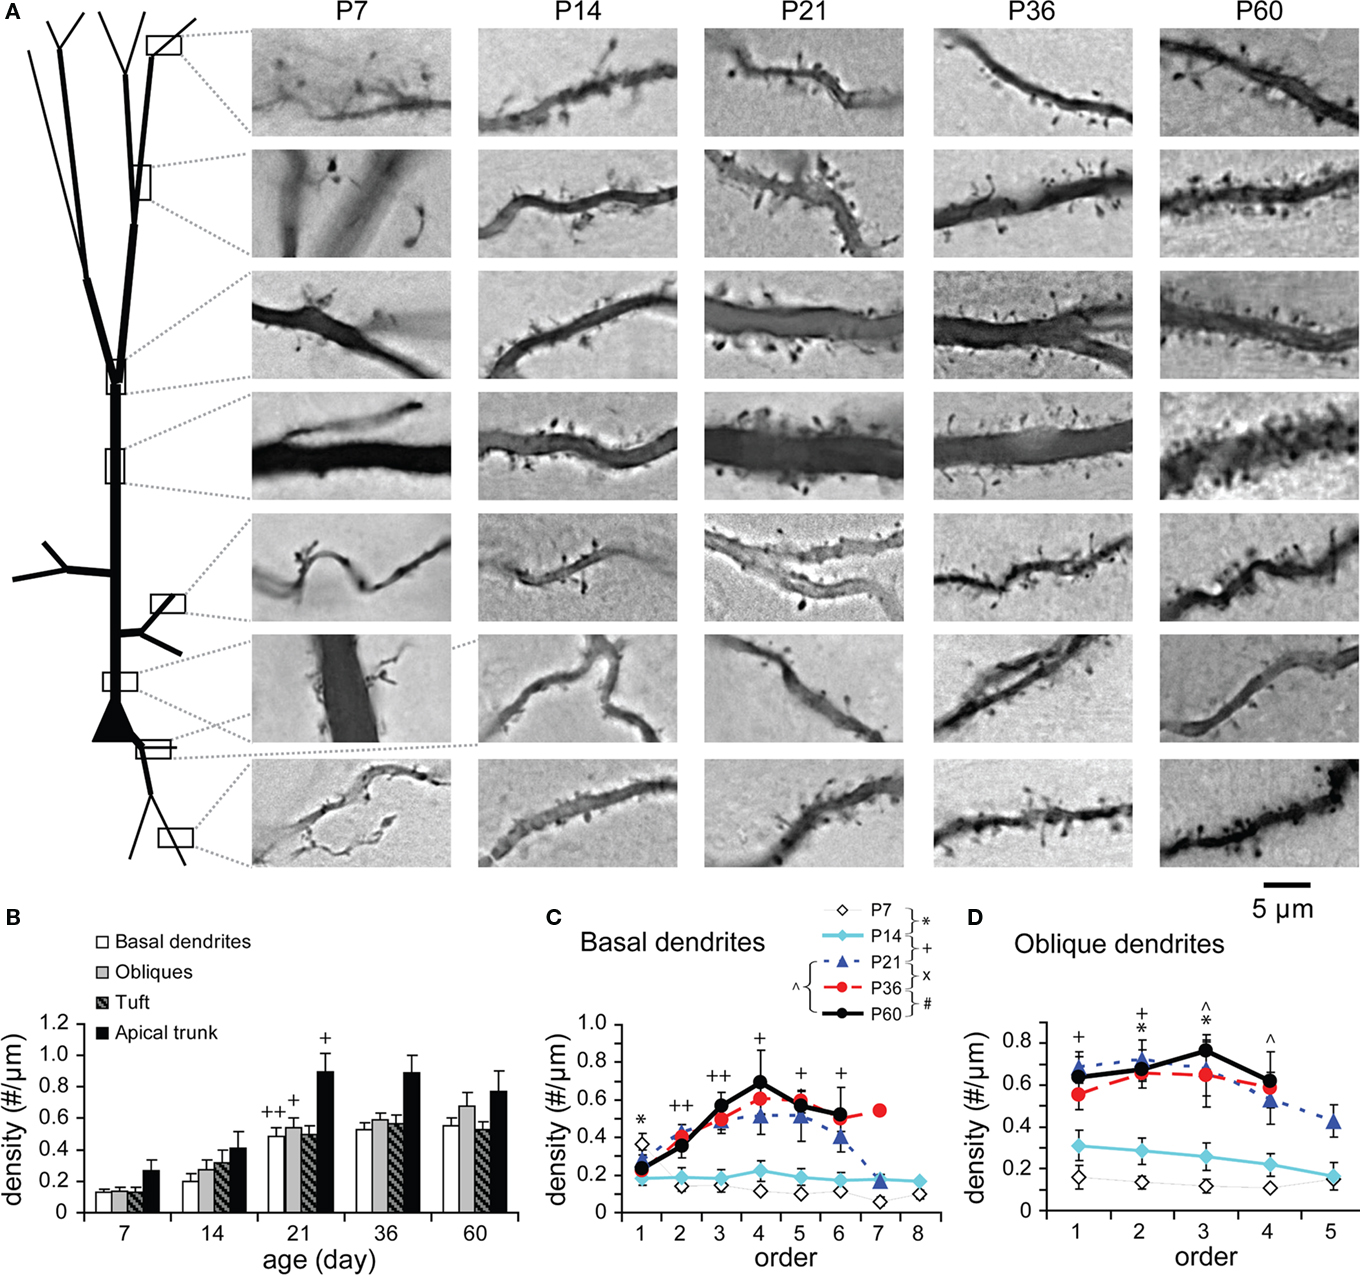
Figure 11. Developmental changes in spine density. (A) Pictures illustrating the spine density on different neural parts from each age examined. (B) Spine density on different neural compartments. No correction was made for spines obscured by dendritic shafts. Spine density significantly increased between P14 and P21 on all compartments (except the tuft on which a tendency of increasing was visible; on basal dendrites, oblique dendrites, apical tufts, apical trunks, respectively: P7: n = 8, 8, 8, 6 μm; P14: n = 9, 7, 7, 7; P21: n = 13, 15, 15, 14; P36: n = 12, 11, 13, 10; P60: n = 12, 11, 9, 2). (C) Spine density on basal dendritic segments versus branching order [same cells as in (B)]. At P7 and P14, spine density was relatively uniform on different orders except on the first order where the spine density was significantly reduced. From P14 to P21, the spine density significantly increased unevenly on different branch orders with a peak at the fourth order. Afterward, no significant changes were tested. (D) Spine density on oblique dendritic segments versus branching order at different ages [same cells as in (B)]. At P7 and P14, spine density was also relatively uniform on different orders with a significant increase on the second and third orders from P7 to P14. At older ages starting from P21, spine density further increased unevenly on different orders with a peak at the middle (second or third) orders. The significant increases were at the first and second orders from P14 to P21 and at the third and fourth orders from P21 to P60.
The spine density was analyzed as a function of branching order of basal and oblique dendrites (Figures 11C,D). Spines were sparsely and evenly distributed at all branch orders of basal dendrites at P7 and P14 except those on the first orders. The spines on the first orders (i.e., proximal dendrites) were significantly reduced from P7 to P14 (Figure 11C), remaining sparse thereafter. This observation is consistent with previous reports (Petit et al., 1988; Duan et al., 2003). The spine density then increased along the middle-orders with a peak (2.3-fold) at the fourth orders of basal branches from P14 to P21 (Figure 11C). Interestingly, these middle-orders of basal dendrites also displayed more dynamic changes in length, thickness, and segment numbers at older ages (see Figures 6C1,C2,G1,G2). In oblique dendrites, spines appeared to increase earlier as evidenced by the significant increase in spine density at the second and third branch orders from P7 to P14 (Figure 11D). Moreover, further increase of spines virtually matched the dynamic changes in the thickness of middle-order branches from P14 to P21 and up to P60 (Figures 11D and 9D,E1,E2).
The number of axonal collateral stems at P7 was already equivalent to that of a mature TTL5 neuron (Figure A1D in Appendix). The radial distances from soma to axonal sites where collateral stems emerged, including axon initial segments (Figures 12A,B), displayed an overall significant increase from P7 to P14 (P < 0.005; Figure 12C), which matches the rapid growth of dendrites during the same developmental period. A progressive lengthening of inter-segments between subsequent axonal stems was initially absent at P7 (1 → 2, 25 μm; 2 → 3, 14 μm; 3 → 4, 21 μm; 4 → 5, 13 μm), but became prominent at P36 (1 → 2, 24 μm; 2 → 3, 50 μm; 3 → 4, 67 μm; 4 → 5, 146 μm). Despite the absence of the data for higher-orders of axonal collaterals at P60, the results showed a late predominant extension in the radial distances of distal collaterals (Figure 12C).
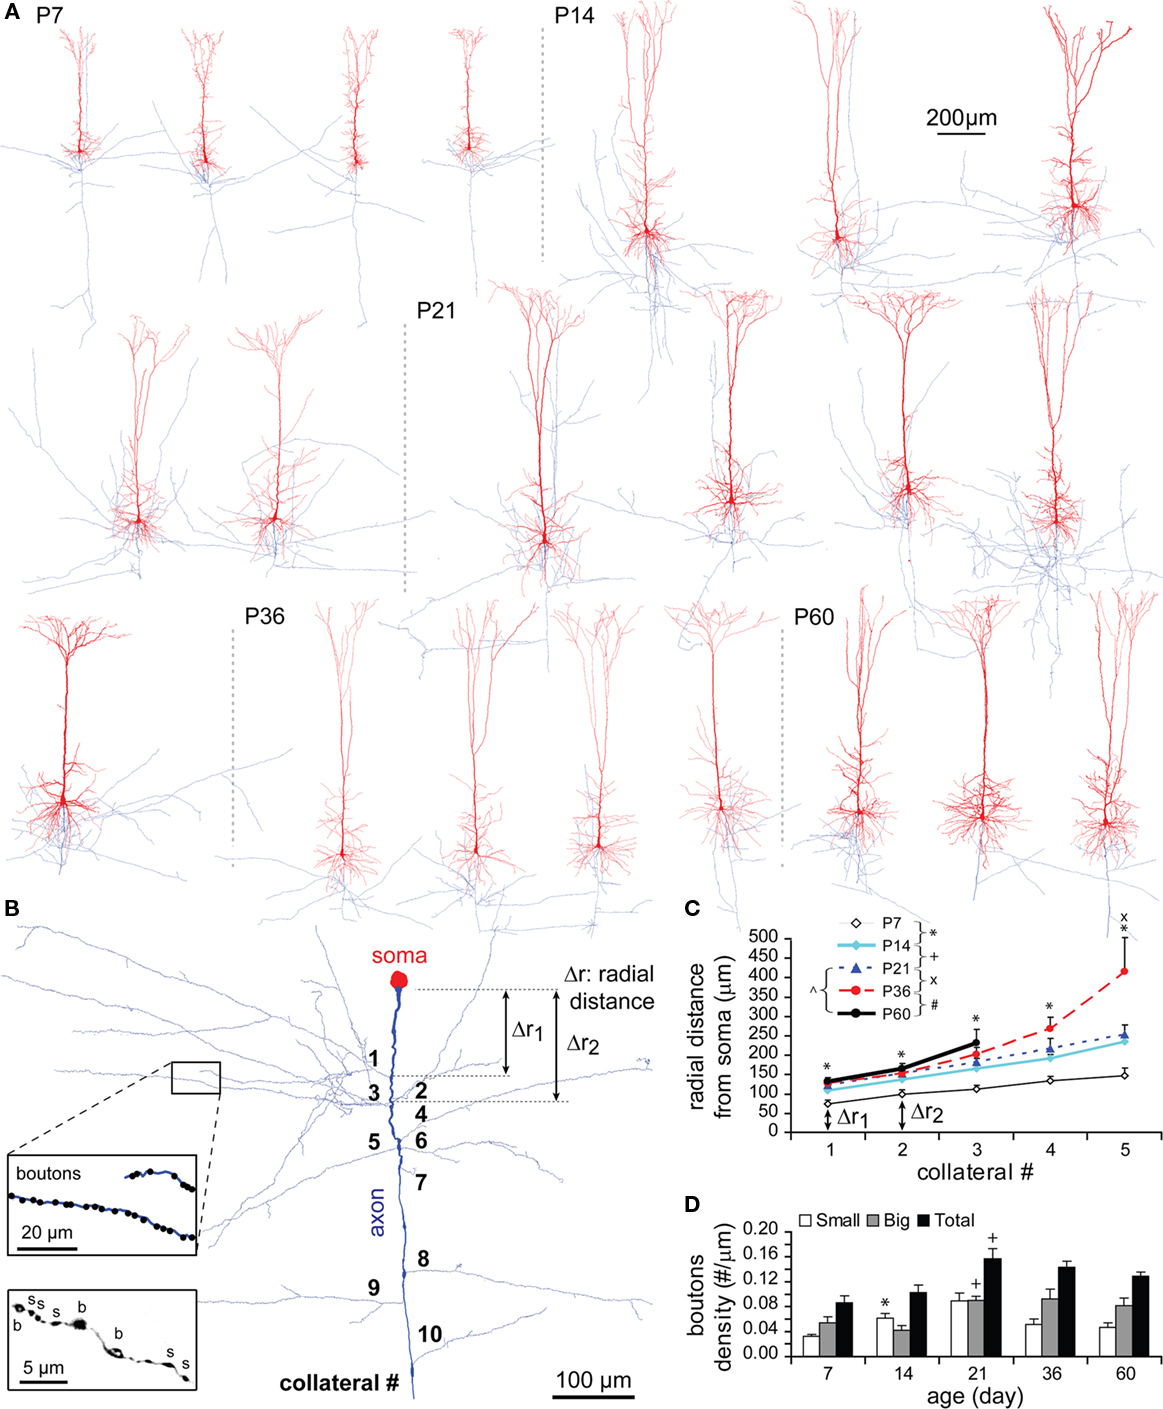
Figure 12. Developmental changes in axon and bouton density. (A) Representative reconstructions of TTL5 from each age examined (dendrites in red and axons in blue). Ages are indicated to the left, and neuron groups are separated by a dotted gray line. (B) Reconstruction of a typical P14 axon and its soma. Radial distance (i.e., Δr1, Δr2) was illustrated between the soma and an emerging collateral (Right). Bouton density on a collateral and small (s, ∼0.2–0.7 μm) and big (b, ∼1.0–1.8 μm) boutons were represented (Left insets). (C) Radial distances from soma to the first five collateral stems (P7: n = 8, P14: n = 15, P21: n = 12, P36: n = 9, P60: n = 4). A significant increase in the radial distance was tested from P7 to P14 to all the collateral stems, but a further increase from P21 to P36 was significant only to the most distal fifth collateral stem. (D) Bouton density on the whole axon (total number of boutons/total axon length) for small, big, and total boutons (P7: n = 8, P14: n = 13, P21: n = 6, P36: n = 3, P60: n = 3). A significant increase was shown from P7 to P14 in the density of small boutons, and from P14 to P21 in the density of large boutons and the density of total boutons.
The bouton density of axons increased significantly from P14 to P21, finally reaching adult levels (Figure 12D, black bar). This significant increase was matched by an increase in the density of large boutons (1.0–1.8 μm, gray bar). There was however a significant early increase in small boutons (0.2–0.7 μm, white bar) from P7 to P14. As animals were getting older, the density of small boutons showed a tendency to decrease along with the total bouton density (Figure 12D).
In this study we quantitatively analyzed the morphological development of TTL5 cells from the rat somatosensory cortex across five ages: postnatal day (P) 7, 14, 21, 36, and 60. This study confirms three important developmental periods, as previous studies have reported (Eayrs and Goodhead, 1959; Wise et al., 1979; Nicolai, 1981; Petit et al., 1988; Zhu, 2000). Furthermore, a quantitative morphometric view of key alterations over all compartments is provided for this specific neuronal type. By P7, the general structural frame of a TTL5 neuron is already well differentiated while remaining small in physical size. The first period from P7 to P14 is characterized by a fast growth in almost all compartments, including a maturation of somata toward the characteristic triangular shape and a quick growth of dendritic and axonal arborizations both in length and thickness. Most measurements of a TTL5 cell reach adult levels by P14. This period is also characterized by the pruning of filopodia-like segments along the apical dendrite. The neocortical thickness is close to the adult level as well. The second period from P14 to P21 is characterized by a slower growth, either in length or in thickness, of localized segments of each compartment, and by an increase in densities of dendritic spines and axonal boutons. The third period from P21 to P60 is mainly characterized by an increase in the number of localized basal dendritic segments and either lengthening or thickening of particular segments of basal and oblique dendrites. All three periods are associated with the continual increase in hemisphere weight, the continual expansion of rostro-caudal length, and the increase in thickness of the corpus callosum.
Thus, our findings present a detailed and high-quality whole picture of the TTL5 neuron type, and are also consistent with numerous Golgi studies (Eayrs and Goodhead, 1959; Wise et al., 1979; Miller, 1981; Miller and Peters, 1981; Nicolai, 1981; Petit et al., 1988; Munoz-Cueto et al., 1991; Koenderink and Uylings, 1995), biocytin/fluorescent dye studies (Kasper et al., 1994a,b; Franceschetti et al., 1998; Zhu, 2000; Zhang, 2004; Larsen and Callaway, 2006), and in vivo time-lapse imaging studies at different ages (Wu et al., 1999; Butz et al., 2009; Holtmaat and Svoboda, 2009). Specifically, the structural plasticity observed in young adults during the third period may exist through adulthood in accordance with lifelong learning and memory (Butz et al., 2009; Holtmaat and Svoboda, 2009).
A previous study on the temporal cortex has reported two modes of changes in layer V pyramidal cells after birth: “morphokinesis as a reaction to planned crises” and “morphokinesis as a reaction to environmental influences” (Nicolai, 1981). The former happens within the first 2 weeks after birth, which possibly reflects intrinsic growth programs for the initiation of brain functions. The latter happens afterward during the critical period of primary socialization or experience-related learning (Scott et al., 1974). In agreement with this study, our study also indicates two modes of morphological changes of TTL5 cells in the somatosensory cortex. At the early stage from P7 to P14, overall compartments grow at a fast rate in both height and width of somata and both length and thickness of dendritic and axonal arborizations. At the later stages, the pattern of growth is completely changed. The growth takes place much slower only on particular segments within a compartment, which is limited to either lengthening (mostly on terminals) or thickening (mostly on intermediates), though both rarely occur together. The increase in basal segments from P21 to P60 could belong to the category of lengthening change. Lengthening, especially at terminals may represent a process to reach new targets forming synapses. Thickening may represent a process to increase the surface available for contacts, predominantly strengthening, and consolidating synapses. It may also reflect the increase in molecular traffic flux through intermediate branches for the extension of dendritic terminals.
The number of cells that will be present in the adult neocortex is given before birth. Neuronal somata grow rapidly after birth. This change is correlated with the gross anatomical changes of the neocortex (Vincze et al., 2008). Increases in soma size of a TTL5 cell are significant between both periods P7–P14 and P14–P21. It reaches a peak by P21, likely reflecting the increase in gene expression level. Miller and Peters (1981) found an equivalent growth in nuclear volume in the rat visual cortex as the size of cell body increases during the first three postnatal weeks, and the change in nucleus size is expected to be related to the change in gene expression level. Hence the growth of somata between P7 and P14 might reflect the expression of proteins necessary for the fast growth of all dendritic and axonal compartments and for the trimming of filopodia or/and the transformation in active spines, as well as the formation of ion channels (as action potentials become shorter, more regular, and have higher amplitudes (Franceschetti et al., 1998; data not shown). Between P14 and P21, the additional growth of soma might be relevant to the synthesis of proteins necessary for synapse formation on the whole neuron according to an increase in dendritic spine and axonal bouton densities. However, as only the soma height (and not soma width) increased and the apical tuft further lengthened at this stage, the soma growth might also relate to increased neuroplasmic flow (molecular trafficking) toward the apical dendrite. After P21, the change in soma size was not significant and even the height of the soma tended to decrease. These observations seem to correlate with the slower and more localized subtle changes, even retractions, in dendritic and axonal morphologies at the later stages.
Differential changes in individual structures of pyramidal neurons supports the notion of multiple functional compartments that receive different inputs from the same and neighboring cortical columns as well as long-range afferents (DeFelipe and Farinas, 1992; Nieuwenhuys, 1994; Binzegger et al., 2004; Douglas and Martin, 2004; Bannister, 2005; Spruston, 2008; Petreanu et al., 2009). Pyramidal neurons have been functionally separated into two compartments: the tuft region and the rest of the neuron (Spencer and Kandel, 1968; Pinsky and Rinzel, 1994; Yuste et al., 1994; Mainen and Sejnowski, 1996). More recently, regions such as the proximal apical dendrite or the basal dendrites have also been assigned as distinct compartments with their own properties (Schiller et al., 2000; Larkum et al., 2001; Nevian et al., 2007). Our study shows that all compartments undergo different developmental changes suggesting that there may be at least six separate functional compartments for TTL5 neurons, including soma, basal dendrite, apical trunk, oblique dendrite, tuft dendrite, and axon.
The growth and branching pattern of different compartments of cortical pyramidal cells are differentially influenced by molecular cues (McAllister et al., 1995; Aizawa et al., 2004; see review McFarlane, 2000). This indicates the existence of compartment-specific signal transduction systems. For instance, apical dendrites and axons respond to a gradient of the diffusible signal semaphorin 3A (Sema 3A), which sends the former toward and the latter away from the cortical plate (Polleux et al., 1998, 2000). This is due to an asymmetrical localization of cyclic nucleotide-dependent mechanism to the developing apical dendrite and axon. McAllister et al. (1995) also showed that basal and apical dendrites responded independently of one another to different neurotrophins in cortical-slice cultures. Neurotrophins and their receptors are also expressed differentially in various cortical layers. Furthermore, separate regions (proximal and distal) of a dendritic arbor have distinct regulations in response to an extrinsic cue as shown in a study using gene transfection in layer VI pyramidal cells (Yacoubian and Lo, 2000). All these lines of evidence suggest that developmental changes would be localized to specific neuronal arborizations. Indeed, our results show that the developmental changes are restricted to particular segments rather than to a whole compartment after a fast-growing period following birth. This is also consistent with many in vivo time-lapse imaging studies (Butz et al., 2009; Holtmaat and Svoboda, 2009). In addition to extrinsic cues such as neurotrophins, differential developmental changes in localized multiple compartments of a neuron may also depend on other factors, including different electrical inputs, neurons’ own distinct electrical properties, and molecular compositions (such as ion channels, receptors, and signal transduction systems; Freund, 2002; Lorincz et al., 2002; Nicolelis et al., 2003; Yuan and Chen, 2006; Acsady and Kali, 2007; Inan and Crair, 2007). The current study further supports the notion of multiple functional compartments in the developmental morphology of a specific neuron type.
As shown in several species, such as rat and human, and in different pyramidal cell types, dendritic terminal segments are longer (and thinner) than intermediate segments (Petit et al., 1988; Larkman, 1991b,c; Koenderink and Uylings, 1995). Such longer terminal segments appear relatively characteristic for the basal and oblique dendrites (Uylings et al., 1986; Larkman, 1991b,c). Terminal segments of tuft dendrites, although not longer, are of similar length to intermediates. Our study suggests that intermediate segments of all basal, oblique, and tuft dendrites rapidly consolidate, possibly with thick and rigid microtubule fibers upon reaching a certain length at the early stage from P7 to P14. Meanwhile, terminal segments likely composed of thin dynamic actin filaments would continue lengthening until contacting dendritic processes of adjacent neurons. The contacts may trigger signals such as Notch-ligand signaling, resulting in a rebalance by shortening some long dendrites while extending other short neurites (Sestan et al., 1999). Indeed, we have observed the rebalance phenomenon between basal dendritic terminals and between oblique dendritic terminals and intermediates during the period from P21 to P60. During the same period, new terminal segments even add to some pre-existing terminals, and hence the pre-existing terminals become higher-order intermediate segments.
In particular, we found that oblique dendritic trees originate and branch at all ages within 30% of the maximal reach of the apical dendrite (∼330 μm in adulthood), and their average thickness appears to increase during the whole studied period; Obliques closer to soma seemed longer and more complex than the further ones. The establishment of such an oblique pattern already presents at P7, and is likely an essential condition for the functioning of the TTL5 neuron type. Proximal dendrites usually receive excitatory inputs from local sources (i.e., collaterals in the same area or from an adjacent area) whereas the distal apical tuft receives inputs from more distant cortical and thalamic locations. Schaefer et al. (2003) showed that the position of oblique trees along apical dendrite can influence the degree of coupling between the back-propagation axosomatic action potentials (bAPs) and the apical dendritic calcium action potentials (Ca2+-APs). The coupling here refers to the reduction of the threshold to initiate an apical dendritic Ca2+-AP due to a coincident bAP. Increasing the number of oblique trees farther from the soma (>140 μm) decreases the coupling, while adding them closer to the soma has the inverse effect. After P14, regenerative dendritic potentials initiate partly in the tuft and partly in the axon, representing electrotonic isolation of the dendritic tuft from the soma (Franceschetti et al., 1998; Zhu, 2000). Our results show that single distal oblique branches might be significantly lengthened during P21–P60. This suggests that the signal coupling would be decreased along apical dendrites, thus constituting the anatomical basis for the enhanced electrotonic isolation of the dendritic tuft from the soma at older ages.
Afferent fibers (thalamocortical axons) as well as commissural fibers invade all layers of the primary sensory cortex a few days after birth and, like the general structural frame of a TTL5 cell, display a mature arrangement by the end of the first week (Wise and Jones, 1976; Lund and Mustari, 1977; Nicolelis et al., 1991; see review of Lopez-Bendito and Molnar, 2003). The invasion of afferent fibers into the neocortex may drive the initial burst in growth of filopodia-like segments to “capture” en passant axons (Yuste and Bonhoeffer, 2004; see review of Cline, 2001; Konur and Yuste, 2004). Once captured, these filopodia-like segments may retract and consolidate to spines, accounting for their disappearances during this transient period (Portera-Cailliau et al., 2003; Oray et al., 2006). We also found an increase of small boutons by P14 suggesting that the retraction of the filopodia-like segments may coincide with the formation of early synapses.
The largest increase in spine number and bouton density to nearly adult values happens between P14 and P21. An interesting finding, however, which was also previously reported (Larkman, 1991a; DeFelipe and Jones, 1992; Amitai et al., 1993; Gao and Zheng, 2004), is that the increase in spine density seems to be mostly due to the addition on mid-range dendritic segments. Thus, a specific component of the circuitry further develops around these mid-range dendrites, while most of the synaptic circuitry seems to have formed by P14. Afferents received by the mid-range dendritic branches might be ipsilateral corticocortical projections, which have been shown to establish an adult pattern of lamination between P7 and P21 (Nicolelis et al., 1991). However, this has not yet been demonstrated and so the functional significance is not clear. Moreover, the density of boutons (mostly due to large boutons) also peaks at the same period, further reflecting the maturation of synaptic circuitry. It has been previously reported that the spine head and the axon terminal are frequently similar in size (Peters et al., 1991). Later studies found a correlation between the size of active zones and the number of docked vesicles (Schikorski and Stevens, 1997), which might be proportional to the release probability and the synaptic strength (Murthy et al., 2001). Therefore, the increase of large boutons indicates a high number of strong synapses by P21. Subsequently, the number of small boutons slightly decreases suggesting elimination of overproduced weak output connections and thus further consolidation of the functional synaptic microcircuitry.
Synapse formation can direct the arborization of neurites (Niell et al., 2004; Cline and Haas, 2008). It is therefore not surprising that both (postsynaptic) dendrites and (presynaptic) axons follow similar rules during development. For instance, alterations happen more frequently and dynamically in terminal/distal segments of both dendritic and axonal structures; Retraction and elongation/sprouting or appearance and disappearance often simultaneously occur to arbor structures or to spines and boutons. In this way, the corresponding total measurements remain constant, which may be necessary for a synaptic homeostasis as some activity-dependent alterations have to be made in neuronal microcircuitry (Petit et al., 1988; Butz et al., 2009; Holtmaat and Svoboda, 2009).
When interpreting our data, we must keep in mind that methodological limitations may have affected some absolute values in this study. Both dendritic and axonal structures were partially trimmed off due to the slicing procedure of brain sections, which leads to the underestimation of some measurements such as total length. However, increasing section thickness will make patch-clamp recording and biocytin-labeling of neurons difficult, and also make identifying and tracing dendritic and axonal structures at deep focusing levels much harder. Another difficulty resulted from the faint staining of cells from older brains. Neuronal structures, especially axonal collaterals in most slices from P36 to P60 rats, were not clearly visible at deep focusing levels under the light microscopy. Therefore, some relevant measurements, such as axonal length and segment analyses, could not be performed accurately for those cells at P36 and P60. Despite these methodological limitations, the maximal extending measurements of a neuron were not affected and most dendritic trees were intact, which ensures the accuracy of quantitative analysis and comparison of developmental alterations of arbor structures, especially dendrites.
At younger ages when dendrites are narrow and spines are not dense, if not all, most of the spines are visible. Hence, the counting is close to the absolute number of spines. At older ages, as dendrites get thicker, a proportion of spines are obscured by opaque stained thick dendrites. Therefore, the spine density can be underestimated (also see Feldman and Peters, 1979). However, the thickness of most dendritic segments remains unchanged after P14, with the exception of some particular branch orders. As a result, the underestimation of spine density at older ages might not be significant.
Variations in results across different studies can be due to many methodological factors such as differences in the staining procedure, the section thickness, the measuring and analyzing method, the cell selection criterion, the sample size, and the cortical area. These variations make it difficult to directly compare results between different studies. Thus, we prefer to compare the current study with developmental patterns of changes instead of absolute values found in previous studies.
Quantitative analysis of the morphology of TTL5 neurons in the rat somatosensory cortex has revealed three important developmental periods starting from P7 to young adulthood (P60) based on growing rates and changes in morphological properties of different neuronal compartments. Two modes of developmental morphological changes were observed over these stages. The first period from P7 to P14 is characterized by a fast growth in almost all compartments. In the second (P14 to P21) and third (P21 to P60) periods, the growth takes place at a much lower rate and only on particular segments, which is limited to either lengthening (mostly on terminals) or thickening (mostly on intermediates). Lengthening at dendritic terminals could be a process to reach new targets forming synapses. Thickening could be a process to increase contact surface for strengthening and consolidating pre-existing synapses and/or to increase the molecular traffic flux through these dendritic branches. In addition, densities of dendritic spines and axonal boutons markedly increase during the second period. The number of particular basal dendritic segments increases during the third period. Sometimes, the growth of some segments is accompanied by the retraction of other segments. All compartments virtually undergo different developmental changes, which are restricted to particular segments rather than to a whole compartment at these later periods. Finally, different dendritic compartments form different branching patterns. The development of axons appears to share the major principles for dendrites during different periods.
Our study therefore supports the notion of multiple functional compartments in the aspect of developmental morphology of a specific neocortical neuron type. The quantification of the TTL5 neuron provides new insight into the potential value of its morphology for information processing and also provides the fundamental reference for interpreting morphological alterations under various conditions. Furthermore, the detailed changes during development can be used to morph neuron models from one age to another. Together with a more generic developmental algorithm that also applies to other types of neurons, this study will be the foundation for building and simulating models of the neocortical microcircuitry at any age. Such a study will therefore be essential for the biologically realistic simulation of the mammalian brain (Markram, 2006).
The authors declare that the research was conducted in the absence of any commercial or financial relationships that could be construed as a potential conflict of interest.
The authors wish to thanks Dr. Zoltán Kisvarday and Dr. Karube Fuyuki for the estimable assistance, to Mrs. Zsanett Solyom and Mónika Szakadát for the excellent anatomical reconstructions. The study was supported by the Blue Brain Project.
Acsady, L., and Kali, S. (2007). Models, structure, function: the transformation of cortical signals in the dentate gyrus. Prog. Brain Res. 163, 577–599.
Aizawa, H., Hu, S.-C., Bobb, K., Balakrishnan, K., Ince, G., Gurevich, I., Cowan, M., and Ghosh, A. (2004). Dendrite development regulated by CREST, a calcium-regulated transcriptional activator. Science 303, 197–202.
Allendoerfer, K. L., Cabelli, R. J., Escandon, E., Kaplan, D. R., Nikolics, K., and Shatz, C. J. (1994). Regulation of neurotrophin receptors during the maturation of the mammalian visual system. J. Neurosci. 14(3 Pt 2), 1795–1811.
Amitai, Y., Friedman, A., Connors, B. W., and Gutnick, M. J. (1993). Regenerative activity in apical dendrites of pyramidal cells in neocortex. Cereb. Cortex 3, 26–38.
Bannister, A. P. (2005). Inter- and intra-laminar connections of pyramidal cells in the neocortex. Neurosci. Res. 53, 95–103.
Bayer, S. A., Altman, J., Russo, R. J., Dai, X. F., and Simmons, J. A. (1991). Cell migration in the rat embryonic neocortex. J. Comp. Neurol. 307, 499–516.
Binzegger, T., Douglas, R. J., and Martin, K. A. (2004). A quantitative map of the circuit of cat primary visual cortex. J. Neurosci. 24, 8441–8453.
Butz, M., Worgotter, F., and van Ooyen, A. (2009). Activity-dependent structural plasticity. Brain Res. Rev. 60, 287–305.
Chagnac-Amitai, Y., Luhmann, H. J., and Prince, D. A. (1990). Burst generating and regular spiking layer V pyramidal neurons of rat neocortex have different morphological features. J. Comp. Neurol. 296, 598–613.
Charych, E. I., Li, R., Goldberg, J. S., Jornsten, R. J., Rongo, C., Zheng, J. Q., and Firestein, B. L. (2006). Identification and characterization of two novel splice forms of GRIP1 in the rat brain. J. Neurochem. 97, 884–898.
Cline, H., and Haas, K. (2008). The regulation of dendritic arbor development and plasticity by glutamatergic synaptic input: a review of the synaptotrophic hypothesis. J. Physiol. 586, 1509–1517.
Cline, H. T. (2001). Dendritic arbor development and synaptogenesis. Curr. Opin. Neurobiol. 11, 118–126.
DeFelipe, J., and Farinas, I. (1992). The pyramidal neuron of the cerebral cortex: morphological and chemical characteristics of the synaptic inputs. Prog. Neurobiol. 39, 563–607.
DeFelipe, J., and Jones, E. G. (1992). High-resolution light and electron microscopic immunocytochemistry of colocalized GABA and calbindin D-28k in somata and double bouquet cell axons of monkey somatosensory cortex. Eur. J. Neurosci. 4, 46–60.
Douglas, R. J., and Martin, K. A. (2004). Neuronal circuits of the neocortex. Annu. Rev. Neurosci. 27, 419–451.
Duan, H., Wearne, S. L., Rocher, A. B., Macedo, A., Morrison, J. H., and Hof, P. R. (2003). Age-related dendritic and spine changes in corticocortically projecting neurons in macaque monkeys. Cereb. Cortex 13, 950–961.
Eayrs, J. T., and Goodhead, B. (1959). Postnatal development of the cerebral cortex in the rat. J. Anat. 93, 385–402.
Feldman, M. L., and Peters, A. (1979). A technique for estimating total spine numbers on Golgi-impregnated dendrites. J. Comp. Neurol. 188, 527–542.
Franceschetti, S., Sancini, G., Panzica, F., Radici, C., and Avanzini, G. (1998). Postnatal differentiation of firing properties and morphological characteristics in layer V pyramidal neurons of the sensorimotor cortex. Neuroscience 83, 1013–1024.
Freund, T. F. (2002). Changes in the views of neuronal connectivity and communication after Cajal: examples from the hippocampus. Prog. Brain Res. 136, 203–213.
Fryer, R. H., Kaplan, D. R., Feinstein, S. C., Radeke, M. J., Grayson, D. R., and Kromer, L. F. (1996). Developmental and mature expression of full-length and truncated TrkB receptors in the rat forebrain. J. Comp. Neurol. 374, 21–40.
Gao, W. J., and Zheng, Z. H. (2004). Target-specific differences in somatodendritic morphology of layer V pyramidal neurons in rat motor cortex. J. Comp. Neurol. 476, 174–185.
Gupta, A., Wang, Y., and Markram, H. (2000). Organizing principles for a diversity of GABAergic interneurons and synapses in the neocortex. Science 287, 273–278.
Helmchen, F., Svoboda, K., Denk, W., and Tank, D. W. (1999). In vivo dendritic calcium dynamics in deep-layer cortical pyramidal neurons. Nat. Neurosci. 2, 989–996.
Hillman, E. D. (1979). “Neuronal shape parameters and substructures as a basis of neuronal form,” in The Neurosciences: Fourth Study Program, ed. F. Schmitt (Cambridge: MIT Press), 477–498.
Holtmaat, A., and Svoboda, K. (2009). Experience-dependent structural synaptic plasticity in the mammalian brain. Nat. Rev. Neurosci. 10, 647–658.
Inan, M., and Crair, M. C. (2007). Development of cortical maps: perspectives from the barrel cortex. Neuroscientist 13, 49–61.
Kasper, E. M., Larkman, A. U., Lubke, J., and Blakemore, C. (1994a). Pyramidal neurons in layer 5 of the rat visual cortex. I. Correlation among cell morphology, intrinsic electrophysiological properties, and axon targets. J. Comp. Neurol. 339, 459–474.
Kasper, E. M., Lubke, J., Larkman, A. U., and Blakemore, C. (1994b). Pyramidal neurons in layer 5 of the rat visual cortex. III. Differential maturation of axon targeting, dendritic morphology, and electrophysiological properties. J. Comp. Neurol. 339, 495–518.
Kim, H. G., and Connors, B. W. (1993). Apical dendrites of the neocortex: correlation between sodium- and calcium-dependent spiking and pyramidal cell morphology. J. Neurosci. 13, 5301–5311.
Koenderink, M. J., and Uylings, H. B. (1995). Postnatal maturation of layer V pyramidal neurons in the human prefrontal cortex. A quantitative Golgi analysis. Brain Res. 678, 233–243.
Koester, S. E., and O’Leary, D. D. (1992). Functional classes of cortical projection neurons develop dendritic distinctions by class-specific sculpting of an early common pattern. J. Neurosci. 12, 1382–1393.
Konur, S., and Yuste, R. (2004). Developmental regulation of spine and filopodial motility in primary visual cortex: reduced effects of activity and sensory deprivation. J. Neurobiol. 59, 236–246.
Larkman, A., and Mason, A. (1990). Correlations between morphology and electrophysiology of pyramidal neurons in slices of rat visual cortex. I. Establishment of cell classes. J. Neurosci. 10, 1407–1414.
Larkman, A. U. (1991a). Dendritic morphology of pyramidal neurones of the visual cortex of the rat: III. Spine distributions. J. Comp. Neurol. 306, 332–343.
Larkman, A. U. (1991b). Dendritic morphology of pyramidal neurones of the visual cortex of the rat: I. Branching patterns. J. Comp. Neurol. 306, 307–319.
Larkman, A. U. (1991c). Dendritic morphology of pyramidal neurones of the visual cortex of the rat: II. Parameter correlations. J. Comp. Neurol. 306, 320–331.
Larkum, M. E., Nevian, T., Sandler, M., Polsky, A., and Schiller, J. (2009). Synaptic integration in tuft dendrites of layer V pyramidal neurons: a new unifying principle. Science 325, 756–760.
Larkum, M. E., Zhu, J. J., and Sakmann, B. (1999). A new cellular mechanism for coupling inputs arriving at different cortical layers. Nature 398, 338–341.
Larkum, M. E., Zhu, J. J., and Sakmann, B. (2001). Dendritic mechanisms underlying the coupling of the dendritic with the axonal action potential initiation zone of adult rat layer V pyramidal neurons. J. Physiol. 533(Pt 2), 447–466.
Larsen, D. D., and Callaway, E. M. (2006). Development of layer-specific axonal arborizations in mouse primary somatosensory cortex. J. Comp. Neurol. 494, 398–414.
Lopez-Bendito, G., and Molnar, Z. (2003). Thalamocortical development: how are we going to get there? Nat. Rev. Neurosci. 4, 276–289.
Lorincz, A., Notomi, T., Tamas, G., Shigemoto, R., and Nusser, Z. (2002). Polarized and compartment-dependent distribution of HCN1 in pyramidal cell dendrites. Nat. Neurosci. 5, 1185–1193.
Lund, R. D., and Mustari, M. J. (1977). Development of the geniculocortical pathway in rats. J. Comp. Neurol. 173, 289–306.
Mainen, Z. F., and Sejnowski, T. J. (1996). Influence of dendritic structure on firing pattern in model neocortical neurons. Nature 382, 363–366.
Marin-Padilla, M. (1992). Ontogenesis of the pyramidal cell of the mammalian neocortex and developmental cytoarchitectonics: a unifying theory. J. Comp. Neurol. 321, 223–240.
Markram, H., Helm, P. J., and Sakmann, B. (1995). Dendritic calcium transients evoked by single back-propagating action potentials in rat neocortical pyramidal neurons. J. Physiol. 485(Pt 1), 1–20.
Markram, H., Lubke, J., Frotscher, M., Roth, A., and Sakmann, B. (1997). Physiology and anatomy of synaptic connections between thick tufted pyramidal neurones in the developing rat neocortex. J. Physiol. 500(Pt 2), 409–440.
Mason, A., and Larkman, A. (1990). Correlations between morphology and electrophysiology of pyramidal neurons in slices of rat visual cortex. II. Electrophysiology. J. Neurosci. 10, 1415–1428.
Mattila, P. K., and Lappalainen, P. (2008). Filopodia: molecular architecture and cellular functions. Nat. Rev. Mol. Cell Biol. 9, 446–454.
McAllister, A. K., Katz, L. C., and Lo, D. C. (1997). Opposing roles for endogenous BDNF and NT-3 in regulating cortical dendritic growth. Neuron 18, 767–778.
McAllister, A. K., Lo, D. C., and Katz, L. C. (1995). Neurotrophins regulate dendritic growth in developing visual cortex. Neuron 15, 791–803.
Miller, M. (1981). Maturation of rat visual cortex. I. A quantitative study of Golgi-impregnated pyramidal neurons. J. Neurocytol. 10, 859–878.
Miller, M., and Peters, A. (1981). Maturation of rat visual cortex. II. A combined Golgi-electron microscope study of pyramidal neurons. J. Comp. Neurol. 203, 555–573.
Molnar, Z., and Cheung, A. F. (2006). Towards the classification of subpopulations of layer V pyramidal projection neurons. Neurosci. Res. 55, 105–115.
Morishima, M., and Kawaguchi, Y. (2006). Recurrent connection patterns of corticostriatal pyramidal cells in frontal cortex. J. Neurosci. 26, 4394–4405.
Munoz-Cueto, J. A., Garcia-Segura, L. M., and Ruiz-Marcos, A. (1991). Regional sex differences in spine density along the apical shaft of visual cortex pyramids during postnatal development. Brain Res. 540, 41–47.
Murthy, V. N., Schikorski, T., Stevens, C. F., and Zhu, Y. (2001). Inactivity produces increases in neurotransmitter release and synapse size. Neuron 32, 673–682.
Nadarajah, B., and Parnavelas, J. G. (2002). Modes of neuronal migration in the developing cerebral cortex. Nat. Rev. Neurosci. 3, 423–432.
Nevian, T., Larkum, M. E., Polsky, A., and Schiller, J. (2007). Properties of basal dendrites of layer V pyramidal neurons: a direct patch-clamp recording study. Nat. Neurosci. 10, 206–214.
Nicolai, B. (1981). The postnatal development of the lamina V pyramidal cells in the temporal cortex of the albino rat. J. Hirnforsch. 22, 351–381.
Nicolelis, M. A., Chapin, J. K., and Lin, C. S. (1991). Ontogeny of corticocortical projections of the rat somatosensory cortex. Somatosens. Mot. Res. 8, 193–200.
Nicolelis, M. A., Dimitrov, D., Carmena, J. M., Crist, R., Lehew, G., Kralik, J. D., and Wise, S. P. (2003). Chronic, multisite, multielectrode recordings in macaque monkeys. Proc. Natl. Acad. Sci. U.S.A. 100, 11041–11046.
Niell, C. M., Meyer, M. P., and Smith, S. J. (2004). In vivo imaging of synapse formation on a growing dendritic arbor. Nat. Neurosci. 7, 254–260.
Nieuwenhuys, R. (1994). The neocortex. An overview of its evolutionary development, structural organization and synaptology. Anat. Embryol. (Berl) 190, 307–337.
Oray, S., Majewska, A., and Sur, M. (2006). Effects of synaptic activity on dendritic spine motility of developing cortical layer v pyramidal neurons. Cereb. Cortex 16, 730–741.
Peters, A., Palay, S. L., and Webster, H., (1991). The Fine Structure of the Nervous System: Neurons and their Supporting Cells. New York: Oxford University Press.
Petit, T. L., LeBoutillier, J. C., Gregorio, A., and Libstug, H. (1988). The pattern of dendritic development in the cerebral cortex of the rat. Brain Res. 469, 209–219.
Petreanu, L., Mao, T., Sternson, S. M., and Svoboda, K. (2009). The subcellular organization of neocortical excitatory connections. Nature 457, 1142–1145.
Pinsky, P. F., and Rinzel, J. (1994). Intrinsic and network rhythmogenesis in a reduced Traub model for CA3 neurons. J. Comput. Neurosci. 1, 39–60.
Polleux, F., Giger, R. J., Ginty, D. D., Kolodkin, A. L., and Ghosh, A. (1998). Patterning of cortical efferent projections by semaphorin-neuropilin interactions. Science 282, 1904–1906.
Polleux, F., Morrow, T., and Ghosh, A. (2000). Semaphorin 3A is a chemoattractant for cortical apical dendrites. Nature 404, 567–573.
Portera-Cailliau, C., Pan, D. T., and Yuste, R. (2003). Activity-regulated dynamic behavior of early dendritic protrusions: evidence for different types of dendritic filopodia. J. Neurosci. 23, 7129–7142.
Qi, H., Rand, M. D., Wu, X., Sestan, N., Wang, W., Rakic, P., Xu, T., and Artavanis-Tsakonas, S. (1999). Processing of the notch ligand delta by the metalloprotease Kuzbanian. Science 283, 91–94.
Schaefer, A. T., Larkum, M. E., Sakmann, B., and Roth, A. (2003). Coincidence detection in pyramidal neurons is tuned by their dendritic branching pattern. J. Neurophysiol. 89, 3143–3154.
Schikorski, T., and Stevens, C. F. (1997). Quantitative ultrastructural analysis of hippocampal excitatory synapses. J. Neurosci. 17, 5858–5867.
Schiller, J., Helmchen, F., and Sakmann, B. (1995). Spatial profile of dendritic calcium transients evoked by action potentials in rat neocortical pyramidal neurones. J. Physiol. 487(Pt 3), 583–600.
Schiller, J., Major, G., Koester, H. J., and Schiller, Y. (2000). NMDA spikes in basal dendrites of cortical pyramidal neurons. Nature 404, 285–289.
Schiller, J., Schiller, Y., Stuart, G., and Sakmann, B. (1997). Calcium action potentials restricted to distal apical dendrites of rat neocortical pyramidal neurons. J. Physiol. 505(Pt 3), 605–616.
Scott, J. P., Stewart, J. M., and De Ghett, V. J. (1974). Critical periods in the organization of systems. Dev. Psychobiol. 7, 489–513.
Sestan, N., Artavanis-Tsakonas, S., and Rakic, P. (1999). Contact-dependent inhibition of cortical neurite growth mediated by notch signaling. Science 286, 741–746.
Silberberg, G., and Markram, H. (2007). Disynaptic inhibition between neocortical pyramidal cells mediated by Martinotti cells. Neuron 53, 735–746.
Somogyi, P., and Klausberger, T. (2005). Defined types of cortical interneurone structure space and spike timing in the hippocampus. J. Physiol. 562(Pt 1), 9–26.
Somogyi, P., Tamas, G., Lujan, R., and Buhl, E. H. (1998). Salient features of synaptic organisation in the cerebral cortex. Brain Res. Brain Res. Rev. 26, 113–135.
Spencer, W. A., and Kandel, E. R. (1968). Cellular and integrative properties of the hippocampal pyramidal cell and the comparative electrophysiology of cortical neurons. Int. J. Neurol. 6, 266–296.
Spruston, N. (2008). Pyramidal neurons: dendritic structure and synaptic integration. Nat. Rev. Neurosci. 9, 206–221.
Stuart, G. J., Dodt, H. U., and Sakmann, B. (1993). Patch-clamp recordings from the soma and dendrites of neurons in brain slices using infrared video microscopy. Pflugers Arch. 423, 511–518.
Stuart, G. J., and Sakmann, B. (1994). Active propagation of somatic action potentials into neocortical pyramidal cell dendrites. Nature 367, 69–72.
Uylings, H. B., Ruiz-Marcos, A., and van Pelt, J. (1986). The metric analysis of three-dimensional dendritic tree patterns: a methodological review. J. Neurosci. Methods 18, 127–151.
Valverde, F. (1986). Intrinsic neocortical organization: some comparative aspects. Neuroscience 18, 1–23.
Vincze, A., Mazlo, M., Seress, L., Komoly, S., and ábrahám, H. (2008). A correlative light and electron microscopic study of postnatal myelination in the murine corpus callosum. Int. J. Dev. Neurosci. 26, 575–584.
Vizard, T. N., O’Keeffe, G. W., Gutierrez, H., Kos, C. H., Riccardi, D., and Davies, A. M. (2008). Regulation of axonal and dendritic growth by the extracellular calcium-sensing receptor. Nat. Neurosci. 11, 285–291.
Wang, Y., Markram, H., Goodman, P. H., Berger, T. K., Ma, J., and Goldman-Rakic, P. S. (2006). Heterogeneity in the pyramidal network of the medial prefrontal cortex. Nat. Neurosci. 9, 534–542.
Wang, Z., and McCormick, D. A. (1993). Control of firing mode of corticotectal and corticopontine layer V burst-generating neurons by norepinephrine, acetylcholine, and 1S,3R-ACPD. J. Neurosci. 13, 2199–2216.
Whitford, K. L., Dijkhuizen, P., Polleux, F., and Ghosh, A. (2002). Molecular control of cortical dendrite development. Annu. Rev. Neurosci. 25, 127–149.
Wise, S. P., Fleshman, J. W. Jr., and Jones, E. G. (1979). Maturation of pyramidal cell form in relation to developing afferent and efferent connections of rat somatic sensory cortex. Neuroscience 4, 1275–1297.
Wise, S. P., and Jones, E. G. (1976). Transneuronal or retrograde transport of (3H)adenosine in the rat somatic sensory system. Brain Res. 107, 127–131.
Wu, G. Y., Zou, D. J., Rajan, I., and Cline, H. (1999). Dendritic dynamics in vivo change during neuronal maturation. J. Neurosci. 19, 4472–4483.
Yacoubian, T. A., and Lo, D. C. (2000). Truncated and full-length TrkB receptors regulate distinct modes of dendritic growth. Nat. Neurosci. 3, 342–349.
Yoshihara, Y., De Roo, M., and Muller, D. (2009). Dendritic spine formation and stabilization. Curr. Opin. Neurobiol. 19, 146–153.
Yuan, L. L., and Chen, X. (2006). Diversity of potassium channels in neuronal dendrites. Prog. Neurobiol. 78, 374–389.
Yuste, R., and Bonhoeffer, T. (2004). Genesis of dendritic spines: insights from ultrastructural and imaging studies. Nat. Rev. Neurosci. 5, 24–34.
Yuste, R., Gutnick, M. J., Saar, D., Delaney, K. R., and Tank, D. W. (1994). Ca2+ accumulations in dendrites of neocortical pyramidal neurons: an apical band and evidence for two functional compartments. Neuron 13, 23–43.
Zhang, Z. W. (2004). Maturation of layer V pyramidal neurons in the rat prefrontal cortex: intrinsic properties and synaptic function. J. Neurophysiol. 91, 1171–1182.
Zhou, Z., Hong, E. J., Cohen, S., Zhao, W.-n., Ho, H.-y.H., Schmidt, L., Chen, W. G., Lin, Y., Savner, E., Griffith, E. C., Hu, L., Steen, J. A., Weitz, C. J., and Greenberg, M. E. (2006). Brain-specific phosphorylation of MeCP2 regulates activity-dependent Bdnf transcription, dendritic growth, and spine maturation. Neuron 52, 255–269.
Keywords: pyramidal cells, development, morphology, dendrites, axons, neocortex, spines, boutons
Citation: Romand S, Wang Y, Toledo-Rodriguez M and Markram H (2011) Morphological development of thick-tufted layer V pyramidal cells in the rat somatosensory cortex. Front. Neuroanat. 5:5. doi: 10.3389/fnana.2011.00005
Received: 18 October 2010;
Accepted: 19 January 2011;
Published online: 17 February 2011.
Edited by:
Kathleen S. Rockland, Massachusetts Institute of Technology, USACopyright: © 2011 Romand, Wang, Toledo-Rodriguez and Markram. This is an open-access article subject to an exclusive license agreement between the authors and Frontiers Media SA, which permits unrestricted use, distribution, and reproduction in any medium, provided the original authors and source are credited.
*Correspondence: Henry Markram, Laboratory of Neural Microcircuitry, Blue Brain Project, Ecole Polytechnique FÉdÉrale de Lausanne, CH-1015 Lausanne, Switzerland. e-mail:henry.markram@epfl.ch; Yun Wang, School of Optometry and Ophthalmology, Wenzhou Medical College, China; Neurology Research, Caritas St. Elizabeth’s Medical Center, Tufts University, USA. e-mail:yun.wang@tufts.edu
Disclaimer: All claims expressed in this article are solely those of the authors and do not necessarily represent those of their affiliated organizations, or those of the publisher, the editors and the reviewers. Any product that may be evaluated in this article or claim that may be made by its manufacturer is not guaranteed or endorsed by the publisher.
Research integrity at Frontiers
Learn more about the work of our research integrity team to safeguard the quality of each article we publish.