DiOlistic labeling of neurons in tissue slices: a qualitative and quantitative analysis of methodological variations
- Department of Neuroscience, University of Minnesota, Minneapolis, MN, USA
Fine neuronal morphology, such as dendritic spines, classically has been studied using the Golgi technique; however, Golgi staining is difficult to combine with other histological techniques. With the increasing popularity of fluorescent imaging, a number of fluorescent dyes have been developed that enable the coupling of multiple fluorescent labels in a single preparation. These fluorescent dyes include the lipophilic dialkylcarbocyanine, DiI; traditionally used for anterograde and retrograde neuronal tracing. More recently, DiI labeling has been used in combination with the Gene Gun for “DiOlistic” labeling of neurons in slice preparations. DiI sequesters itself within and diffuses laterally along the neuronal membrane, however once the cell is permeabilized, the DiI begins to leak from the cell membrane. A DiI derivative, Cell Tracker™ CM-DiI, increases dye stability and labeling half-life in permeabilized tissue, however at much greater expense. Here, the DiI and CM-DiI DiOlistic labeling techniques were tested in side-by-side experiments evaluating dye stability within dendritic architecture in medium spiny neurons of the dorsal stratum in both non-permeabilized and permeabilized tissue sections. In tissue sections that were not permeabilized, spine density in DiI labeled sections was higher than in CM-DiI labeling. In contrast, tissue sections that were permeabilized had higher spine densities in CM-DiI labeled neurons. These results suggest that for experiments involving non-permeabilized tissue, traditional DiI will suffice, however for experiments involving permeabilized tissue CM-DiI provides more consistent data. These experiments provide the first quantitative analyses of the impact of methodological permutations on neuronal labeling with DiI.
Introduction
For over a century, the “gold standard” for neuronal labeling and dendritic spine quantification has been the Golgi staining method. Golgi staining has allowed for great exploration and discovery into neuronal architecture and has played a central role in the advent of neurobiology. At the same time, Golgi staining has proven to be limited in that it is very difficult to combine it with other histological techniques. The lipophilic dialkylcarbocyanine, DiI, although traditionally used for anterograde and retrograde neuronal tracing, has proven to be a remarkably effective method of fluorescent, neuronal cell membrane labeling using a “DiOlistic” approach (Gan et al., 2000); a ballistic delivery of DiI coated micro-carriers to tissue slices. DiI is uniformly incorporated into the cellular membrane through lateral diffusion at rates of 0.2–0.6 μm/day in fixed tissue and even more rapidly in living tissue (Invitrogen product sheet, MP00282, June 25, 2008). When ballistically delivered to tissue sections or cell culture, individual DiI coated tungsten particles (micro-carriers) enter the soma, capturing the DiI in the neuronal membrane and permitting the DiI to diffuse along the membrane of a single neuron, beautifully illuminating the fine neuronal architecture of dendritic spines (Gan et al., 2000; Shen et al., 2008, 2009; Forlano and Woolley, 2010).
The disadvantage of DiI, however, is that once incorporated it may leak out of membranes. This is especially true if the target tissue is permeabilized, where the integrity of the cellular membrane is disrupted. This of course limits the flexibility and half-life of DiI for use with techniques that require permeabilization, such as immunofluorescence. To improve the water solubility and staining persistence after fixation and permeabilization, Molecular Probes developed the Cell Tracker™ CM-DiI which conjugates to thiol-containing proteins and peptides contained in the cell membrane. As a result of this conjugation, CM-DiI is retained in the cell membrane throughout fixation, permeabilization, and embedding procedures (Brandt et al., 1995; Andrade et al., 1996). Because CM-DiI is approximately 100 times more expensive than DiI, it is useful to determine whether permeabilization and imaging parameters of a given protocol require the use of CM-DiI rather than traditional DiI.
The present study describes a side-by-side comparison of DiI vs. CM-DiI using a DiOlistic labeling technique under various fixation and permeabilization conditions to evaluate dye incorporation and integrity within neuronal membranes, specifically dendritic arbors and dendritic spines. By evaluating DiI and CM-DiI incorporation and integrity under matched conditions, it is possible to determine under which experimental conditions the additional cost of CM-DiI may become necessary. Neely et al. (2009) have published a nice set of protocols that offer conditions for combining DiOlistic labeling with immunocytochemistry and fluorescent tract tracing. The effectiveness of these methods is presented visually, though the power of DiOlistic labeling is in quantitative measurements of the fine structure of dendrites, especially spines. Here we compare the impact of procedural variations in DiOlistic labeling using both DiI and CM-DiI on neuronal morphology, emphasizing quantitative analyses of these variations in protocol on resultant spine densities and morphology.
Materials and Methods
Animals
Adult female Syrian hamsters (Charles Rivers Laboratories, Wilmington, MA, USA) were individually housed in polycarbonate cages and kept under a 14:10 light:dark cycle, with lights out at 13:00 hours. Food and water were available to the animals ad libitum. For ballistic labeling of neurons, the animals were anesthetized with an ip injection of 0.2 ml Sleepaway (26% sodium pentobarbital, 7.8% isopropyl alcohol, 20.7% propylene glycol, distilled water; Fort Dodge Animal Health, Fort Dodge, IA, USA) and transcardially perfused with 25 mM phosphate buffered saline (PBS, pH = 7.2) for 3 min at a flow rate of 25 ml/min, followed by 1.5 or 4% paraformaldehyde in 25 mM PBS for 20 min. All animal procedures were in accordance with the National Institutes of Health Guidelines for the Care and Use of Laboratory Animals and approved by the University of Minnesota IACUC.
Tissue Preparation
After perfusion, brains were removed, blocked coronally at the level of the cerebellum and post-fixed for 1 h in 1.5 or 4% paraformaldehyde in PBS. Brains were Vibratome (Lancer Series 1000, St. Louis, MO, USA) sectioned in 150 or 300 μm serial, coronal sections through the nucleus accumbens. Sections were placed in 25 mM PBS until labeled with DiI.
Preparation of DiI/CM-DiI-Coated “Bullets”
Coating of particles with lipophilic dye DiI was adapted from methods described elsewhere (Gan et al., 2009). Briefly, 2 mg of the carbocyanine fluorescent dyes, DiI, or CM-DiI (Molecular Probes, Carlsbad, CA, USA), was dissolved in 75 μl methylene chloride and applied to 90 μg of 1.3 μm tungsten particles (Bio-Rad, Hercules, CA, USA) spread evenly on a glass slide. Tungsten particles were allowed to dry, then were scraped from the slide and collected into 10 ml of 10 mg/ml polyvinylpyrrolidone (PVP; Sigma-Aldrich, St. Louis, MO, USA) dissolved in deionized water. The suspension was sonicated for 10 min with intermittent vortexing. Tefzel tubing (Bio-Rad) was pre-coated with 10 mg/ml PVP and dried under 0.4 liters per minute (LPM) nitrogen gas flow. The DiI or CM-DiI/PVP suspension was quickly drawn into the Tefzel tubing and allowed to settle for 3 min. The PVP solution was withdrawn slowly from the tubing making certain not to disturb the tungsten. The Tefzel tubing was slowly rotated 360° and dried for 20 min under 0.4 LPM nitrogen gas flow. After drying, the tubing was cut into 1.3 mm segments (bullets) and stored desiccated at 4°C in the dark until use.
Delivery of DiI/CM-DiI-Coated Tungsten Particles
A Helios Gene Gun (Bio-Rad) with a modified barrel (O’Brien et al., 2001) was used for delivery of DiI/CM-DiI-coated tungsten particles. Spacers were attached to the modified barrel to establish a consistent distance between the Gene Gun and brain. A 70-μm nylon mesh filter (Plastok Associates Ltd., Birkenhead, Merseyside, UK) was secured at the head of the barrel to prevent large clusters of tungsten particles from reaching the tissue. The Gene Gun was loaded with either the DiI or CM-DiI “bullets.” Immediately prior to labeling, PBS was removed from the well containing the sections. Ten, 20, 30, and 40 mm spacers were each tested at 75, 100, 125, 150, 175, and 200 pounds per square inch (PSI) for delivery of DiI coated tungsten particles, with one bullet shot per brain section. Combinations of spacing and helium pressure were evaluated to determine an optimal distance/pressure combination that resulted in sufficient penetration of DiI/CM-DiI into the tissue without causing damage to the tissue section. Labeled sections were re-suspended in PBS and dye was allowed to diffuse through neuronal membranes for 4, 8, 12, 24, or 48 h in the dark at room temperature or 4°C. Slices were post-fixed for 1 h in 4% paraformaldehyde in PBS, and then placed in PBS until mounted on Superfrost slides (Brain Research Laboratories, Newton Highlands, MA, USA) using 5% n-propyl-gallate in glycerin. Coverslips were sealed to prevent dehydration of tissue.
Immunofluorescence
After DiI/CM-DiI labeling, tissue sections that underwent immunofluorescence labeling were permeabilized in 0.3, 0.1, or 0.01% Triton-X in PBS for 15 min. Sections were blocked in 0.01% Triton-X, 10% BSA in PBS for 30 min. Following blocking, sections were incubated with anti-Human Neuronal Protein HuC/HuD (10 μg/ml, Molecular Probes, Carlsbad, CA, USA) overnight at 4°C and then overnight at room temperature (48 h total). Sections were washed three times in 0.1% BSA in PBS. Sections were incubated in an anti-mouse biotinylated secondary (1:500, Vector Laboratories, Burlingame, CA, USA) with 0.1% BSA in PBS for 1 h at room temperature, followed by three washes in 0.1% BSA in PBS. Following washes, sections were incubated with a streptavidin conjugated Alexa Fluor 488 (1:100, Invitrogen, Carlsbad, CA, USA) with 0.1% BSA in PBS for 30 min at room temperature. Sections were washed three times in 0.1% BSA in PBS, mounted on Superfrost slides and coverslipped using 5% n-propyl-gallate in glycerin. Coverslips were sealed to prevent dehydration of tissue.
Confocal Imaging
A Leica TCS SPE confocal microscope (Leica, Mannheim, Germany) was used to image DiI impregnated cells. DiI was imaged with excitation and emission specified to the manufacturer’s spectral characteristics (Molecular Probes, Carlsbad, CA, USA). The complete dendritic profile of each DiI impregnated neuron was captured using a 20× lens and XY pixel distribution of 512 × 512 at a frequency of 400 Hz. The neuron was scanned at 1.0 μm increments along the Z-axis and reconstructed using Leica LAS AF software to determine distance from the soma to the branch level of target dendrites prior to dendrite/spine imaging. Imaged dendritic segments of medium spiny neurons from the nucleus accumbens core (NAc Core), shell (NAc Shell), and caudate/putamen (CPu) were 70–200 μm from the soma (Shen et al., 2009). After distance from soma was determined, magnification was increased to 63× oil immersion. Frame size was maintained at 512 × 512 and an optical zoom of 5.61 was utilized to allow for maximum distribution of pixel size (60 nm) to tissue dimensions (60.91 nm) without over sampling. Z-stacks of dendritic segments were taken at 0.12 μm steps, with a maximum of 200 steps. Images of three DiI impregnated cells were captured per brain region (NAc Shell, NAc Core, CPu) per animal, as well as three high power dendritic segments from each cell, yielding a total of nine dendritic segments per brain region. Images were captured for both DiI and CM-DiI immediately and 2 weeks following tissue impregnation.
Quantitation and Analysis of Dendritic Spine Density and Spine Head Morphology
Dendritic Z-stacks were reconstructed using the Surpass module of the Imaris software package (Version 7.0, Bitplane Inc., St. Paul, MN, USA). Dendritic shafts and spines were manually traced in the XY plane using the Auto Depth function of the Filament module. After tracing, accurate reconstruction of the diameter of the dendritic shaft, spine neck, and head was made possible using the diameter function with a contrast threshold of 0.7. Spine head classifications of stubby, filopodial, long thin, and mushroom were completed through the Classify Spines wizard in the Imaris software package. Criteria for spine head classifications have been described elsewhere (Harris et al., 1992; McKinney et al., 1999).
Data Analysis
Spine density was calculated by summing the total number of spines per dendritic segment length and calculating average number of spines/10 μm. These values were then averaged to yield the number of spines/10 μm for each animal. Student’s t-test was used to evaluate statistical differences between treatment groups.
Total spine population and counts of each spine class (stubby, filopodial, long thin, and mushroom) were summed for each treatment group. A χ2 test was used to determine significant differences in spine morphology.
Results
Qualitative Observations
Optimization of tissue preparation for use with DiI or CM-DiI
Perfusion with 1.5% paraformaldehyde allowed DiI coated tungsten particles to penetrate cell somas, resulting in crisp visualization of DiI through the cell membrane. Tissue collected from animals perfused with 4% paraformaldehyde resulted in diffuse background fluorescence of the entire tissue slice without clear illumination of individual soma or dendritic arborizations (data not shown). Dendritic labeling was observed in both 150 and 300 μm tissue sections indicating effective penetration of DiI coated tungsten particles in slices of varying thicknesses. Based on the results from these early experiments, all further experiments reported were conducted under transcardial perfusion conditions with 1.5% paraformaldehyde.
Optimization of DiI/CM-DiI-coated tungsten particles delivery
Previous experiments conducted in our laboratory using the Helios Gene Gun (Bio-Rad) without the modified barrel resulted in poor tissue penetration with very low DiI labeling efficiency. Consistent with earlier reports of tissue penetration (O’Brien et al., 2001), when used with the modified barrel, bullets from the same batch preparation resulted in excellent labeling efficiency and tissue penetration. Combinations of 10, 20, and 30 mm spacers with 75, 100, 125, 150, 175, and 200 PSI helium delivery resulted in an unacceptable level of tissue damage. The combination of the 40-mm spacer with 100 PSI helium pressure yielded even distribution of DiI coated tungsten particles across the tissue, with sufficient penetration into the tissue allowing for illumination of complete dendritic arbors. The thicker 300 μm sections were not disturbed by the pressure of delivery of tungsten particles whereas the positioning of 150 μm sections was disrupted in the dish and occasionally tore during DiI delivery. The 300-μm sections also appeared to have a greater number of completely filled cells (including full dendritic arborizations) throughout the tissue slices.
Early experiments aimed to elucidate optimal conditions for effective DiI labeling. Diffusion of DiI was evaluated at 4, 8, 12, 24, and 48 h and qualitative analysis of neuronal fluorescence intensity, background fluorescence, and dendritic arborization length were documented. Observations indicated that 4–12 h of diffusion was insufficient to completely fill dendritic arborizations. Diffusion conditions 24 h and longer, either in the dark or under ambient light conditions, or at room temperature or 4°C, were sufficient to illuminate complete dendritic arborizations. Although the aforementioned conditions were sufficient, differences in fluorescent intensity of the cell soma and fine structures of dendritic arborizations and spines were noted between tissues incubated at room temperature vs. 4°C, with brighter fluorescent labeling observed in tissue incubated at room temperature. Finally, allowing DiI to diffuse for 24 h in the dark (at room temperature) resulted in the lowest background fluorescence when compared to tissue slices that were incubated under similar conditions for 48 h. These results indicate that diffusion in the dark at room temperature for 24 h is optimal for DiI diffusion.
Combining DiI or CM-DiI with immunofluorescence
Initial permeabilization with 0.01% Triton-X 100 in PBS was insufficient to allow immunocytochemical visualization with fluorescent labeling. Treatment with either 0.3 or 0.1% Triton-X 100 produced good tissue permeabilization, however, in tissue sections treated with 0.3% Triton-X 100 the DiI appeared to “leak” from the cell membrane during diffusion, resulting in lower fluorescent intensity of the cell membrane and higher background fluorescence. Therefore initial permeabilization using 0.1% Triton-X 100 was used for subsequent experiments. It is important to note that when coupling the DiI technique with immunofluorescence, only the 150-μm sections resulted in visible antibody labeling suggesting that there was inadequate reagent penetration in the 300-μm sections.
Quantitative Analysis
Comparison of DiI vs. CM-DiI integrity in non-permeabilized tissue
Images of whole cells and dendritic segments were captured for tissues treated with both DiI and CM-DiI immediately following tissue mounting and 2 weeks following tissue mounting to evaluate the stability and integrity of the two dyes in non-permeabilized tissue sections. In these sections, there was no qualitative difference between field views of tissues treated with DiI vs. CM-DiI (data not shown). Whole cell imaging of non-permeabilized DiI and CM-DiI treated tissue sections demonstrates that, whether imaged immediately following mounting or 2 weeks following mounting, dye integrity and therefore image quality, appears to remain intact (Figure 1). No significant differences were observed under oil immersion imaging (63×) of non-permeabilized dendritic segments from DiI and CM-DiI treated tissues (Figure 2). Spine density of dendritic segments was analyzed in the DiI and CM-DiI treated tissues to investigate dye stability and integrity over time. No significant differences in spine density were observed between DiI treated tissues imaged immediately following mounting or 2 weeks following tissue mounting (Figure 3A). Interestingly, significant increases in spine density were observed among images captured from CM-DiI treated tissues 2 weeks following tissue mounting (t(16) = 2.145, p < 0.05, two tailed; Figure 3B), potentially as a result of increased CM-DiI labeling. Images of dendritic segments were further analyzed to investigate potential differences in the manner in which DiI or CM-DiI filled dendritic segments and spines. When compared to DiI treated tissues, significant decreases in spine density were observed in CM-DiI tissues from images captured immediately following tissue mounting (t(16) = 2.186, p < 0.05, two tailed; Figure 3C), however these differences were no longer present 2 weeks after tissue mounting (Figure 3D). Table 1 provides the numeric values for the graphs in Figure 3. In addition to spine density, spine morphology was also analyzed in an effort to determine dye integrity of DiI and CM-DiI over time in fine dendritic structures. Spines were classified into one of four morphological subtypes: stubby, filopodial, long thin, and mushroom. Despite significant differences in spine density present in tissue sections imaged immediately following mounting between DiI and CM-DiI groups, no significant differences in the distribution of spine morphologies were observed in any of the comparisons made (Figures 4A–D).
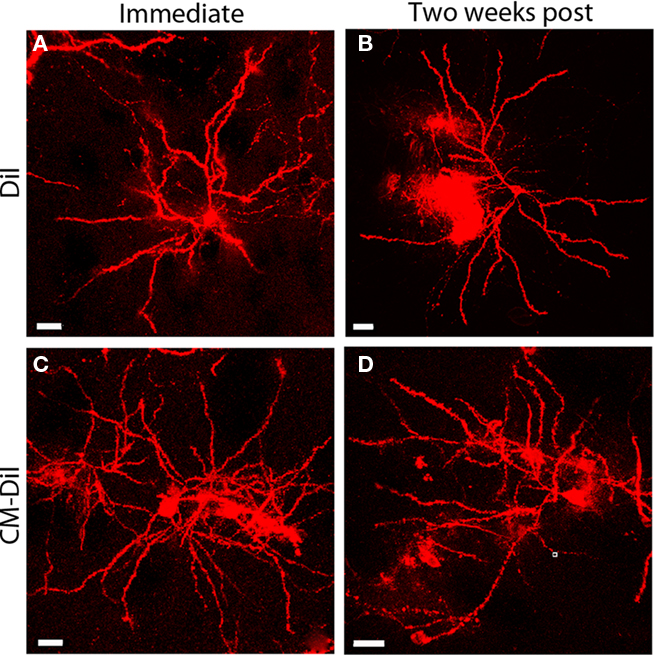
Figure 1. Whole cell images of non-permeabilized DiI and CM-DiI labeled tissues. DiI labeled cell imaged (A) immediately or (B) 2 weeks following tissue mounting. CM-DiI labeled cell imaged (C) immediately or (D) 2 weeks following tissue mounting. Images illustrate micro-carrier clumps commonly seen with DiOlistic labeling. Scale bar is 20 μm.
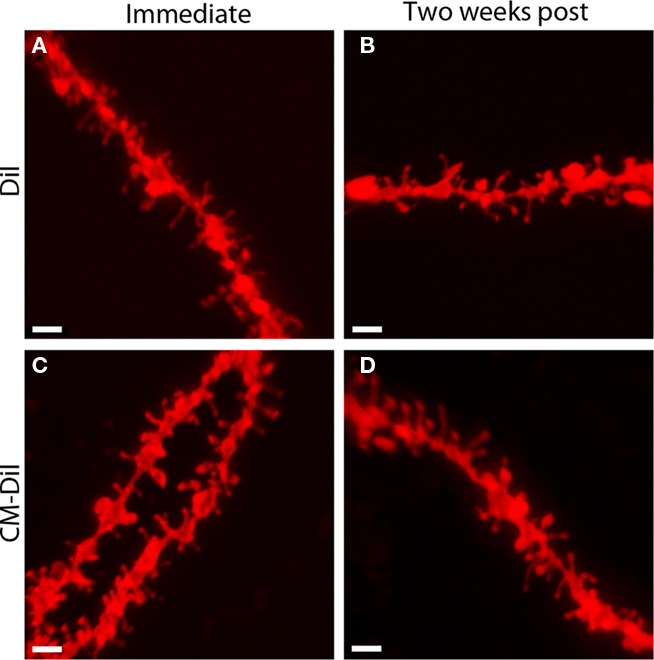
Figure 2. Images of non-permeabilized dendritic segments, labeled with either DiI or CM-DiI. DiI labeled dendritic segment imaged (A) immediately or (B) 2 weeks following tissue mounting. CM-DiI labeled dendritic segment imaged (C) immediately or (D) 2 weeks following tissue mounting. Scale bar is 2 μm.
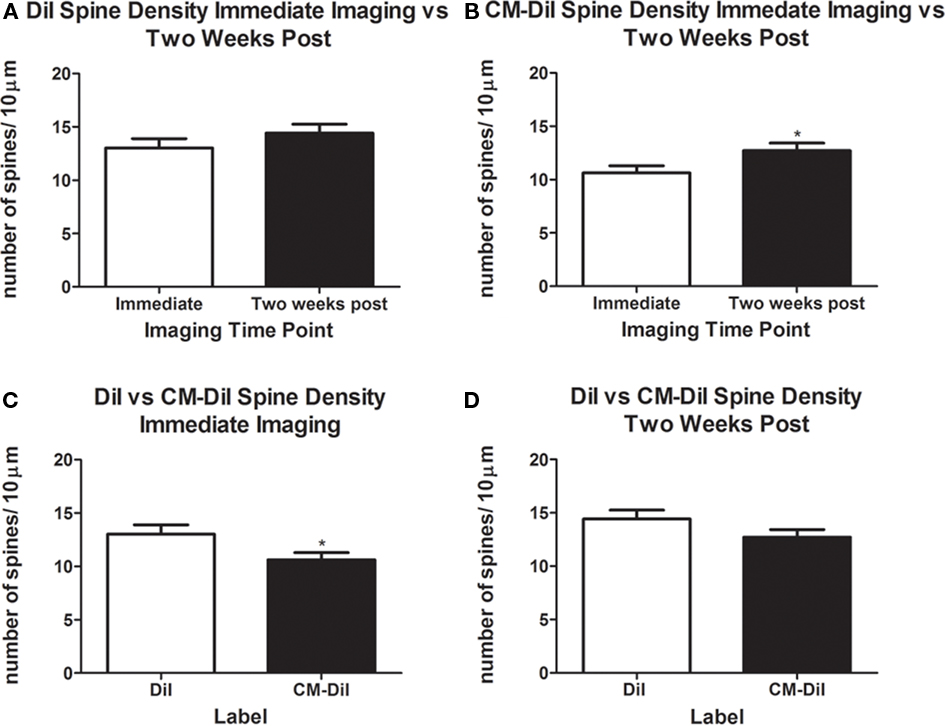
Figure 3. Spine density analysis of non-permeabilized DiI and CM-DiI treated tissues. (A) No significant differences were observed in spine density of DiI treated tissue from images captured immediately or 2 weeks following tissue mounting. (B) Significantly higher spine densities in CM-DiI treated tissue were observed 2 weeks following mounting compared with dendrites imaged immediately (*p < 0.05). (C) Non-permeabilized CM-DiI treated tissues had a significantly lower spine density than non-permeabilized DiI treated tissue immediately following tissue mounting (*p < 0.05). (D) Two weeks following tissue mounting, no significant differences in spine density were observed between DiI and CM-DiI treated tissues.
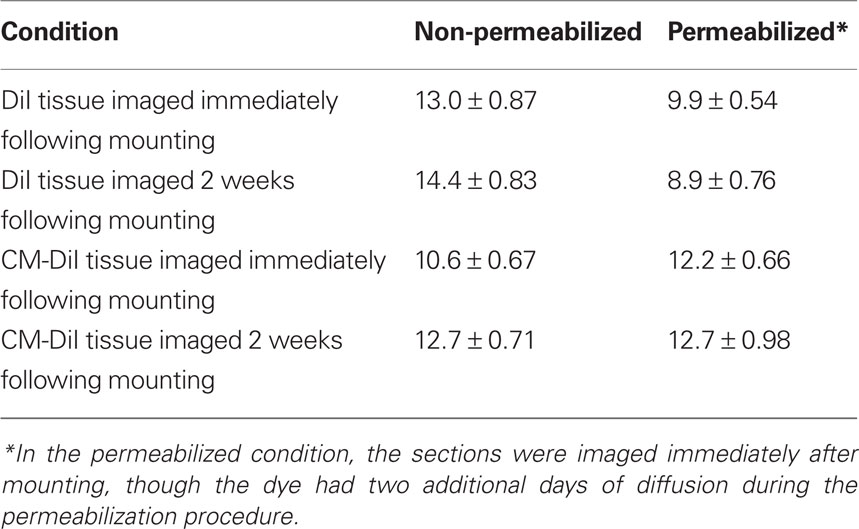
Table 1. Spine densities (mean ± SE) for the different procedural conditions graphed in Figures 3 and 8.
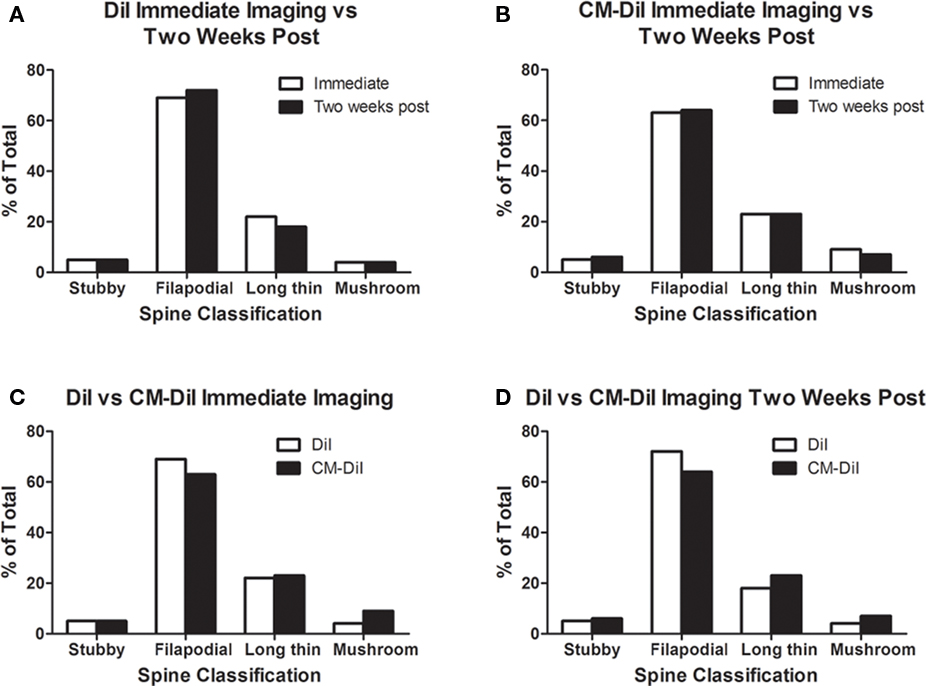
Figure 4. Spine morphology analysis of DiI and CM-DiI treated tissues. (A,B) No significant differences in spine morphology were observed in DiI or CM-DiI treated tissues of non-permeabilized tissues between images captured immediately or 2 weeks following mounting. (C,D) No significant differences in spine morphology were observed between DiI and CM-DiI treated tissues of non-permeabilized tissues imaged either immediately or 2 weeks following tissue mounting.
Comparison of DiI vs. CM-DiI integrity in permeabilized tissue
As with non-permeabilized tissue, images of whole cells and dendritic segments from permeabilized tissues were captured for both DiI and CM-DiI treated tissues immediately following tissue mounting and 2 weeks following tissue mounting to evaluate the stability and integrity of the two dyes. Immediate imaging of permeabilized tissue indicated that DiI and CM-DiI labeled neuronal arborizations in a similar manner in 0.1% Triton-X 100 treated tissue, without loss of fluorescent intensity (Figures 5A,B). Furthermore, permeabilization, as indicated by uniform antibody labeling, occurred throughout the tissue, and was not impacted by DiI variations (Figures 5C,D). These data also demonstrate that both DiI and CM-DiI can be coupled with immunofluorescent labeling and successfully imaged immediately following tissue mounting (Figures 5E,F).
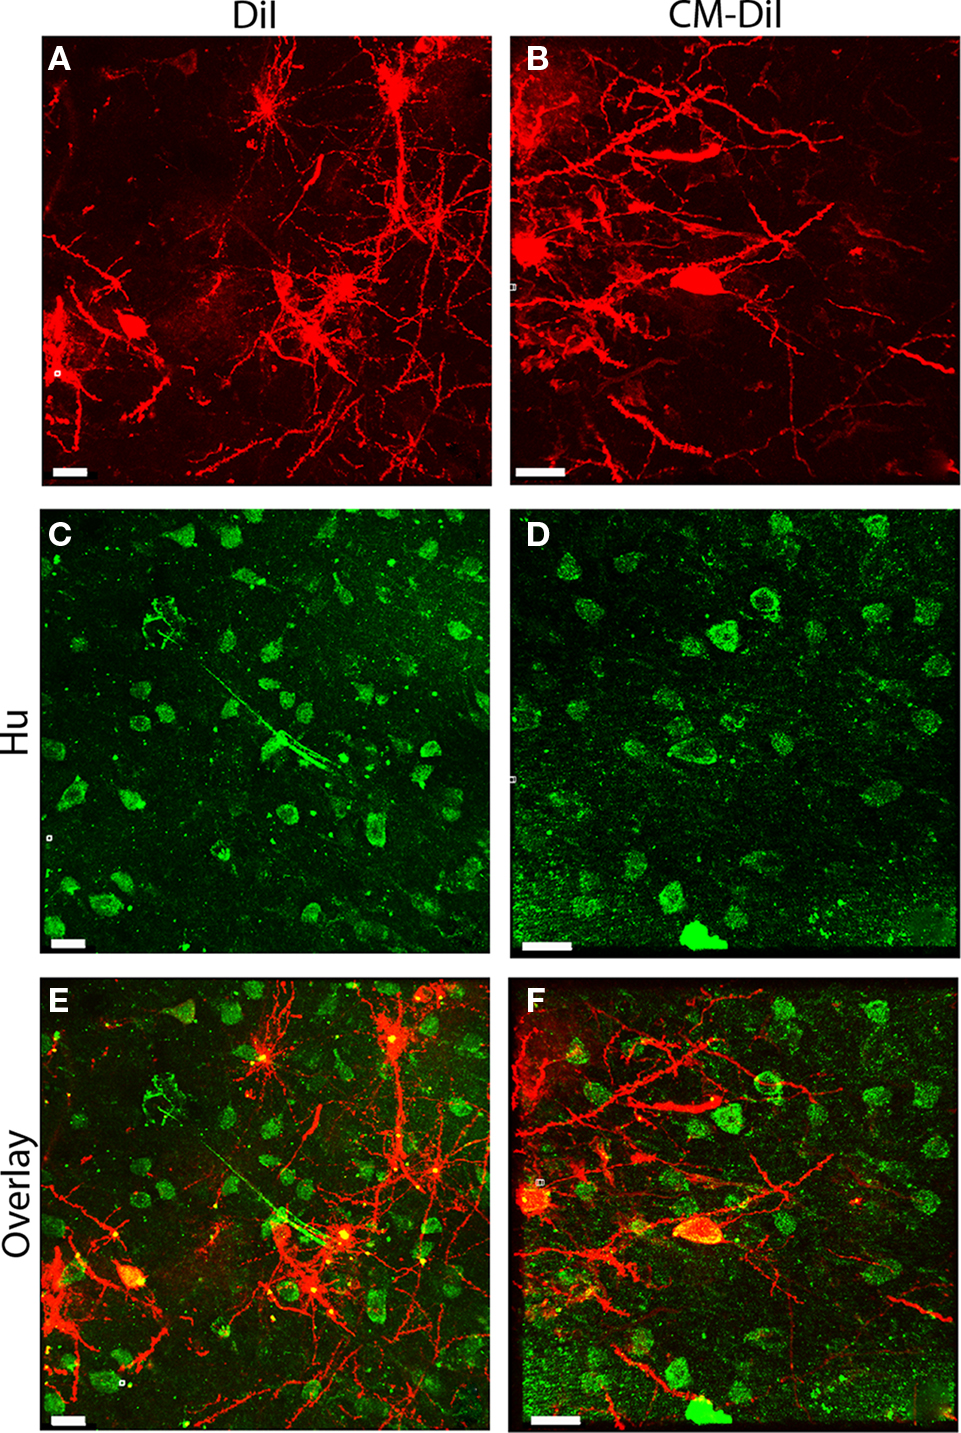
Figure 5. Immunofluorescent labeling can be combined with DiI and CM-DiI labeling. (A) Permeabilized DiI treated tissue. (C) Permeabilized Hu stained tissue from the same field shown in (A). (E) Overlay of (A,C) demonstrating co-localization of DiI and immunofluorescent Hu signal (yellow). (B) Permeabilized CM-DiI treated tissue. (D) Permeabilized Hu stained tissue from the same field shown in (B). (F) Overlay of (B,D) demonstrating co-localization of CM-DiI and immunofluorescent Hu signal (yellow). Scale bar is 20 μm.
Comparing whole cell images of DiI and CM-DiI indicates that when imaged immediately following mounting, no qualitative differences were observed between the two types of dye (Figures 6A,B). High power imaging (63× oil immersion) of dendritic segments reinforced this observation (Figures 7A,B). However, when assessing the long term stability of DiI vs. CM-DiI in permeabilized tissue 2 weeks after mounting, there was a greater stability of the CM-DiI label in both whole cells and dendritic segments, judged by fluorescent signal, photo-bleaching, and final image quality (Figures 6C,D and 7C,D).
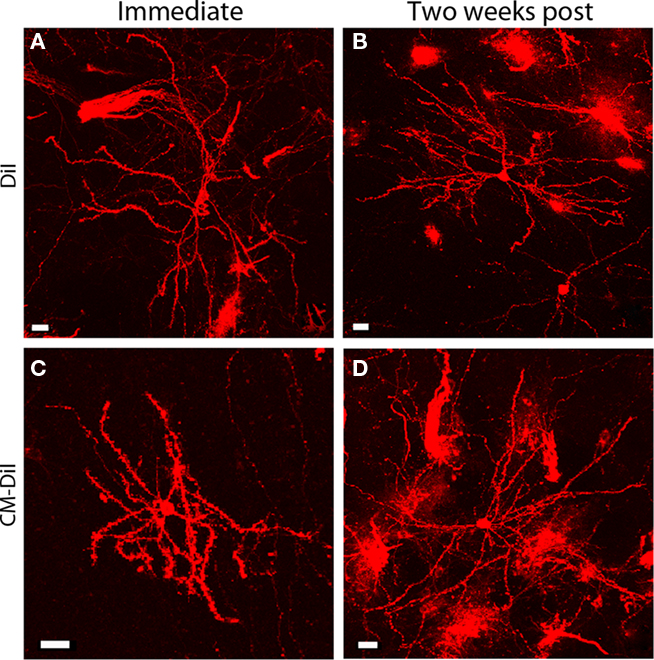
Figure 6. Whole cell images of permeabilized DiI and CM-DiI labeled tissues. DiI labeled cell imaged (A) immediately or (B) 2 weeks following tissue mounting. Permeabilized CM-DiI labeled cell imaged (C) immediately or (D) 2 weeks following tissue mounting. Images illustrate micro-carrier clumps and the axonal labeling occasionally seen with DiOlistic labeling. Scale bar is 20 μm.
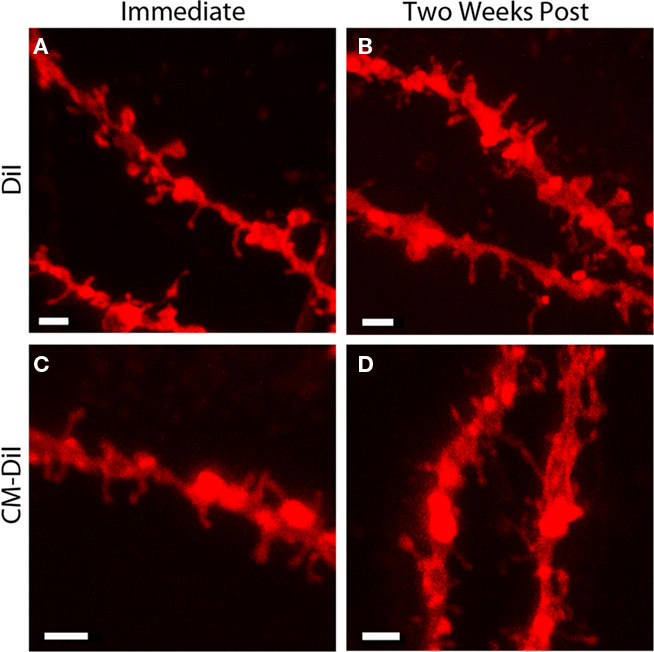
Figure 7. Images of permeabilized dendritic segments, labeled with either DiI or CM-DiI. DiI labeled dendritic segment imaged (A) immediately or (B) 2 weeks following tissue mounting. CM-DiI labeled dendritic segment imaged (C) immediately or (D) 2 weeks following tissue mounting. For both DiI (B) and CM-DiI (D) dendritic segments, qualitative degradation of image quality is apparent 2 weeks following tissue mounting. Scale bar is 2 μm.
Spine density and spine morphology were also analyzed in the permeabilized tissues. Within dye treatment groups (DiI immediate vs. 2 weeks post-mounting and CM-DiI immediate vs. 2 weeks post-mounting), no significant differences were observed between images captured immediately following tissue mounting and those captured 2 weeks after mounting (Figures 8A,B). However, tissue labeled with CM-DiI yielded significantly higher spine densities when compared to DiI, both immediately (t(16) = 2.782, p < 0.05, two tailed) and 2 weeks following mounting (t(16) = 3.040, p < 0.01, two tailed; Figures 8C,D). Please see Table 1 for means and SE associated with Figure 8. Nonetheless, no significant differences in the composition of spine morphologies were observed in any of the comparisons made (Figures 9A–D).
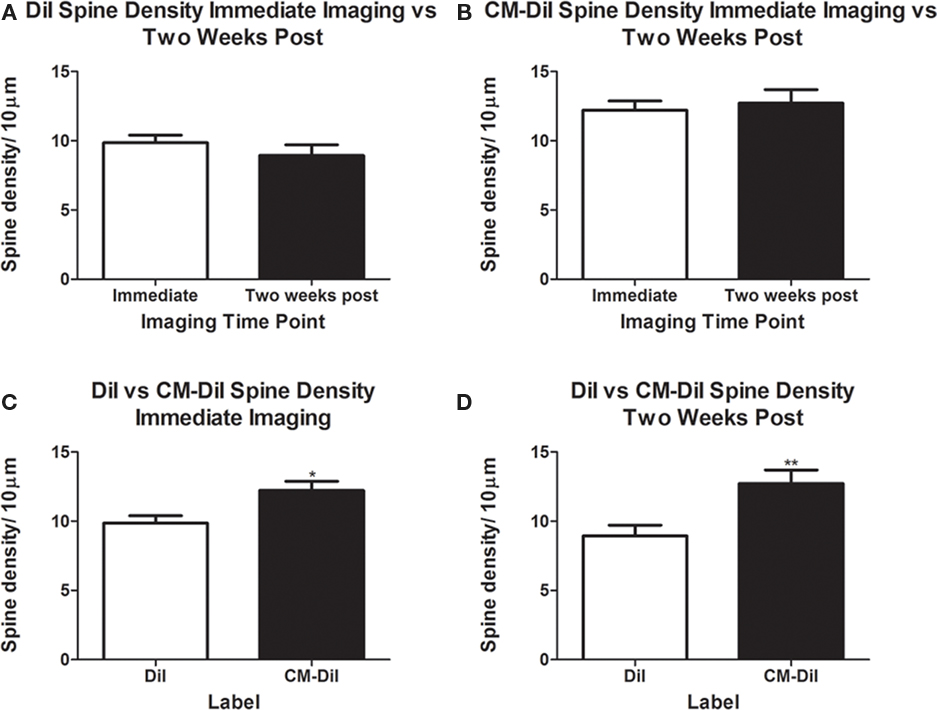
Figure 8. Spine density analysis of permeabilized dendritic segments. CM-DiI yields significantly higher spine density measurements both immediately and 2 weeks following imaging when compared to DiI treated tissues. (A,B) No significant differences in spine density were observed in DiI or CM-DiI treated tissues when imaged either immediately or 2 weeks following mounting. (C,D) CM-DiI treated tissues yielded significantly higher spine densities when compared to DiI treated tissues at both immediate imaging (*p < 0.05) and imaging 2 weeks following mounting (**p < 0.01).
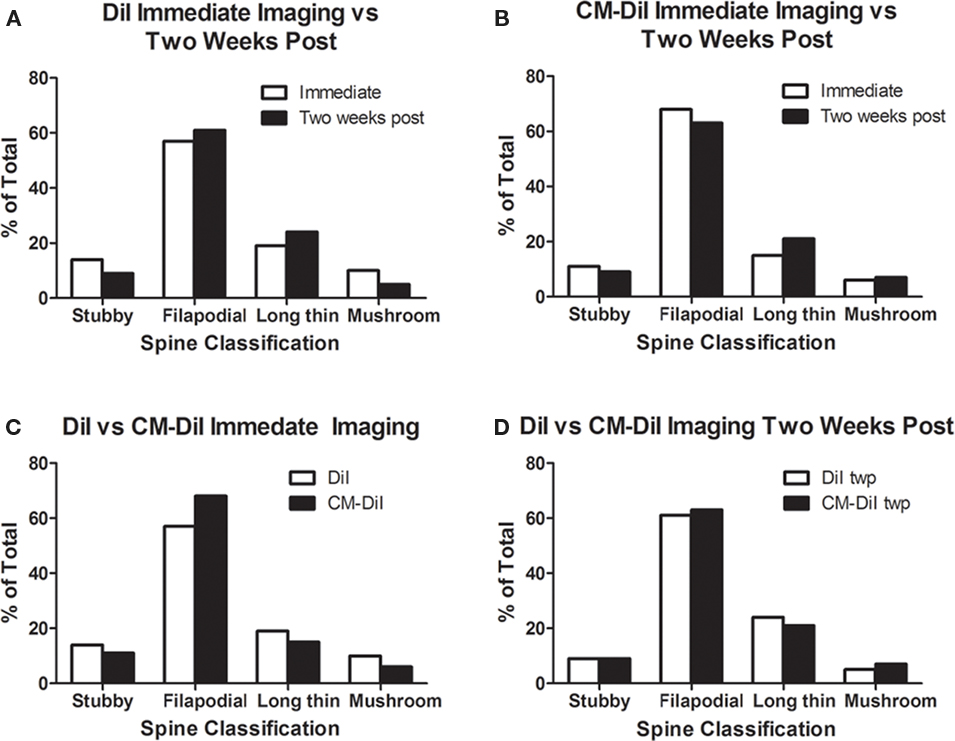
Figure 9. Spine morphology analysis of permeabilized DiI and CM-DiI treated tissues. (A,B) No significant differences in spine morphology were observed in DiI or CM-DiI treated tissues of permeabilized tissues between images captured immediately or 2 weeks following mounting. (C,D) No significant differences in spine morphology were observed between DiI and CM-DiI treated tissues of permeabilized tissues either immediately or 2 weeks following tissue mounting.
Discussion
DiOlistic labeling is an effective means of illuminating neuronal morphology of individual neurons, including soma, dendritic arborizations, and spines in cell culture and tissue sections (Gan et al., 2000, 2009; Shen et al., 2009; Staffend et al., 2011). This method has become increasingly popular, however reported protocols differ in conditions for cell/tissue fixation, type of dye used, dye delivery, and diffusion times, with no report on the impact these different conditions have on the quality of labeling. This is especially true with respect to quantitative evaluation of fine neuronal structures such as dendritic spines. Therefore, we executed DiOlistic labeling of tissue slices with two common variations of dyes, DiI and CM-DiI, under a variety of fixation, delivery, and diffusion conditions to determine which of these provide optimal labeling of individual neuronal cell bodies and processes. Further, as one of the benefits of this method is its potential for combination with other histological labeling procedures we evaluated the impact of permeabilization on labeling quality with both DiI and CM-DiI.
Optimization of Tissue Preparation
Amid the DiOlistic literature, a variety of fixation conditions are reported. Standard perfusion protocols report the use of 4% paraformaldehyde for transcardial perfusions; in DiOlistic protocols both 4 and 1.5% paraformaldehyde fixation is reported. To investigate this apparent discrepancy, we ran side-by-side experiments using both 4 and 1.5% paraformaldehyde. Consistent with previous reports (Neely et al., 2009), we found that the milder fixation condition of 1.5% paraformaldehyde resulted in superior DiI labeling when compared to their 4% paraformaldehyde counterpart. In our hands, conditions resulting from 1.5% transcardial perfusion were necessary for clear DiI impregnation into tissue of either 150 or 300 μm section thickness. DiI labeling of tissues fixed with 4% paraformaldehyde resulted in diffuse, indiscriminate labeling and extremely high background, regardless of whether the tissue section was 150 or 300 μm thick. Based on our experience, we are surprised that fixation with 4% paraformaldehyde prior to labeling with DiI has been reported successfully by other groups (Gan et al., 2000; Moolman et al., 2004; Oberheim et al., 2008; Yu et al., 2009; Cui et al., 2010; Li et al., 2010). We can imagine that different combinations of aldehyde concentration and fixation durations could produce acceptable results. Still, our recommendation is that initial fixation with 1.5% paraformaldehyde generates the most consistent and superior results.
Optimization of DiI Delivery
Gold or tungsten particles (“micro-carriers”) can be coated with the carbocyanine dye of choice at varying concentrations. Based on our reading of the literature, either of these micro-carriers may be used with appropriate amounts of DiI to effectively label neurons of culture or slice. Our choice of tungsten over gold was simply based on economy, as the tungsten particles are more inexpensive. The pressure and distance under which the micro-carriers are delivered to the tissue are less forgiving, leading to reports of having to “shoot” the tissue of interest multiple times to obtain necessary densities of DiI labeling (Gan et al., 2000; Moolman et al., 2004). Wide ranges of helium pressure and spacing between the gene gun and the tissue section are also reported (Neely et al., 2009; Forlano and Woolley, 2010; Seabold et al., 2010). More unfortunate is the tendency of many articles to completely omit details of pressure (Pignatelli and Marshall, 2010) or delivery distance (Moolman et al., 2004; Oberheim et al., 2008; Shen et al., 2009). Therefore, our goal was to establish a delivery protocol that could be executed consistently by establishing clear, defined parameters of delivery of DiI coated micro-carriers. Consistent with previous reports (O’Brien et al., 2001), we found that delivery of DiI coated tungsten particles using the standard configuration of the Helios Gene Gun (Bio-Rad) resulted in inconsistent and poor labeling of our neuronal tissue slices and an unacceptable level of tissue damage. Therefore, we used the recommended modified barrel to improve the depth of tissue penetration and consistency of DiI labeling while reducing tissue damage (O’Brien et al., 2001).Various combinations of pressure and spacing were evaluated. It was determined that the use of the 40-mm spacer under 100 PSI helium pressure produced consistent DiI labeling density without significant tissue damage. Pressures below 100 PSI could not be reliably delivered with the helium regulator in our laboratory; therefore we are unable to report on micro-carrier delivery at lower pressures and lesser spacing.
To improve the image quality of DiI impregnated neurons, it was necessary to determine optimal diffusion conditions prior to imaging. Diffusion times often go unreported (Gan et al., 2000; Wu et al., 2004; Oberheim et al., 2008; Pignatelli and Marshall, 2010). When times are reported they range from 0 to 48 h following fixation, under several diffusion temperatures, e.g., 4°C or room temperature (O’Brien and Lummis, 2002; Moolman et al., 2004; Wu et al., 2004; Neely et al., 2009; Shen et al., 2009; Yu et al., 2009; Cui et al., 2010; Forlano and Woolley, 2010; Li et al., 2010; Seabold et al., 2010). As both time and temperature potentially can have profound effects on the kinetics of dye diffusion, we evaluated diffusion quality (as judged by neuronal fluorescence, background fluorescence, and contrast) at several time points and two temperatures. We found that diffusion of DiI in the dark at room temperature for 24 h provided complete filling of the dendritic arbors and yielded the greatest contrast between the fluorescence of the cell and background tissue.
Combining DiI with Immunofluorescence
Coupling DiOlistic analyses of cellular morphology with specific neuronal phenotypes provides an emerging powerful research tool. As mentioned, DiI is a lipophilic carbocyanine tracer which diffuses through the cellular membrane. Consequently, if the membrane is permeabilized for fluorescent immunocytochemical protocols, the dye potentially can “leak” from the membrane into the surrounding tissue.
Our approach was to evaluate different detergent concentrations previously used with immunocytochemistry to evaluate which was most effective at allowing permeabilization, as indicated by antibody labeling, as well as maintaining DiI labeling. For immunocytochemical labeling, 0.3% Triton-X 100 is a standard detergent concentration, though other concentrations have been used in conjunction with DiOlistic labeling (Neely et al., 2009; Seabold et al., 2010). Like others (Neely et al., 2009) we found that 0.01% Triton-X 100 did not permeabilize the tissue enough to produce adequate immunocytochemical labeling. The 0.3% Triton-X 100 concentration produced good immune-labeling, but the DiI was not well maintained in the cellular membrane. With a 0.1% Triton-X 100 concentration, we were able to successfully incorporate DiI or CM-DiI with immunofluorescent antibody labeling in tissue slices.
DiI vs. CM-DiI in Non-Permeabilized and Permeabilized Tissues
To increase the retention of DiI within the membrane, Molecular Probes (Carlsbad, CA, USA) developed a number of lipophilic carbocyanine derivatives which “incorporate a mildly thiol-reactive chloromethyl substituent that confers aldehyde fixability via conjugation to thiol-containing peptides and proteins” (Molecular Probes MP06999). The result is a dye that Molecular Probes claims is “retained in cells throughout fixation, permeabilization, and paraffin embedding procedures” (Molecular Probes MP06999). This increased stability comes with a cost as CM-DiI, for example, is approximately 100 times more expensive than the “first generation” lipophilic carbocyanine tracers, like DiI. Given this, we decided to execute a side-by-side trial, directly comparing the stability of DiI vs. CM-DiI in permeabilized and non-permeabilized tissue.
Our statistical analysis of spine density in non-permeabilized tissue revealed no differences among the DiI labeled tissues between those imaged immediately and those imaged 2 weeks following mounting. This suggests that without permeabilization, DiI remains effectively incorporated into the cellular membrane. When the tissues treated with CM-DiI were analyzed, we were surprised to find a significant increase in spine density at the 2-week time point when compared to the group imaged immediately following mounting.
In comparison to DiI, the reduced initial spine density for CM-DiI is resolved when the spine densities of DiI and CM-DiI were evaluated 2 weeks following mounting. These data raise the possibility that different diffusion kinetics exist between DiI and CM-DiI. This prospect is further reinforced when evaluating the differences between spine density of CM-DiI in non-permeabilized and permeabilized tissue imaged immediately following mounting. The additional diffusion time of approximately 48 h that is built into the permeabilization steps of the immunostaining protocol seems to resolve differences in spine density in the time following tissue mounting. This additional diffusion time could account for the differences in spine density observed between non-permeabilized and permeabilized CM-DiI treated tissue. Together, these results indicate that for experiments conducted using non-permeabilized tissue, CM-DiI is not necessary, and the first generation of lipophilic carbocyanine dyes will work effectively.
Conclusion
Given the literature, a variety of labeling and diffusion conditions can produce acceptable levels of DiOlistic labeling. Our goal was to explicitly compare specific methodological components to determine a DiOlistic protocol that produces reproducible labeling density and image quality, and that could be combined with other histological methods. Our conclusions regarding the use of DiI and CM-DiI are summarized in Table 2.
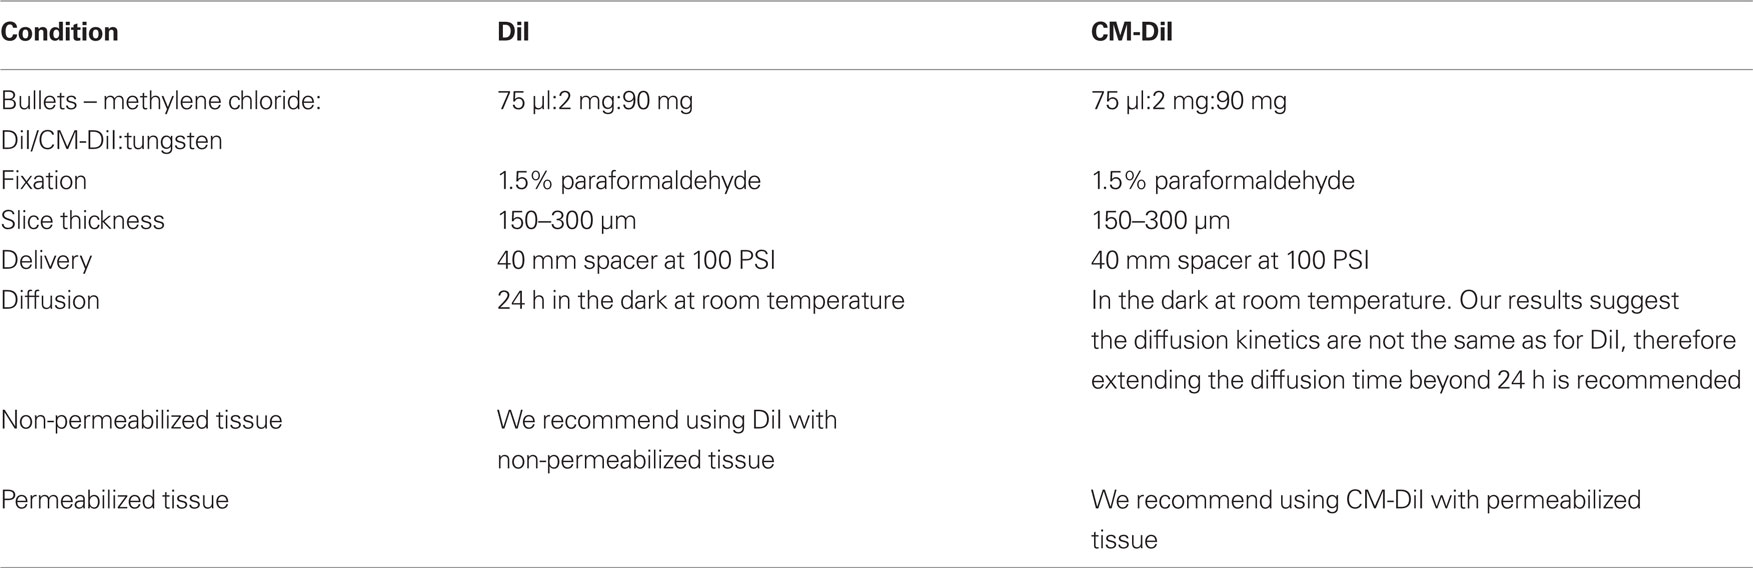
Table 2. Summary of optimal DiOlistic protocol conditions for both DiI and CM-DiI.
When evaluating DiI and CM-DiI integrity over time, we determined that the additional cost of CM-DiI is not necessary for experiments executed with non-permeabilized tissue, and that it is possible to effectively combine DiOlistic labeling with immunofluorescence using weak detergent conditions, such as 0.1% Triton-X 100. Under permeabilized conditions, we found that the use of CM-DiI is preferred because of its increased retention in membranes and stability over time. Taken together, the methods outlined above provide a reproducible protocol for DiOlistic labeling, with the option of coupling this labeling with immunofluorescence. Importantly, the experiments above outline the most cost effective means of executing a particular labeling experiment, without compromising the quality of the images or data acquired.
Conflict of Interest Statement
The authors declare that the research was conducted in the absence of any commercial or financial relationships that could be construed as a potential conflict of interest.
Acknowledgment
NIH grants DA013680 and DA07234.
References
Andrade, W., Seabrook, T. J., Johnston, M. G., and Hay, J. B. (1996). The use of the lipophilic fluorochrome CM-DiI for tracking the migration of lymphocytes. J. Immunol. Methods 194, 181–189.
Brandt, R., Leger, J., and Lee, G. (1995). Interaction of tau with the neural plasma membrane mediated by tau’s amino-terminal projection domain. J. Cell Biol. 131, 1327–1340.
Cui, Z. J., Zhao, K. B., Zhao, H. J., Yu, D. M., Niu, Y. L., Zhang, J. S., and Deng, J. B. (2010). Prenatal alcohol exposure induces long-term changes in dendritic spines and synapses in the mouse visual cortex. Alcohol 45, 312–319.
Forlano, P. M., and Woolley, C. S. (2010). Quantitative analysis of pre- and postsynaptic sex differences in the nucleus accumbens. J. Comp. Neurol. 518, 1330–1348.
Gan, W. B., Grutzendler, J., Wong, R. O., and Lichtman, J. W. (2009). Ballistic delivery of dyes for structural and functional studies of the nervous system. Cold Spring Harb. Protoc. 2009, pdb.prot5202.
Gan, W. B., Grutzendler, J., Wong, W. T., Wong, R. O., and Lichtman, J. W. (2000). Multicolor “DiOlistic” labeling of the nervous system using lipophilic dye combinations. Neuron 27, 219–225.
Harris, K. M., Jensen, F. E., and Tsao, B. (1992). Three-dimensional structure of dendritic spines and synapses in rat hippocampus (CA1) at postnatal day 15 and adult ages: implications for the maturation of synaptic physiology and long-term potentiation. J. Neurosci. 12, 2685–2705.
Li, M., Cui, Z., Niu, Y., Liu, B., Fan, W., Yu, D., and Deng, J. (2010). Synaptogenesis in the developing mouse visual cortex. Brain Res. Bull. 81, 107–113.
McKinney, R. A., Capogna, M., Durr, R., Gahwiler, B. H., and Thompson, S. M. (1999). Miniature synaptic events maintain dendritic spines via AMPA receptor activation. Nat. Neurosci. 2, 44–49.
Moolman, D. L., Vitolo, O. V., Vonsattel, J. P., and Shelanski, M. L. (2004). Dendrite and dendritic spine alterations in Alzheimer models. J. Neurocytol. 33, 377–387.
Neely, M. D., Stanwood, G. D., and Deutch, A. Y. (2009). Combination of diOlistic labeling with retrograde tract tracing and immunohistochemistry. J. Neurosci. Methods 184, 332–336.
Oberheim, N. A., Tian, G. F., Han, X., Peng, W., Takano, T., Ransom, B., and Nedergaard, M. (2008). Loss of astrocytic domain organization in the epileptic brain. J. Neurosci. 28, 3264–3276.
O’Brien, J., and Lummis, S. C. (2002). An improved method of preparing microcarriers for biolistic transfection. Brain Res. Brain Res. Protoc. 10, 12–15.
O’Brien, J. A., Holt, M., Whiteside, G., Lummis, S. C., and Hastings, M. H. (2001). Modifications to the hand-held gene gun: improvements for in vitro biolistic transfection of organotypic neuronal tissue. J. Neurosci. Methods 112, 57–64.
Pignatelli, V., and Marshall, J. (2010). Morphological characterization of retinal bipolar cells in the marine teleost Rhinecanthus aculeatus. J. Comp. Neurol. 518, 3117–3129.
Seabold, G. K., Daunais, J. B., Rau, A., Grant, K. A., and Alvarez, V. A. (2010). DiOLISTIC labeling of neurons from rodent and non-human primate brain slices. J. Vis. Exp. http://www.jove.com/index/Details.stp?ID=2081
Shen, H., Sesack, S. R., Toda, S., and Kalivas, P. W. (2008). Automated quantification of dendritic spine density and spine head diameter in medium spiny neurons of the nucleus accumbens. Brain Struct. Funct. 213, 149–157.
Shen, H. W., Toda, S., Moussawi, K., Bouknight, A., Zahm, D. S., and Kalivas, P. W. (2009). Altered dendritic spine plasticity in cocaine-withdrawn rats. J. Neurosci. 29, 2876–2884.
Staffend, N. A., Loftus, C. M., and Meisel, R. L. (2011). Estradiol reduces dendritic spine density in the ventral striatum of female Syrian hamsters. Brain Struct. Funct. 215, 187–194.
Wu, C. C., Reilly, J. F., Young, W. G., Morrison, J. H., and Bloom, F. E. (2004). High-throughput morphometric analysis of individual neurons. Cereb. Cortex 14, 543–554.
Keywords: DiOlistic, gene gun, dendritic spine, neuronal morphology
Citation: Staffend NA and Meisel RL (2011) DiOlistic labeling of neurons in tissue slices: a qualitative and quantitative analysis of methodological variations. Front. Neuroanat. 5:14. doi: 10.3389/fnana.2011.00014
Received: 14 January 2011;
Accepted: 18 February 2011;
Published online: 01 March 2011.
Edited by:
Laszlo Acsady, Institute of Experimental Medicine, HungaryReviewed by:
José Miguel Blasco Ibáñez, University of Valencia, SpainGabor Nyiri, Institute of Experimental Medicine, Hungary
Copyright: © 2011 Staffend and Meisel. This is an open-access article subject to an exclusive license agreement between the authors and Frontiers Media SA, which permits unrestricted use, distribution, and reproduction in any medium, provided the original authors and source are credited.
*Correspondence: Nancy A. Staffend, Department of Neuroscience, University of Minnesota, 321 Church Street SE, Minneapolis, MN 55455, USA.e-mail: staff093@umn.edu