Comparison of pretectal genoarchitectonic pattern between quail and chicken embryos
- 1 Department of Human Anatomy and Psychobiology, Centre for Biomedical Research on Rare Diseases (CIBERER 736), School of Medicine, University of Murcia, Murcia, Spain
- 2 Unité de Génétique Moléculaire Animale, INRA UMR 1061, University of Limoges, Limoges, France
Regionalization of the central nervous system is controlled by local networks of transcription factors that establish and maintain the identities of neuroepithelial progenitor areas and their neuronal derivatives. The conserved cerebral Bauplan of vertebrates must result essentially from conserved patterns of developmentally expressed transcription factors. We have previously produced detailed molecular maps for the alar plate of prosomere 1 (the pretectal region) in chicken (Ferran et al., 2007, 2008, 2009). Here we compare the early molecular signature of the pretectum of two closely related avian species of the family Phasianidae, Coturnix japonica (Japanese quail) and Gallus gallus (chicken), aiming to test conservation of the described pattern at a microevolutionary level. We studied the developmental pretectal expression of Bhlhb4, Dbx1, Ebf1, Gata3, Gbx2, Lim1, Meis1, Meis2, Pax3, Pax6, Six3, Tal2, and Tcf7l2 (Tcf4) mRNA, using in situ hybridization, and PAX7 immunohistochemistry. The genoarchitectonic profile of individual pretectal domains and strata was produced, using comparable section planes. Remarkable conservation of the combinatorial genoarchitectonic code was observed, fundamented in a tripartite anteroposterior subdivision. However, we found that at corresponding developmental stages the pretectal region of G. gallus was approximately 30% larger than that of C. japonica, but seemed relatively less mature. Altogether, our results on a conserved genoarchitectonic pattern highlight the importance of early developmental gene networks that causally underlie the production of homologous derivatives in these two evolutionarily closely related species. The shared patterns probably apply to sauropsids in general, as well as to more distantly related vertebrate species.
Introduction
Starting from early induction processes taking place at the neural plate stages, the partitions of the central nervous system are established sequentially by positional information created by morphogens secreted from various organizers. Prior to neural tube closure the major brain subdivisions – forebrain, midbrain, and hindbrain – are molecularly delimited one from another. Each of these partitions becomes regionalized subsequently by expressing specific combinations of genes, including transcription factors and cell-signaling, cell-cycle-regulating, and cell-adhesion molecules, which work in a networked way to generate different position-dependent molecular identities, specific neuronal, and glial populations and the resulting differential histogenesis of each molecularly individualized sector of the neural wall. Among the different types of genes, those coding for transcription factors (which represent collectively the core of the developmental network) play a key role in this process, since they specify, modifying, or stabilizing, the molecular codes active during the developmental process of any given brain region. The diffusible morphogens released from the secondary organizers establish gradiental concentration fields of signals whose interpretation by competent cells can change the primary molecular identity of the local histogenetic area (the neural progenitor cells) by up/down-regulation of downstream transcription factors (Puelles, 1995, 2001; Echevarria et al., 2003; Puelles et al., 2004; Kiecker and Lumsden, 2004; Davidson, 2006; Davidson and Erwin, 2006, 2009; Guillemot, 2007; Sánchez-Arrones et al., 2009). Supporting the idea that specific genetic codes identify each neural partition (and establish the respective boundaries), several comparative studies of gene expression patterns have revealed that homologous neural regions largely share a common molecular code at early stages of development across vertebrates (Fernandez et al., 1998; Hauptmann and Gerster, 2000; Puelles et al., 2000; Bachy et al., 2001; Murakami et al., 2001; Hauptmann et al., 2002; Puelles and Rubenstein, 2003; Ferran et al., 2007, 2008; García-López et al., 2008; Abellán and Medina, 2009; Bardet et al., 2010; Morona et al., 2010). A shared molecular pattern underpinning conserved morphogenesis may be held to represent the topological and molecularly conserved Bauplan of the neural tube, common to all vertebrates (Puelles and Rubenstein, 1993, 2003; Puelles, 1995, 2001; Puelles et al., 2004, 2007). Within this paradigm, combined gene expression patterns properly correlated to their topological position are highly relevant for dissecting the molecular code of each region, domain, layer, or nucleus. This is a scientific endeavor recently defined as the study of cerebral genoarchitecture (Ferran et al., 2009; Puelles, this volume). It is proving to be extremely useful for identifying homologous regions and derivatives between different vertebrates (Puelles and Medina, 2002; Puelles and Rubenstein, 2003; Ferran et al., 2007, 2008, 2009).
The pretectal region is the alar plate of prosomere 1 (p1), placed between the thalamus and the midbrain (Puelles et al., 2007). Building upon the pioneering studies on the chicken pretectum done by Rendahl (1924) and Kuhlenbeck (1939), several recent contributions have improved our knowledge of the anatomy of this region, both in terms of its subdivision into histogenetic domains and the characterization of its various derivatives (Redies et al., 1997, 2000; De Castro et al., 1998; Yoon et al., 2000; Ferran et al., 2007, 2008, 2009Puelles et al., 2007). We defined a number of molecular characteristics of the pretectal identity codes from stage HH13 to posthatched chicken (Ferran et al., 2007, 2009). Specific molecular markers identify the rostral or pretecto-thalamic boundary (Pax3, Meis1) and the caudal or pretecto-mesencephalic boundary (Pax6, Meis2). In addition, the pretectal region was subdivided molecularly into three anteroposterior domains described as precommissural pretectum (PcP; Bhlb4, Ebf1), juxtacommissural pretectum (JcP; Six3, Tal2, Lim1), and commissural pretectum (CoP, Pax7, Tal2, Lim1). Several molecularly distinct dorsoventral subdomains of the three primary AP domains were detected as well (Ferran et al., 2007, 2009). Importantly, these molecular partitions were largely consistent with the fate map studies of García-López et al. (2004). The same tripartite molecular subdivision was found in the pretectum of the mouse (Ferran et al., 2008) and the Xenopus laevis frog (Morona et al., 2010).
Our present aim was to analyze the degree of conservation of pretectal genoarchitecture at a microevolutionary scale. For this purpose, we studied two closely related avian species (Coturnix japonica and Gallus gallus) that belong to the family Phasianidae, from the order Galliformes (Kimball et al., 1999; Crowe et al., 2006; Kan et al., 2010a,b; Shen et al., 2010). We chose to perform our study at the intermediate stages Q26/HH26 and Q28/HH28 (Q = Ainsworth et al., 2010 quail stages; HH = Hamburger and Hamilton, 1951 chicken stages). These stages represent in the chick the transition between early neurogenesis (HH20–HH27) and incipient mantle layer transformation into pronuclei (HH28–HH32; Crossland and Uchwat, 1982; Martínez, 1987; Puelles et al., 1987; Ferran et al., 2009). These embryos are still far from the period when definitive nuclei start to be distinguished (HH33–HH36). These important “hinge stages” have not been analyzed in depth previously. Therefore, we obtained a molecular map of selected markers for these developmental stages in both avian species, studying the previously defined molecular codes for each anteroposterior pretectal domain, as well as the relative pattern in which the incipient mantle strata became segregated molecularly. We included detailed studies of expression patterns for some genes that were not previously analyzed, or had been only superficially explored at these stages (Ebf1, Gata3, Meis1, Meis2, Pax3, and Tcf712 [Tcf4]). We found in both species remarkable conservation at the studied stages of the combinatorial genoarchitectonic codes across the tripartite anteroposterior subdivision, and virtually the same combinatorial code with regard to radial stratification.
Materials and Methods
The present research conforms to the stipulations of the European Community (86/609/EEC) and the Spanish Government (Royal Decree 223/1998) on care and use of laboratory animals.
Animals
Fertilized quail (Coturnix coturnix japonica) and chicken eggs (Gallus gallus domesticus) from a local farm were incubated at 37°C in a forced-air incubator until the desired embryonic stage (Q26/HH26 to Q28/HH28). Around 60 embryos were staged according to Ainsworth et al. (2010) for quails and Hamburger and Hamilton (1951) for chickens. The embryos were fixed overnight by immersion in 4% paraformaldehyde in phosphate-buffered saline (PBS, pH7.4) at 4°C. Some embryos used for in situ hybridization (with or without immunochemical counterstain) were processed as whole-mounts (or as brain halves, each half serving for 1–2 contrasting markers). The rest of the embryo heads were fixed overnight, washed 24 h in cold PBS, cryoprotected overnight in 20% sucrose in PBS, and finally embedded in 15% gelatin and 20% sucrose in PBS. The blocks were cryostat-sectioned 18 μm-thick in topologically true horizontal and transversal section planes relative to the length axis of p1 (pretectum). The sections were adhered onto SuperFrost-Plus slides (Menzel-Gläser, Braunschweig, Germany), separated into four or five parallel series. Each series was processed subsequently for in situ hybridization with a different mRNA probe. Some series were immunoreacted after the in situ hybridization reaction.
RT-PCR
RNA was extracted from fresh dissected brains of G. gallus embryos at stages HH24, HH30, or HH33 and C. japonica at stage Q26 using Trizol reagent (10296-028, Invitrogen). The RNA was treated with DNAse I (18068-015, Invitrogen) during 15 min at room temperature, and then the enzyme was inactivated at 65°C. The RNA was reverse-transcribed into single-stranded cDNA with Superscript II reverse transcriptase and oligo dT anchored primers (11904-018, SuperScript First-Strand Synthesis System for RT-PCR; Invitrogen). The resulting first-strand cDNA (0.5 μl of the reverse transcription reaction) was used as a template for PCR, performed with Taq polymerase (M8305, Promega). Specific primers listed below were designed to clone gene fragments from Bhlhb4, Ebf1, Gbx2, Pax3 from G. gallus sequences; and Bhlhb4, Dbx1, Ebf1, Gata3, Lim1, Meis1, Meis2, Pax3, Pax6, Pax7, Six3, and Tcf7l2 from C. japonica sequences (G. gallus sequences were used for primer design).
CQBhlhb4F1: 5′-ATGGCCGAGCTCAAGTCGCT-3′;
CQBhlhb4F2: 5′-TGGGCAAGTCGGCAGAGAG-3′.
CQBhlhb4R: 5′-TCAAGGCTTGTCGCTGCAGT-3′.
CQEbf1F1: 5′-CAGTCAATGTTGATGGCCAT-3′;
CQEbf1F2: 5′-GCACAACAATTCCAAGCAT-3′;
CQEbf1R: 5′-AGGAGAAGTTTGCGGTCTCA-3′.
CGbx2F: 5′-AGCGACCTCGACTACAGCTC-3′;
CGbx2R: 5′-ATTCACAAGACGGGAGTTGG-3′.
CPax3F: 5′-GCCGCCGCGATGACCACG-3′;
CPax3R: 5′-GAGCGAGACCGGAAAATAACACCA-3′;
QDbx1F: 5′-GTCCCCGCTACACAAGGCAC-3′.
QDbx1R: 5′-CTTCCTGCTCCAGGTATTCG-3′.
QGata3F: 5′-TGGAACCTCAGCCCTTTTTCC-3′.
QGata3R: 5′-GTTAAAGGAGCTGCTCTTGG-3′.
QLim1F: 5′-GGAGCAAAGTGTTCCACTTG-3′.
QLim1R: 5′-CGGTTCTGGAACCACACCTGG-3′;
QMeis1F: 5′-GTGTTCGCCAAACAGATCCG-3′;
QMeis1R: 5′-CCTCCATGCCCATATTCATGC-3′.
QMeis2F: 5′-ATGGCGCAAAGGTACGATGAG-3′;
QMeis2R: 5′-TTGCGACTGATTTACAAGAT-3′.
QPax3F: 5′-TCGGCGGCAGCAAACCCAAG-3′.
QPax3R: 5′-GGCTCCTGCCTGCTTCCTCC-3′.
QPax6F: 5′-GCAGGTATTACGAAACTGGC-3′.
QPax6R: 5′-GGGTTGCATAGGCAGGTTGT-3′.
QPax7F: 5′-GATGTTCAGCTGGGAGATCC-3′.
QPax7R: 5′-ACAGGATTCATGTGGTTG-3′.
QSix3F: 5′-GTGGCCAGCGTCTGCGAGAC-3′.
QSix3R: 5′-GTTAAAGGAGCTGCTCTTGG-3′.
QTcf7l2F: 5′-CACCCGCACCATGTACACCC-3′.
QTcf7l2R: 5′-CCTTCACCTTGTATGTAGCG-3′.
PCR conditions were as follows: 5 min at 94°C, then 35 cycles (30 s at 94°C, plus 1 min at Tm temperature −57°C, and 1 min at 72°C), followed by 20 min at 72°C. The PCR products were cloned into pGEM-T Easy Vector (Promega) and sequenced (SAI, University of Murcia). C. japonica and G. gallus sequences were submitted to GenBank (accession numbers: HQ436513, Bhlhb4 C. japonica; HQ436514, Dbx1 C. japonica; HQ436515, Ebf1 C. japonica; HQ436512, Ebf1 G. gallus; JF297589, Gata3 C. japonica; HQ436511, Gbx2 G. gallus; JF719578, Lim1 C. japonica; JF304296, Meis1A.2 C. japonica; HQ436516, Meis2A.1 C. japonica; HQ436517, Pax3 C. japonica; HQ436518, Pax6 C. japonica; HQ436519, Pax7 C. japonica; JF297588, Six3 C. japonica; HQ436520, Tcf7l2 C. japonica).
In situ Hybridization
Digoxygenin-11-UTP (Roche, Lewes, UK) was used for RNA probe synthesis. Plasmid information is provided in Table 1.
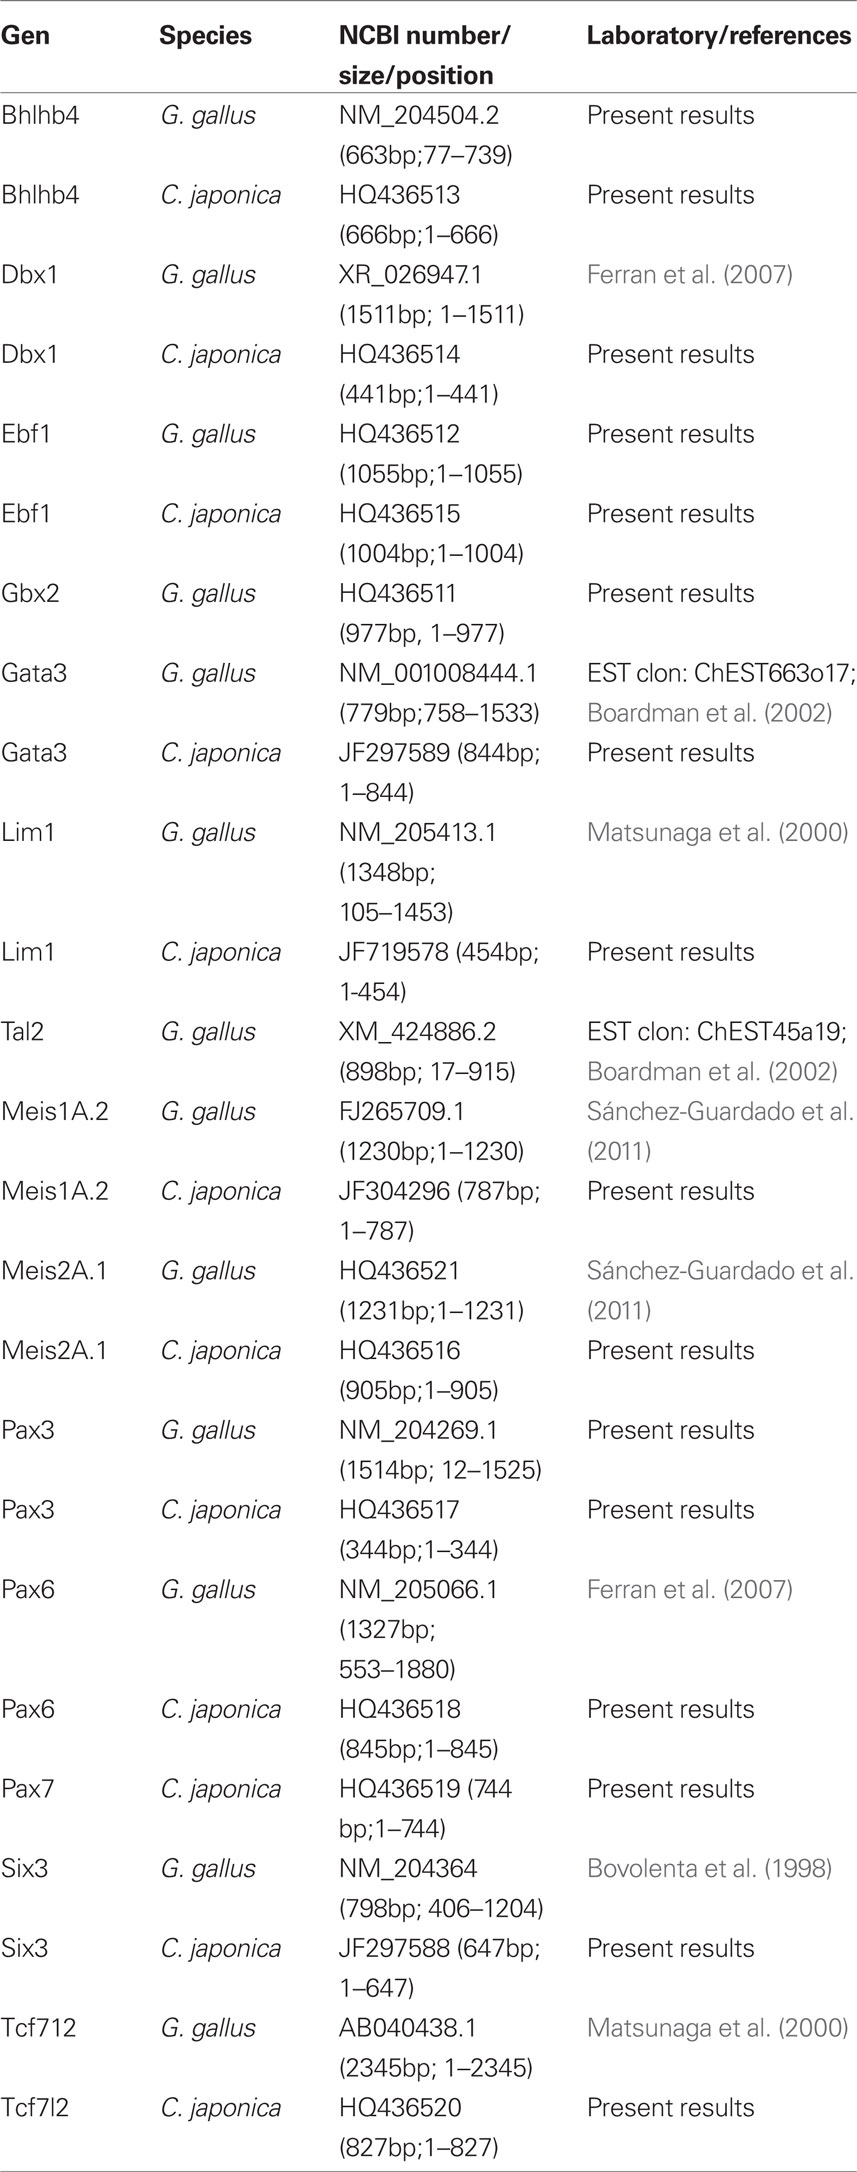
Table 1. List of gene markers used, sequence of the gene in the construct, and origin of the plasmid construction.
The whole-mount in situ hybridization protocol used was that of Shimamura et al. (1994), whereas the ISH reaction on cryostat-sectioned material followed the protocol of Hidalgo-Sánchez et al. (2005). After ISH, the sections were washed, and the hybridized product was detected immunocytochemically using anti-digoxigenin antiserum coupled to alkaline phosphatase (Roche Diagnostics, Mannheim, Germany). Nitroblue tetrazolium/bromochloroindolyl phosphate (NBT/BCIP) was used as chromogenic substrate for the final alkaline phosphatase reaction (Boehringer, Mannheim, Germany).
Immunohistochemistry
After in situ hybridization, immunocytochemical reaction for PAX7 was performed in whole-mounts according to Ferran et al. (2007). Hybridized cryostat sections were processed for immunocytochemistry in a similar way. After several washes in 0.1 M PBS with 0.75% Triton X-100 (PBT), sections were treated with 3% hydrogen peroxide in PBT for 15 min in the dark to inactivate endogenous peroxidase activity. After several rinses in PBT, they were blocked with 0.2% gelatin (PBTG) and 0.1 M lysine during 1–4 h. The anti-PAX7 primary antibody diluted in PBGT was incubated for 48 h at 4°C (1:20; Developmental Studies Hybridoma Bank, Iowa City, IA, USA). After washes in PBT and PBTG, the tissues were incubated with biotinylated goat anti-mouse IgG (1:200 in PBT, 1.5 h; Vector Laboratories, Burlingame, CA, USA), passing thereafter to streptavidin/horseradish peroxidase complex (Vectastain-ABC kit; Vector Laboratories; 1:350, 1 h). The brown peroxidase reaction was performed with a 15-min soak in 3,3-diaminobenzidine [Sigma, St. Louis, MO, USA; 50 mg/100 ml in 0.05 M Tris–HCl buffer (pH 7.6)], plus 5–10 min with added 0.03% hydrogen peroxide. The reaction was stopped with 0.05 M Tris buffer. Sections were coverslipped with Eukitt.
Imaging
Digital microphotographs of the whole-mounts were obtained with a Zeiss Axiocam camera (Carl Zeiss, Oberkochen, Germany), and a ScanScope digital scanner (Aperio, Technologies, Inc.; Vista, CA, USA) was used for the cryostat sections (exported as TIF files). The images were corrected for contrast and brightness in Photoshop 7.0. In order to compare different gene expression patterns, images were artificially pseudocolored (from blue to red or green) and superimposed using Photoshop 7.0. The plates were labeled using Adobe Photoshop IllustratorCS2 (Adobe Systems, San José, CA, USA). Representative sections from comparable chicken and quail embryos were measured using Image-ProPlus (Media Cibernetics Inc.). Image J software was used to delineate contours around areas to be compared quantitatively, obtaining the areas (in arbitrary units) of the whole pretectum at several sections levels, as well as the individual precommissural, juxtacommissural, and commissural domains. Considering volume proportional to sectioned surface, the promediated values of the individual domains were calculated as percentage of the total pretectal area, giving a rough estimate of relative proportions. No statistic was possible due to the small number of data.
Results
Preliminary Remarks on the Selection of Species, Genes, and Developmental Stages
The goal of the present work was to make a comparative study of the spatio-temporal distribution of key mRNAs in the pretectal region of two closely related species. Since a previous detailed study was made in G. gallus (Chicken; Ferran et al., 2007, 2009), we decided to use C. japonica, a member of the same avian family (Phasianidae). This species is commonly used as tissue-donor for quail–chicken grafting experiments (Figure 1A). Regarding the stages, we aimed to characterize early combinatorial molecular codes and test pattern profiles defining the general pretectal Bauplan during initial steps of pronuclear generation (after radial migration of postmitotic neurons into the mantle layer). Therefore, we decided to perform our study between stages Q26/HH26 and Q28/HH28, thus also expanding our previous chicken studies. Finally, the genes chosen as markers were selected according to our previous knowledge of their importance for delimiting boundaries or a specific domain, layer, or nuclear derivative (Ferran et al., 2007, 2009).
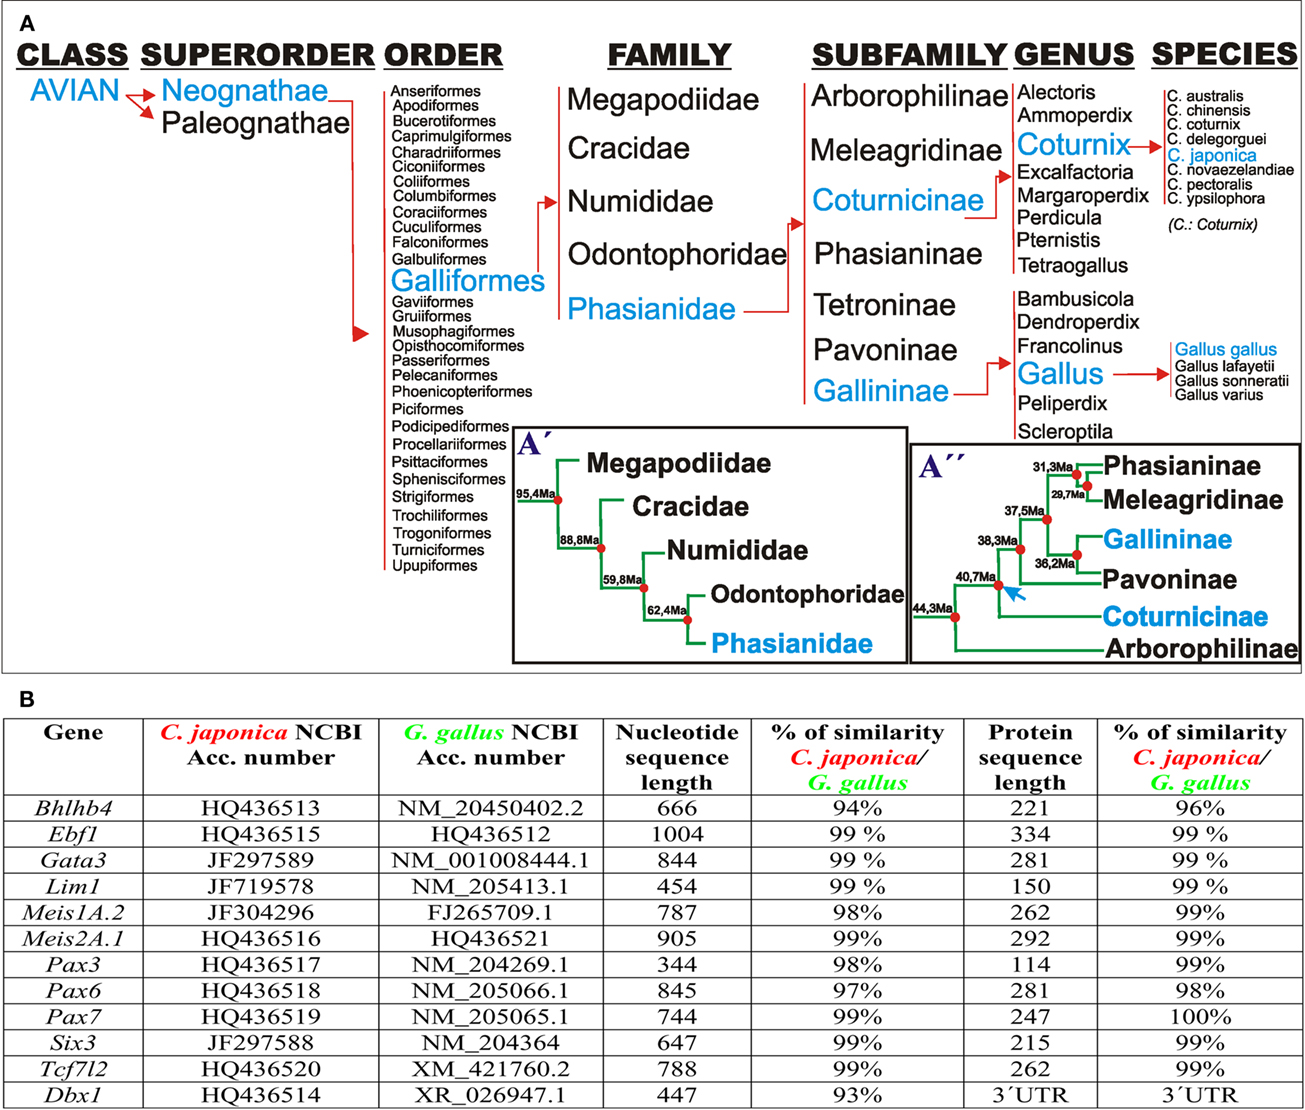
Figure 1. (A) Taxonomic classification of Galliformes according to Crowe et al. (2006). (A′) Postulated phylogenetic relationships between families of the order galliformes. The timetree represents the mean times of independent evolution, estimated from several studies, according to Pereira and Baker (2009). (A′′) Phylogenetic relationships among members of the family Phasianidae according to Kan et al. (2010a,b). Blue arrow: time point of Gallininae and Coturnicinae split. (B) Comparison of the codifying and protein sequences of the listed genes between G. gallus and C. japonica.
Differences in Transcript Sequences Between C. japonica and G. gallus
Coturnix japonica and G. gallus underwent 40 million years of independent evolution as members of the Coturnicinae and Gallininae subfamilies, respectively (Figure 1A). Therefore, our first aim was to assess any differences at the nucleotide and aminoacidic level of the studied genes. For this purpose, we cloned the complete coding sequence of Bhlhb4, obtained partial coding sequences from Ebf1, Gata3, Lim1, Meis1, Meis2, Pax3, Pax6, Pax7, Six3, and Tcf7l2, we also studied the 3′UTR of Dbx1 from C. japonica, comparing them to available G. gallus sequences. We found >93 and >96% (often ∼99%) similarity at the nucleotide and protein levels, respectively, for all the analyzed C. japonica and G. gallus genes (Figure 1B). In addition, we compared the four published gene sequences from C. coturnix obtained from GenBank, finding a similar level of conservation in G. gallus and C. japonica (data not shown). These results indicate a high level of mRNA sequence conservation between C. japonica and G. gallus, which is likely to represent the general degree of divergence among the subfamilies of the family Phasianidae.
Pretectal Boundaries and Domains are Defined by the Same Genoarchitectonic Codes in C. japonica and G. gallus
A major conclusion of our previous studies was that the combined expression patterns of three genes were enough to define the anteroposterior pretectal boundaries and its internal tripartition (Ferran et al., 2007, 2008). Here we corroborated that the same molecular code applies to C. japonica. In both species, pretectal expression of Pax3 stops rostrally at the thalamo-pretectal boundary (TPB; p2/p1), whereas that of Pax6 ends caudally at the pretecto-mesencephalic limit (p1/m1); these patterns jointly define the pretectal region (alar p1; Figures 2A,C,D,E,H,I). In addition, expression of Six3 neatly distinguished in both cases the intermediate pretectal domain (JcP; Figures 2B,F,G). Therefore, the combination of markers Six3/Pax3/Pax6 also identifies the rostral and caudal pretectal domains (PcP and commissural pretectum, or CoP, respectively). As previously found in the chicken, the quail CoP domain showed extensive PAX7 immunoreaction (Figures 2E,I).
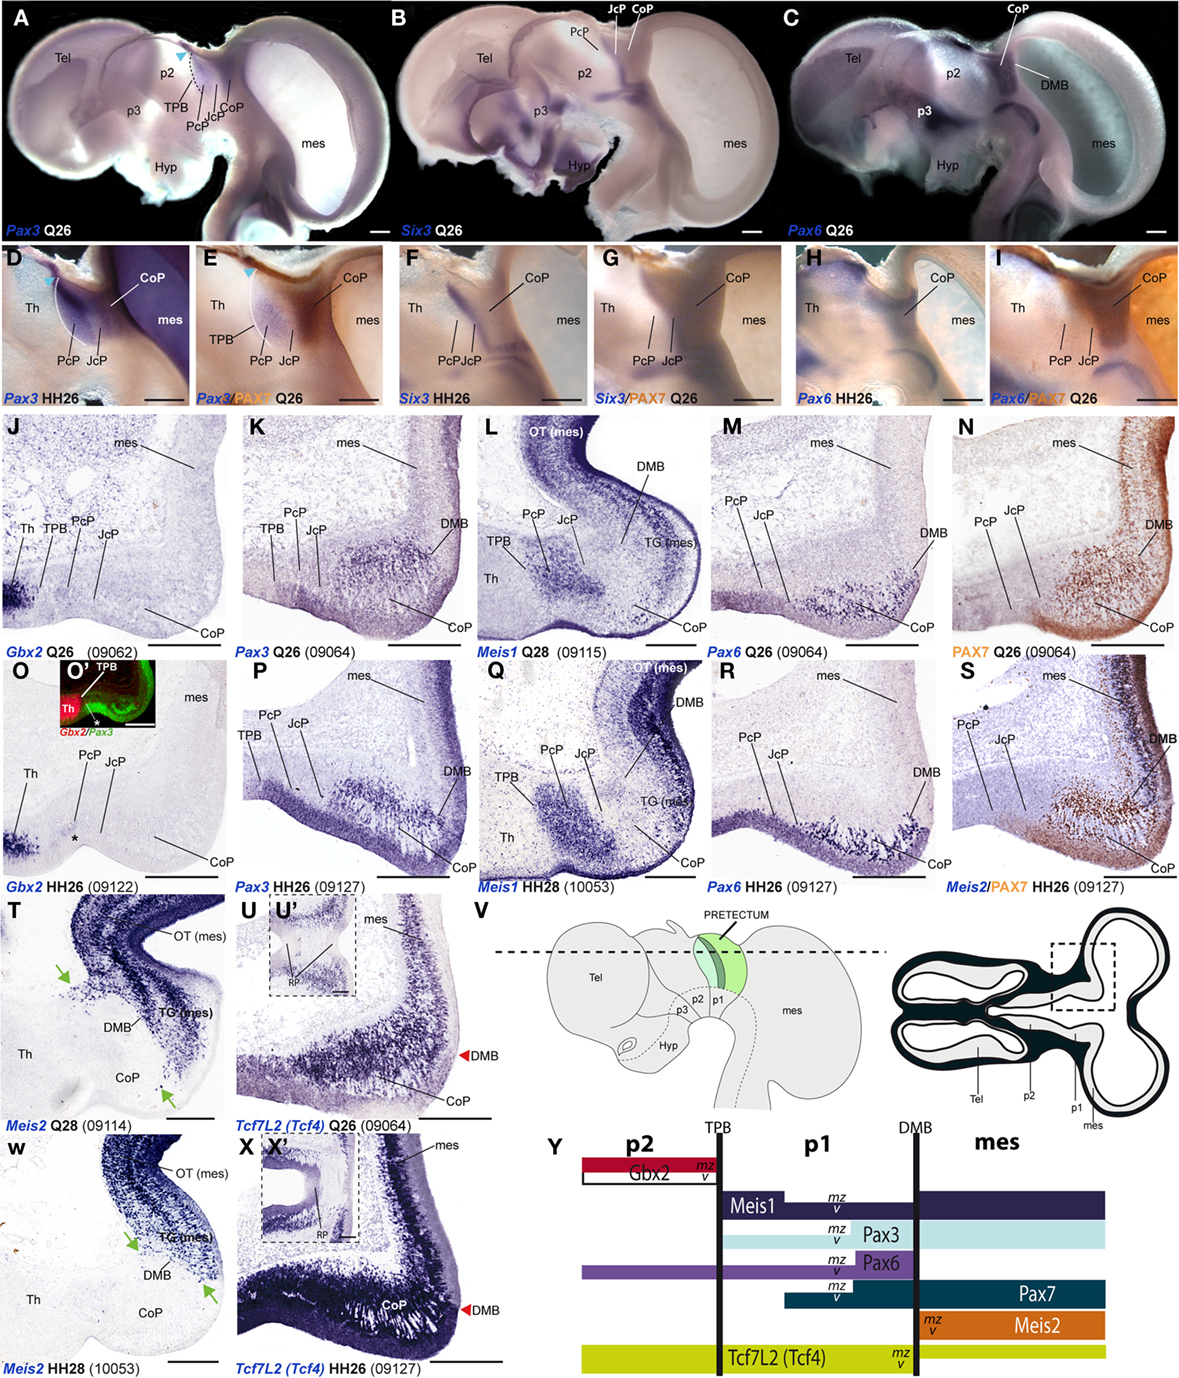
Figure 2. Pairwise comparison of gene patterns in the developing pretectum of Q26 quail or HH26 chicken embryos (as identified at left bottom corner of each panel). The markers shown are Pax3 (A,D,E,K,P), Six3 (B,F,G), Pax6 (C,H,I,M,R), PAX7 (E,I,N,S), Gbx2 (J,O,O′), Meis1 (L,Q), Meis2 (S,T,W), and Tcf7l2 (U,U′,X,X′). (A–I) Whole-mount in situ hybridization and immunoreaction processed material identify the main pretectal boundaries and define an anteroposterior tripartition. Blue arrowhead in (A,D,E): Pax3 expression extends continuously from the pretectum into the thalamic habenular region. (J–X) Horizontal sections at corresponding levels in both species illustrating distribution along the radial dimension of the studied markers. The pairwise comparable panels are organized one on top of the other (J,O,K,P, …). The numbers between brackets at the bottom of each panel give the code identifying the specimen in our collection (data from the same specimen may appear in different panels or plates). Inset (O′) compares in pseudocolor the patterns of Gbx2 and Pax3, demonstrating that the cell group marked with an asterisk (O,O′) lies caudal to the thalamo-pretectal boundary. Insets (U′,X′) show horizontal sections passing through the roof of the pretectum, where Tcf7l2 is not expressed. Green arrows in (T,W): Meis2 positive cells at the CoP. The schemata in (V) represent a lateral view of the brain indicating the horizontal section plane used, and the position in such sections of the pretectal region that appears magnified in the panels (dashed box). (Y) Schema of gene combinations mapped in the midbrain (mes) and diencephalic prosomeres p1 and p2. Each gene is represented by a color-coded bar. The upper and lower halves of each bar represent gene expression in the mantle (mz) or ventricular zones (v) respectively. Scale bars = 300 μm.
Next, we analyzed Gbx2, Meis1, and Pax3 expression patterns in cryostat sections in order to define more precisely the molecular TPB. In both species, Gbx2 is strongly expressed in the thalamic mantle zone, stopping caudally at the TPB; Gbx2 is absent at the overlying habenular region (Figures 2J,O,O′,Y and 3M–P,AE,AF). In addition, we observed a periventricular patch expressing Gbx2 in the rostral pretectum (see below; asterisk in Figures 2O and 3N,P,AF). Pax3 expression is largely restricted to the pretectal ventricular zone, though its signal appears as well in the mantle of the CoP domain (see below). Pax3 transcripts generally stop rostrally at the TPB (Figures 2A,D,E,K, O′,P,Y and 3I–L). However, at the dorsal-most levels, Pax3 expression expands into the habenular dorsal p2 domain, and is accordingly not useful as a p2/p1 limit marker at that specific position (blue arrowhead; Figures 2A,D,E). Meis1 appears expressed in the pretectum but not in the thalamus. Its domain stops precisely at the rostral pretectal boundary, including its dorsal-most part, showing no expansion into p2, in contrast to Pax3. Moreover, Meis1 shows strong expression in the ventricular and mantle zones of the PcP domain in both species (see below; Figures 2L,Q,Y and 3A–D). Altogether, these genes allow the precise identification not only of the early TPB, but also of the different mantle derivatives abutting at this boundary from either side (Meis1, pretectum; Gbx2, thalamus; Figure 2Y).
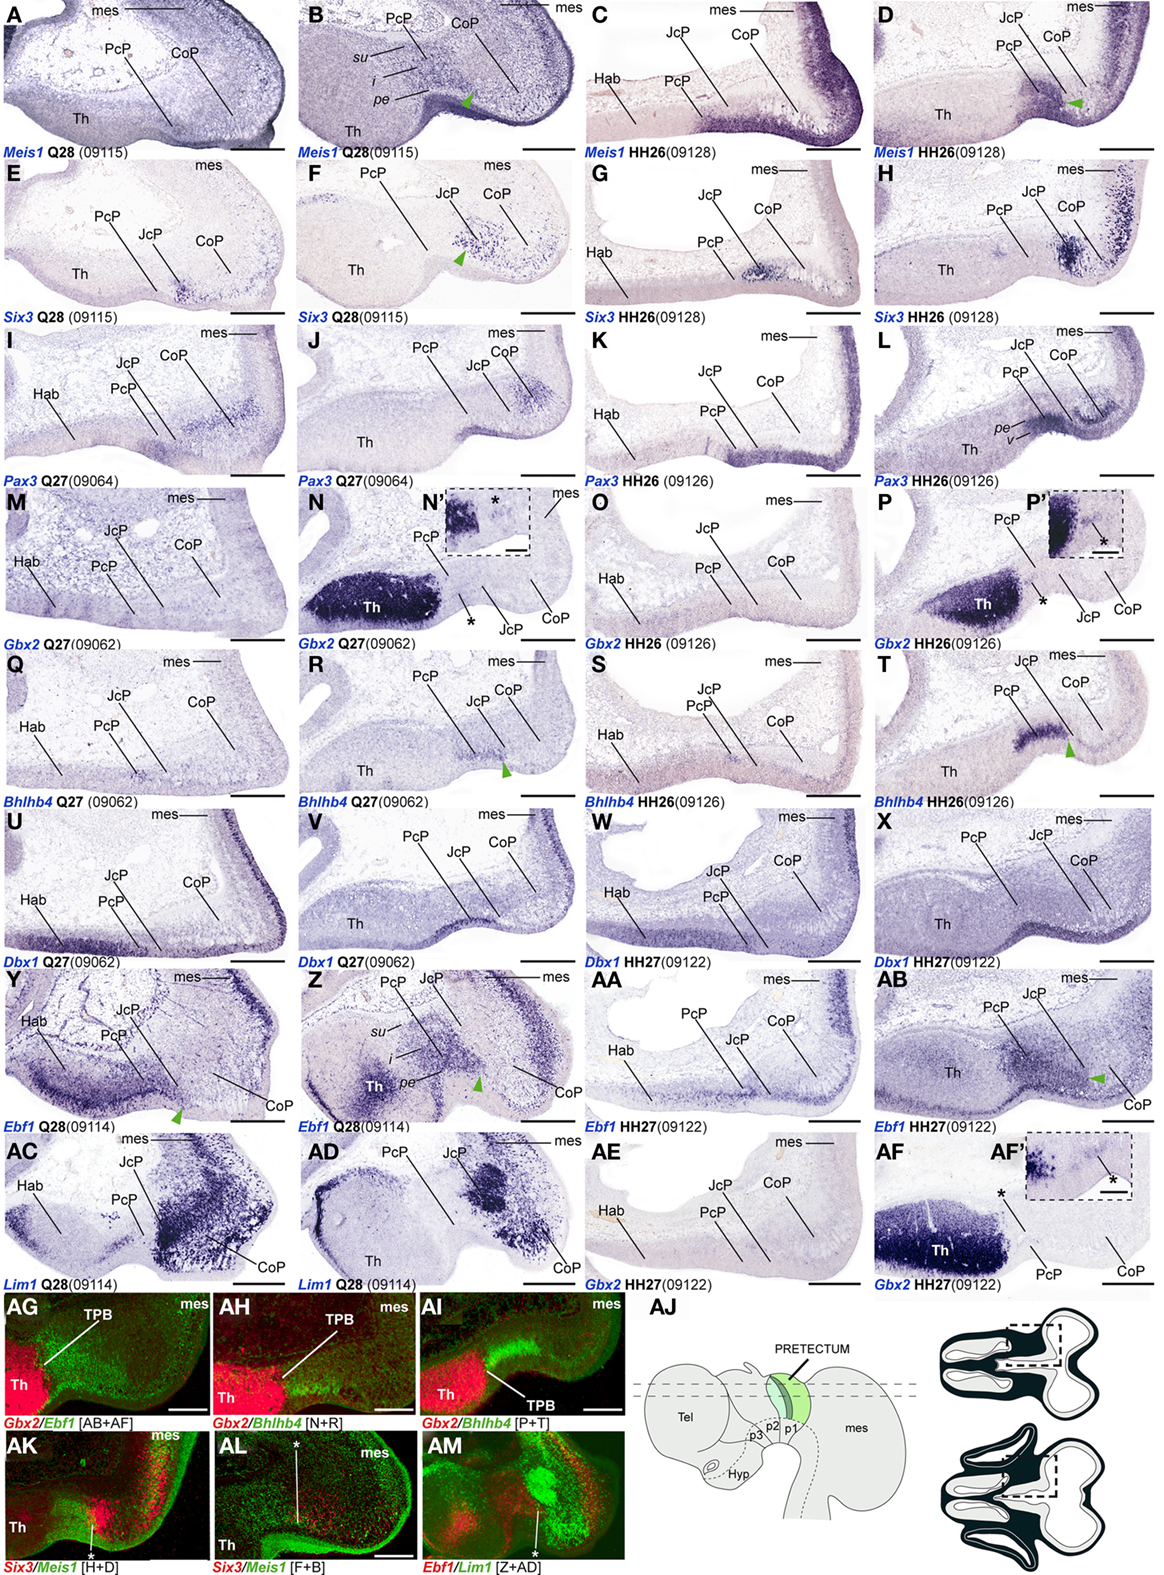
Figure 3. (A–AM) Comparisons of in situ hybridization data for PcP markers at HH26/27-Q27/28 in horizontal cryostat sections. From top to bottom of the plate, each row of four panels generally contains data on one gene: Meis1 (A–D), Six3 (E–H), Pax3 (I–L), Gbx2 (M–P,AE,AF), Bhlhb4 (Q–T), Dbx1 (U–X), Ebf1 (Y–AB), Lim1 (AC–AD). Note that material from different specimens (identifying codes in brackets) was pooled into this plate. Each adjacent pair of panels from left to right corresponds to two different section levels in one species (in dorsoventral order), to be compared with the next two panels of corresponding section levels in the other species [e.g., for Meis1, (A,B) are two quail section levels to be compared with (C,D), showing the same marker at equivalent levels in the chick]. Patterns comparable between quail and chicken are thus shown horizontally. The panels illustrating the other markers in successive rows represent corresponding section levels (though sometimes a different specimen is compared), so that different gene patterns are compared vertically. Green arrowheads in (B,D,F,R,T,Y,Z,AB) and asterisks in (AK–AM) indicate small groups of cells expressing a PcP marker that lie within the molecularly identified JcP domain, suggesting a tangential migratory displacement. Asterisks in (N/N′,P/P′,AF/AF′): Gbx2 positive cells within the PcP. (AG–AI,AK–AM) Pseudocolored superposition of the indicated pairs of marker domains from adjacent sections, to illustrate boundary relationships between them. (AJ) Schematic view of the brain indicating the two horizontal section planes illustrated in this plate, and the position in such sections of the pretectal region that appears magnified in the panels (dashed boxes). Scale bars = 300 μm for (A–AM) and 100 μm for (N′,P′,AF′).
Additionally, we compared markers that recognize the pretecto- or diencephalo-mesencephalic boundary (DMB). To this end, we studied Pax6, Meis2, Tcf712 (previously named Tcf4), and PAX7 expression patterns. Pax6 is consistently expressed in the ventricular and mantle zones of the caudal pretectum (CoP), with a clearcut caudal end at the DMB in both animal models (Figures 2C,H,M,R,Y). We found that Meis2 expression, which appears extensively at the mesencephalic ventricular and mantle zones, stops rostrally at the mesencephalic side of the DMB boundary up to stage Q26/HH27. From Q27/HH28 onward, Meis2 expression emerges in some periventricular and superficial cells of CoP (see below; green arrows Figures 2S,T,W,Y). Tcf712 was previously reported to be expressed in the alar plate of the caudal diencephalon (thalamus and pretectum), stopping at the DMB up to stage HH24 (Ferran et al., 2007). From HH25 onward, we found that Tcf712 transcripts expand progressively caudalward within the mesencephalic alar mantle. However, Tcf712 signal remains restricted to the diencephalon at the level of the ventricular zone, stopping caudally at the DMB; therefore, this marker continues being useful for identifying this boundary (Figures 2U,X,Y). Finally, as previously described in chicken, PAX7 is widely expressed in the ventricular and mantle zones of the caudal pretectum (CoP). Although PAX7 is detected as well in the midbrain tectum, its expression is downregulated caudal to the DMB in a rostral alar midbrain territory intercalated between the pretectum and the optic tectum proper, the primordium of the tectal gray (TG; Ferran et al., 2007, 2009; see also García-Calero et al., 2002 and Puelles et al., 2007). Therefore, both species showed a sharp boundary at the DMB through the combination of PAX7 immunohistochemistry and Meis2/Tcf712 mRNA in situ hybridization (Figures 2I,N,S,Y).
As regards the ventral boundary of the pretectum, marked in chicken by Pax6 expression (neither Pax3 or PAX7 reach ventrally the alar–basal boundary), it also was comparable in the quail (Figures 2C,H and 8J). In both cases, moreover Tcf712 expression reaches dorsally the roof–alar plate boundary (Figures 2U′,X′ and 8K).
Conserved Molecular Profile of the Precommissural Pretectum during Early Mantle Histogenesis
Ventricular (v), periventricular (pe), intermediate (i), and superficial strata (su) can be distinguished in the PcP at the stages analyzed (Rendahl, 1924; Senn, 1970, 1979; Ferran et al., 2009). During the pronuclear period, the thick intermediate stratum becomes subdivided into deep (di), middle (mi), and outer (oi) intermediate layers (Ferran et al., 2009).
Bhlhb4, Dbx1, Ebf1, Meis1, and Pax3 mRNA expression mark the PcP derivatives, therefore we compared these patterns with those of Gbx2, Lim1, and Six3 in order to clearly identify the rostral and caudal boundaries of PcP (Figure 3). Meis1 appears expressed at the PcP ventricular zone and all corresponding mantle layers in both avian species at stages Q26/HH26–Q27/HH27, but at Q28/HH28 its signal clearly decreased in the pe mantle layer (Figures 3A–D, 4A–F,Y–AD, and 7). A pioneering group of Meis1-positive PcP cells apparently moving incipiently into the JcP domain was clearly observed at HH26 (green arrowhead, or asterisk, in Figures 3B,D,F,AK,AL). At stages Q27/HH27–Q28/HH28 there is a population of cells expressing strongly Meis1 in the deep part of the intermediate layer (di), which, when compared to Six3 signal (a JcP marker), are revealed as PcP cells that have translocated into the JcP domain. This is the primordium of the dorsocaudal pretectal nucleus, which later also penetrates the CoP (Ferran et al., 2009). Pax3 mRNA was only detected at the v and pe layer of the PcP mantle zone in both species (Figures 3I–L, 5G,V, and 7). We observed a previously undescribed stream of Gbx2 positive cells localized in the periventricular layer of the PcP (Figures 2O, 3N,N′,P,P′,AF,AF′, and 7). This Gbx2 signal was visualized at dorsal levels of the PcP from stage Q26/HH26 onward, and it increased progressively at later stages (asterisk in Figures 2O′, 3N,P,AF). Bhlhb4 mRNA expression was strongly present at the PcP pe and i strata in both species. As described for Meis1, we observed a few Bhlhb4 positive cells originated from the PcP di layer that apparently translocate into the JcP domain (green arrow, Figures 3Q–T,AH,AI and 7). Dbx1 transcripts appear in the PcP pe layer and in a salt and pepper pattern at the v stratum, in both species. The expression of this gene does not stop at the thalamo-pretectal limit, but continues in p2 within the habenular region (Figures 3U–X and 7). Ebf1 mRNA expression was observed throughout the PcP mantle layers, but not at the ventricular stratum. At dorsal PcP levels, Ebf1 expression extends also into the habenular region of p2, but more ventrally it clearly stops at the boundary between thalamus and pretectum. As reported above for Meis1and Bhlhb4-positive cells, comparison of the expression patterns of Ebf1 and Lim1 (JcP marker) showed some Ebf1-positive cells from the PcP di layer entering the JcP domain (green arrow, or asterisk; Figures 3Y–AD,AM and 7). Finally, a cluster of Gata3-expressing cells was observed at the PcP oi and su strata from both species (Figures 4S–V,AQ–AT).
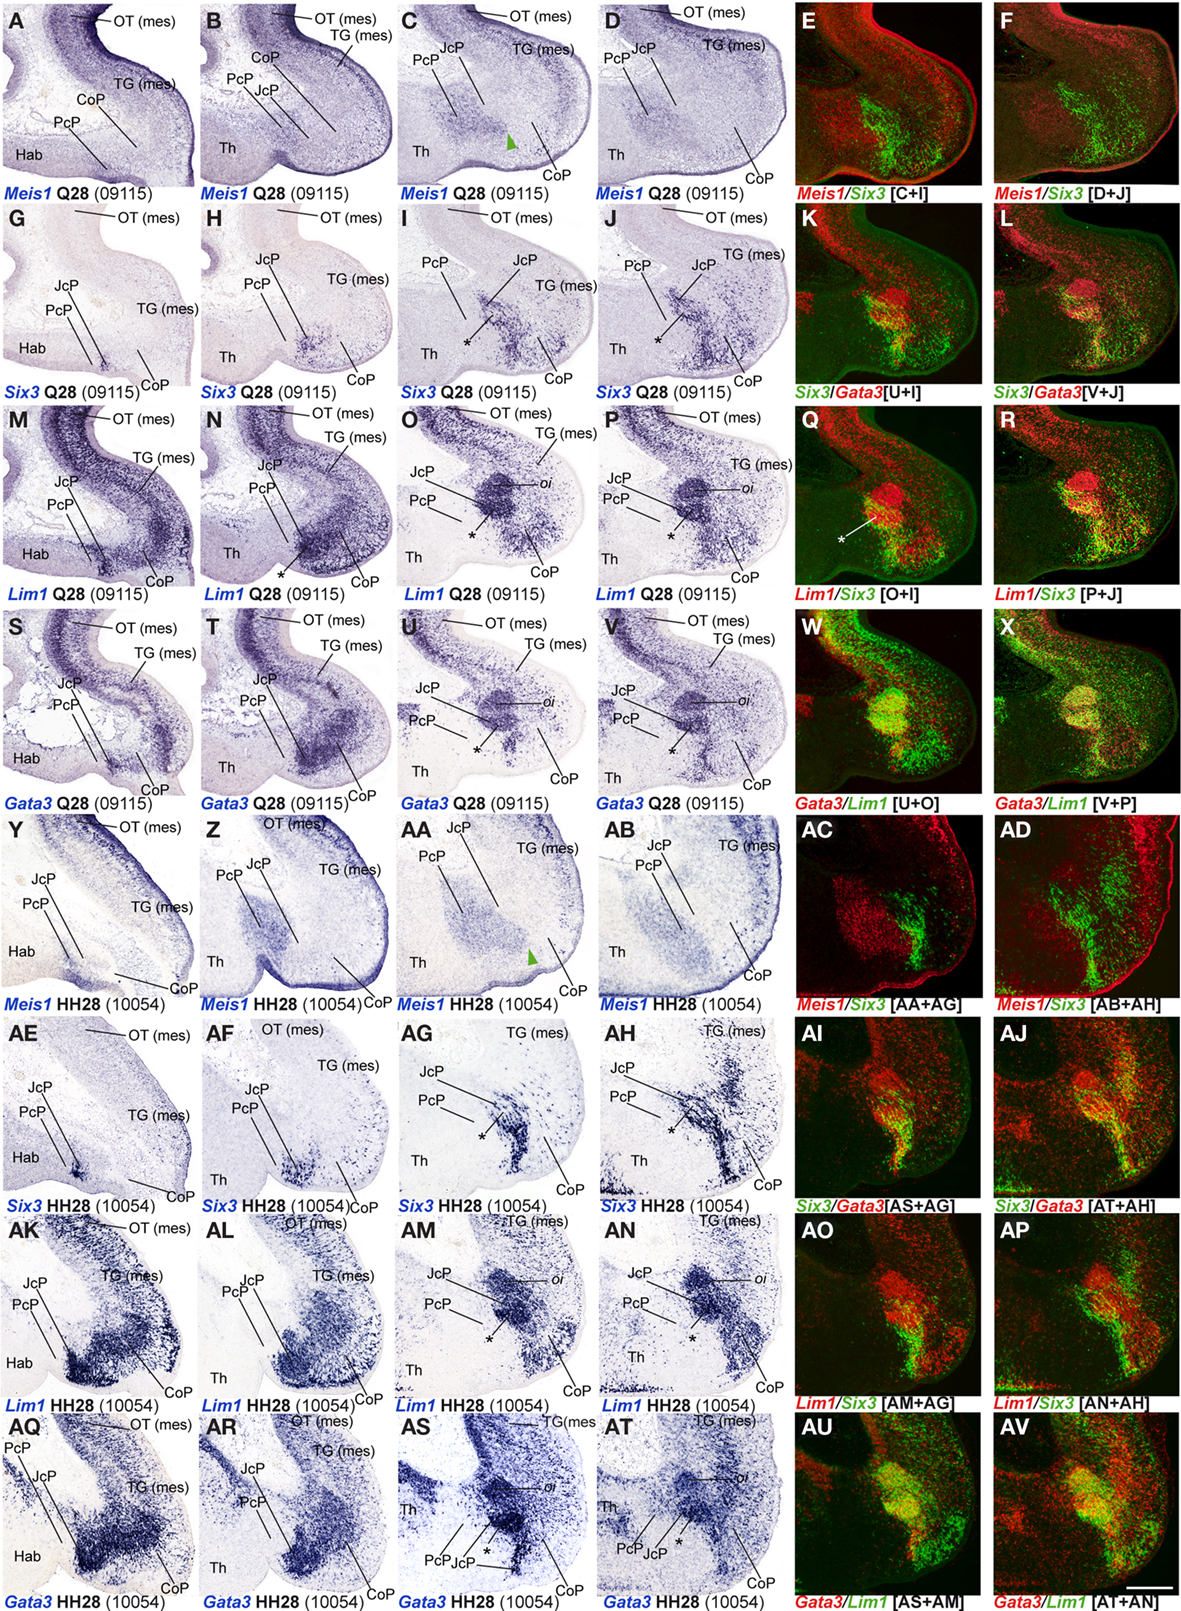
Figure 4. (A-AV) Comparisons of in situ hybridization data for four JcP markers at Q28/HH28 in horizontal cryostat sections at four section levels (in each case a single specimen). The markers are identified at the bottom left corner of each panel. Each row of panels [e.g., (A–F)] shows from left to right four section levels (dorsal to ventral sequence) reacted for a particular marker, followed by two pseudocolored images comparing the same marker, but paired with another at the two ventral-most levels studied. The first four rows show different markers in the quail, and the last four rows contain comparable material for the chick, so that panels taken long the vertical columns represent essentially the same section level and are comparable across the species. Green arrowheads in (C,AA) mark cells expressing a PcP marker that are found inside the differentially specified JcP domain. Asterisks in (I,J,O,P,U,V,AG,AH,AM,AN,AS,AT) identify the developing lateral spiriform nucleus. Numbers between brackets: code of the specimen in our collection. Scale bar = 300 μm.
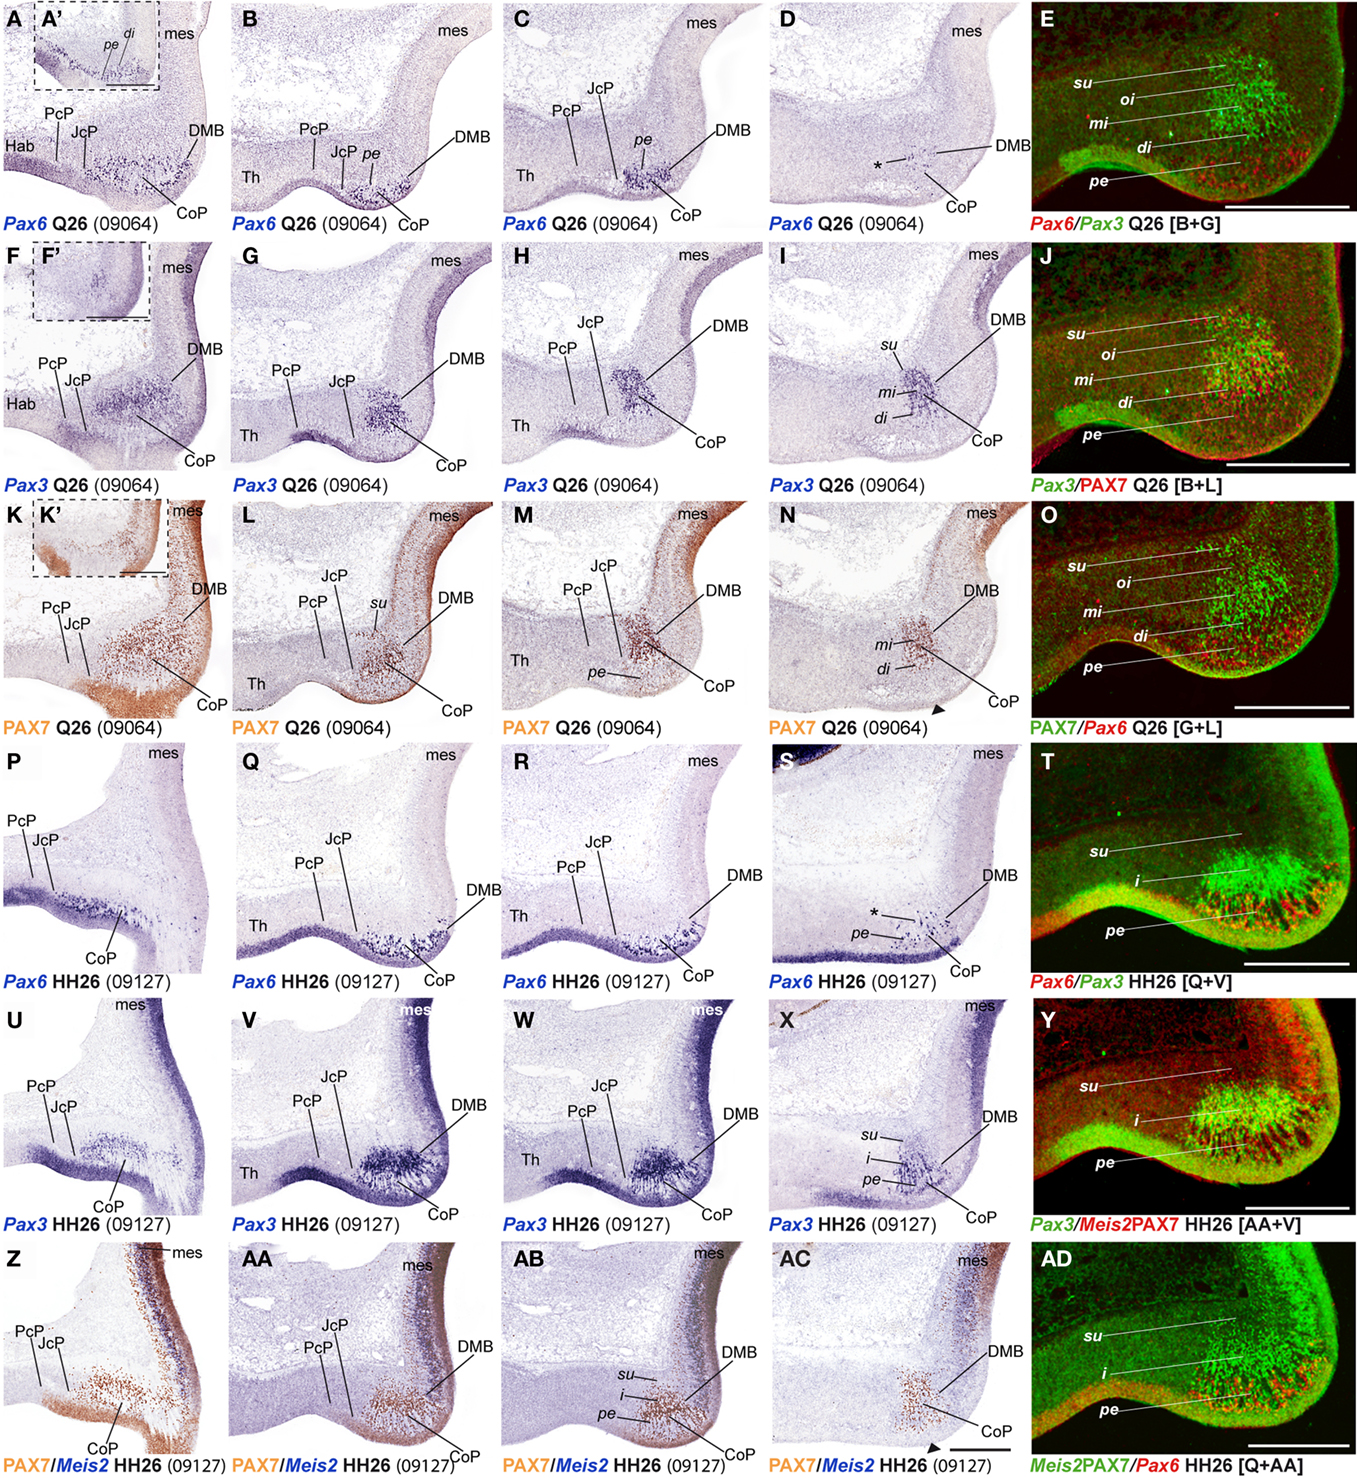
Figure 5. (A–AD) Comparisons of in situ hybridization/immunochemical data for three CoP markers at Q26-HH26 in horizontal cryostat sections at four section levels (in each case a single specimen). The markers are identified at the bottom left corner of each panel. Each row of panels [e.g., (A–E)] shows from left to right four section levels (dorsal to ventral sequence) reacted for a particular marker, followed by a pseudocolored image comparing the same marker, but paired with another at the second level studied. The first three rows show different markers in the quail, and the last three rows contain comparable material for the chick, so that panels taken long the vertical columns represent essentially the same section level and are comparable across the species. Insets (A′,F′,K′) show a more dorsal section level, illustrating details of expression of the corresponding marker. Black arrowheads in (N,AC) indicate ventral levels of CoP ventricular zone lacking PAX7 immunoreaction. Asterisks in (D,S) identify Pax6 positive cells in the CoP deep intermediate layer. Numbers between brackets: code of the specimen in our collection. Scale bar in (AC) applies as well to (A–D,F–I,K–N,P–S,U–X,Z–AB). Scale bars = 300 μm.
Conserved Molecular Profile of the Juxtacommissural Pretectum during Early Mantle Histogenesis
To analyze the JcP region, we studied the Six3, Gata3, Lim1, and Tal2 gene expression patterns. We had previously demonstrated in chicken that Six3 is a selective cell marker for the mantle zone of the JcP domain from HH17/18 onward (Ferran et al., 2007). Here we first compared the expression patterns of Six3 and Meis1 to double-check the rostral JcP boundary along the full radial dimension (Figures 4A–L,Y–AJ). Then, we compared Six3 with the Lim1, Gata3, and Tal2 markers – all expressed throughout the JcP and CoP domains – to identify the caudal JcP boundary within these patterns (Figures 4G–X,AE–AV, 6E–L,Q–X, and 7). Between Q26/HH26 and Q28/HH28 all JcP mantle layers show Six3 expression (Figures 4G–J,AE–AH and 7), but the i stratum, in most of the sections, and the su stratum, at dorsal levels, already have started to downregulate Six3 expression at Q27/HH27 (asterisk in Figures 4I,J,AE–AH). This change in the pattern seems correlated with the onset of FoxP1 expression at the same loci (Data not shown; see Discussion). Lim1 is strongly expressed in all JcP mantle derivatives of both species, with a particularly compact appearance of the oi layer from the i stratum, which mainly represents the primordium of the lateral spiriform nucleus (asterisk Figures 4M–R,AK–AP; Ferran et al., 2009). JcP expression of Gata3 mRNA, which has not been described previously, is similar to that of Lim1 in both species (Figures 4S–V,AQ–AT). Nevertheless, a relatively stronger Gata3 signal at the JcP pe and di strata distinguishes them from the CoP ones (Figures 4U–X,AS–AV and 7). Tal2 signal is strong at the JcP pe and di, but decreases slightly at the oi layer from the dorsal and lateral subdomains; this signal is absent at the ventral JcP and CoP subdomains of both species (Figures 6E–H,Q–T and 7). Pax3 and Pax6 are expressed in the JcP ventricular zone, and PAX7 only appears in overlap at the level of the most dorsal JcP subdomains (Figures 5 and 7).
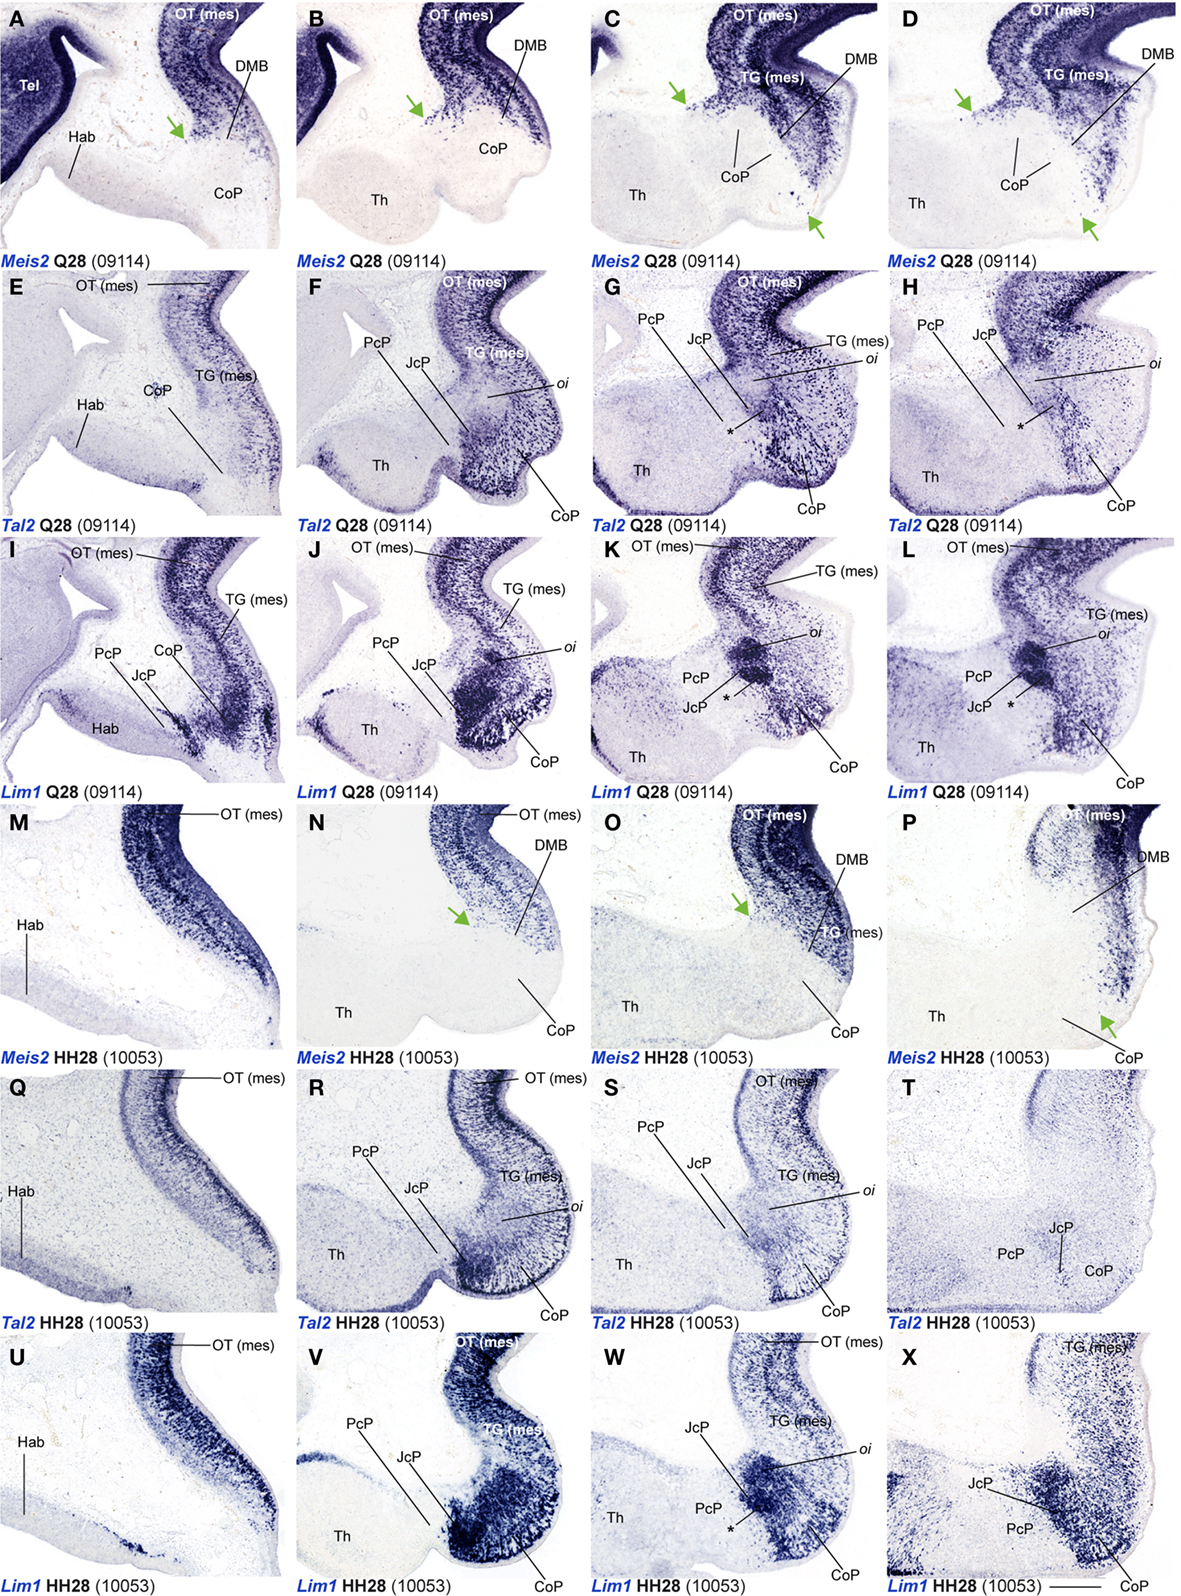
Figure 6. (A–X) Comparisons of in situ hybridization data for three markers labeling JcP and CoP at Q28/HH28 in horizontal cryostat sections at four section levels (in each case a single specimen). The markers are identified at the bottom left corner of each panel. Each row of panels [e.g., (A–D)] shows from left to right four section levels (dorsal to ventral sequence) reacted for a particular marker. The first three rows show different markers in the quail, and the last three rows contain comparable material for the chick, so that panels taken long the vertical columns represent essentially the same section level and are comparable across the species. Green arrows in (A–D,N–P) indicate apparently ectopic cells expressing Meis2 (midbrain marker) at the CoP su and pe strata. Asterisks in (G,H,K,L,W) identify the developing lateral spiriform nucleus, exhibiting high expression levels of Lim1 and a low Tal2 signal. Numbers between brackets: code of the specimen in our collection. Scale bar = 300 μm.
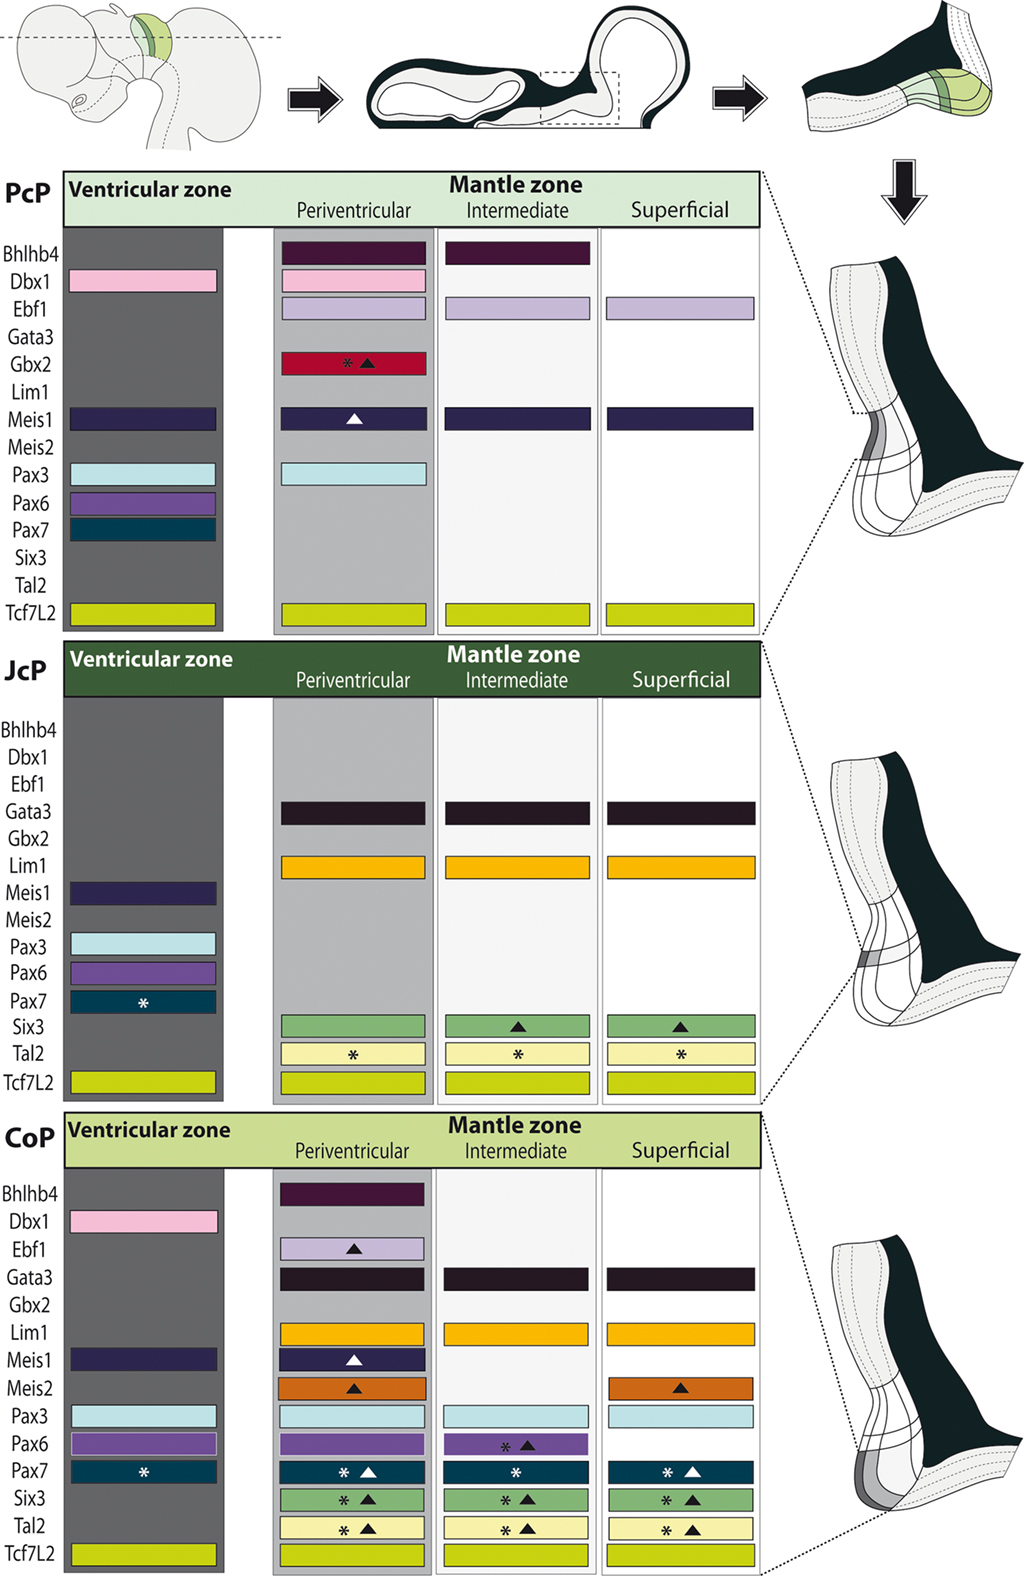
Figure 7. Schematic synthesis of the shared molecular profile examined in avian pretectal domains. Schematics on top: a lateral view of the brain shows the section plane of a representative horizontal across the three pretectal domains (color coded); such a section is illustrated next, with the boxed pretectal region; finally the topography of the three pretectal domains is shown in detail. Schematics along the right side: Enlarged and rotated copies of the detail schema above, highlighting the basic strata in the pretectum and the specific domain whose molecular profile per strata is shown at left (Dark gray: ventricular zone; light gray: periventricular stratum). Schematics at the left side: Each block represents an entire domain (PcP, JcP, CoP), where the expression of the listed genes – represented by a colored bar – is attributed to the relevant strata. The asterisks imply that this gene is not expressed throughout the dorsoventral extent of the stratum. Solid triangles imply that some cells in the stratum downregulate this mRNA (see Results).
Conserved Molecular Profile of the Commissural Pretectum during Mantle Histogenesis
In order to study radial segregation of strata and layers in the CoP domain, we compared Gata3, Lim1, Pax3, Pax6, Pax7, and Tal2 mRNA expression, adding occasional data from the Bhblb4, Dbx1, Ebf1, Meis1, Meis2, and Six3 expression patterns. The genes of the PAX family are variously combined within CoP, generating by themselves a molecular code that identifies the four strata observed from the ventricle to the pial surface (v, pe, i, su). The v zone is characterized by the expression of Pax3, Pax6, and Pax7, though Pax7 expression is absent at the most ventral alar plate levels (arrowhead; Figures 5 and 7). The pe stratum expresses strongly Pax6 and Pax7, and shows a weak Pax3 signal (Figures 5 and 7).
Starting at stages Q26 in quail and HH27 in chicken, the CoP i stratum started to be segregated in three parts, the deep, middle and outer intermediate layers (di, mi, oi). The thin di layer shows Pax7- and Pax3-positive cells (Figures 5I,J,N,O). Additionally, at stage Q26/HH27 an incipient patch of Pax6 expression was observed at the dorsal-most portion of the CoP di layer (Figures 5A,A′). At the ventral-most levels we detected a few cells of the same layer with strong Pax6 expression, which possibly constitute the primordium of the magnocelular nucleus of the posterior commissure (MCPC; Figures 5D,S). The overlying mi, oi, and su CoP mantle layers showed strong Pax7 and Pax3 signal (Figures 5F–O,U–AD). Interestingly, the specimens used to study PAX family genes belonged precisely to the same stage, according to the respective quail and chicken developmental tables (Hamburger and Hamilton, 1951; Ainsworth et al., 2010). This allowed us to detect two variant aspects between the two species. First, the relative size of the pretectum and its CoP domain was larger in chicken than in quail (Figures 9A,B). Secondly, quail specimens at an equivalent stage in contrast seemed to be relatively slightly more advanced in development, since their layering process was more advanced than in the chicken (Figure 9C; and see Discussion). In quail embryos at Q26, we observed an incipient segregation of the intermediate stratum into di, mi, and oi layers, a structural pattern that was present only in chicken from HH27 onward (Figures 5A,A′,I,J,N,O,P,X,Y,AC,AD).
Leaving apart Gata3, which had not been studied previously in this region, Lim1 and Tal2 were expressed in the CoP as previously described (Ferran et al., 2007). To determine precisely the anteroposterior boundaries of the CoP, we combined these expression patterns with Six3, thus obtaining the anterior CoP boundary, and with Meis2, highlighting the caudal limit of CoP or DMB boundary (Figures 4G–L,Q,R and 6E,F,K,L,Q,R,W,X). Comparing Lim1 with Gata3 and Tal2, we noticed that Lim1 and Tal2 are both present at the CoP pe stratum (although Tal2 signal disappears at the ventral subdomains). In addition, only a few Gata3 cells were observed at the pe of the dorsal CoP levels, though their number increases ventralward (Figures 4M–X,AK–AV and 6E–Q,X). The di, mi, and oi layers of the i mantle stratum express Lim1 and Gata3, but Tal2 was virtually absent there. The compact group of cells developing at the oi layer (the prospective pretectal-subpretectal complex; Ferran et al., 2009) and at the su stratum (terminal nuclei) express strongly Lim1 and Gata3 mRNAs (Figures 4M–X,AK–AV and 7).
Dbx1 shows a salt and pepper pattern in the v zone of the CoP, and a stronger and wider expression domain in the ventral CoP subdomains in both species (Figures 3U–X). Ebf1, Bhlhb4, and Meis1 are expressed in the pe stratum of the CoP (Figures 2L, 3S,T,Y–AB, 4B–F,Z–AD, and 7). Meis2 is expressed in a small group of cells at the CoP pe stratum and in a major cluster at the su stratum close to the DMB (green arrow, Figures 2T,W, 6A–D, M–P, and 7). Interestingly, the latter Meis2 expression was observed in a larger number of cells in the quail than in chicken of the same stage, possibly suggesting again a relatively more advanced developmental status of quail embryos. Finally, Six3 – the main JcP marker – is also expressed in some groups of cells at the CoP pe layer, a pattern that best visible at the level of ventral subdomains (CoV). Moreover, the CoV Six3 expression expands into the i mantle layers (Figures 3E–H and 4F–J,AD–AH).
Shared Molecular Profile in the Dorsoventral Subdomains
Using horizontal and transversal (coronal) sections, we were able to make a first approach to examine conservation of genoarchitectonic pattern in pretectal dorsoventral subdomains. We found strikingly identical patterns in both species. Pax6 signal at the level of the vz reaches the alar–basal boundary throughout the pretectum (Ferran et al., 2009). PAX7 expression is restricted to dorsal and lateral CoP subdomains (Figures 2, 3, 5, 7, and 8A,J–L). Six3 signal is observed in all DV subdomains of JcP and its transcripts also appear in the mantle zone of the ventral CoP subdomains. Tcf712 signal was distributed from the most dorsal basal plate domains up to the alar–roof boundary (Figures 2U,U′,X,X′, 4I–J,AG,AH, and 8C,G,K,N). Bhlhb4 and Ebf1 were observed in all DV parts of PcP (Figures 8D,E,H,I,O,P). Pax3 was found in nearly all pretectal DV subdomains, except the ventral-most ones (Figures 8B,F,M). Meis1 DV expression stopped ventrally at the alar–basal boundary of all pretectal domains in both quail and chicken (Figures 4A–F,Y–AD).
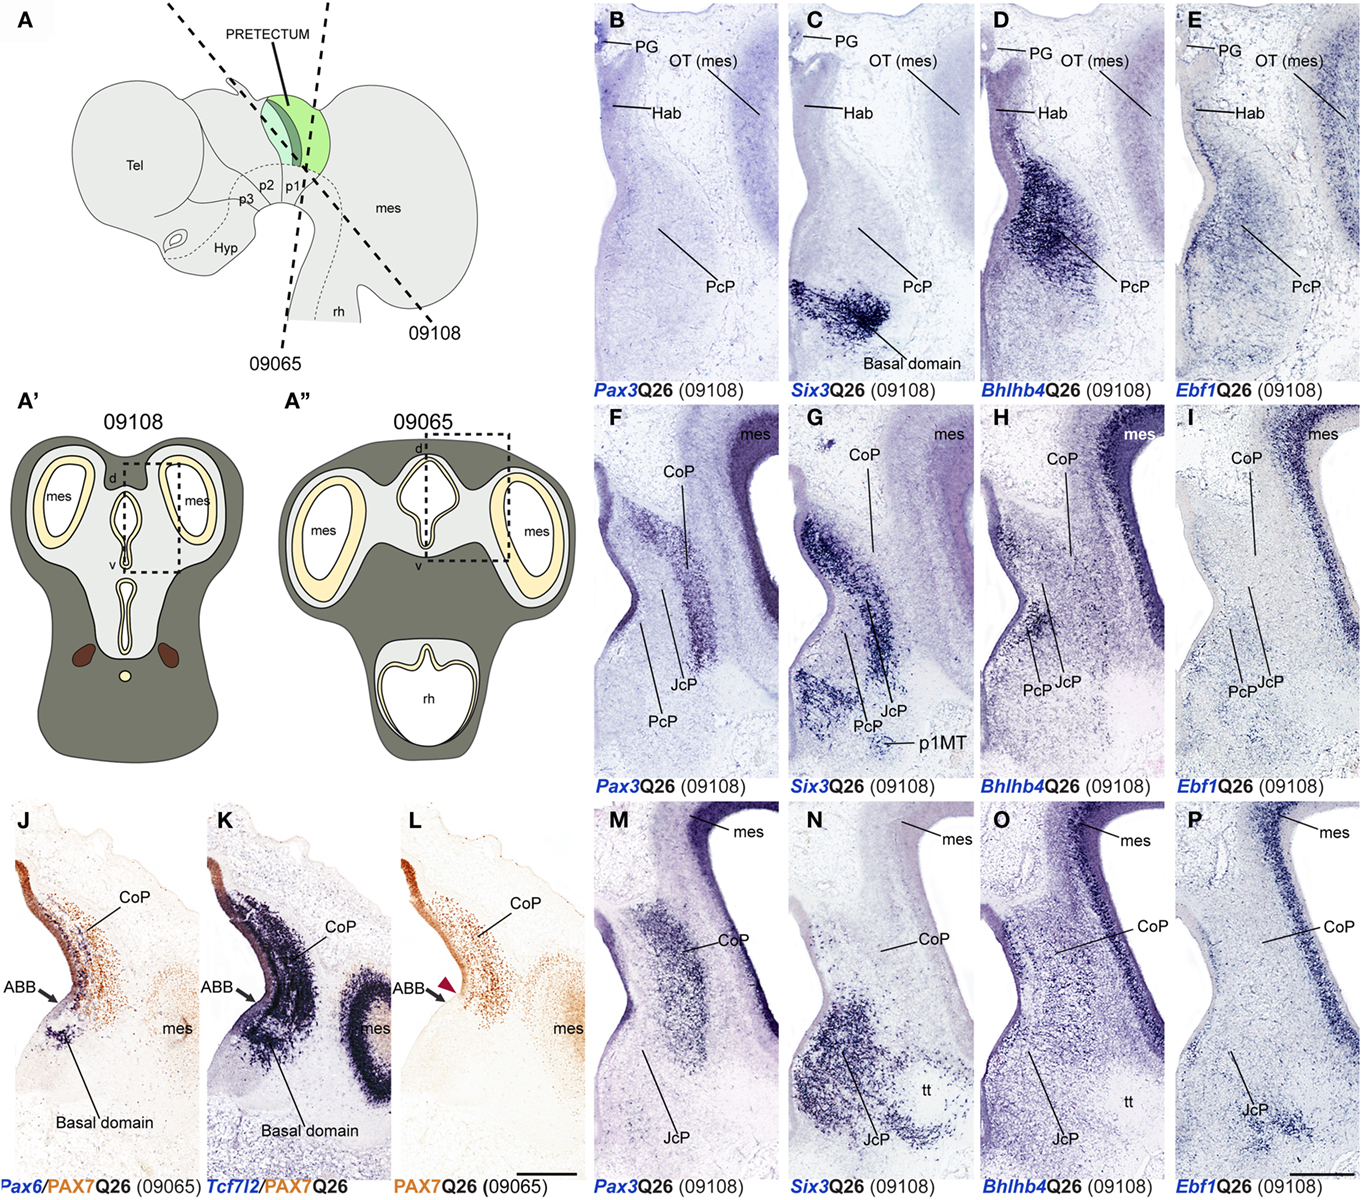
Figure 8. Dorsoventral extent of seven pretectal markers in the quail, studied by in situ hybridization/immunoreaction in transversal cryostat sections at Q26 (two specimens). (A,A′,A′) Schemata showing a lateral view with two variant transversal section planes used (see specimen code in brackets) and the respective aspect of such transversal sections, in order to illustrate the brain region analyzed in both specimens. [Block comprising (B–I,M–P)] comparisons of four markers (Pax3, Six3, Bhlhb4, Ebf1) at three section levels from rostral to caudal from a single specimen (levels arranged top to bottom along the columns). (J–L) Three adjacent transversal sections at CoP level, allowing comparison of Pax6, PAX7, and Tcf7l2 dorsoventral patterns in a different quail specimen. The red arrowhead in (L) shows the ventral-most limit of PAX7 expression, slightly above the alar–basal boundary(ABB; black arrow). Numbers between brackets: code of the specimen in our collection. Scale bar = 300 μm.
Discussion
Equivalent Developmental Stages from C. japonica (Quail) and G. gallus (Chicken) Show Different Pretectal Size and Degree of Differentiation
We staged embryos according to Ainsworth et al. (2010) for quail, and Hamburger and Hamilton (1951) for chicken. Both staging tables were generated based on standard criteria about useful external anatomical landmarks, and their stages are essentially comparable one-to-one, at least in the period examined here (Hamburger and Hamilton, 1951; Ainsworth et al., 2010). However, we found that identically staged embryos from chicken and quail are not fully equivalent as regards pretectal development (in fact, brain development in general). First, the pretectal region of chicken embryos at stages HH26–HH28 was significantly larger by roughly 30% than that of quail embryos at stages Q26–Q28 (Figure 9A). Differences among close species in the proportions of adult brain regions have been suggested to be caused by changes in cell-cycle rates and/or the timing of neurogenesis, as well as by alterations of brain patterning (Finlay and Darlington, 1995; Striedter, 2005; Menuet et al., 2007; Charvet and Striedter, 2008; Charvet et al., 2010; Sylvester et al., 2010). Our results strongly suggest that differences in patterning are not likely to be responsible for the observed variation in pretectum size. Therefore, further studies should address the effect of cell-cycle rates and timing of neurogenesis upon the observed size differences. It is of course well known that, under comparable temperature conditions, the incubation period up to hatching of quail is shorter by 84 h than the chicken one. However, comparative data about the relative length of neuroepithelial cell cycles in these two species are not available. Our results suggest that differences in brain proportions between these closely related species begin during early development, as described for mesencephalic differences between parrots and galliformes (McGowan et al., 2010). Secondly, we found that the molecularly identified quail pretectal strata developing at the CoP domain appeared slightly more mature – by representing a larger proportion of the total domain volume than the corresponding chicken counterparts at equivalent stages (Figure 9C). These differences reflect an unavoidable inaccuracy of current staging tables in predicting detailed microscopic traits heterochronic relative to macroscopic morphologic features. More complex and detailed distinctive molecular features of particular organs will be needed to upgrade the standard staging tables (e.g., as done for chicken primitive streak stages by López-Sánchez et al., 2005).
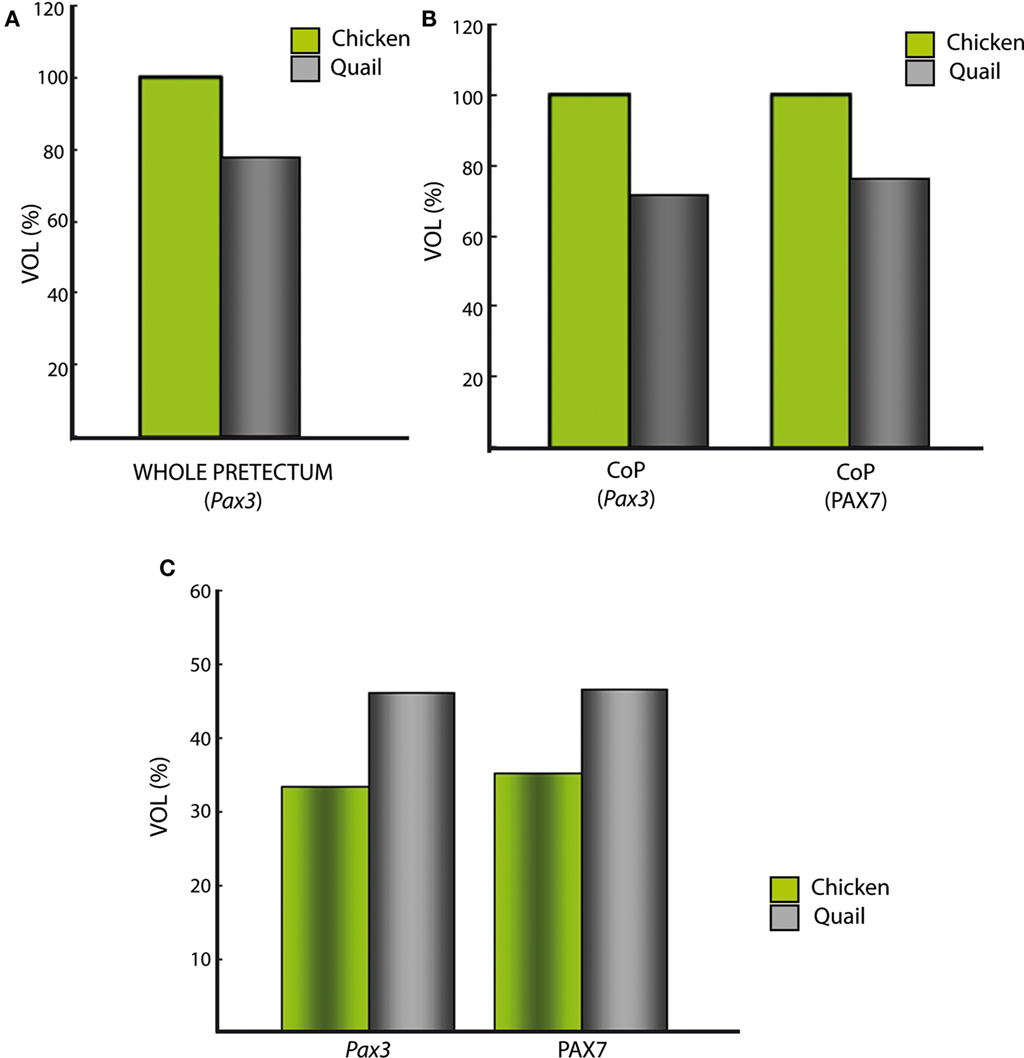
Figure 9. Comparative analysis between quail and chicken of roughly estimated relative pretectal volumes, either of whole pretectum or of selected portions. (A) Total estimated volume of pretectum extrapolated from the domain expressing Pax3. The volume in the chicken was standardized as 100%. Note the quail pretectum is about 28% smaller. (B) The color-coded bars represent the estimated volumes of the quail/chicken CoP domain, separately extrapolated from ventricular and mantle expression of the genes Pax3 and PAX7. The CoP volume of the chicken was standardized as 100%. Both calculations using Pax3 or PAX7 suggest a similar smaller size of CoP in the quail. (C) The color-coded bars represent the estimated proportion of the intermediate CoP stratum of each species relative to the respective total volume of CoP, separately extrapolated from the expression of the genes Pax3 and PAX7 (similar proportion in both cases).
Conserved Genoarchictectonic Profile of the Pretectal Domain in Phasianidae
We present a detailed comparative characterization of molecularly distinct pretectal progenitor areas from chicken (G. gallus) and quail (C. japonica) at early stages of mantle development (Q26/HH26–Q28/HH28). We found a strikingly conserved combinatorial genetic code that patterns this region in both species, strongly suggesting that this corresponds to the ancestral pretectal code for members of the family Phasianidae. We had previously defined the molecular code identifying each region, domain and subdomain (progenitor areas), as well as their respective mantle derivatives, in chicken embryos (Ferran et al., 2007, 2008, 2009). The present study adds information for new gene expression patterns and expands our previous knowledge for some domains, in some cases modifying previously established notions.
The rostral pretectal boundary (TPB) is identified by the rostral limit of expression of Bhlbh4, Ebf1, Meis1, and Pax3 genes in both species (Ferran et al., 2007, 2008, 2009; present results). Here we confirmed that the thalamic expression of Gbx2 is a complementary boundary marker for the TPB at the studied stages. Similar thalamic Gbx2 expression was previously observed in mouse, chicken (older stages), zebrafish, and Xenopus (Bulfone et al., 1993; Niss and Leutz, 1998; Martínez-de-la-Torre et al., 2002; Kikuta et al., 2003); however, the strict complementarity of thalamic Gbx2 with pretectal Pax3 was demonstrated only recently in Xenopus (Morona et al., 2010). We nevertheless observed as well a patch of Gbx2 signal within the rostral pe stratum of PcP. It can be speculated that this result is due to some thalamic cells migrating tangentially into the neighboring pretectum. This possibility acquires relevance because observations in a mutant mouse line in which the gene Gbx2 was deleted (Gbx2CreER/−; R26R mutants) was thought to produce abnormally such a displacement of thalamic cells into the pretectum (Chen et al., 2009). Our present data suggest instead the possibility that such a movement may be constitutive in the wild type.
While Meis1 delineates the TPB (the p2/p1 interprosomeric boundary) across the whole alar plate, up to the diencephalic roof, the Dbx1, Ebf1, and Pax3 expression domains present in PcP extend across the pretecto-habenular limit into the habenular region of prosomere 2, as is also true of Pax6 and PAX7, whose CoP domains similarly extend rostralward at this dorsal level (Figures 2A,C,D,E,H,I, 3U,W,Y,AA, and 5A,P; Ferran et al., 2007, 2008, 2009). We think that the primary pattern causing these shared properties of the habenular region and the cited dorsocaudal pretectal regions is probably Pax6. At earlier stages this gene is first expressed throughout the diencephalic alar plate. Subsequently it becomes progressively downregulated at both sides of the zona limitans intrathalamica (probably a SHH-mediated effect; Hashimoto-Torii et al., 2003; Kiecker and Lumsden, 2004; Vieira et al., 2005; Vieira and Martínez, 2006; see Discussion in Ferran et al., 2007). The downregulated Pax6 expression at the level of the alar domain caudal to the zona limitans involves the thalamus proper in p2 and the PcP and JcP domains in p1; so that Pax6 expression persists at the habenula, in p2, as well as at dorsal parts of PcP and JcP, and at the entire CoP, in p1, that is, the sites farthest from the zona limitans intrathalamica. This Pax6 pattern possibly stabilizes Pax3 and Pax7 in the same mixed area, with a corresponding distribution of genes such as Dbx1, Ebf1 (Pax6 transiently upstream of them before it becomes downregulated at PcP). The Meis1 pattern thus importantly establishes the neuromeric limit at this dorsal level between the thalamic habenular region and the pretectum. The overlapping distribution of pretectal Meis1 and Pax3 was also observed for the mouse, and comparable Pax3 data exist also for Xenopus (Toresson et al., 2000; Ferran et al., 2008; Morona et al., 2010). Interestingly, Pax3 and Meis genes have been suggested to be part of a specific regulatory network involved in the development of the rhombencephalon in Xenopus (Elkouby et al., 2010; Gutkovich et al., 2010); further studies should address whether a similar relationship of these transcription factors exists in the patterning of the pretectal region of vertebrates.
The caudal pretectal boundary was marked by the expression domains of Pax6 and Tcf712 (Tcf4; rostral side) and Meis2 (caudal side) during early chicken development. However, only Pax6 has been studied extensively throughout development (Ferran et al., 2007, 2008, 2009). Here we found that Tcf712 (Tcf4) is also expressed in the midbrain mantle from stage Q25/HH25 onwards, but its DMB boundary persists at the ventricular zone at the stages analyzed. The same early diencephalic pattern and added mesencephalic expression in the mantle at later stages was observed in the mouse (Ferran et al., in preparation) and X. laevis (Morona et al., 2010, and unpublished observations). In Xenopus, some authors have misinterpreted early diencephalic Tcf7l2 expression as “rostral mesencephalon” (Kunz et al., 2004; Koenig et al., 2008, 2010); nonetheless, comparison with the Pax6 expression pattern illustrated in the same studies, as well as by Schlosser and Ahrens, (2004), clearly indicates that Tcf712 expression was only diencephalic (thalamus and pretectum) at those stages. According to the genoarchitectonic data from Schlosser and Ahrens, (2004), the distinction between p1, p2, p3, and midbrain in Xenopus is established at stages 24–27, whereas Tcf712 (Tcf4) is clearly expressed only in the diencephalon until at least stages 33–34 (Figure 1 in Morona et al., 2010). Meis2 expression in the alar mesencephalon, stopping rostrally at the DMB boundary, was described in chicken from stage HH9/10 onward (Ferran et al., 2007; Sánchez-Guardado et al., 2011). In the present study, we identified at Q27/HH28 some Meis2-positive cells in the pe and su strata from the CoP, which progressively increased in number. Those cells lying at the CoP su stratum will become part of the lateral and dorsal terminal nuclei of the accessory optic tract at later stages (data not shown), whereas the deep pe ones apparently are integrated in the pretectal periaqueductal gray. The progression of Meis2 mRNA expression suggests that the positive cells at the CoP increased progressively in clear connection with a stream of Meis2-positive cells translocating from the mesencephalic TG; a radial migration of the su cells is inconsistent with the fact that such cells never are found within the i stratum. Our analysis therefore suggests that these cells may be migrating from the TG at the rostral mesencephalon, unless, alternatively, these cells are selectively upregulating Meis2 expression independently. The few Meis2-positive cells observed in the pe stratum at all stages analyzed also show a pattern suggesting a periventricular mesencephalic TG origin. In contrast, various studies using quail/chicken chimeras or lineage analysis after infection with a recombinant retrovirus showed no quail-derived cells migrating from mesencephalon to diencephalon (Senut and Alvarado-Mallart, 1987; Gray et al., 1988; Gray and Sanes, 1991; Martínez et al., 1992; García-López et al., 2004; García-López, 2005). Nearly all of the cited quail/chicken chimera studies involved grafts of the rostral prospective optic tectum, which demonstrated a rostralward tangential migration of given tectal cell types restricted within the tectum itself, but never penetrating the TG, or crossing into diencephalic domains (Senut and Alvarado-Mallart, 1987; Figure 1 in Martínez et al., 1992; García-López et al., 2004; García-López, 2005). Similarly, the lineage studies labeled clones that were restricted to the optic tectum and confirmed strictly tectal radial and tangential migration patterns (Gray et al., 1988; Gray and Sanes, 1991; Ferran, 2002), but no rostral translocation into the diencephalon. Due either to the small size of the TG primordium, or to the traditional tendency to disregard it, no experiment so far has properly tested the fate of TG derivatives. However, alar mesencephalic quail tissue transplanted heterotopically into the chicken diencephalic alar plate produced a massive superficial dispersion of quail cells, which invaded selectively all primary retinorecipient nuclei of the chick diencephalon; it was not determined whether prospective TG tissue was included in these grafts (Martínez and Alvarado-Mallart, 1989). Notably, most of the Meis2-positive cells apparently entering the CoP from the TG occupy the superficial stratum. Further studies will be needed to test whether the TG is indeed a source of Meis2-positive cells for the pretectum or the observed pattern is a consequence of independent gene expression recruitment by pretectal cells.
At the level of the PcP domain, we similarly found Gbx2 expression in the pe layer that might be related either to migration of thalamic cells (note the signal extending caudalward from the thalamus in Figure 3P′), or to gene expression recruitment. Among available lineage tracing and fate-mapping studies relevant to the TPB, the reports of Figdor and Stern (1993) and García-López et al. (2004) did not identify thalamic clones or derivatives crossing the p1–p2 boundary, whereas Larsen et al. (2001) did observe cell movement between thalamus and pretectum, concluding that this boundary is not clonally restricted. More studies are needed to resolve this controversy. Pax6 expression starts to appear at the dorsal PcP di stratum at HH27, earlier than previously observed by us (shown at HH30/32 in Ferran et al., 2009; see asterisk in their Figures 4J,S). These cells will become part of the core of the medial pretectal nucleus (Figure 10F in Ferran et al., 2009).
The dorsocaudal nucleus (DCa), originally described by Rendahl (1924), and also known as the “medial or dorsomedial spiriform nucleus” (Edinger and Wallenberg, 1899; Kuhlenbeck, 1939; see Table 3 in Ferran et al., 2009) was found to be derived from the PcP domain on the basis of a characteristic genoarchitectonic code (expression of Bhlhb4, Ebf1, and Nbea; Figures 11–14 in Ferran et al., 2009). In our earlier study, we concluded that DCa cells migrate through the JcP domain at stage HH31 (Figures 14A,B in Ferran et al., 2009). In our present analysis, we compared in chicken and quail markers for PcP (Meis1, Ebf1, Bhlhb4) and JcP derivatives (Six3, Lim1, Tal2, Gata3), and corroborated this migration, finding in addition that the first cells that move into the JcP domain constitute a pioneering migratory group departing from the PcP di stratum at around Q27/HH27.
At the level of JcP, its characteristic marker Six3 was previously shown to become secondarily downregulated at a middle locus of the intermediate mantle stratum starting at HH27, while Lim1 and Tal2 continue to be expressed in this cluster of cells that also begins to express selectively FoxP1 and matures as the lateral spiriform nucleus (Ferran et al., 2007, 2009). Here we confirmed the whole pattern for these genes in both species, and added Gata3 expression to the molecular code characteristic of the cells constituting the prospective lateral spiriform nucleus.
The intermediate mantle layer of CoP was previously described by us to be segregated into di, mi, and oi layers at least from HH30 onward (Figure 4 in Ferran et al., 2009). Here, we provide evidence (combining Pax3, Pax7, Gata3, Lim1, and Tal2 expression patterns) that this segregation of the intermediate mantle stratum actually begins at Q26/HH27 (Figures 5 and 7).
Microevolution of Coding Sequences and Pretectal Genoarchitecture in the Phasianidae Family
The two species analyzed here belong to the well known avian order Galliformes; however, the phylogenetic relationships within this order are not well resolved yet, primarily due to the low variability in anatomical, and osteological traits, as well as to inconclusive molecular studies (Kimball et al., 1999; Crowe et al., 2006; Kriegs et al., 2007; Mayr, 2008; Tavares and Baker, 2008; Kan et al., 2010a,b; Shen et al., 2010). Based on the combined evidence from different phylogenetic analyses, Crowe et al. (2006) put forward a tentative revised classification of the Galliformes. In this classification, the order Galliformes comprises five families (Megapodiidae, Cracidae, Numididae, Odontophoridae, and Phasianidae), and the family Phasianidae encompasses seven subfamilies (Arborophilinae, Coturnicinae, Pavoninae, Gallininae, Meleagridinae, Tetraoninae, and Phasianinae). The Coturnicinae and Gallininae subfamilies include the C. japonica and G. gallus species, respectively (Figure 1A). The order Galliformes apparently started to evolve 90 million years ago, whereas the split between the families Phasianidae and Odontophoridae occurred ∼60 million years ago (Figures 1A,A′; Puelles and Medina, 2002). Analysis of mitochondrial genomes suggested that the subfamilies Phasianinae, Gallininae, and Coturnicinae evolved independently from ∼40 million years (Kan et al., 2010b; blue arrow, Figure 1A′). Therefore, the species analyzed here, C. japonica and G. gallus, have undergone a combined time of divergent evolution of ∼80 million years. We sequenced and compared the coding sequences of 12 genes, finding very low rates of genomic variation, consistent with the analyses of mitochondrial genomes. This high level of coding sequence conservation was associated with a striking degree of genoarchitectonic Bauplan conservation during early stages of nervous system development in both species. Since genoarchitectonic codes are expected to be controlled by cis regulatory elements, our data also suggest a high level of conservation of the underlying genomic regulatory sequences between both species (Davidson, 2006; Carroll, 2008).
Pretectal Genoarchitecture in Vertebrates: Degree of Phenotypic Conservation Throughout Ontogeny
Our previous studies on the genoarchitecture of the chicken pretectum have provided a starting point for comparing this region at an unprecedented level of detail among different vertebrates (Ferran et al., 2007, 2009). The present results have shown that chicken and quail pretectal genoarchitecture patterns are strikingly conserved, thus likely representing an ancestral pattern within the Phasianidae. Outgroup comparisons with other species, such as the avian superorder Neognathae (ostriches; Figure 1A), and archosaurian reptiles (e.g., a crocodile) or lepidosaurians (e.g., lizards), should corroborate whether the observed pretectal genoarchitectonic profile is plesiomorphic in all birds and reptiles. Furthermore, there is already evidence that the same molecular map and a structural anteroposterior tripartition exists in the pretectum of the mouse and Xenopus frog (Ferran et al., 2008; Morona et al., 2010), suggesting that the referred plesiomorphy may apply as well to tetrapods in general. A tripartite pretectum has been postulated as well for lamprey larvae (Pombal and Puelles, 1999; Pombal et al., 2009), which suggest we deal here with a fundamental aspect of forebrain structure in all vertebrates. Some elements of the studied pretectal molecular code were, in fact, used in Xenopus larvae to identify precisely the pretectal region, and its main subdivisions (Morona et al., 2010) working within the context of field homology in the brain (Puelles and Medina, 2002). The present results also reveal that the pattern of radial segregation of molecularly characterized mantle components (pronuclei) described for the chicken (Ferran et al., 2007, 2009) are most likely representative for all members of the family Phasianidae. This is independent of the different absolute sizes of the respective populations and domains in chicken and quail, or of the heterochronic aspects of maturation commented above. Although late stages of differentiation are commonly thought to present more phenotypic variations (Davidson, 2006), the nuclear anatomy of the adult pretectum shows little variation among studied adult birds (Karten and Hodos, 1967; Zweers, 1971; Kuenzel and Masson, 1988; Puelles et al., 2007). Our results nevertheless allow making very detailed molecular comparative analyses at the level of strata segregation or differentiation of distinct neuronal subpopulations among different bird species, or between birds and other vertebrates, thus exploring any significant variations. For example, our study in Xenopus disclosed that at early stages PAX7 was observed in the mantle zone of the JcP domain, an expression trait that we did not find in chicken or quail (Morona et al., 2010; Ferran et al., 2007, 2009; present results).
Conflict of Interest Statement
The authors declare that the research was conducted in the absence of any commercial or financial relationships that could be construed as a potential conflict of interest.
Acknowledgments
We thank Manuel Irimia for helpful comments and discussion; Dr. J. Balthazart and Dr. S. Martínez for C. japonica embryos. This work was supported by MICINN grant BFU2008-04156 and SENECA Foundation contract 04548/GERM/06-10891 to L. Puelles. P. Merchán is a postdoctoral fellow of NIH grant 1-R01-MH070370-01A2 at the L.P. lab. EST clones from the UK Chick EST Project were provided by ARK-Genomics (www.ark-genomics.org). The PAX7 monoclonal antibody developed by A. Kawakami was obtained from the Developmental Studies Hybridoma Bank, developed under the auspices of the NICHD and maintained by the University of Iowa, Department of Biological Sciences, Iowa City, IA, USA.
References
Abellán, A., and Medina, L. (2009). Subdivisions and derivatives of the chicken subpallium based on expression of LIM and other regulatory genes and markers of neuron subpopulations during development. J. Comp. Neurol. 515, 465–501.
Ainsworth, S. J., Stanley, R. L., and Evans, D. J. R. (2010). Developmental stages of the Japanese quail. J. Anat. 216, 3–15.
Bachy, I., Vernier, P., and Rétaux, S. (2001). The LIM-homeodomain gene family in the developing Xenopus brain: conservation and divergences with the mouse related to the evolution of the forebrain. J. Neurosci. 21, 7620–7629.
Bardet, S. M., Ferran, J. L., Sánchez-Arrones, L., and Puelles, L. (2010). Ontogenetic expression of Sonic hedgehog in the chicken supallium. Front. Neuroanat. 4:28. doi: 10.3389/fnana.2010.00028
Boardman, P. E., Sanz-Ezquerro, J., Overton, I. M., Burt, D. W., Bosch, E., Fong, W. T., Tickle, C., Brown, W. R., Wilson, S. A., and Hubbard, S. J. (2002). A comprehensive collection of chicken cDNAs. Curr. Biol. 19, 1965–1969.
Bovolenta, P., Mallamaci, A., Puelles, L., and Boncinelli, E. (1998). Expression pattern of cSix3, a member of the Six/sine oculis family of transcription factors. Mech. Dev. 70, 201–203.
Bulfone, A., Puelles, L., Porteus, M. H., Frohman, M. A., Martin, G. R., and Rubenstein, J. L. (1993). Spatially restricted expression of Dlx-1, Dlx-2 (Tes-1), Gbx-2, and Wnt- 3 in the embryonic day 12.5 mouse forebrain defines potential transverse and longitudinal segmental boundaries. J. Neurosci. 13, 3155–3172.
Carroll, S. B. (2008). Evo-devo and an expanding evolutionary synthesis: a genetic theory of morphological evolution. Cell 134, 25–36.
Charvet, C. J., Sandoval, A. L., and Striedter, G. F. (2010). Phylogenetic origins of early alterations in brain region proportions. Brain Behav. Evol. 75, 104–110.
Charvet, C. J., and Striedter, G. F. (2008). Developmental species differences in brain cell cycle rates between northern bobwhite quail and parakeets. Brain Behav. Evol 72, 295–306.
Chen, L., Guo, Q., and Li, J. Y. H. (2009). Transcription factor Gbx2 acts cell-nonautonomously to regulate the formation of lineage-restriction boundaries of the thalamus. Development 136, 1317–1326.
Crossland, W. J., and Uchwat, C. J. (1982). Neurogenesis in the chick ventral lateral geniculate and ectomammillary nuclei: relationship of soma size to birthdate. Brain Res. 282, 33–46.
Crowe, T. M., Bowie, R. C. K., Bloomer, P., Mandiwana, T. G., Hedderson, T. A. J., Randi, E., Pereira, S. L., and Wakeling, J. (2006). Phylogenetics, biogeography and classification of, and character evolution in, gamebirds (Aves: Galliformes): effects of character exclusion, data partitioning and missing data. Cladistics 22, 495–532.
Davidson, E. (2006). The Regulatory Genome: Gene Regulatory Networks in Development and Evolution. San Diego: Academic Press, Elsevier.
Davidson, E. H., and Erwin, D. H. (2006). Gene regulatory networks and the evolution of animal body plans. Science 311, 796–800.
Davidson, E. H., and Erwin, D. H. (2009). Evolutionary innovation and stability in animal gene networks. J. Exp. Zool. B Mol. Dev. Evol. 314, 182–186.
De Castro, F., Cobos, I., Puelles, L., and Martínez, S. (1998). Calretinin in pretecto- and olivocerebellar projections in the chick: immunohistochemical and experimental study. J. Comp. Neurol. 397, 149–162.
Echevarria, D., Vieira, C., Gimeno, L., and Martínez, S. (2003). Neuroepithelial secondary organizers and cell fate specification in the developing brain. Brain Res. Brain Res. Rev. 43, 179–191.
Edinger, L., and Wallenberg, A. (1899). Untersuchungen uber das Gehirn derTauben. Anat. Anz. 15, 245–271.
Elkouby, Y. M., Elias, S., Casey, E. S., Blythe, S. A., Tsabar, N., Klein, P. S., Root, H., Liu, K. J., and Frank, D. (2010). Mesodermal Wnt signaling organizes the neural plate via Meis3. Development 137, 1531–1541.
Fernandez, A. S, Pieau, C., Repérant, J., Boncinelli, E., and Wassef, M. (1998). Expression of the Emx-1 and Dlx-1 homeobox genes define three molecularly distinct domains in the telencephalon of mouse, chick, turtle and frog embryos: implications for the evolution of telencephalic subdivisions in amniotes. Development 125, 2099–2111.
Ferran, J. L. (2002). Desarrollo embrionario y plasticidad del sistema nervioso central. El tectum óptico como modelo. Ph.D. dissertation, University of Buenos Aires, Argentina.
Ferran, J. L., de Oliveira, E. D., Merchán, P., Sandoval, J. E., Sánchez-Arrones, L., Martínez-de-la-Torre, M., and Puelles, L. (2009). Genoarchitectonic profile of developing nuclear groups in the chicken pretectum. J. Comp. Neurol. 517, 405–451.
Ferran, J. L., Sánchez-Arrones, L., Bardet, S. M., Sandoval, J. E., Martínez-de-la-Torre, M., and Puelles, L. (2008). Early pretectal gene expression pattern shows a conserved anteroposterior tripartition in mouse and chicken. Brain Res. Bull. 75, 295–298.
Ferran, J. L., Sánchez-Arrones, L., Sandoval, J. E., and Puelles, L. (2007). A model of early molecular regionalization in the chicken embryonic pretectum. J. Comp. Neurol. 505, 379–403.
Figdor, M. C., and Stern, C. D. (1993). Segmental organization of embryonic diencephalon. Nature 363, 630–634.
Finlay, B. L., and Darlington, R. B. (1995). Linked regularities in the development and evolution of mammalian brains. Science 268, 1578–1584.
García-Calero, E., Martínez-de-la-Torre, M., and Puelles, L. (2002). The avian griseum tectale: cytoarchitecture, NOS expression and neurogenesis. Brain Res. Bull. 57, 353–357.
García-López, M., Abellán, A., Legaz, I., Rubenstein, J. L., Puelles, L., and Medina, L. (2008). Histogenetic compartments of the mouse centromedial and extended amygdala based on gene expression patterns during development. J. Comp. Neurol. 506, 46–74.
García-López, R. (2005). Estudio experimental de las regiones prospectivas y la migración celular en el diencéfalo de aves. Ph.D. dissertation, Miguel Hernández University, Spain.
García-López, R., Vieira, C., Echevarria, D., and Martínez, S. (2004). Fate map of the diencephalon and the zona limitans at the 10-somites stage in chick embryos. Dev. Biol. 268, 514–530.
Gray, G. E., Glover, J. C., Majors, J., and Sanes, J. R. (1988). Radial arrangement of clonally related cells in the chicken optic tectum: lineage analysis with a recombinant retrovirus. Proc. Natl. Acad. Sci. U.S.A. 85, 7356–7360.
Gray, G. E., and Sanes, J. R. (1991). Migratory paths and phenotypic choices of clonally related cells in the avian optic tectum. Neuron 6, 211–225.
Guillemot, F. (2007). Spatial and temporal specification of neural fates by transcription factor codes. Development 134, 3771–3780.
Gutkovich, Y. E., Ofir, R., Elkouby, Y. M., Dibner, C., Gefen, A., Elias, S., and Frank, D. (2010). Xenopus Meis3 protein lies at a nexus downstream to Zic1 and Pax3 proteins, regulating multiple cell-fates during early nervous system development. Dev. Biol. 338, 50–62.
Hamburger, V., and Hamilton, H. L. (1951). A series of normal stages in the development of the chick embryo. J. Morphol. 88, 49–92.
Hashimoto-Torii, K., Motoyama, J., Hui, C. C., Kuroiwa, A., Nakafuku, M., and Shimamura, K. (2003). Differential activities of Sonic hedgehog mediated by Gli transcription factors define distinct neuronal subtypes in the dorsal thalamus. Mech. Dev. 120, 1097–1111.
Hauptmann, G., and Gerster, T. (2000). Regulatory gene expression patterns reveal transverse and longitudinal subdivisions of the embryonic zebrafish forebrain. Mech. Dev. 91, 105–118.
Hauptmann, G., Soll, I., and Gerster, T. (2002). The early embryonic zebrafish forebrain is subdivided into molecularly distinct transverse and longitudinal domains. Brain Res. Bull. 57, 371–375.
Hidalgo-Sánchez, M., Martínez-de-la-Torre, M., Alvarado-Mallart, R. M., and Puelles, L. (2005). Distinct pre-isthmic domain, defined by overlap of Otx2 and Pax2 expression domains in the chicken caudal midbrain. J. Comp. Neurol. 483, 17–29.
Kan, X. Z., Li, X. F., Lei, Z. P., Chen, L., Gao, H., Yang, Z. I., Yang, J. K., Guo, Z. C., Yu, L., Zhang, L. Q., and Qian, C. J. (2010a). Estimation of divergent times for major lineages of galliform birds: evidence from complete mitochondrial genome sequences. Afr. J. Biotechnol. 9, 3073–3078.
Kan, X. Z., Yang, J. K., Li, X. F., Chen, L., Lei, Z. P., Wang, M., Qian, C. J., Gao, H., and Yang, Z. I. (2010b). Phylogeny of major lineages of galliform birds (Aves: Galliformes) based on complete mitochondrial genomes. Genet. Mol. Res. 9, 1625–1633.
Karten, H. J., and Hodos, W. (1967). A stereotaxic atlas of the brain of the pigeon (Columba livia). Baltimore, MD: The John Hopkins Press.
Kiecker, C., and Lumsden, A. (2004). Hedgehog signaling from the ZLI regulates diencephalic regional identity. Nat. Neurosci. 7, 1242–1249.
Kikuta, H., Kanai, M., Ito, Y., and Yamasu, K. (2003). Gbx2 homeobox gene is required for the maintenance of the isthmic region in the zebrafish embryonic brain. Dev. Dyn. 228, 433–450.
Kimball, R. T., Braun, E. L., Zwartjes, P. W., Crowe, T. M., and Ligon, J. D. (1999). A molecular phylogeny of the Pheasants and Partridges suggests that these lineages are not monphyletic. Mol. Phylogenet. Evol. 11, 38–54.
Koenig, S. F., Brentle, S., Hamdi, K., Fichtner, D., Wedlich, D., and Gradl, D. (2010). En2, Pax2/5 and Tcf-4 transcription factors cooperate in patterning the Xenopus brain. Dev. Biol. 340, 318–328.
Koenig, S. F., Lattanzio, R., Mansperger, K., Rupp, R. A., Wedlich, D., and Gradl, D. (2008). Autoregulation of XTcf-4 depends on a Lef/Tcf site on the XTcf-4 promoter. Genesis 46, 81–86.
Kriegs, J. O., Matzke, A., Churakov, G., Kuritzin, A., Mayr, G., Brosius, J., and Schmitz, J. (2007). Waves of genomic hitchhikers shed light on the evolution of gamebirds (Aves: Galliformes). BMC Evol. Biol. 7, 190. doi: 10.1186/1471-2148-7-190
Kuenzel, W. J., and Masson, M. (1988). A Stereotaxic Atlas of the Brain of the Chick (Gallus domesticus). Baltimore, MD: Johns Hopkins University Press.
Kuhlenbeck, H. (1939). The development and structure of the pretectal cell masses in the chick. J. Comp. Neurol. 71, 361–386.
Kunz, M., Herrmann, M., Wedlich, D., and Gradl, D. (2004). Autoregulation of canonical Wnt signaling controls midbrain development. Dev. Biol. 273, 390–401.
Larsen, C. W., Zeltser, L. M., and Lumsden, A. (2001). Boundary formation and compartition in the avian diencephalon. J. Neurosci. 21, 4699–4711.
López-Sánchez, C., Puelles, L., García-MartínezMartínez, V., and Rodríguez-Gallardo, L. (2005). Morphological and molecular analysis of the early developing chick requires an expanded series of primitive streak stages. J. Morphol. 264, 105–116.
Martínez, S. (1987). Estudio experimental de la conectividad tectal en relación con la región pretectal y la comisura posterior: aspectos estructurales, citoquímicos y ontogenéticos. Ph.D. dissertation, University of Murcia, Spain.
Martínez, S., and Alvarado-Mallart, R. M. (1989). Transplanted mesencephalic quail cells colonize selectively all primary visual nuclei of chick diencephalon: a study using heterotopic transplants. Brain Res. Dev. Brain. Res. 47, 263–274.
Martínez, S., Puelles, L., and Alvarado-Mallart, R. M. (1992). Tangential neuronal migration in the avian tectum: cell type identification and mapping of regional differences with quail/chick homotopic transplants. Brain Res. Dev. Brain Res. 66, 153–163.
Martínez-de-la-Torre, M., Garda, A. L., Puelles, E., and Puelles, L. (2002). Gbx2 expression in the late embryonic chick dorsal thalamus. Brain Res. Bull. 57, 435–438.
Matsunaga, E., Araki, I., and Nakamura, H. (2000). Pax6 defines the di-mesencephalic boundary by repressing En1 and Pax2. Development 127, 2357–2365.
Mayr, G. (2008). The fossil record of galliform birds: comments on Crowe et al. (2006). Cladistics 24, 74–76.
McGowan, L., Kuo, E., Martin, A., Monuki, E. S., and Striedter, G. (2010). Species differences in early patterning of the avian brain. Evolution 65, 907–911.
Menuet, A., Alunni, A., Joly, J. S., Jeffery, W. R., and Rétaux, S. (2007). Expanded expression of Sonic hedgehog in Astyanax cavefish: multiple consequences on forebrain development and evolution. Development 134, 845–855.
Morona, R., Ferran, J. L., Puelles, L., and González, A. (2010). Embryonic genoarchitecture of the pretectum in Xenopus laevis: a conserved pattern in tetrapods. J. Comp. Neurol. 519, 1024–1050.
Murakami, Y., Ogasawara, M., Sugahara, F., Hirano, S., Satoh, N., and Kuratani, S. (2001). Identification and expression of the lamprey Pax6 gene: evolutionary origin of the segmented brain of vertebrates. Development 128, 3521–3531.
Niss, K., and Leutz, A. (1998). Expression of the homeobox gene GBX2 during chicken development. Mech. Dev. 76, 151–155.
Pereira, S. L., and Baker, A. J. (2009). “Waterfowl and gamefowl (Galloanserae),” in The Time Tree of Life, eds B. S. Hedges and S. Kumar (New York: Oxford University Press), 415–418.
Pombal, M. A., Megías, M., Bardet, S. M., and Puelles, L. (2009). New and old thoughts on the segmental organization of the forebrain in lampreys. Brain Behav. Evol. 74, 7–19.
Pombal, M. A., and Puelles, L. (1999). Prosomeric map of the lamprey forebrain based on calretinin immunocytochemistry, Nissl stain, and ancillary markers. J. Comp. Neurol. 414, 391–422.
Puelles, L. (1995). A segmental morphological paradigm for understanding vertebrate forebrains. Brain Behav. Evol. 46, 319–337.
Puelles, L. (2001). Brain segmentation and forebrain development in amniotes. Brain Res. Bull. 55, 695–710.
Puelles, L., Amat, J. A., and Martínez-de-la-Torre, M. (1987). Segment-related, mosaic neurogenetic pattern in the forebrain and mesencephalon of early chick embryos: I. Topography of AChE-positive neuroblasts up to stage HH18. J. Comp. Neurol. 266, 247–268.
Puelles, L., Kuwana, E., Puelles, E., Bulfone, A., Shimamura, K., Keleher, J., Smiga, S., and Rubenstein, J. L. (2000). Pallial and subpallial derivatives in the embryonic chick and mouse telencephalon, traced by the expression of the genes Dlx-2, Emx-1, Nkx- 2.1, Pax-6, and Tbr-1. J. Comp. Neurol. 424, 409–438.
Puelles, L., Martínez, S., Martínez-de-la-Torre, M., and Rubenstein, J. L. (2004). “Gene maps and related histogenetic domains in the forebrain and midbrain,” in The Rat Nervous System, ed. G. Paxinos (New York: Elsevier), 3–25.
Puelles, L., Martínez-de-la-Torre, M., Paxinos, G., Watson, C., and Martínez, S. (2007). The Chick Brain in Stereotaxic Coordinates. An Atlas Featuring Neuromeric Subdivisions and Mammalian Homologies. San Diego: Academic Press, Elsevier.
Puelles, L., and Medina, L. (2002). Field homology as a way to reconcile genetic and developmental variability with adult homology. Brain Res. Bull. 57, 243–255.
Puelles, L., and Rubenstein, J. L. (1993). Expression patterns of homeobox and other putative regulatory genes in the embryonic mouse forebrain suggest a neuromeric organization. Trends Neurosci. 16, 472–479.
Puelles, L., and Rubenstein, J. L. (2003). Forebrain gene expression domains and the evolving prosomeric model. Trends Neurosci. 26, 469–476.
Redies, C., Arndt, K., and Ast, M. (1997). Expression of the cell adhesion molecule axonin-1 in neuromeres of the chicken diencephalon. J. Comp. Neurol. 381, 230–252.
Redies, C., Ast, M., Nakagawa, S., Takeichi, M., Martínez-de-la-Torre, M., and Puelles, L. (2000). Morphologic fate of diencephalic prosomeres and their subdivisions revealed by mapping cadherin expression. J. Comp. Neurol. 421, 481–514.
Rendahl, H. (1924). Embryologische und morphologische Studien über das Zwischenhirn beim Huhn. Acta Zool. 5, 241–344.
Sánchez-Arrones, L., Ferran, J. L., Rodríguez-Gallardo, L., and Puelles, L. (2009). Incipient forebrain boundaries traced by differential gene expression and fate mapping in the chick neural plate. Dev. Biol. 335, 43–65.
Sánchez-Guardado, L. ó., Irimia, M., Sánchez-Arrones, L., Burguera, D., Rodríguez-Gallardo, L., García-Fernández, J., Puelles, L., Ferran, J. L., and Hidalgo-Sánchez, M. (2011). Distinct and redundant expression and transcriptional diversity of Meis gene paralogs during chicken development. Dev. Dyn. doi:10.1002/dvdy.22621
Schlosser, G., and Ahrens, K., (2004). Molecular anatomy of placode development in Xenopus laevis. Dev. Biol. 271, 439–466.
Senn, D. G. (1970). The stratification in the reptilian central nervous system. Acta Anat. (Basel) 75, 521–552.
Senn, D. G. (1979). “Embryonic development of the central nervous system,” in Biology of the Reptilia, Chapter 4, Vol. 9, Neurology A (RG. Northcutt and PH. Ulinski), ed. C. Gans (London: Academic Press). 173–244.
Senut, M. C., and Alvarado-Mallart, R. M. (1987). Cytodifferentiation of quail tectal primordium transplanted homotopically into the chick embryo. Brain Res. 429, 187–205.
Shen, Y. Y., Liang, L., Sun, Y. B., Yue, B. S., Yang, X. J., Murphy, R. W., and Zhang, Y. P. (2010). A mitogenomic perspective on the ancient, rapid radiation in the Galliformes with an emphasis on the Phasianidae. BMC Evol. Biol. 10, 132. doi: 10.1186/1471-2148-10-132
Shimamura, K., Hirano, S., McMahon, A. P., and Takeichi, M. (1994). Wnt-1-dependent regulation of local E-cadherin and alpha N-catenin expression in the embryonic mouse brain. Development 120, 2225–2234.
Sylvester, J. B., Rich, C. A., Loh, Y. H., van Staaden, M. J., Fraser, G. J., and Streelman, J. T. (2010). Brain diversity evolves via differences in patterning. Proc. Natl. Acad. Sci. U.S.A. 107, 9718–9723.
Tavares, E. S., and Baker, A. J. (2008). Single mitochondrial gene barcodes reliably identify sister-species in diverse clades of birds. BMC Evol. Biol. 8, 81. doi: 10.1186/1471-2148-8-81
Toresson, H., Parmar, M., and Campbell, K. (2000). Expression of Meis and Pbx genes and their protein products in the developing telencephalon: implications for regional differentiation. Mech. Dev. 94, 183–187.
Vieira, C., Garda, A. L., Shimamura, K., and Martínez, S. (2005). Thalamic development induced by Shh in the chick embryo. Dev. Biol. 284, 351–363.
Vieira, C., and Martínez, S. (2006). Sonic hedgehog from the basal plate and the zona limitans intrathalamica exhibits differential activity on diencephalic molecular regionalization and nuclear structure. Neuroscience 143, 129–140.
Yoon, M. S., Puelles, L., and Redies, C. (2000). Formation of cadherin-expressing brain nuclei in diencephalic alar plate divisions. J. Comp. Neurol. 421, 461–480.
Keywords: prosomere 1, precommissural pretectum, juxtacommissural pretectum, commissural pretectum, Galliformes, Phasianidae, forebrain, diencephalon
Citation: Merchán P, Bardet SM, Puelles L and Ferran JL (2011) Comparison of pretectal genoarchitectonic pattern between quail and chicken embryos. Front. Neuroanat. 5:23. doi: 10.3389/fnana.2011.00023
Received: 05 November 2010;
Paper pending published: 29 December 2010;
Accepted: 23 March 2011;
Published online: 05 April 2011
Edited by:
Fernando Martinez-Garcia, University of Valencia, SpainReviewed by:
Frank Schubert, University of Portsmouth, UKRuth Morona, Complutense University, Spain
Salvador Martinez, University Miguel Hernandez, Spain
Copyright: © 2011 Merchán, Bardet, Puelles and Ferran. This is an open-access article subject to a non-exclusive license between the authors and Frontiers Media SA, which permits use, distribution and reproduction in other forums, provided the original authors and source are credited and other Frontiers conditions are complied with.
*Correspondence: José L. Ferran, Department of Human Anatomy and Psychobiology, School of Medicine, University of Murcia, Campus Espinardo E30071, Murcia, Spain. e-mail: jlferran@um.es