Asymmetrical interhemispheric connections develop in cat visual cortex after early unilateral convergent strabismus: anatomy, physiology, and mechanisms
- 1 Laboratoire de Physiologie de la Perception et de l’Action, Collège de France, Paris, France
- 2 Laboratoire de Physiologie de la Perception et de l’Action, CNRS UMR 7152, Paris, France
- 3 Service d’Ophtalmologie, Hôpital Robert Debré, Paris, France
In the mammalian primary visual cortex, the corpus callosum contributes to the unification of the visual hemifields that project to the two hemispheres. Its development depends on visual experience. When this is abnormal, callosal connections must undergo dramatic anatomical and physiological changes. However, data concerning these changes are sparse and incomplete. Thus, little is known about the impact of abnormal postnatal visual experience on the development of callosal connections and their role in unifying representation of the two hemifields. Here, the effects of early unilateral convergent strabismus (a model of abnormal visual experience) were fully characterized with respect to the development of the callosal connections in cat visual cortex, an experimental model for humans. Electrophysiological responses and 3D reconstruction of single callosal axons show that abnormally asymmetrical callosal connections develop after unilateral convergent strabismus, resulting from an extension of axonal branches of specific orders in the hemisphere ipsilateral to the deviated eye and a decreased number of nodes and terminals in the other (ipsilateral to the non-deviated eye). Furthermore this asymmetrical organization prevents the establishment of a unifying representation of the two visual hemifields. As a general rule, we suggest that crossed and uncrossed retino-geniculo-cortical pathways contribute successively to the development of the callosal maps in visual cortex.
Introduction
In adult mammals, the left and right halves of the visual field project to the opposite hemispheres. Continuity is ensured in primary visual cortex by interhemispheric callosal connections (CC) which mediate representations of the central vertical meridian (CVM) and its vicinity (Berlucchi et al., 1967; Hubel and Wiesel, 1967; Berlucchi and Rizolatti, 1968; Leporé and Guillemot, 1982; Payne, 1990a,b, 1991; Payne and Siwek, 1991; Milleret and Buser, 1993; Milleret et al., 1994, 2005; Nakamura et al., 2008; cf. Figure 1). Anatomical and functional data from cat visual cortex indicate that the development of CC occurs progressively from birth (Innocenti et al., 1977; Elberger, 1993; Aggoun-Zouaoui and Innocenti, 1994; Milleret et al., 1994; Aggoun-Zouaoui et al., 1996), and depends on postnatal visual experience. However, the latter data are sparse and incomplete (e.g., Innocenti and Frost, 1979; Olavarria, 1995; Schmidt et al., 1997; Milleret and Houzel, 2001; Tagawa et al., 2008; Alekseenko et al., 2009). Thus, the consequences of abnormal postnatal visual experience on the development of CC and on their role in unifying both hemifields remain unclear. The present study addresses this issue by using early unilateral convergent strabismus as a model of abnormal experience. Subsequent development of CC in cat visual cortex was investigated at the level of callosal terminals by combining electrophysiology and tracer injection techniques. Although controversial, some anatomical data in the literature have already suggested that procedure this may lead to asymmetric callosal connections in one hemisphere and the other in adulthood (Lund and Mitchell, 1979; Berman and Payne, 1983; but see Elberger et al., 1983; Bourdet et al., 1996).
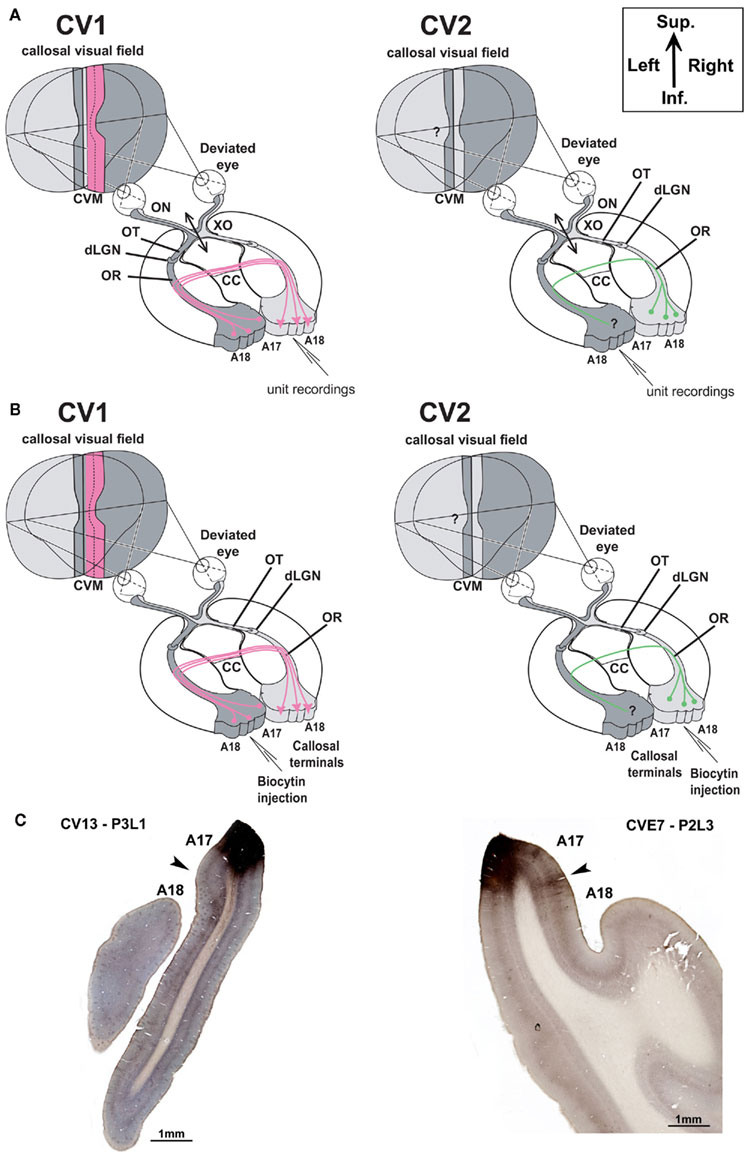
Figure 1. Experimental designs. (A) Electrophysiological characterization of visual callosal transfer in the CV1 and CV2 groups. Diagrams are based on the normal organization of the cat visual system. Each visual hemifield is represented in the contralateral hemisphere (in light and dark gray, respectively). Continuity is however ensured by “symmetric” cortical representations of the central vertical meridian (CVM) and its vicinity in each visual cortex (A17 and A18) that are reciprocally connected by interhemispheric callosal connections (CC). In addition to the convergent deviation of their right eye, the optic chiasm was sectioned midsagitally 3 days before cortical recordings (XO, double arrow). Thus, crossed fibers originating from both nasal retinas were severed while uncrossed fibers originating from both temporal retinas remained intact and projected to the ipsilateral visual cortex via the optic nerve (ON), the optic tract (OT), the dorsal lateral geniculate nucleus (dLGN) and the optic radiations (OR). In the CV1 group, previously to the present study (cf. Milleret and Houzel, 2001), single units were recorded in the right hemisphere, thus ipsilaterally to the deviated eye. Stimulating the non-deviated (left) eye activated the transcallosal pathway (in pink color) while the stimulation of the deviated (right) eye activated the ipsilateral retino-geniculo-cortical pathway. This allowed establishing that callosal terminals in this group are exuberant compared to normal. We also demonstrated that the “callosal visual field” seen through these terminals is larger than normal (dotted vertical line) and looses any contact with the central vertical meridian (CVM) of the visual field while it has some normally (see text for further details). In our CV2 group here, in order to characterize a possible asymmetry, we made the reverse exploration. Single unit were recorded in the left hemisphere, thus ipsilaterally to the non-deviated eye. Stimulating the deviated (right) eye activated the transcallosal pathway while the stimulation of the non-deviated (left) eye activated the ipsilateral retino-geniculo-cortical pathway. How callosal terminals in visual cortex and “callosal visual field” (here in “green”) develop in this case is the present question. (B,C) Anatomical characterization of callosal terminals in visual cortex of strabismic cats (CV1 and CV2 groups). (B) In contrast to (A) the optic chiasm was not sectioned here. In the CV1 group, biocytin was injected in the left visual cortex in order to label terminals of single callosal axons in the right visual cortex, ipsilateral to the deviated eye. On the basis of previously obtained functional data (Milleret and Houzel, 2001), the expected anatomical data are summarized in pink. After strabismus, both callosally projecting neurons in the left hemisphere and callosal terminals in the right would display exuberant distributions compared to normal. In the CV2 group, to identify a possible asymmetry of the callosal connections between the hemispheres because of strabismus, biocytin was injected in the right visual cortex in order to label terminals of single callosal axons in the left visual cortex, ipsilateral to the non-deviated eye. Callosally projecting cells are known to display a larger distribution than normal (see Text); our study aims to quantify the extent of these terminals (in green). (C) Examples of injection sites (zones in dark) in the left and right hemispheres (from CV1 and CV2 groups respectively). Section thickness was 75 μm; at left, the section was additionally colored with the Nissl method to identify cortical layers. Sup, superior; Inf, inferior.
The idea that CC in cat visual cortex contribute to unifying the representation of both visual hemifields has emerged progressively over the years. Early studies showed that callosal fibers transmit signals originating from the CVM and its vicinity (Berlucchi et al., 1967; Hubel and Wiesel, 1967), and that units recorded simultaneously in the callosal zone of each hemisphere display overlapping spatial distributions of their receptive fields (RFs; Leicester, 1968; Payne, 1990a,b, 1991, 1994; Payne and Siwek, 1991). However, a direct proof was only made possible by using the split-chiasm preparation (Berlucchi and Rizolatti, 1968; Leporé and Guillemot, 1982; Milleret and Buser, 1993; Milleret et al., 1994, 2005; Rochefort et al., 2007; Figure 1). This surgery allows direct activation of the transcallosal (TC) pathway by stimulating the eye contralateral to the explored cortex, as well as direct activation of the geniculo-cortical (GC) pathway by stimulating the ipsilateral eye. This showed that TC units are situated mainly in layers II/III of the transition zone between A17 and A18 (17/18 TZ), with RFs distributed along the CVM, between 13° in the ipsilateral hemifield to the explored cortex to 6° in the contralateral hemifield (Milleret et al., 2005). Their spatial distribution in the left and the right hemifields, corresponding to the “callosal visual field,” mirror one another. Such TC units were also revealed to be binocular, with TC- and GC-RFs encoding similar orientation selectivity and substantially overlapping. But couples of RFs displayed position disparity (m ≈ 5°), mainly of the crossed type. This suggests that under normal conditions the CC are mainly involved in coarse depth perception in front of the fixation plane. Anatomical studies have further shown that CC in cat visual cortex display a non-mirror-symmetric organization between the two hemispheres (Olavarria, 1996, 2001). Callosal-projecting neurons are found within rather large portions of A17 and A18. On the other hand, most of the terminals in the other hemisphere are located around the 17/18 TZ, except caudally where they also invade substantial portions of both A17 and A18 (Innocenti and Fiore, 1976; Payne and Siwek, 1991; Houzel et al., 1994; e.g., Innocenti, 1986 for review). Finally, both neurons and callosal terminals are found mainly within cortical layers II and III (Innocenti and Fiore, 1976; Payne, 1990a,b; Houzel et al., 1994).
During normal development, the CC’s contribution to unifying the split representation of the visual field develops progressively during the first four postnatal months, i.e., during the critical period (Hubel and Wiesel, 1970). Two weeks after birth (i.e., around eye opening in cats), TC units display tangential and radial distributions similar to the case in adults, with RFs located in the 17/18 TZ, mainly in supra-granular layers (Milleret et al., 1994). However, their functional properties are still immature. Their RFs are located on the CVM, as well as in a large portion of the ipsilateral hemifield (as far as 20°). Position disparity between TC- and GC-RFs for binocular units is about 16° at 21 postnatal days (PND) and thus exceeds the value of 5° found in adult animals. Finally, spontaneous activity, response strength, orientation selectivity, and response to slits moving at middle-range velocities are also low compared to adult animals. Anatomical studies have also shown that the specific organization of the callosal connections found in adult cats is not innate, but rather is refined during the critical period. In kittens, callosal neurons are initially located in extensive portions of A17 and A18 (Innocenti et al., 1977). Their callosal terminals are initially exuberant, although restricted to the 17/18 TZ when entering the contralateral cortex (Innocenti, 1981; Innocenti and Clarke, 1984; Innocenti et al., 1986; but see Elberger, 1993). The number of callosal axons is also much greater than in adults, and is considerably reduced during development (Berbel and Innocenti, 1988). Nevertheless, synapses are already predominant in supra-granular layers of the 17/18 TZ (Aggoun-Zouaoui and Innocenti, 1994; Aggoun-Zouaoui et al., 1996).
The development of callosal connections in visual cortex of higher mammals is highly dependent on postnatal visual experience. For example, we have previously shown that early convergent strabismus induced at PND 6 leads to functional abnormalities of CC in adulthood in the hemisphere ipsilateral to the deviated eye (Milleret and Houzel, 2001; “CV1 group,” Figure 1A). Contrary to normal animals, numerous TC units can be recorded outside of the 17/18 TZ, both in A17 and in A18, but also in the white matter (WM). TC units exhibit additional functional deficits usually associated with strabismus, such as decreased binocularity, ability to respond to fast-moving stimuli, or increased RF sizes. Many units also exhibit reduced orientation selectivity and increased position disparity. Most importantly, the location of the TC-RFs falls within the hemifield ipsilateral to the explored cortex, with almost no contact with the CVM, suggesting that the role of the CC in unifying both hemifields is likely to be disturbed. Our goal here is to test this by characterizing the region of the visual field “seen” by TC units in the hemisphere contralateral to the deviated eye (“CV2 group”; Figure 1A).
The few studies anatomically characterizing callosal connections in strabismic cats are highly diverse, precluding an overall view. Experimental conditions often vary from one study to another, and can be imprecise, dealing with monocular and binocular strabismus, or convergent and divergent deviations. In cases of monocular strabismus, there was often no mention of which hemisphere was studied with respect to the deviated eye. At the present time, some authors claim that strabismus leads to extended distribution of cell bodies of callosal neurons in one or both hemispheres through the stabilization of juvenile exuberant ones (Innocenti and Frost, 1979; Berman and Payne, 1983; Elberger et al., 1983). But other authors do not agree with this view (Lund et al., 1978; Bourdet et al., 1996). The same conclusion has also been proposed for callosal terminals (Lund et al., 1978; Lund and Mitchell, 1979; Berman and Payne, 1983). Such discrepancies could be explained by an asymmetrical development of callosal connections between the hemispheres after early unilateral strabismus. Some data in the literature support such a hypothesis (cf. Lund and Mitchell, 1979; Berman and Payne, 1983 for details), but it has never been studied with precision.
In this study, for the first time, we fully characterize the effects of an early unilateral convergent strabismus on the development of the callosal connections in cat visual cortex, from the right hemisphere (RH) to the left one and conversely. For this purpose, functional and anatomical approaches were combined. Our results show that asymmetrical callosal connections do develop after unilateral convergent strabismus. Two complementary mechanisms are proposed to explain such a development. We also demonstrate that such asymmetric organization prevents the CC from properly unifying representation of the two visual hemifields.
Materials and Methods
Thirteen adult cats, born from different litters in our colony, were used in this study. All were in good health and had no apparent malformations or pathologies. All experiments were performed in accordance with the relevant institutional and national guidelines and regulations including the Collège de France, the CNRS and the DDPP (JO 87–848, consolidated after revision on May 30, 2001, Certificate n° 75–337, French “Ministère de l’Agriculture et de la Pêche”). They also conformed to the relevant regulatory standards recommended by the European Community (Directive 2010/63/UE) and the US National Institutes of Health.
Functional Approach
Seven cats were included in the functional experiments [CV2 group: cats CVA(3), CVE5, CVE6, CVE9, CVE10, CVE11, CVE12]. The protocol was very similar to that used previously for the CV1 group (cf. Milleret and Houzel, 2001) in order to facilitate comparisons between the two groups.
Induction of convergent strabismus
At PND 6, i.e., a few days before natural eye opening and while callosal projections are still exuberant (Innocenti et al., 1977), the right eye (RE) of each animal was made esotropic under Saffan anesthesia® (Schering-Plough Animal Health, Welwyn Garden City, AL7 1TW, UK), with a posology of 1.2 ml/kg i.m. The rectus lateralis muscle was removed surgically as completely as possible. A single i.m. injection of antibiotics was given at the end of the surgery (Extencilline, 1 MU/kg, Specia Rhône-Poulenc Rorer, France). Local antibiotics were also administered three times a day during 1 week: Neomycin® eye drops (3,50,000 UI/ml, Roussel Diamant, France) and Rifamycine® eye drops (10 mg/ml, MSD-Chibret, France). All kittens recovered rapidly, showed no sign of pain or discomfort, and developed a manifest convergent squint. At adulthood (10 months of age and older), strabismus was assessed using the corneal reflex method (Sherman, 1972) and was ranged between 3.5° and 13.5° across animals.
Section of the optic chiasm
Chiasmotomy was performed to suppress responses from crossed retinal fibers originating mainly from the nasal retina. This surgery allows selective activation of the callosal pathway or the GC pathway converging onto the same visual cortex depending on the stimulated eye (Berlucchi and Rizolatti, 1968; cf. Figure 1A). Anesthesia was induced and maintained with Saffan® (initial, i.m., 1.2 mg/kg as above; supplements, 1:1 in saline, i.v. ad libitum). Each cat was installed supine in a Horsley–Clarke stereotaxic apparatus. The electrocardiogram and the rectal temperature were continuously monitored. While the mouth was maintained open, the soft palate was cut along the midline. The exposed bony palate was treated with a local anesthetic (Xylocaine 2%, AstraZeneca, Rueil-Malmaison, France) and drilled to expose the dura. This dura was incised and the underlying optic chiasm was cut totally in the midsagittal plane. Antibiotics were applied both locally (Cébénicol®, 80 mg/ml, Chauvin-Bausch and Lomb, Montpellier, France) and i.m. Extencilline® 1 MU/kg, Aventis, France). Finally, the soft palate was sutured and an oral analgesic was administrated (Metacam®, 0.1 mg/kg, Boehringer Ingelheim). Completeness of the optic chiasm section was verified systematically postmortem using gold-chloride staining (Schmued, 1990) on 50 μm sections.
Electrophysiological recordings
Single unit electrophysiological recordings in the left hemisphere, ipsilateral to the non-deviated eye (Figure 1A, CV2) revealed functional properties of transcallosally activated neurons. This was performed on anesthetized and paralyzed adult cats 3 days after acute section of the optic chiasm since primary visual cortical responsiveness and RF size can change rapidly after chiasmotomy in adult cats (Milleret and Buser, 1984).
On the day of the experiment, animals were re-anesthetized with Saffan® as described earlier. After tracheal and venous cannulation, electrocardiogram, temperature, and expired CO2 probes were placed for continuous monitoring. Animals were installed in the Horsley–Clarke stereotaxic frame and prepared for acute electrophysiological recordings. The scalp was incised in the sagittal plane, and a large craniotomy was performed overlying areas 17 and 18. The nictitating membranes were then retracted with neosynephrine eye drops (Neosynephrine® 5%, Ciba Vision Ophthalmics, France) and the pupils dilated with atropine eye drop (Atropine 1%, MSD-Chibret, France). Scleral lenses (PMMA, Polymethyl Methacrylate) were placed to protect the cornea and focus the eyes on a screen placed 57 cm away. Their size was adapted to the eye of each cat; between the lens and the cornea, their geometry creates a space filled with liquid which protects the cornea. Animals were then paralyzed with an infusion of Pavulon (0.2 ml/kg, i.e., 0.4 mg/kg i.v.) and breathing was assisted artificially through a tracheal cannula. The breathing was adjusted to a frequency of 10–12/min and the volume adapted to the ratio of exhaled CO2 (PCO2 was maintained at 4%). Anesthesia and paralysis were maintained throughout the experiment by continuous infusion of a mixture of Saffan® (3.6 mg/kg/h) and Pavulon (0.1 ml/kg/h) diluted in glucose (5%) and NaCl (0.9 g/l).
Each cat had two to three electrode penetrations in the coronal plane and angled toward the midline, with 20–40° of inclination relative to the vertical. The standard stereotaxic coordinates were P4 to A12 and L1 to L4 in order to explore the representation of the center and the lower quadrant (down to −30°) of the visual field within A17 and A18, according to a published description of the retinotopic maps of the cortex of the cat (Tusa et al., 1978, 1979). They consisted in sampling multiunit extracellular activity using tungsten micro-electrodes (1–2 MΩ at 1 kHz) after amplification and band-pass filtering the signal between 300 Hz and 3 kHz. Single-cell spike activity was selected with a window discriminator and audio-monitored on a second channel. Single units were recorded at regular intervals of 100 μm, over a total course of 1500–4000 μm. Finally, two small electrolytic lesions (cathodal current, 10 μA DC, 15 s) were made along each track for subsequent reconstruction.
Analysis of the properties of the visual responses
To analyze the visual responses of units, the surrounding environment displayed a mesopic luminance (∼5 Cd/m2). Visual stimuli (50 Cd/m2) of various shapes, sizes, and velocities were projected manually onto the faintly illuminated tangent translucent screen (13 Cd/m2) facing the animal. The position of each optic disk was also projected onto the screen with an ophthalmoscope (further details below).
Visual stimuli were systematically presented to each eye in succession. This allowed comparison of the properties of the visual responses of each cortical cell when activated through either the interhemispheric pathway by stimulating the right (deviated) eye or through the retino-GC pathway by stimulating the left (non-deviated) eye (Berlucchi and Rizolatti, 1968; cf. Figure 1A). Note that a section of the corpus callosum in such strabismic animals totally abolishes any transfer of visual information from one hemisphere to the other (Milleret and Houzel, 2001).
Several functional properties were examined for each recorded unit: (1) Response strength was rated into four classes of increasing discharge levels: 1 (irregular and poor), 2 (clear and reproducible), 3 (strong), and 4 (extremely vigorous); (2) Ocular dominance was determined by comparing the strength of the responses to visual stimulation of each eye successively. Classically, units were assigned to one of the five following classes: “c,” “c > i,” “i = c,” i > c, or “i,” with “c” and “i” signifying the contralateral and the ipsilateral eye respectively; (3) Orientation selectivity was assessed by comparing responses to light bars of different orientations. Units were classified as orientation selective (S) or non-selective (NS); (4) Precise limits of the RFs were mapped as the “minimum response field”; (5) Spatial location of each RF within the visual field was inferred off line from the most recent determination of the positions of the projection of both the optic disk and the area centralis of the stimulated eye (these were verified systematically once per 2 h all during each experiment as well as when significant changes in spatial position occurred while mapping RFs of successive recorded units; Vakkur et al., 1963; Milleret et al., 1988a). Possible eye cyclo-rotation was eliminated by superimposing the projections of the area centralis from both eyes and by aligning the projections of their optic disks. We also verified the lack of significant asymmetry in the positions of paired landmarks from the two retinas each time they were projected onto the screen; the retinal vessels proximal to these landmarks were also used as indices. The spatial location of each RF was then quantified by measuring the angular distance separating its medial edge (Az1), its center (Az2), and its lateral edge (Az3) from the visual midline; (6) RF size (in degrees2) was derived from plots carefully drawn on the tangent screen. Measurements related to the latter two analyses were rather easy because, when the distance between the screen and the eyes of the animal is 57 cm, 10 cm on the screen represent 10° of the visual field; (7) For each binocular unit, the difference in position between pairs of RFs was evaluated as the angular distance between the centers of the two RFs; (8) Finally, the RF overlap index (OI) was calculated using the formula: [B/(I + C − B)] × 100, where I and C are the size of the ipsilateral and the contralateral RF of a given binocular unit, respectively, and B is the visual field are common to both RFs.
Histological procedure
After the recording session, the anesthetized animal was perfused through the heart with 1 l of Ringer solution followed by 1 l of a fixative (2.5% paraformaldehyde and sucrose 4% in 0.1 M phosphate buffer). The stereotaxically blocked brain was frozen, cut in 75 μm thick sections and processed alternately to reveal Nissl substance or cytochrome oxydase activity (Wong-Riley, 1979). The areal and laminar locations of each recording site were determined from the reconstructed tracks. As in normal animals, 17/18 TZ appeared as a cortical ribbon elongated in a roughly parasagittal direction of about 1 mm wide. Electrophysiological criteria such as RF size, RF position, and neuronal responsiveness to moving stimuli indicated the identity of the recording site (A17, A18, or 17/18 TZ). More accurate cytoarchitectonic and histochemical criteria were then used based on Nissl (Otsuka and Hassler, 1962) and cytochrome oxydase activity staining (Price, 1985; Kageyama and Wong-Riley, 1986a,b; Payne, 1990b) of adjacent sections. The boundaries of cortical layers were first examined in both A17 and A18. Layer I appeared as a cell-poor region with low cytochrome oxydase activity; its lower border was marked by high cytochrome activity staining. We did not differentiate layer II from layer III. The lower limit of layer III was identified by its typical pyramidal cells; cytochrome oxydase activity was not considered in this case because of disagreement in the literature, although we could confirm its presence in the deepest parts of layer III in both A17 and A18, as reported by Payne (1990b). Layer IV was characterized by high granular cell density and strong cytochrome oxydase activity. In contrast the latter was very weak in layer V, which contained sparse pyramidal cells. Finally, layer VI displayed a higher cell density and moderate, but significant cytochrome oxydase activity. The 17/18 TZ was then analyzed, using variations in the relative thickness of some cortical layers: when passing from A17 to A18, the width of layers II/III increases whereas the width of layer VI decreases (cf. Payne, 1990a; Milleret et al., 1994).
Statistical analyses
Measurements were indicated as the mean, m ± standard mean deviation (SMD, where: SMD = σ/√N; N is the sample size; σ is the SD). Statistical tests were done with the χ2 test with Yates correction. But when this could not be used because of the small sample size numbers, statistics were done with the Fischer exact test.
Anatomical Approach
Six other cats that had the same early induced convergent strabismus of the RE were injected 6–12 months later (as adults) with the anterograde tracer biocytin in the visual cortex to examine callosal axons (cf. Figure 1B). The protocol was the same one we previously used to label callosal axons from visual cortex of normal adult cats (cf. Houzel et al., 1994). This allowed the data from normal cats (NR group) to serve as a reference here. Thus this protocol will only be briefly summarized.
Experimental groups
In order to correlate functional and anatomical data obtained in visual cortex after early strabismus, two experimental groups, CV1 and CV2, were distinguished here. In the CV1 group, experiments characterized the callosal terminal zone within the (right) visual cortex, ipsilateral to the surgically deviated eye, while study of the CV2 group concerned the contralateral (left) visual cortex, ipsilateral to non-deviated eye (Figure 1B). The CV1 group included cats BCV7, BCV9, CV13, and CV14 while CV2 group included CVE4 and CVE7.
Tracer injections, staining method, and 3D reconstruction of callosal terminals
On the day of the experiment, anesthesia was induced and maintained and surgical preparation proceeded as above. In both groups, callosal axons were anterogradely labeled with pressure injected biocytin (Sigma, at 5% in 0.05 M tris buffer, pH 8). Labeling and visualization procedures were as described previously (Houzel et al., 1994). In brief, in the CV1 group, biocytin was injected in the left hemisphere, i.e., ipsilateral to the non-deviated eye while in the CV2 group, biocytin was injected in the RH, i.e., ipsilateral to the deviated eye (Figure 1B). In each injection site, two or three 0.2–0.5 μl of tracer was pressure injected through a micropipette, separated by ∼800 μm from one another, between 500 and 1500 μm below the cortical surface. This produced injections spanning layers I through VI, with diameters ranging between 1500 and 2000 μm medio-laterally and 600 and 1650 μm antero-posteriorly (Figure 1C). Injections were made in 17/18 TZ at Horsley–Clarke stereotaxic coordinates between P2L4 and A7L1 in the CV1 group (cats CV14 and BCV9) and between A5.5L2 and A8L3 in CV2 group (cats CVE4 and CVE7). Then, injections were made more medially within area 17 (A17) at Horsley–Clarke coordinates P7L1 or A0L1 in CV1 group (cats CV13 and BCV7 respectively) and between P4L3 and P2L2 in CV2 group (cats CVE7 and CVE4). In one animal of the CV1 group (cat CV13), a more lateral injection was also made within A18 at Horsley–Clarke coordinates A9L2.5. After tracer injections, an antibiotic was administered i.m. (Extencilline, 1 MU/kg, Avantis, France).
Histological procedures were then applied to both hemispheres to obtain 75 μm thick frontal serial sections of brain. Sixty hours after the intra-cortical injections of the tracer, the animals were again deeply anesthetized with Saffan (1.2 ml/kg). Then, they were perfused transcardially first with 0.1 M PBS at pH 7.4, second with a mixture of 4% paraformaldehyde in PBS and 0.3% glutaraldehyde. Brains were post-fixed during 4 h in cold (4°C) in paraformaldehyde 4%, stored for 48 h in 30% sucrose solution for cryoprotection, frozen sectioned, and then incubated at room temperature for 12 h in an avidin peroxydase complex (ABC kit, 1/200 dilution into PBS solution with 1% of Triton-X100). A second incubation was performed in diaminobenzidine solution amplified with nickel sulfate to stain peroxydase. Alternate frontal sections were Nissl stained for identification of A17, A18, and the 17/18 TZ by differences in thickness of respective cortical layers (Payne, 1990a; Milleret et al., 1994).
Finally, the 3D morphology of individual callosal axons was reconstructed from the midline to their terminals at high magnification (1000×, with oil immersion) with the Neurolucida® tracing system (Microbrightfield Inc.). Detailed methods regarding the 3D reconstruction and the quantification of morphology have been described previously (Houzel et al., 1994). Histological procedures such as fixation, cryogenation, deflating, and mounting on slides generally induce a 35–40% isotropic shrinkage along the x and y and w axes. Compression of the tissue also occurs perpendicular to the cut surface of sections, reducing section thickness by ∼1/3 of its value at the time of sectioning. These were compensated for in quantitative analyses (incrementing by 35 and 33% for shrinkage and compression respectively; cf. Innocenti et al., 1994 for details).
Axonal morphology
The morphology of each callosal axon was characterized on the basis of previously described criteria (Houzel et al., 1994) facilitating the comparison between CV and NR groups. In summary (see Figure 2A), the trunk was identified as that part of the axon proximal to the first branching point (node) in the hemisphere contralateral to the injection. The part of the axon located distal to the first node was called the terminal arbor. Axonal branches were then identified by their topological order. Thus first order (or primary) branches originated from the first node and that gave rise to the second order (or secondary) branches; the latter gave rise to third-order (or tertiary) branches, etc. Branches which were particularly conspicuous by their length and/or thickness were designated as main branches. Pre-terminal branches carried (presumably synaptic) boutons. The latter could be terminal boutons, characterized by the presence of a connecting stalk or “en passant” boutons, i.e., swellings along the pre-terminal branch. In the gray matter, axons might end with one or several tufts. A tuft was a part of an arbor characterized by densely ramified and tightly distributed high-order and pre-terminal branches originating from a common stem. In addition, these tufts might have some modest collaterals. Tufts and/or collaterals of one axon might terminate in segregated volumes of cortex including one of several cortical layers. Hereafter we shall call these volumes terminal columns. The characterization of a terminal column required the identification of distinct clusters of pre-terminal branches and boutons in a view perpendicular to the cortical surface (Figure 2B).
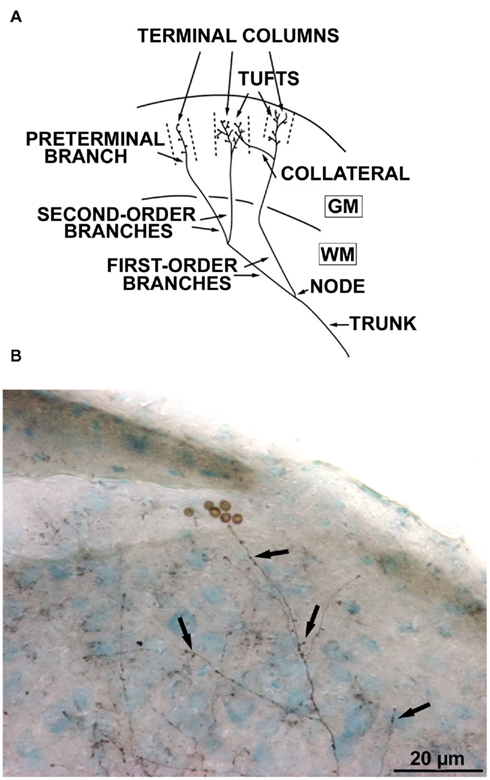
Figure 2. Architecture of the callosal axons. (A) Schematic drawing of a terminal arbor in the cerebral cortex (WM = white matter, GM = gray matter) and illustrating the nomenclature employed. “Terminal columns” refer to the volumes delineated by interrupted lines; each column is supplied by an isolated pre-terminal branch. For further details, see text (Reproduced with permission, from Houzel et al., 1994). (B) A callosal axon labeled with biocytin, with its terminal boutons (arrows).
Architecture of individual terminal arbors
Axons may vary in the complexity and spatial organization of their terminal arbors. We distinguished here only two types of architectures: (a) A simple architecture: the axon terminates with a single tuft within an approximately conical volume (see for example Figure 8A); (b) A multiple clustered architecture: the axon is characterized by a trunk which divides into first- and/or higher-order branches. Then, it terminates with several columns and several tufts in the cortex which are generally clearly separated (see for example Figure 8B).
Laminar distribution of the terminal boutons
The various laminar distributions of the terminal boutons encountered here were also classified on the basis of criteria used previously for the NR group: (a) when boutons were restricted to supra-granular layers II and III and often included layer 1 (and in some cases also layer IV), this pattern of distribution was described as supra-granular; (b) when the highest density of boutons was still in the supra-granular layers and others were located in infragranular layers (with no or very few boutons in layer IV), this pattern of distribution was described as bi-laminar; (c) when boutons were all located in the granular layer IV, as expected, the distribution was described as granular; (d) the fourth pattern was characterized by boutons distributed across both the supra and infragranular layers, including layer IV (trans-granular distribution); (e) finally, if boutons were only located in infragranular layers, the distribution is described as infragranular.
Statistical analyses
The morphology of each callosal axon was quantified classically using the Neuroexplorer program by measuring the diameter of the trunk, the number of nodes, the length of branches (first to fifth order), the number of terminals, and the number of boutons. A Wilcoxon rank sum test (two-sided for independent unequal-sized samples) compared the CV1, CV2, and NR groups in a pair wise manner (Hollander and Wolfe, 1973; Gibbons, 1985).
Results
Functional Data
In the CV2 group (n = 7), 457 units were recorded in the left hemisphere LH (ipsilateral to the non-deviated eye) and 70 responded to visual stimulation through the TC pathway (Table 1). Other units were either exclusively responsive to stimulation through the GC pathway (n = 307), or were visually unresponsive (n = 83). We only examined the distribution and functional characteristics of units that responded to TC stimulation (“TC units”). Data have been compared to those previously obtained in the RH, ipsilateral to the deviated eye (CV1 group from Milleret and Houzel, 2001), and those obtained in normally reared (NR) cats (Milleret et al., 1994, 2005; Milleret and Houzel, 2001). Such comparisons were possible because we explored similar cortical regions in all cases, corresponding to comparable portions of the visual field (further details in Receptive Field Characteristics of the Transcallosally Activated Units).
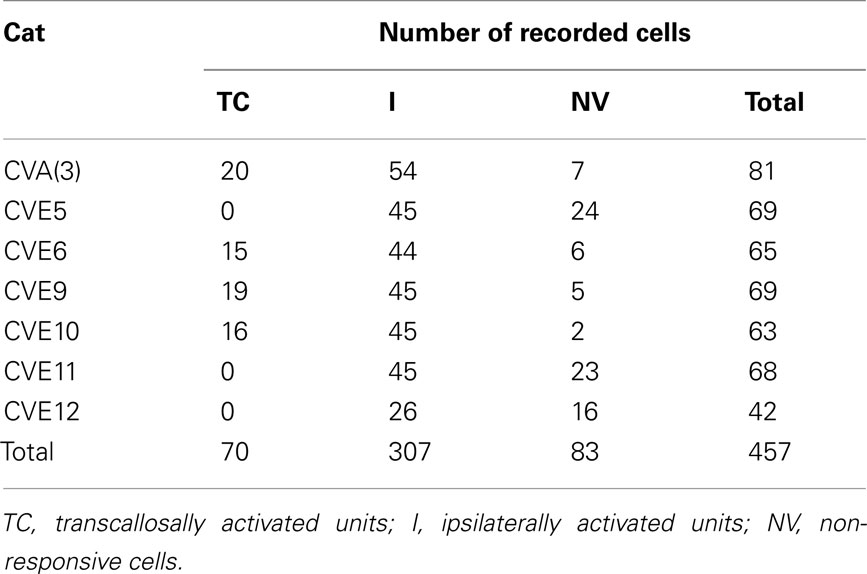
Table 1. Number of cortical units recorded in areas 17 and 18 of the left hemisphere in the CV2 group.
Location of the transcallosally driven units
In the CV2 group, almost all TC units (69/70) were located within the gray matter (Table 2). Within 17/18 TZ, 78% (60/77) of units responded to TC stimulation, but only 3% (7/212) did so in A17 and 1% (2/151) in A18. TC units could be located as far as 3600 μm from 17/18 TZ in A17 and 1200 μm from 17/18 TZ in A18 (Figure 3A). Within 17/18 TZ, TC units were numerous in all cortical layers (Figure 3B). Within A17 and A18, they were not numerous enough to test their distribution (Figure 3B).
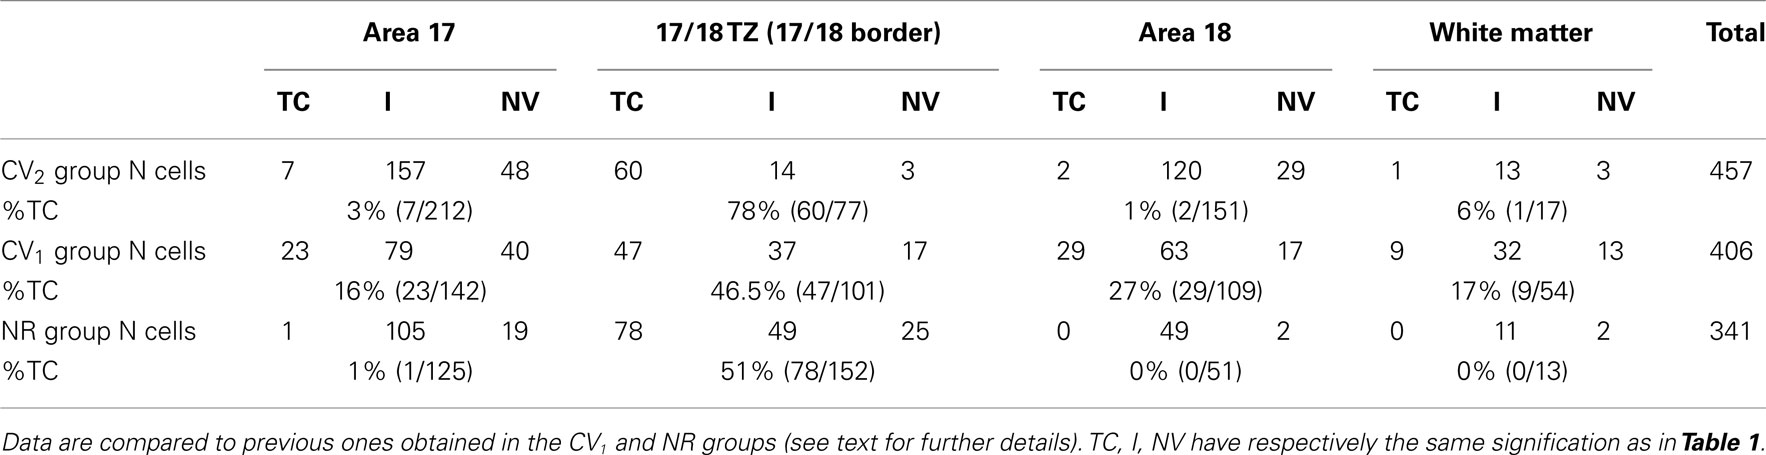
Table 2. Incidence of the different types of units recorded contralaterally to the deviated eye in the CV2 group.
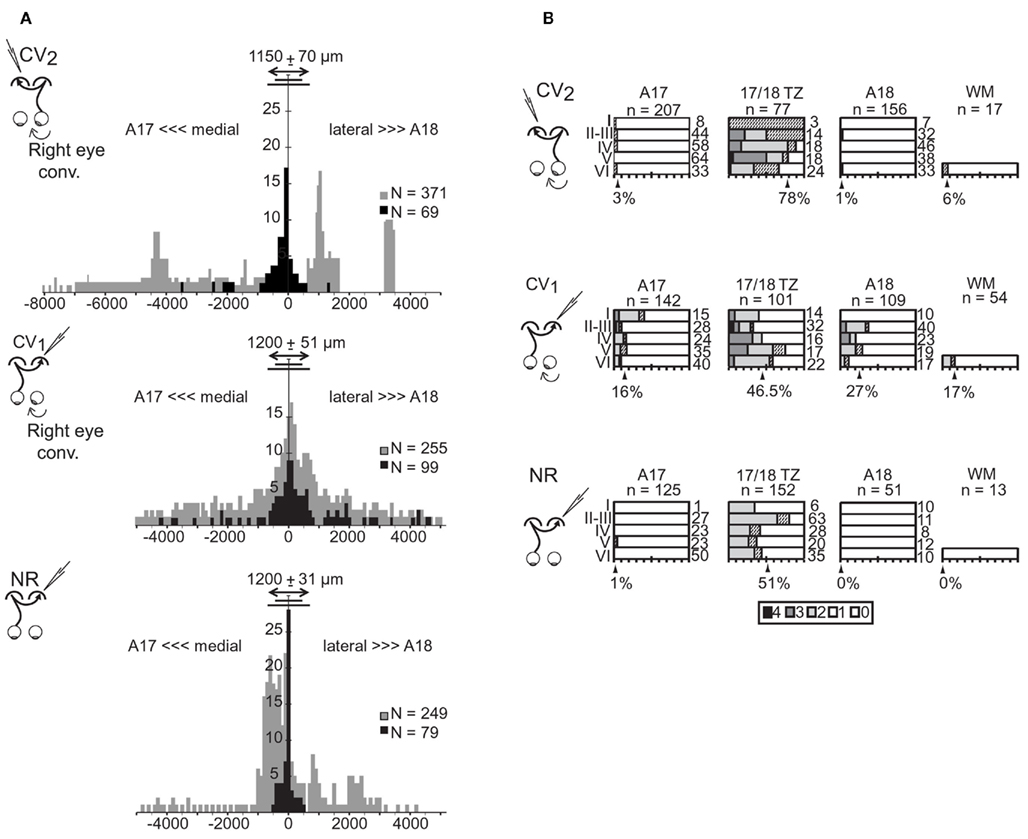
Figure 3. Cortical distributions of the transcallosally activated units in visual cortex of strabismic (CV1 and CV2) and normal (NR) cats. (A) Tangential distribution of the cortical units activated (in black) or non-activated (in gray) through the transcallosal pathway. Abscissa, tangential distance (in μm) of the recorded cortical units from the center of the transition zone between A17 and A18 (17/18 TZ); negative values correspond to more medial locations in A17 while positive values correspond to more lateral locations in A18. Ordinates, number of units in samples. Double-headed arrow, short and long lines indicate mean, minimum, and maximum width of the 17/18 TZ, respectively. n: Number of units in samples. (B) Radial distribution of the transcallosally activated units (TC units) with respect to area and laminar location. For each cortical layer (I–VI), bars indicate the percentage of TC units relative to the total number of recorded units indicated on the right. Shading represents response strength (scale: 0–4). Arrowheads indicate the mean percentage of TC units in each region indicated below. WM, white matter in samples. n, number of cells. Data from the CV1 and the NR group have been reproduced with permission from Milleret and Houzel (2001).
These results were different from those established previously in the CV1 group (see Table 2 and Figure 3). The first major difference was in the tangential distribution of the TC units: they were almost exclusively located in the 17/18 TZ in the CV2 group, whereas they also included extended portions of A17 and A18 in the CV1 group. In addition, in the CV2 group, the proportion of the TC units within the 17/18 TZ was higher than in the CV1 group, with 78 vs. 46.5% respectively (χ2 test with Yates correction, P < 0.0001). The radial distributions of the TC units also differed: whereas the TC units of the 17/18 TZ were distributed in all cortical layers (from layer I to layer VI) in the CV2 group, they were mainly located in infragranular layers in the CV1 group. Finally, in both groups, some TC units could be recorded in the WM, although the proportion was higher in the CV1 group than in the CV2 group (9/54 units and 1/17 unit respectively).
Results in the CV2 group also differed from those obtained in the NR group (c.f. Table 2 and Figure 3). However, these differences were minor compared to those observed between the CV1 and CV2 groups. In both groups, almost all TC units were recorded within the 17/18 TZ. Still, within the 17/18 TZ, the proportion of TC units in the CV2 group was significantly higher than that in the NR group (78 vs. 51%; χ2 test with Yates correction, P = 0.0012). The radial distributions of the TC units in the 17/18 TZ also varied greatly between groups, with an almost equal repartition of TC units within the different cortical layers in the CV2 group and a strong bias in favor of the supra-granular layers in the NR group. Finally, no TC unit was recorded in the WM of cats in this latter group.
Strength of transcallosal responses
The strength of TC responses in the CV2 group varied greatly (Figure 3B): class 1 (n = 31, i.e., 44.3%), class 2 (n = 25, i.e., 35.7%), class 3 (n = 13, i.e., 18.6%), class 4 (n = 1, i.e., 1.4%). But some differences appeared depending on the cortical region. All responses recorded in A17, A18, or the WM were poor (class 1: 7/7 in A17, 2/2 in A18, and 1/1 in the WM). On the other hand, responses in the 17/18 TZ were more vigorous: class 2 (25/60, i.e., 41.6%), class 3 (12/60, i.e., 20%), and class 4 (2/60, i.e., 3.3%).
These observations indicate that visual interhemispheric transfer to the 17/18 TZ in the CV2 group can lead to rather vigorous post-synaptic responses. Such data are similar to those obtained for the CV1 group (class 2, 55% of the TC units; class 3, 30%). Surprisingly, response strength in the 17/18 TZ in CV groups was even significantly higher than in the NR group, since only class 1 and 2 responses occurred in the latter (χ2 test with Yates’s correction, P < 0.05).
Ocular dominance of the transcallosal units
In the CV2 group, the global ocular dominance distribution of the TC units was U-shaped with a strong bias favoring the contralateral eye (TC pathway). About half of TC units (37/70, i.e., 53%) were even exclusively activated through the stimulation of the right (deviated) eye, contralateral to the explored cortex (Figure 4A), while the others were binocular, also activated through the GC pathway. These units displayed the following distribution according to their ocular dominance: c > i, 9/70 (13%); i = c, 8/70 (11%); i > c, 16/70 (23%). Because numbers of TC units were low in A17, A18, and WM (7, 2, and 1 units respectively), this distribution reflects mainly the ocular dominance distribution in the 17/18 TZ.
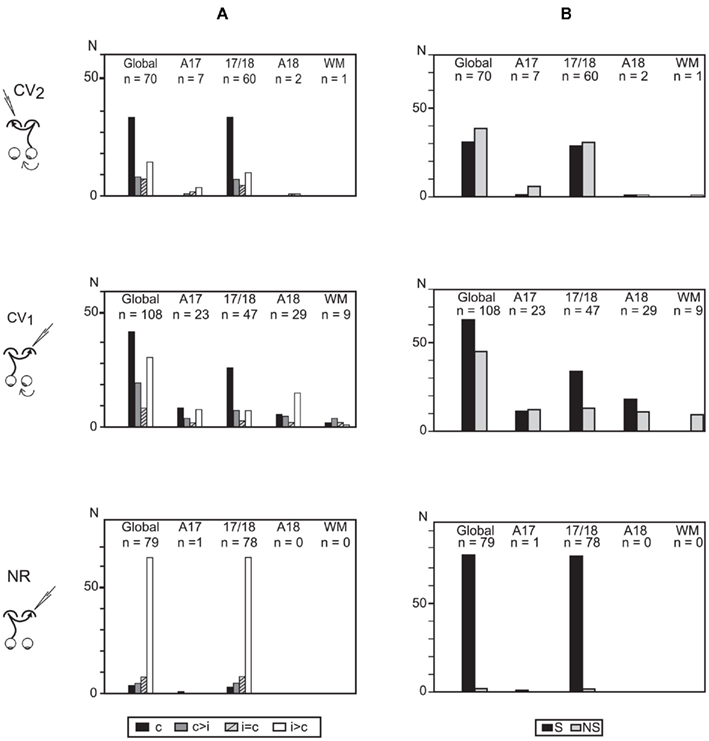
Figure 4. Ocular dominance and orientation selectivity of the transcallosally activated units recorded in visual cortex of strabismic (CV1 and CV2) and normal (NR) cats. (A) Ocular dominance of transcallosal units recorded in A17, 17/18 TZ, A18, and the white matter (WM). Units were ranked into four classes according to the relative strength of response to contralateral (c) and ipsilateral (i) eye stimulation: c, units activated only through the stimulation of the contralateral eye; c > i, units activated preferentially through the contralateral eye; c = i, units activated equally through both eyes; i > c, units activated preferentially through the ipsilateral eye. Global, all units pulled together. n, number of units. (B) Orientation selectivity of transcallosal units recorded in A17, 17/18 TZ, A18, and WM. Orientation selective (S) and non-orientation selective (NS) units were distinguished. Global, all units pulled together, whatever their cortical location. n, number of units. Data from the CV1 and the NR group have been reproduced with permission from Milleret and Houzel (2001).
The ocular dominance distribution in the 17/18 TZ of CV2 group resembled that of the CV1 group: there was a strong bias toward the contralateral eye Nevertheless, many units also responded to stimulation of the ipsilateral eye. That difference between the CV2 and CV1 groups with regard to the proportion of binocular units did not reach significance (33/70 in CV2 group vs. 63/108 in CV1 group; χ2 test with Yates correction, P = 0.2144). On the contrary, both strabismic groups differed greatly from the NR group, where ocular dominance was strongly biased in favor of the ipsilateral eye. Note that the proportion of binocular units in the CV2 group (33/70, i.e., 47.1%) was lower than in the NR group (75/79, i.e., 95%; Fisher exact test, P < 0.0001). Such data merely reflect the well known effects of strabismus on the ocular dominance of the overall population of cortical neurons of primary visual cortical areas (cf. Boothe et al., 1985; Milleret, 1994a,b; Kiorpes and McKee, 1999 for review).
Orientation selectivity of the transcallosal units
In the CV2 group, 44% of TC units were selective for the orientation of the stimulus (S) whereas the others were non-selective (NS, Figure 4B). Again, this proportion mainly resulted from TC units in the 17/18 TZ (48% of S units; 52% of NS units). In the other areas, both S and NS units also co-existed but their respective numbers were too low to draw any significant conclusion (A17: 6 S, 1 NS; A18: 1 S, 1 NS; WM: 1 NS).
These observations are similar to those of the CV1 group (58% S units). The difference in incidence of S units between these two experimental groups did not reach significance (χ2 test with Yates correction, P = 0.1). In contrast, the proportions of S units in the CV groups were significantly lower than that of the NR group (96%; Fisher exact test, P < 0.0001). Thus, strabismus alters the development of orientation selectivity of transcallosal units, and this is equivalent regardless of the eye being stimulated. Again, such data merely reflect the well known effects of strabismus on the orientation selectivity of the overall population of cortical neurons of primary visual cortical areas (cf. Boothe et al., 1985; Milleret, 1994a,b; Kiorpes and McKee, 1999 for review).
Receptive field characteristics of the transcallosally activated units
As described above, in group CV2, some TC units received exclusively transcallosal inputs from the stimulation of the right (deviated) eye, while others received additional ipsilateral retino-GC inputs from the left (non-deviated) eye (cf. Figure 1). Their RFs will therefore be referred as TC-RFs or GC-RFs depending on the pathway stimulated to map them.
Size of the transcallosal and retino-geniculo-cortical receptive fields. In the CV2 group, 58 TC-RFs could be mapped (Figure 5A). Their size varied greatly, ranging from 2 to 314 degrees2, with a mean area of 64.4 ± 8.9 degrees2. Within the 17/18 TZ (where most TC units were recorded), mean area was 70.2 ± 9.8 degrees2. In contrast, the mean RF size for TC units recorded in the 17/18 TZ in group CV1 was much lower (37.9 ± 7.2 degrees2; Figure 5B). Therefore, the deviated (right) eye in the CV2 group activated larger TC-RFs than the non-deviated (left) eye in the CV1 group. Still, mean RF sizes in CV groups remained much larger that of the NR group (11 ± 1.5 degrees2; Figure 5C).
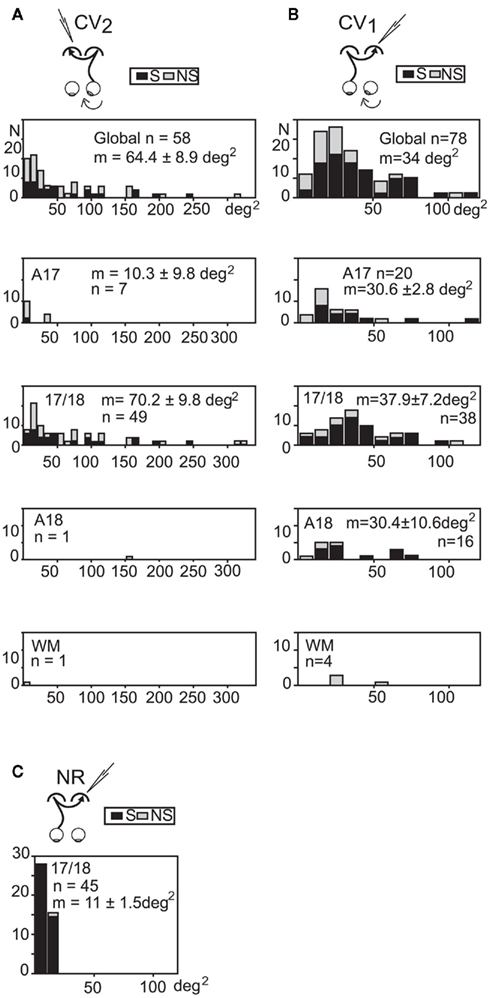
Figure 5. Distribution of the sizes of the “transcallosal” receptive fields in the various explored cortical areas of strabismic and normally reared cats. (A,B) In each strabismic group, units were recorded from A17, A18, the 17/18 TZ (17/18) and the white matter (WM). Global, units from all areas. (C) TC units in the NR group were only found in the 17/18 TZ. S: orientation selective units; NS: units with no orientation selectivity. m: mean receptive field size ±SD. n: number of units. Bin width, 10 degrees2. Data from the CV1 and the NR group have been reproduced with permission from Milleret and Houzel (2001). See text for further details.
Of the 33 binocular TC units recorded in the CV2 group, it was possible to also map the GC-RFs of 31 units (7 in A17, 22 in the 17/18 TZ, 1 in A18, and 1 in the WM). Globally, the areas of these RFs also varied greatly (ranging from 2 to 615 degrees2). The mean area was 74.1 ± 21.6 degrees2 (67.8 ± 15.7 degrees2 within the 17/18 TZ), very similar to that of the TC-RFs (64.4 ± 8.4 degrees2). The same observation has been previously made in both CV1 and NR groups (Milleret et al., 1994, 2005; Milleret and Houzel, 2001).
Spatial distribution of the TC-RFs. Globally, the elevations of TC-RFs in the CV2 group ranged from +5° to −25° along the CVM (Figure 6A). We focused more specifically on TC-RFs within the 17/18 TZ, where the number of recorded units was sufficient to draw significant conclusions. The medial-most limit (Az1) and lateral-most limit (Az3) of the TC-RFs were, respectively, localized at +7° and −20° of azimuth, apart from the CVM (mean Az1 = −3.1° ±0.5°; mean Az3 = −12.3° ± 0.5°); the azimuth of the centers (Az2) of the TC-RFS ranged from −4° to −14.5° (mean Az2 = −7.6° ± 0.4°). As a result, the callosal visual field, i.e., the portion of visual field transferred to the target hemisphere through the CC, spanned a global width as large as 27°. It intersected the CVM but extended substantially within the hemifield ipsilateral to the explored cortex.
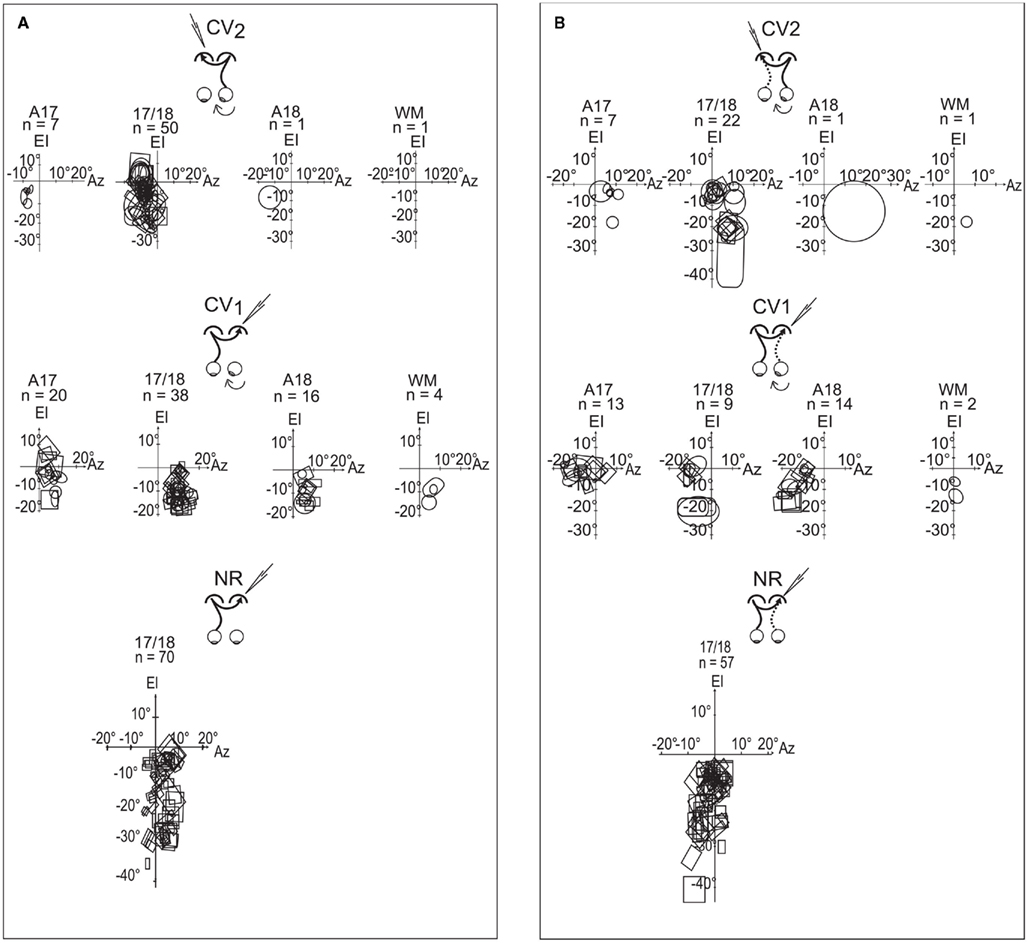
Figure 6. Spatial distributions of the transcallosal receptive fields (TC-RFs) and the geniculo-cortical receptive fields (GC-RFs) of the transcallosally activated units of all strabismic and normally reared cats. (A) Spatial distribution of the TC-RFs mapped through visual stimulation of the eye contralateral to the explored cortex. (B) Spatial distribution of the GC-RFs mapped through visual stimulation of the eye ipsilateral to the explored cortex. In common to (A,B) the explored areas were A17, 17/18 border, A18 and WM below visual cortex; El is the elevation axis (central vertical meridian of the visual field); Az is the azimuth axis; rectangles and circles are contours of the minimum response fields of orientation selective and non-selective transcallosally activated units, respectively; n is the number of units. Data from the CV1 and the NR group have been reproduced with permission from Milleret and Houzel (2001).
Comparing the CV2 group to the CV1 group revealed that both the width and the spatial location of their callosal visual fields differed markedly. In the CV1 group, for units recorded in the 17/18 TZ, the Az1, and Az3 of the TC-RFs were +2° and +19°, and the mean Az2 was 9.5° ± 0.3. Therefore, the width of their callosal visual field (17°) was 10° less than in the CV2 group. Similar to CV2, it mainly extended in the hemifield ipsilateral to the explored cortex but it no longer contacted the CVM, missing it by a few degrees. Note that, in the CV1 group, numerous TC-RFs were additionally mapped in A17 and A18. The Az1 and Az3 of their TC-RFs were located at (−1°, +15°) and (−1°, +14°) respectively. When taken into account, the width of the global callosal visual field in CV1 group became 20° (−1°/+19°), which was still narrower than the width in CV2 group. Thus the two respective callosal visual fields do not occupy the same location in space.
The CV2 and NR groups also differed slightly. In the NR group, within the 17/18 TZ, the Az1, and Az3 of the TC-RFs were −6°/+13° (Milleret et al., 2005). The width of the callosal visual field in the NR group (19°) was therefore smaller than in the CV2 one (27°). The mean Az2 was 2.4° ± 0.6° in the NR, indicating a substantial extent of the TC-RFs within the hemifield ipsilateral to the explored cortex. But this extent was smaller than that of CV2 (−7.6° ± 0.4). Importantly, the callosal visual field abutted or intersected the CVM in both experimental groups, which is very different from the CV1 group.
Spatial distribution of the GC-RFs. Globally, GC-RFs of TC units in the CV2 group appeared at elevations ranging from +5° to −25° elevation (Figure 6B). Within the 17/18 TZ, the Az1, and Az3 of the GC-RFs were respectively localized at −5° and +16.5° distance from the CVM (m Az1 = 0.8° ± 0.8°; m Az3 = 9.2° ± 1.0°); the Az2 of the GC-RFs ranged between 0° and +5° (m Az2 = 5.0° ± 0.9°). Thus, the width of the portion of visual field signaled by the GC-RFs was 21.5°. It intersected the CVM and extended substantially within the hemifield contralateral to the explored cortex.
Comparisons between the CV2 and the CV1 groups revealed similarities and differences (cf. Figure 6B). Within the 17/18 TZ, the Az1, and Az3 of the GC-RFs in the CV1 group were −16° and +3°. Therefore, as in the CV2 group, GC-RFs in CV1 are mainly located within the hemifield contralateral to the explored cortex. They occupy similar extents of visual field in both groups (19° vs. 21.5°), with some contact with the CVM. However, the mean Az1, Az2, and Az3 of the GC-RFs differed greatly (m Az1, 0.8° ± 0.8° vs. −4.3° ± 1.7°; m Az2, 5.0° ± 0.9° vs. −7.2° ± 0.8°; m Az3, 9.2° ± 1.0° vs. −13.7° ± 0.6°). The same observations held true when considering GC-RFs recorded in A17 of the CV1 group (the Az1 and Az3 of the GC-RFs were −16° and +9° respectively, leading to a width of 25°, but m Az1 = −3.6° ± 1.2°, m Az2 = −6° ± 1.4°, and m Az3 = −8.4° ± 2.1°). The main difference between groups came from the GC-RFs of the TC units recorded in A18 of the CV1 group. Indeed, with the Az1 of the GC-RFs at −3.5°, none displayed any contact with the CVM. With the Az3 at −23°, they extended more laterally within the hemifield contralateral to the explored cortex than GC-RFs in A17 and 17/18 TZ. Finally, with m Az1, m Az2, and m Az3 at −8.7° ± 1.1°, −12.6° ± 1.1°, and 16.5° ± 1.3° respectively, the spatial distribution of the GC-RFs in the CV1 group differed strongly from that of the CV2 one.
The CV1 group is already known to be highly abnormal (cf. Milleret and Houzel, 2001). In contrast, the comparison between the CV2 group and the NR one revealed strong similarities. Within the 17/18 TZ, the Az1, and Az3 of the GC-RFs were −5° and +16.5° in the CV2 group, and −7° and +13° in the NR group. The widths of the spatial distribution of these RFs were thus similar: 21.5° (CV2) vs. 20° (NR). The GC-RFs also occupied similar positions in the visual field, extending substantially in the hemifield contralateral to the explored cortex in both cases, contacting the CVM. Some subtle differences existed, however, as revealed when comparing the mean Az1, Az2, and Az3 of the GC-RFs in both the CV2 and the NR groups: m Az1, 0.8° ± 0.8° vs. +1° ± 0.3°; m Az2, 5.0° ± 0.9° vs. +0.9° ± 0.7°; m Az3, 9.2° ± 1.0° vs. +1° ± 1°. It is clear that the mean values of Az2 and Az3 are higher in CV2 group than in NR group, but m Az1 are very similar.
Position disparity of the receptive fields of binocular units. As expected from the global spatial distributions described above, the position of TC-RFs and the GC-RFs of binocular TC units in the CV2 group generally did not match. This held true while both eyes were in their “paralyzed” position, without any correction for strabismic angle (data not shown). This also held true after correction of the data for strabismus angle by superimposing the projections of both areas centrales. In this condition, the TC-RFs were always located in the hemifield ipsilateral to the explored cortex, whereas the GC-RFs were always located in the hemifield contralateral to the explored cortex. This resulted in a systematic crossed position disparity between pairs of RFs of binocular units, whose amplitude varied from cell to cell, even within the course of a single recording track (Figure 7A). Within the 17/18 TZ, 21 pairs of RFs could be mapped. The mean position disparity between couples of RFs was 13.9° ± 5.6°, with a minimum of 7° and a maximum of 29°. The small numbers of pairs of RFs in each animal precluded tests of correlation of angle of disparity with the angle of strabismus. Only one unit exhibited an overlap between TC- and GC-RFs, and its OI was poor (OI = 4.6%).
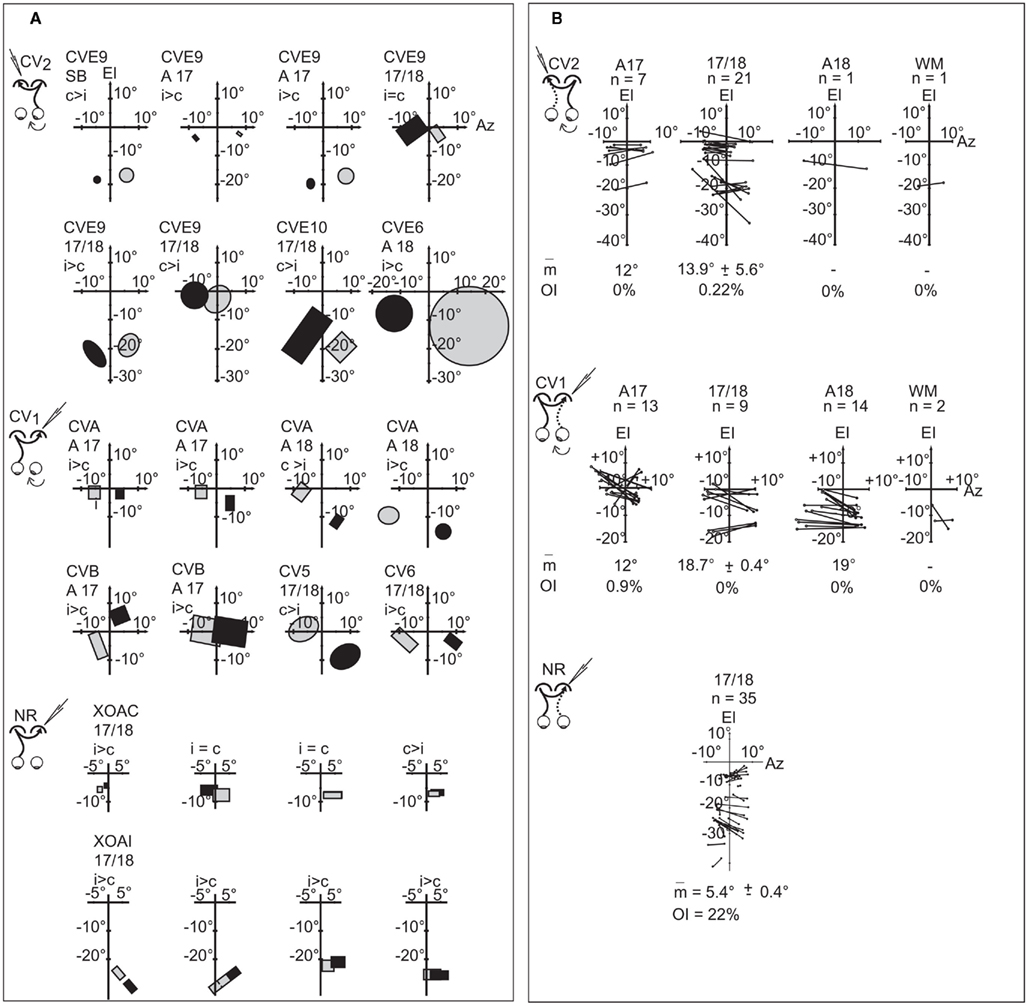
Figure 7. Position disparity between pairs of receptive fields of the binocular transcallosally activated units after off line realignment of the eyes in convergent strabismics. (A) Geniculo-cortical receptive fields (in gray) and corresponding transcallosal receptive fields (in black) of a few representative binocular TC units recorded in different animals of each experimental group (CV9, CV10, and CVE6 in the CV1 group; CVA, CVB, CV5, and CV6 in the CV2 group; XOAC and XOAI in the NR group). Rectangles and circles, contours of the minimum response field of orientation selective and non-selective TC units, respectively. c, i > c, i = c and c > i indicate the ocular dominance of each unit as in Figure 5. (B) Spatial distributions of pairs of receptive fields of binocular TC units. Lines connect centers of couples of RFs observed for individual cells and indicate position disparity. m, mean position disparity value ± SEM (in deg); OI, overlap index (in%). El and Az, elevation and azimuth axes; n, number of units. Data from the CV1 and the NR group have been reproduced with permission from Milleret and Houzel (2001).
Comparing the CV2 and CV1 groups for the 17/18 TZ revealed similarities with only crossed disparities in both groups and a null OI in almost all cases (Figure 7B). The mean position disparity in CV1 group (18.7° ± 0.4) was only slightly higher than in CV2 group.
In contrast, comparison between the CV groups and the NR group revealed major differences (Figure 7B). In the NR group, position disparities could be crossed type, but also null or uncrossed. Moreover, because position disparities are small in the NR group (5.4° ± 0.4°), the OI is far from null (22%). Therefore, strabismus greatly alters this overlap between TC- and GC-RFs. Altogether, this indicates that strabismus leads to some distortions in the fine organization of the TC and/or the GC retinotopic maps in visual cortex.
Anatomy of Transcallosal Axonal Arborizations
The functional data described above demonstrate electrophysiologically that an asymmetrical interhemispheric transfer of visual information develops between visual cortical areas in early unilateral strabismic cats. Here we present the anatomical structure underlying this asymmetry from biocytin injections in the hemisphere contralateral or ipsilateral to the deviated eye (CV1 and CV2 groups respectively). Eight callosal axons were reconstructed in 3D in the CV1 group (cf. Figure 8B). Four of these originated from A17, three from the 17/18 TZ, and one from A18. In the CV2 group, nine callosal axons were reconstructed, originating from A17 (n = 4) or 17/18 TZ (n = 5); cf. Figure 8A). Morphological characteristics of these axons are fully described in Tables A1 and A2 in Appendix. Callosal axons in NR animals serve as references (from Houzel et al., 1994).
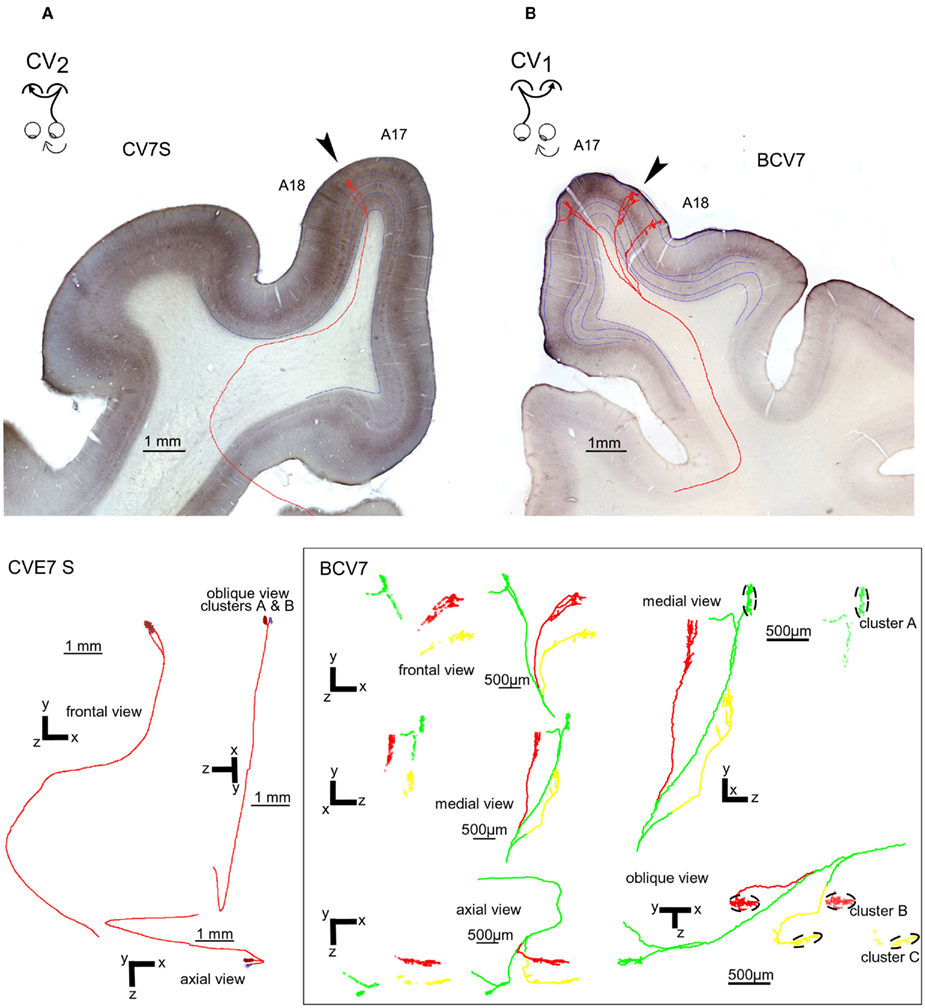
Figure 8. Representative callosal terminals of the CV1 and CV2 groups after biocytin injection in the contralateral hemisphere and reconstruction in 3D. (A) Callosal terminal from the CV2 group (named “CV7S,” i.e., axon “S” from cat CV7). The axon originated from A17 in the right hemisphere, at stereotaxic coordinate P4. The trunk of this axon has a diameter of 0.6 μm and its total length from the midline was 15.52 mm. It ended in the 17/18 TZ (arrow) in the left hemisphere at P3–P4. Its architecture was “simple.” As represented below, its main branch divided in the gray matter to form two clusters in the lateral gyrus. Altogether, its antero-posterior and medio-lateral extensions were 175 and 249 μm respectively. It also displayed a total of 93 boutons and their distribution was supra-granular. (B) Callosal terminal from the CV1 group (named “BCV7,” i.e., axon 7 from cat BCV). It originated from A17 in the left hemisphere, at stereotaxic coordinate AP0. The diameter of its trunk was only 0.4 μm and its total length was 32.23 mm. It also ended in the right hemisphere at antero-posteriority AP0. It displayed a multiple clustered architecture. Its terminal formed three different tufts which were very distant from each other in the marginal and in the lateral gyrus. They were located respectively in A17, A18, and in the 17/18 TZ (arrow). As a consequence, this axon had a rather large frontal extent (3789 μm) whereas it ranged antero-posteriorly over only 750 μm. This axon had a total of 1056 boutons ending for the vast majority in layer II/III (76%) and V (15%). The tuft ending in A17 divided itself in layer VI in two branches: one of them formed a terminal cluster of 231 boutons, 230 of them being located in layer II/III (cluster A). The other branch formed 88 “en passant” boutons, with 50 of them being located in layer II/III. The tufts ending in A18 and in the 17/18 TZ formed each several branches and two separate clusters: one in the 17/18 TZ (cluster B) and one in A18 (cluster C). The laminar distribution of BCV7 was supra-granular (see details about branches and clusters in the lowest part of the figure).
Global organization of the CV callosal axons
Five parameters are used to describe the global organization of the CV callosal axons: the localization of the first node, the general architecture of the axons, the tangential distribution of the terminal arbors as well as the terminal boutons and finally the radial distribution of the terminal boutons.
Localization of the first node of the callosal axons. Callosal axons in the CV animals could branch first at one of the three following positions: very deep in the WM below cortex (including when just exiting the CC), just below cortex or within the visual cortex itself (cf. Figures 8B and 9A). But callosal axons branching first very deep below cortex were clearly the most numerous (CV1 group, 4/8; CV2 group, 5/9; cf. Table A4 in Appendix). Most often, they branched as deep as the fundus of the splenium sulcus or the cingular sulcus, depending of the antero-posterior position (see for examples axons BCV7, BCV9, CV14-V in the CV1 group and axons CVE4-1, CVE4-2, and CVE4-A in the CV2 group in Figures 8 and 9A). Notice that these characteristics have also been found in early monocularly deprived animals (through monocular occlusion), within the hemisphere ipsilateral to the deprived eye (Foubert et al., 2010), suggesting that this might occur systematically after a monocular alteration of vision occurring early in life (see also Discussion).
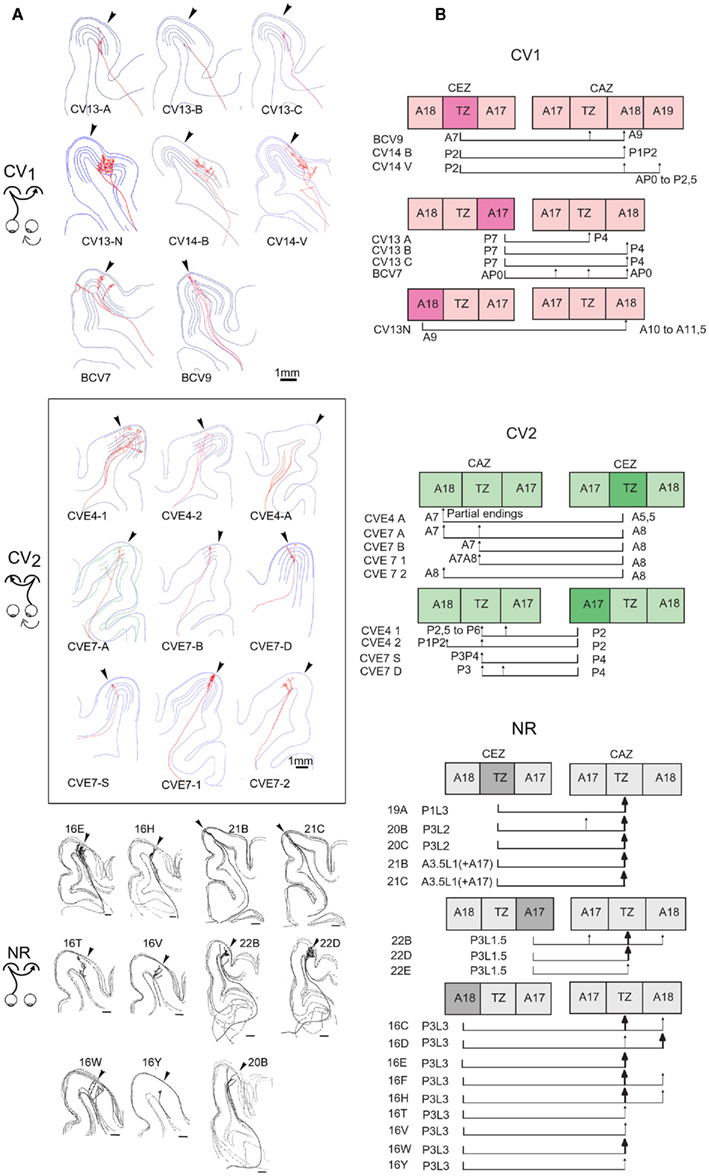
Figure 9. Comparing the tangential distributions of the callosal terminals in the respective groups as a function of their origin. (A) Frontal representation of all the individual callosal axons that were reconstructed in 3D from serial sections of visual cortex in each experimental group. Arrow, transition zone between A17 and A18 (TZ). (B) Tangential distribution of the terminals of each callosal axon as a function of their origin (TZ, A17, or A18), with corresponding stereotaxic coordinates. CEZ, callosal efferent zone; CAZ, callosal afferent zone. Data from NR group have been reproduced with permission from Houzel et al. (1994).
In comparison, in the NR adults, only one callosal axon branched first rather deep in the WM (axon 16E in Figure 9A; Table A4 in Appendix). For the 16 remaining axons, the first node was systematically located near the visual cortex, either between the fundus of the lateral sulcus and the convexity of the lateral and post-lateral gyri, often beneath A18, or within the cortex itself. Thus the morphology of the callosal axons is different in strabismic and NR animals with respect to this parameter.
Architecture of callosal terminal axons. On the basis of our classification (see Materials and Methods), out of the eight callosal axons that were reconstructed in 3D in the CV1 group, three displayed a simple architecture (37.5%) while all the remaining ones displayed a multiple clustered architecture (62.5%). Each axon had one to three branches, and one to eight columns (cf. Table A1 in Appendix). In the CV2 group, out of the nine callosal axons that were 3D reconstructed, most axons also displayed architecture or the other: four displayed a simple architecture (44%) while four others displayed a multiple clustered architecture (44%). Similar to the CV1 Group, their number of branches ranged from 1 to 3 and the number of columns from 1 to 8. One exception however was found with axon CVE4-A which divided into three main branches in the WM but did not enter the visual cortex (cf. Table A2 in Appendix).
Globally, most of the architectures described for NR animals also existed in the CV groups. Overall, no difference could be found between groups (see Table A4 in Appendix, second row). One atypical axon was however found in the CV2 group, with branches in the WM but no terminals in visual cortex. Since all other axons in the same cat with similar trunk diameters could be reconstructed in 3D up to their terminals (cf. axons CVE4-1 and CVE4-2 in Table A2 in Appendix), one interpretation is that this growing axon could not reach visual cortex before the end of the critical period.
Areal distribution of callosal terminal arbors. As summarized in both Table A1 in Appendix axon per axon and Figure 9B (all axons together), in the CV1 group, callosal terminal arbors originating from the 17/18 TZ terminated mostly in A18. However, a few additional terminal branches could be also found in A17, 17/18 TZ, and even in A19. Those originating from A17 mostly terminated in the 17/18 TZ and A18, with a few branches also in A17. The only axon originating from A18 terminated strictly in A18. Differences in stereotaxic coordinates could be observed between the injection site and the callosal terminal zone (cf. for example axons CV13-A, CV13-B, CV13-C, and axon BCV9 in Table A1 in Appendix; cf. also Figure 9B). Thus, globally, the CV1 group seemed to preserve the “non-mirror” organization of the interhemispheric callosal connections that has been described in the NR animals (see Introduction for further details and Figure 9). But connections were heterotopic instead of being homotopic. In addition, the callosal terminal arbors in the CV1 group were not restricted to the 17/18 TZ as observed in NR animals, but rather extended additionally to A17 and A18. This also held true at the level of single neurons: as indicated in Table A1 in Appendix, single callosal terminal arbors could extend from 50 to 950 μm along the antero-posterior axis (m = 475 μm) and from 40 to 3789 μm along the medio-lateral one (m = 1612 μm). These values were much greater than those found in NR cats, for which callosal terminal arbors occupied only 0.5–2.5 mm2 in the 17/18 TZ, and extended maximally from 200 to 2000 μm.
The axon distribution in the CV2 group (cf. Table A2 in Appendix and Figure 9B) was different from that observed for the CV1 group. Callosal terminals originating from 17/18 TZ also terminated preferentially in 17/18 TZ and A18. Those originating from A17 terminated mainly in 17/18 TZ and A17 with a few branches in A18. But the stereotaxic coordinates of both the injection site and the terminals branches were similar. Thus here, at least globally, both the callosal connections between primary visual cortices and the callosal terminal arbors displayed apparently normal characteristics. Callosal terminals were also mostly located in 17/18 TZ like in NR animals. Some abnormalities could however be found at the level of single callosal terminals, which extended from 50 to 1000 μm along the antero-posterior axis (m = 453 μm) and from 235 to 4353 μm along the medio-lateral one (m = 1321 μm). These values were thus, as in the CV1 group, greater than the ones found in NR animals.
Areal distributions of the synaptic boutons. In the CV1 group, the number of boutons per axon varied from 38 to 1056 (cf. Table A1 in Appendix). More than half of them were located in A18 (57%, Table A3 in Appendix) while others were distributed in the 17/18 TZ (31%) or in A17 (12%). Thirty boutons were also located in the WM, either below A17 (n = 9) or below A18 (n = 21). In comparison, the percentages of the synaptic boutons of the callosal axons in the NR adult animals were 78% in the 17/18 TZ, 1% in A17, and 21% in A18. Therefore, the areal distribution of the synaptic boutons of the callosal terminals in the CV1 group is far from being normal (χ2 with Yates correction, P < 0.01).
In the CV2 group, data were again different (cf. Table A2 and Table A3 in Appendix). The number of boutons per axon could vary from none to 602. For recall, the axon with no bouton did not enter the cortex likely because the critical period ended before (cf. axon CVE4-A in Architecture of Callosal Terminal Axons). The areal distribution of the synaptic boutons resembled that found in the NR adults. In particular, a majority of boutons were located in the 17/18 TZ (68.5%). Still, this distribution was different from the one obtained in NR, with additionally 10.5% boutons in A18 and 21% of boutons in A17 (χ2 with Yates correction, P < 0.01). Evidently, the difference between CV1 group and CV2 group is significant (χ2 with Yates correction, P < 0.01).
Although this will not be developed here, the synaptic boutons of callosal axons in both CV1 and CV2 groups formed clusters (or “columns”). Similarly to the NR group, their number ranged from 1 to 8 according to the axon (cf. Table A1 and Table A2 in Appendix).
Laminar distributions of the synaptic boutons. In the CV1 group, the laminar distributions of the synaptic boutons were supra-granular (n = 2), bi-laminar (n = 3), granular (n = 1), trans-granular (n = 1), or infragranular (n = 1). Thus, every type of distribution was represented although the supra-granular and the bi-laminar distributions seemed to be more common (Table A1 in Appendix). In the CV2 group, by contrast, only two configurations were found: supra-granular (n = 5) and trans-granular (n = 3); cf. Table A2 in Appendix. This resembles the NR group, with most callosal axons displaying a supra-granular distribution of their synaptic boutons.
In both strabismic groups, most callosal synaptic boutons were found in layers II/III (71% in the CV1 group and 67% in the CV2 group) while the remaining ones were distributed in all other cortical layers (cf. Tables A3 in Appendix). This held true for terminals located in A17, A18, or in 17/18 TZ. Surprisingly, this is similar to the data of the NR animals where on average 70% of the callosal synaptic boutons were located in the supra-granular layers (A17: 86%, 17/18 TZ: 72%; A18: 62%); cf. Table A3 in Appendix. The strabismics were not significantly different from normals (CV1 vs. NR: χ2 with Yates correction, P > 0.05; CV2 vs. NR: χ2 with Yates correction, P > 0.05; cf. Table A3 in Appendix). But a significant difference was found between CV1 and CV2 distributions (χ2 test with Yates correction, P < 0.05).
Note that, in contrast with NR adult animals, a few additional callosal synaptic boutons appeared in the WM of both strabismic groups, just below A17, A18, and 17/18 TZ (cf. Tables A3 in Appendix). Thus, strabismus seemed to increase their incidence in this particular part of the cortex (cf. Table A1 and Table A2 in Appendix).
Quantitative analysis of the CV callosal axons
This section quantifies parameters characterizing the morphology of callosal axons: mean trunk diameter, mean diameter of first order branches, mean lengths of first to fifth order branches, and mean numbers of nodes, terminals, and synaptic boutons (cf. Table A4 in Appendix). Each parameter tested for differences between the three experimental groups and only the three parameters found to be significantly different among groups are described.
Mean lengths of the first to the fifth order branches of the callosal axons. In the CV1 group, the mean length of the first to fifth order branches were respectively: 1417 ± 1341, 695 ± 865, 452 ± 244, 247 ± 104, and 141 ± 68 μm. In the CV2 group, the mean lengths of the first to fifth order branches were respectively: 2356 ± 1214, 1058 ± 1315, 342 ± 342, 263 ± 280, and 115 ± 86 μm (cf. Table A4 in Appendix). For comparison, in the NR animals, the mean lengths of these various branches were respectively: 1599 ± 1366, 433 ± 494, 253 ± 236, 132 ± 76, and 79 ± 39 μm.
Statistical analysis (see Table A4 in Appendix) revealed no difference between the lengths of the first and of the second order branches. By contrast, the branches of superior orders were all significantly longer in the CV1 group compared to the NR group. Note, however, that no significant difference could be found between the CV1 and the CV2 groups.
Mean numbers of nodes of the callosal axons. The mean number of nodes per axon was 61 ± 50 in the CV1 group (range: 2–88), 31 ± 30 in the CV2 group (range: 2–90), and 124 ± 88 in the NR group (range: 18–299). The mean numbers of nodes for both CV groups were therefore systematically lower than the one observed for the NR group. However, only a significant difference could be found between the CV2 group and the NR group (Wilcoxon test, P = 0.003, Z = 2.9713; cf. Table A4 in Appendix).
Mean numbers of terminals of the callosal axons. The mean number of terminals per axon was 62 ± 50 in the CV1 group (range: 3–90) and 34 ± 30 in the CV2 group (range: 3–92). These values were lower than that found in the NR group (125 ± 88; range: 19–300). However, statistical differences could only be found between the CV2 group and the NR (Wilcoxon test, P = 0.0033, Z = 2.94).
Discussion
While previous data in the literature were sparse and controversial (cf. Introduction), this study demonstrates unequivocally for the first time that early unilateral convergent strabismus does lead to the development of asymmetrical interhemispheric connections through the corpus callosum (CC) in cat primary visual cortex. Differences in functional characteristics of the visual interhemispheric transfer within each hemisphere were identified first. Asymmetry between the hemispheres was confirmed anatomically, after labeling and reconstructing in 3D single callosal axons. Such asymmetry resulted from specific anatomo-functional abnormalities in each hemisphere (Figure 10). Consequently, the CC is no longer able to properly unify the two visual hemifields. Two new general mechanisms are proposed to explain this abnormal development of the CC.
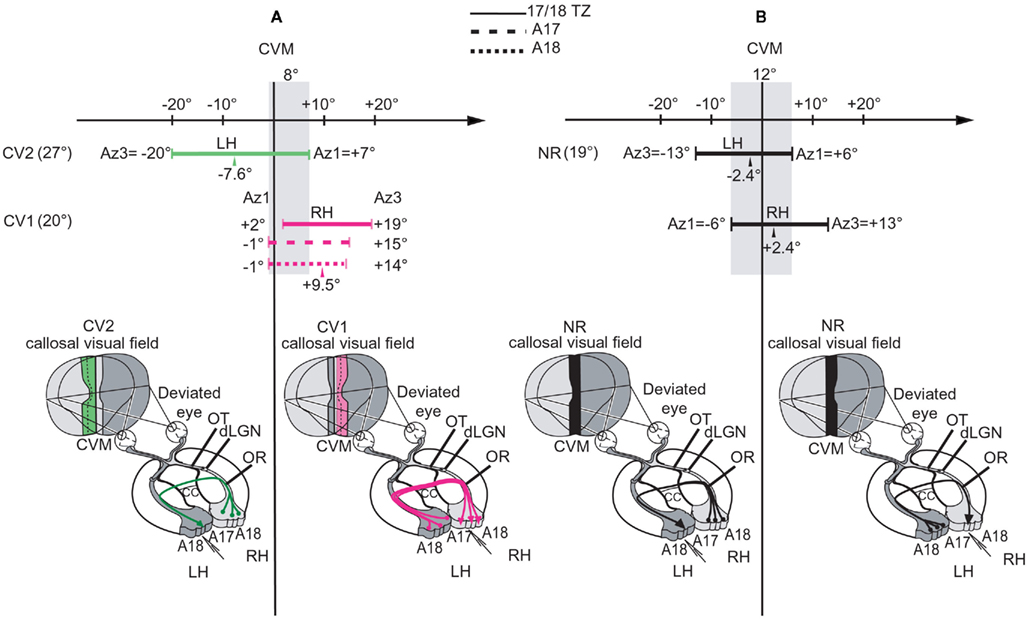
Figure 10. Summary of the organization of the callosal connections and spatial characteristics of the “callosal visual field” in the CV1 and CV2 groups compared to NR. The lowest part of each panel summarizes the location of both the callosal neurons (filled circles at bases of colored lines) and their terminals (arrows) in LH and RH. It also summarizes the spatial distribution of the receptive fields of the transcallosally activated units (TC-RFs) that were mapped while exploring 17/18 TZ, i.e., the callosal visual field corresponding to this specific region (in pink, green, or black depending on the experimental group). For more precision about it, in the upper part of each panel, we have additionally reported the exact values of the azimuths (in degrees) of the medial-most (Az1) and the lateral-most (Az3) borders of the TC-RFs mapped through recordings 17/18 TZ as well as A17 and A18 (cf. at top of the figure for their respective representations). This allows defining the width of the “callosal visual field” encoded by each of these cortical regions. In each case, the arrow indicates the mean azimuth of the center of the TC-RFs (m Az2). At left, the maximum width of the “callosal visual field” is also indicated. (A) Illustration of the asymmetrical organization of both the callosal connections and the callosal visual field in the strabismic cats. In the CV1 group (in pink), callosal neurons (in LH), and callosal terminals (in RH) are distributed in A17, A18, and 17/18 TZ. The callosal visual field encoded in the 17/18 TZ extends within the hemifield ipsilateral to the explored cortex (RH) and does not contact the CVM while the callosal visual fields encoded in A17 and A18 have only a very limited contact with it. In the CV2 group (in green), callosal neurons are distributed in A17, A18, and 17/18 TZ but callosal terminals are almost restricted to the 17/18 TZ. The callosal visual field also extends widely in the hemifield ipsilateral to the explored cortex (LH) but, this time, it overlaps substantially the CVM. Altogether, the overlap between the callosal representations along the CVM in LH and RH of strabismics thus does not exceed 8° (i.e., from −1° to +7°, as represented by the vertical shaded area along the CVM). (B) Illustration of the symmetry in NR group (in black). There are reciprocal and equivalent callosal connections from RH to LH and from LH to RH. In all cases, the callosal neurons are mainly located in the 17/18 TZ while some are also located in A17 and A18 near the 17/18 TZ, but the callosal terminals are almost restricted to the 17/18 TZ. Thus, the callosal visual fields encoded in LH and RH (i.e., the callosal representations in LH and RH) display both the same width but mirror exactly each other. Both overlap the CVM, with a substantial part in the hemifield ipsilateral to the explored cortex and a more restricted part in the contralateral hemifield, sharing this time as much as 12° (vertical shaded area from −6° to +6°).
Asymmetrical Callosal Connections Do Develop after Early Unilateral Convergent Strabismus in Cat Visual Cortex
In NR adult cats, the transfer of visual information from RH to LH is similar to that from LH to RH. This is because both the callosal neurons and their terminals are distributed equally in each hemisphere (e.g., Leicester, 1968; Innocenti and Fiore, 1976; Payne, 1990a,b; Payne and Siwek, 1991; Houzel et al., 1994; Olavarria, 1996, 2001). One may say that callosal connections are organized symmetrically between the hemispheres (Figure 10B). By contrast, as assessed by the functional and the anatomical data we report here, callosal connections after an early unilateral convergent strabismus are abnormal and develop asymmetrically (Figure 10A).
Comparing first the distribution of the TC units established here in the CV2 group to the one we have established previously in the CV1 group (Milleret and Houzel, 2001), we found that they differed markedly in LH and RH of strabismics. The most marked result was a clear difference in the tangential distribution of TC units: it was almost normal in the hemisphere ipsilateral to the non-deviated eye (LH of CV2 group), in contrast with the exuberance in the hemisphere ipsilateral to the deviated eye (RH of CV1 group). In the latter group, the location of TC units extended to both in A17 and A18, thus much further than the 17/18 TZ. The observation of a functional asymmetry is reinforced by the differences in the percentages of TC units within each cortical region. Within the 17/18 TZ, which was the main location of the TC units in both experimental groups, the proportion of the TC units was significantly higher in the CV2 group than in the CV1 one (78 vs. 46.5%). In contrast, the proportion of TC units within A17 and A18 was significantly lower in the CV2 group than in the CV1 one (3 vs. 16% and 1 vs. 27% respectively). The comparison between the laminar distributions of the TC units in both CV groups also showed asymmetry. Focusing on the 17/18 TZ, where TC units were numerous for each experimental group, those recorded in the CV2 group (LH) were found in all cortical layers and their radial distribution did not exhibit any specific bias. In contrast in RH of the CV1 group, TC units were predominantly located in infragranular layers.
The anatomical study supports these functional results, but characterizes this asymmetry in greater detail by analyzing the morphological differences between single callosal axons of each hemisphere. This shows that both the tangential and the radial distributions of the terminals of these axons differed markedly between hemispheres. Furthermore the tangential distribution of their synaptic boutons differed bilaterally. Overall, both qualitative and quantitative analyses indicate that the asymmetry results from a profound but different reshaping of the morphology of single callosal axons within each hemisphere, which is reflected in the functional responses. Such data are in agreement with two early studies which suggested that an exuberant distribution of callosal terminals was present in the hemisphere ipsilateral to the deviated eye while a rather normal distribution was present in the hemisphere ipsilateral to the non-deviated eye after unilateral convergent strabismus (Lund and Mitchell, 1979; Berman and Payne, 1983).
Of interest, this asymmetry reflects anomalies in both hemispheres compared to the normal situation. But the most important abnormalities were systematically found in RH, i.e., in the hemisphere ipsilateral to the deviated eye (CV1 group). As developed below, this is particularly important to explain the origin of the functional asymmetry that develops in visual cortex after unilateral strabismus. Functionally, in the NR group, almost all TC units are located in the 17/18 TZ. In contrast, in the CV1 group (RH), a substantial proportion of TC units were abnormally present in A17 and A18 as well as in the WM. On the other hand, in the CV2 group (LH), the tangential distribution of the TC units was closer to normal, but the proportion of TC units in the 17/18 TZ was significantly higher than normal. In addition, a few TC units were abnormally located at rather eccentric portions of A17 and A18 as well as in the WM. The same holds true when considering the radial distribution of the TC. Comparison of anatomical data between strabismic and normal animals also revealed abnormalities in both hemispheres after unilateral strabismus, with the most important abnormalities in RH, even if both RH and LH exhibited an areal distribution respecting the normal “non-mirror” organization of the interhemispheric callosal connections (cf. Introduction). Callosal terminals within RH were mostly heterotopic, while those in LH were mostly homotopic as in normal. The tangential distribution of the callosal terminals in RH was also wider than normal, while in LH this was rather normal although a few abnormal terminals were found in A17 and A18. Finally, the distribution of the synaptic boutons in RH of strabismics was also very different from normal while the one in LH of strabismics was closer to normal.
Effect of Strabismus on the Contribution of the Corpus Callosum to Unify the Two Visual Hemifields
In NR adult cats, as with the other functional properties, the spatial distribution of the TC-RFs in RH, i.e., the “callosal visual field” in this hemisphere is similar to that from LH, even if they mirror one another (e.g., Payne, 1990a,b; cf. Figure 10B, in black). Again, one may say that they are represented symmetrically between the hemispheres. Within RH, their extreme limits are at −6° in the left hemifield and +13° in the right hemifield, with a mean azimuth of their centers at +2.4° ± 0.6°; in LH, they are at +6° in the right hemifield and −13° in the left one, with a mean azimuth of their centers at −2.4° ± 0.6° (Milleret et al., 2005; Figure 10B). Thus, globally, callosal visual fields of both hemispheres in NR animals share 6° on each side of the CVM, i.e., 12°.
By contrast, after strabismus, the spatial distribution of the TC-RFs in RH (CV1 group; cf. Milleret and Houzel, 2001) is rather different to that from LH (CV2 group). Thus, the “callosal visual fields” develop abnormally and asymmetrically between the hemispheres (Figure 10A). In RH, i.e., the hemisphere ipsilateral to the deviated eye (CV1 group), the TC-RFs were almost all shifted by several degrees away from the CVM, within the hemifield ipsilateral to the explored cortex. In the 17/18 TZ, with their extreme limits being located at +2° and +19° in the hemifield ipsilateral to the explored cortex, the maximum width of their distribution was 17° and TC-RFs did not have any contact with the CVM. In A17 and A18, with extreme values at −1°/+15° and −1°/+14° respectively, they only kept a very restricted contact with the CVM. By contrast, in LH, i.e., the hemisphere ipsilateral to the non-deviated eye (CV2 group), the TC-RFs in the 17/18 TZ extended substantially in the hemifield ipsilateral to the explored cortex but almost systematically abutted or intersected the CVM. With their extreme limits extended at +7° in the hemifield contralateral to the explored cortex and −20° in the ipsilateral one respectively, the maximum width of their distribution reached 27°. As a consequence, the “callosal visual fields” in RH and LH of CV animals share a smaller angle than normal (8° instead of 12°, cf. the vertical shaded area in Figure 10A). In other words, the overlap between the callosal representation along the CVM in LH and RH decreased after strabismus compared to normal. This common part in the visual field is also no longer distributed symmetrically on each side of the CVM, with 7° in the right hemifield and 1° in the left. Again, note that asymmetry resulted from abnormalities in both hemispheres because of strabismus, with most located in RH, i.e., in the hemisphere ipsilateral to the deviated eye (CV1 group). Altogether, this leads to the important conclusion that the capacity of the CC to unify both hemifields is greatly impaired after early unilateral convergent strabismus. (Figure 10A).
Effect of Strabismus on the Ipsilateral Retino-Geniculo-Cortical Pathway
Interestingly, different spatial distributions of the GC-RFs of the TC units were also found in each hemisphere of strabismics (cf. Spatial Distribution of the GC-RFs for details). As before, such asymmetry is related to abnormalities in both hemispheres because of strabismus (cf. Figure 6B). But those in RH, i.e., within the hemisphere ipsilateral to the deviated eye (CV1 group), are again the greatest. In brief, compared to normal, the spatial distribution of the GC-RFs in RH (CV1 group) was shifted toward the hemifield contralateral to the explored cortex by several degrees, losing most of its contact with the CVM. In addition, it was substantially wider than normal (32° instead of 20°). By contrast, in LH (CV2 group), the spatial distribution of the GC-RFs resembles that of normals. Still, the mean values of Az2 and Az3 values were larger in the CV2 group than in the NR group. Globally, this indicates that the retino-GC pathway which projects in the hemisphere ipsilateral to the deviated eye is also globally more affected by strabismus than the hemisphere ipsilateral to the non-deviated eye. Again, this is of particular importance to explain the origin of the brain asymmetry that develops in visual cortex after unilateral strabismus (see next paragraph).
Two Possible Mechanisms of How Interhemispheric Connections Become Asymmetric after Early Unilateral Convergent Strabismus
A first mechanism provided directly from the data reported here
First, considering the morphology of single callosal axons, in RH (i.e., CV1 group), we found that the mean lengths of the third to fifth order branches were significantly longer than normal (by at least a factor of 2). In contrast, in LH (i.e., the CV2 group), we found that the mean number of nodes and terminals were significantly lower than normal. We propose that the lengthening of the third to fifth order callosal branches in the hemisphere ipsilateral to the deviated eye and the decrease in numbers of nodes and terminals in the hemisphere ipsilateral to the non-deviated eye is one of the main mechanisms to account for the development of asymmetrical callosal connections between the hemispheres after unilateral strabismus.
Surprisingly, our recent data suggest that this mechanism might be generalized to any unilateral alteration of vision occurring early in life. Indeed, we have recently shown that, after early monocular deprivation, exuberant callosal terminals can also be found at adulthood within the hemisphere ipsilateral to the deprived eye compared to normal. Moreover, the lengths of the fourth and the fifth order branches of the callosal axons within this hemisphere are significantly longer than normal (multiplied by a factor of at least 3, Foubert et al., 2010). These data fit with the idea that the lengthening of callosal branches of superior order occurs systematically within the hemisphere ipsilateral to the altered eye. Whether the numbers of nodes and terminals are also decreased in the hemisphere ipsilateral to the non-deprived eye remains unknown.
What general rules govern the development of asymmetrical callosal connections in visual cortex?
Our data demonstrate that callosal connections between visual cortices develop asymmetrically after unilateral convergent strabismus because of the sprouting of some specific callosal branches in one hemisphere and the decreased number of nodes and terminals in the other hemisphere. But, presently, the rules that govern the development of such asymmetry are not known. Although some hypotheses have been proposed (Lund and Mitchell, 1979; Berman and Payne, 1983), they are not supported by the obtained experimental data using both the anatomical and the functional approaches.
The hypothesis we propose here is based upon several rather well established general rules governing the development of connectivity in cat visual cortex: (a) At birth all pathways are immature: the crossed retino-GC pathways originating mainly from the nasal retinas (cRGC), the uncrossed ones originating mainly from both temporal retinas (iRGC) as well as the CC (e.g., Berbel and Innocenti, 1988; Aggoun-Zouaoui and Innocenti, 1994; Milleret et al., 1994; Aggoun-Zouaoui et al., 1996; Crair et al., 1998, 2001; Katz and Crowley, 2002); (b) Their respective anatomo-functional development is highly dependent on postnatal visual experience (e.g., Innocenti, 1986; Crair et al., 1998; Foubert et al., 2010); (c) The cRGC pathways are functionally active before the iRGC pathways (e.g., Milleret et al., 1988b; Crair et al., 1998, 2001); (d) Callosal connections develop after both the cRGC and the iRGC pathways have established functional synapses in visual cortex (e.g., Innocenti, 1981; Milleret et al., 1994; Crair et al., 2001; Katz and Crowley, 2002). Thus, any abnormality in the development of the cRGC and the iRGC pathways resulting from an abnormal postnatal visual experience may alter the development of callosal connections; (e) The deviation of one eye early in life alters the anatomo-functional characteristics of both the cRGC and the iRGC pathways originating from that eye (e.g., Hubel and Wiesel, 1963; Ikeda et al., 1977, 1978); (f) Early convergent strabismus may lead to the stabilization of juvenile exuberant callosal neurons (e.g., Innocenti and Frost, 1979; Berman and Payne, 1983; Elberger et al., 1983) and to the sprouting of callosal terminals during postnatal development (e.g., Lund et al., 1978; Lund and Mitchell, 1979; Berman and Payne, 1983; Milleret and Houzel, 2001).
On the basis of these rules, we postulate that both the cRGC and the iRGC pathways contribute to the postnatal development of the callosal connections in cat visual cortex. We hypothesize that these contributions occur in succession over time. First, both the left and the right cRGC pathways would determine the characteristics of the callosal efferent zones, i.e., the zones where the cell bodies of the callosal neurons are located. Then, both the left and the right iRGC pathways would determine the characteristics of the callosal afferent zones, i.e., the cortical zones where the callosal terminals are located. As a result, a RGC pathway (whether cRGC or iRGC) developing in normal viewing conditions would then lead to a normal organization of the related callosal zone. By contrast, an abnormal RGC pathway developing in abnormal viewing conditions would lead to an abnormal organization of the related callosal zone, i.e., a wider extension than normal.
Such a mechanism would explain the asymmetrical organization of callosal connections shown here in the adult following early convergent strabismus of the RE (cf. Figure 10A). For the CV1 group, vision through the deviated RE would first alter the development of the cRGC pathway projecting to LH. As a consequence, some juvenile exuberant callosal neurons would be stabilized in this hemisphere, leading to an abnormally large distribution of the callosal neurons. Several studies support such an interpretation (Innocenti and Frost, 1979; Berman and Payne, 1983; Elberger et al., 1983). Such an increase in callosal neurons would then lead to an increase of callosal axons in the CC compared to normal. Then, vision through this same deviated RE would alter the development of the iRGC pathway projecting to the RH. As a consequence, some exuberant callosal axons would enter the visual cortex through sprouting, leading to an abnormally large distribution of the callosal terminals in this hemisphere. Results from the CV1 group support this view. This is also in agreement with previous anatomical data reported in the literature (Lund and Mitchell, 1979; Berman and Payne, 1983).
In contrast, according to this mechanism, the development of both the cRGC and the iRGC pathways originating from the left (non-deviated) eye (LE) would be expected to be close to normal. Therefore, in the CV2 group, both the distribution of the callosal neurons in RH and that of the callosal terminals in LH are predicted to be comparable to those in normal animals. This is partially true. From the literature, it is known that the distribution of callosal neurons is slightly larger than normal (Berman and Payne, 1983; Elberger et al., 1983). Moreover, we found here that callosal terminals in LH exhibit a distribution that is also slightly larger than normal. However, these differences were much weaker than the ones evoked through the deviated eye, and may account to the ability of the non-deviated eye in unilateral strabismics to also evoke some abnormalities in visual cortex (Chino et al., 1983, 1988; Levi and Klein, 1985; Leguire et al., 1990).This view is supported by data from the CV2 group. For example, the spatial distribution of the GC-RFs of the TC units in this group is close to normal but not identical, suggesting that some subtle changes in the retinotopic map may occur.
These rules may apply more generally to the development of callosal connections in case of any monocular alteration of vision occurring early in life (for example a monocular occlusion or a monocular enucleation). Furthermore, it also works for other mammal species, including rat, hamster, and cat (e.g., Rhoades and Dellacroce, 1980; Olavarria et al., 1987; O’Brien and Olavarria, 1995; Foubert et al., 2010).
Etiology of Strabismus and Callosal Connections
In humans, it is well known that early strabismus generally occurs during the first postnatal months. Mostly convergent, its characteristics are remarkable: crossed fixation, latent nystagmus, dissociated vertical deviation (Bui Quoc and Espinasse-Berrod, 2004; Thouvenin, 2004). It systematically leads to a loss of 3D perception. It may also be responsible for unilateral amblyopia. From studies on animal models, the perceptual deficits associated with strabismus likely result from abnormal development of the visual system, in particular at the level of the primary visual cortex (cf. Boothe et al., 1985; Milleret, 1994a,b; Kiorpes and McKee, 1999; Löwel and Engelmann, 2002). The anatomical and functional data reported here about callosal connections are coherent with this abnormal cortical development.
By contrast, the etiology of strabismus is still poorly understood, though it is clear that heredity as well as acquired factors such as premature birth is associated with early strabismus (Von Noorden, 1988). Some hypotheses may however be proposed.
First, strabismus could have a peripheral origin such as abnormalities at the level of the proprioceptive receptors of the extraocular muscles. Abnormal signals in the extraocular proprioceptive afferents projecting centrally would then alter the development of visual cortex (e.g., Buisseret, 1995 for review). The activity of the oculomotor neurons may also be greater or smaller than normal because of potential dysfunctions of the oculomotor circuitry (Miller, 2003). But there is no reason to favor one hypothesis over another. Note however that, whatever the peripheral palliative treatment is clinically performed in humans, regardless of age, early strabismus results in severe alteration of binocular vision, even if realignment of eyes is obtained. Very early surgery during the first year of life, the use of prismatic glasses, and early injection of botulinum toxinum in the muscles have not proven their efficacy in restoring normal binocular vision in early strabismus.
The hypothesis of a central origin of strabismus may explain such difficulties, at least in some cases. Almost a century ago, Worth (1915) suggested the existence of a “center of binocular vision” that would be initially impaired in strabismics. If so, the absence of binocular vision would be responsible for the deviation of the eyes, although the precise mechanism for this remains unclear (Hutcheson, 2004). The callosal projection pathways would be a principal element of such a “center of binocular vision.” This leads to the hypothesis that abnormal development of visual interhemispheric transfer and the related abnormal binocular activation of callosal connections (cf. Figure 7) would be responsible for abnormal binocular vision in humans. Consequently, as suggested by Worth, this absence of normal binocular vision would induce early strabismus in humans. This is consistent with the observation that binocular vision remains abnormal even if eye realignment is achieved. Supporting this, failure of development of the corpus callosum in humans or even a pathological development of corpus callosum is often associated with abnormal eye movements and strabismus (e.g., Goyal et al., 2010).
Conflict of Interest Statement
The authors declare that the research was conducted in the absence of any commercial or financial relationships that could be construed as a potential conflict of interest.
Acknowledgments
The authors thank Murielle Bourge for animal care. France Maloumian for assistance in preparing of some of the figures. We also thank Drs. S. Wiener and S. Sara for useful comments on the manuscript, European Journal of Neuroscience publisher for permitting reproducing Figures 2, 4, 11–13 from Houzel et al. (1994) and Figures 2, 3, 5, 6, 8–12 from Milleret and Houzel (2001) as well as Visual Neuroscience for permitting reproducing part of Figures 5 and 9 from Milleret et al. (2005). This work was supported by the MENSER (ACI “Neurosciences Integratives and Computationelles”) to C. Milleret, the “Fondation pour la Recherche Médicale” to E. Bui Quoc and the European Grant “Marie Curie IRG” (N° 210459) to J. Ribot.
Abbreviations
Az1, Az2, and Az3, medial-most, center, and lateral-most limits of the receptive fields respectively; CC, corpus callosum or callosal connections; CVM, central vertical meridian of the visual field; GC, geniculo-cortical; LH and RH, left and right hemisphere respectively; m, mean; NR, normally reared; OI, overlap index; RF, receptive field; S and NS, selective and non-selective cells for orientation; TC, transcallosal; WM, white matter.
References
Aggoun-Zouaoui, D., and Innocenti, G. M. (1994). Juvenile visual callosal axons in kittens display origin- and fate-related morphology and distribution of arbors. Eur. J. Neurosci. 6, 1846–1863.
Aggoun-Zouaoui, D., Kiper, D. C., and Innocenti, G. M. (1996). Growth of callosal terminal arbors in primary visual areas of the cat. Eur. J. Neurosci. 8, 1132–1148.
Alekseenko, S. V., Toporova, S. N., and Shkorbatova, P. Y. (2009). Interhemispheric connections of eye dominance columbs in the cat visual cortex in conditions of impaired binocular vision. Neurosci. Behav. Physiol. 39, 489–495.
Berbel, P., and Innocenti, G. M. (1988). The development of the corpus callosum in cats: a light- and electron-microscopic study. J. Comp. Neurol. 2, 242–259.
Berlucchi, G., Gazzaniga, M. S., and Rizzolatti, G. (1967). Microelectrode analysis of transfer of visual information by the corpus callosum. Arch. Ital. Biol. 105, 583–596.
Berlucchi, G., and Rizolatti, G. (1968). Binocular driven neurons in the visual cortex of split-chiasm cats. Science 159, 308–310.
Berman, N. E., and Payne, B. (1983). Alterations in connections of the corpus callosum following convergent and divergent strabismus. Brain Res. 274, 201–212.
Boothe, R. G., Dobson, V., and Teller, D. (1985). Postnatal development of vision in humans and non human primates. Annu. Rev. Neurosci. 8, 495–545.
Bourdet, C., Olavarria, J. F., and Van Sluyters, R. C. (1996). Distribution of visual callosal neurons in normal and strabismic cats. J. Comp. Neurol. 366, 259–269.
Bui Quoc, E., and Espinasse-Berrod, M.-A. (2004). Strabisme chez l’enfant. Encyclopédie Médico-Chirurgicale, Pédiatrie, 4-120-D-10, Paris.
Buisseret, P. (1995). Influence of extraocular muscle proprioception on vision. Physiol. Rev. 75, 323–338.
Chino, Y. M., Ridder, W. H., and Czora, E. A. (1988). Effects of convergent strabismus on spatio-temporal properties of neurons in cat area 18. Exp. Brain Res. 72, 264–278.
Chino, Y. M., Shansky, M. S., Jankowski, W. L., and Banser, F. A. (1983). Effects of rearing kittens with convergent strabismus on development of receptive field properties in striate cortex neurons. J. Neurophysiol. 50, 265–286.
Crair, M. C., Gillespsie, D. C., and Stryker, M. P. (1998). The role of visual experience in the development of columns in cat visual cortex. Science 279, 586–570.
Crair, M. C., Horton, J. C., Antonini, A., and Stryker, M. (2001). Emergence of ocular dominance columns in cat visual cortex by 2 weeks of age. J. Comp. Neurol. 430, 235–249.
Elberger, A. (1993). Distribution of transitory corpus callosum axons projecting to developing cat visual cortex revealed by Dii. J. Comp. Neurol. 333, 326–342.
Elberger, A., Smith, E. L. III, and White, J. M. (1983). Spatial dissociation of visual inputs alters the origin of the corpus callosum. Neurosci. Lett. 35, 19–24.
Foubert, L., Bennequin, D., Thomas, M. A., Droulez, J., and Milleret, C. (2010). Interhemispheric synchrony in visual cortex and abnormal postnatal visual experience. Front. Biosci. 15, 681–707.
Goyal, R., Watts, P., and Hourihan, M. (2010). Ocular findings in pediatric patients with partial agenesis of corpus callosum. J. Pediatr. Ophthalmol. Strabismus 47, 236–241.
Hollander, M., and Wolfe, D. A. (1973). Nonparametric Statistical Methods. New York: John Wiley and Sons.
Houzel, J.-C., Milleret, C., and Innocenti, G. (1994). Morphology of callosal axons interconnecting areas 17 and 18 of the cat. Eur. J. Neurosci. 6, 898–917.
Hubel, D. H., and Wiesel, T. N. (1963). Binocular interaction in straite cortex of kittens reared with artificial squint. J. Neurophysiol. 28, 1041–1059.
Hubel, D. H., and Wiesel, T. N. (1967). Cortical and callosal connections concerned with the vertical meridian of visual fields in the cat. J. Neurophysiol. 30, 1561–1573.
Hubel, D. H., and Wiesel, T. N. (1970). The period of susceptibility to the physiological effects of unilateral eye closure in kittens. J. Physiol. (Lond.) 206, 419–436.
Ikeda, H., Plant, G. T., and Tremain, K. E. (1977). Nasal field loss in kittens reared with convergent squint: neurophysiological and morphological studies on the lateral geniculate nucleus. J. Physiol. (Lond.) 270, 345–366.
Ikeda, H., Tremain, K. E., and Einon, G. (1978). Loss of spatial resolution of lateral geniculate nucleus neurons in kittens raised with convergent squint produced at different stages in development. Exp. Brain Res. 31, 207–220.
Innocenti, G. M. (1981). Growth and reshaping of axons in the establishment of visual callosal connections. Science 212, 824–827.
Innocenti, G. M. (1986). “General organization of callosal connections in the cerebral cortex,” in Cerebral Cortex, eds A. Peters, and E. G. Jones (New York: Plenum), 291–353.
Innocenti, G. M., and Clarke, S. (1984). The organization of immature callosal connections. J. Comp. Neurol. 230, 287–309.
Innocenti, G. M., Clarke, S., and Kraftsik, R. (1986). Interchange of callosal and association projections in the developing visual cortex. J. Neurosci. 6, 1384–1409.
Innocenti, G. M., and Fiore, L. (1976). Morphological correlates of visual field transformation in the corpus callosum. Neurosci. Lett. 2, 245–252.
Innocenti, G. M., Fiore, L., and Caminiti, R. (1977). Exuberant projection into the corpus callosum from the visual cortex of newborns cats. Neurosci. Lett. 4, 237–242.
Innocenti, G. M., and Frost, D. (1979). Effects of visual experience on the maturation of the efferent system to the corpus callosum. Nature 280, 231–234.
Innocenti, G. M., Lehmnn, P., and Houzel, J. C. (1994). Computational structure of visual callosal axons. Eur. J. Neurosci. 6, 918–935.
Kageyama, G. M., and Wong-Riley, M. (1986a). The localization of cytochrome oxidase in the LGN and striate cortex of postnatal kittens. J. Comp. Neurol. 243, 182–194.
Kageyama, G. M., and Wong-Riley, M. (1986b). Laminar and cellular localization of cytochrome oxidase in the cat striate cortex. J. Comp. Neurol. 245, 137–159.
Katz, L. C., and Crowley, J. C. (2002). Development of cortical circuits: lessons from ocular dominance columns. Nature 3, 34–42.
Kiorpes, L., and McKee, S. P. (1999). Neural mechanisms underlying amblyopia. Curr. Opin. Neurobiol. 9, 480–486.
Leguire, L. E., Rogers, G. L., and Bremer, D. L. (1990). Amblyopia: the normal eye is not normal. J. Pediatr. Ophthalmol. Strabismus 27, 32–38.
Leicester, J. (1968). Projection of the visual vertical meridian to cerebral cortex of cat. J. Neurophysiol. 31, 371–382.
Leporé, F., and Guillemot, J. P. (1982). Visual receptive field properties of cells innervated through the corpus callosum in the cat. Exp. Brain Res. 46, 413–424.
Levi, D. M., and Klein, S. A. (1985). Vernier acuity, crowding and amblyopia. Vision Res. 25, 979–991.
Löwel, S., and Engelmann, R. (2002). Neuroanatomical and neurophysiological consequences of strabismus: changes in the structural and functional organization of the primary visual cortex in cats with alternating fixation and strabismic amblyopia. Strabismus 10, 95–105.
Lund, R. D., and Mitchell, D. E. (1979). Asymmetry in the visual callosal connections of strabismic cats. Brain Res. 167, 176–179.
Lund, R. D., Mitchell, D. E., and Henry, G. H. (1978). Squint-induced modification of callosal connections in cats. Brain Res. 144, 169–172.
Milleret, C. (1994a). Physiopathogénie de l’amblyopie strabique. Editions techniques. Encyclopedia Méd Chir, Ophtalmologie, 21-595-A-05, Paris.
Milleret, C., and Buser, P. (1984). Receptive fields sizes and responsiveness to light in area 18 of the adult cat after chiasmotomy. Postoperative evolution; role of visual experience. Exp. Brain Res. 57, 73–81.
Milleret, C., and Buser, P. (1993). Reorganization processes in the visual cortex also depend on visual experience in the adult cat. Prog. Brain Res. 95, 257–269.
Milleret, C., Buser, P., and Watroba, L. (2005). Unilateral paralytic strabismus in the adult cat induces plastic changes in interocular disparity along the visual midline: contribution of the corpus callosum. Vis. Neurosci. 22, 325–343.
Milleret, C., Gary-Bobo, E., and Buisseret, P. (1988a). Area centralis position relative to the optic disc projection in kittens as a function of age. Invest. Ophthalmol. Vis. Sci. 29, 1299–1305.
Milleret, C., Gary-Bobo, E., and Buisseret, P. (1988b). Comparative development of cell properties in cortical area 18 of normal and dark-reared kittens. Exp. Brain Res. 71, 8–20.
Milleret, C., and Houzel, J. C. (2001). Visual interhemispheric transfer to areas 17 and 18 in cats with convergent strabismus. Eur. J. Neurosci. 13, 137–152.
Milleret, C., Houzel, J. C., and Buser, P. (1994). Pattern of development of the callosal transfer of visual information to cortical areas 17 and 18 in the cat. Eur. J. Neurosci. 6, 193–202.
Nakamura, H., Chaumon, M., Klijn, F., and Innocenti, G. M. (2008). Dynamic properties of the representation of the visual field midline in the visual areas 17 and 18 of the ferret (Mustela putorius). Cereb. Cortex 18, 1941–1950.
O’Brien, B. J., and Olavarria, J. F. (1995). Anomalous patterns of callosal connections develop in visual cortex of monocularly enucleated hamsters. Biol. Res. 28, 211–218.
Olavarria, J., Malach, R., and Van Sluyters, R. C. (1987). Development of visual callosal connections in neonatally enucleated rats. J. Comp. Neurol. 260, 321–348.
Olavarria, J. F. (1995). The effects of visual deprivation on the number of callosal cells in the cat is less pronounced in extrastriate cortex than in the 17/18 border region. Neurosci. Lett. 195, 147–150.
Olavarria, J. F. (1996). Non-mirror-symmetric patterns of callosal linkages in areas 17 and 18 in cat visual cortex. J. Comp. Neurol. 366, 643–655.
Olavarria, J. F. (2001). Callosal connections correlate preferentially with ipsilateral cortical domains in cat areas 17 and 18, and with contralateral domains in the 17/18 transition zone. J. Comp. Neurol. 433, 441–457.
Otsuka, R., and Hassler, R. (1962). Uber Aufbau und Gliederung der corticalen Sehsphäre bei der Katze. Arch. Psychiatr. Z. Gesamte Neurol. 203, 203–212.
Payne, B. (1990a). Function of the corpus callosum in the representation of the visual field in cat visual cortex. Vis. Neurosci. 5, 205–211.
Payne, B. (1990b). Representation of the ipsilateral visual field in the transition zone between areas 17 and 18 of the cat’s cerebral cortex. Vis. Neurosci. 4, 445–474.
Payne, B. (1991). Visual-field map in the transcallosal sending zone of area 17 in the cat. Vis. Neurosci. 7, 201–219.
Payne, B. (1994). Neuronal interactions in cat visual cortex mediated by the corpus callosum. Behav. Brain Res. 64, 55–64.
Payne, B., and Siwek, D. F. (1991). Visual-field map in the callosal recipient zone at the border between areas 17 and 18 in the cat. Vis. Neurosci. 7, 221–236.
Price, D. J. (1985). Pattern of cytochrome oxidase activity in areas 17, 18 and 19 of the visual cortex of cats and kittens. Exp. Brain Res. 58, 125–133.
Rhoades, R. W., and Dellacroce, D. D. (1980). Neonatal enucleation induces an asymmetric pattern of visual callosal connections in hamsters. Brain Res. 202, 189–195.
Rochefort, N. L., Buzas, P., Kisvárday, Z. K., Eysel, U. U., and Milleret, C. (2007). Layout of transcallosal activity in cat visual cortex revealed by optical imaging. Neuroimage 36, 804–821.
Schmidt, K. E., Kim, D. S., Singer, W., Bonhoeffer, T., and Löwel, S. (1997). Functional specificity of long-range intrinsic and interhemispheric connections in the visual cortex of strabismic cats. J. Neurosci. 17, 5480–5492.
Schmued, L. C. (1990). A rapid, sensitive histochemical stain for myelin in frozen brain sections. J. Histochem. Cytochem. 38, 717–720.
Tagawa, Y., Mizuno, H., and Hirano, T. (2008). Activity-dependent development of interhemispheric connections in the visual cortex. Rev. Neurosci. 19, 19–28.
Thouvenin, D. (2004). “Strabisme précoce,” in Strabologie: approches diagnostique et thérapeutique, ed M.-A. Espinasse-Berrod (Atlas en Ophtalmologie, Elsevier), 87–95.
Tusa, R. J., Palmer, L. A., and Rosenquist, A. C. (1978). The retinotopic organisation of area 17 (striate cortex) in the cat. J. Comp. Neurol. 177, 213–236.
Tusa, R. J., Palmer, L. A., and Rosenquist, A. C. (1979). The retinotopic organisation of area 18 and 19 in the cat. J. Comp. Neurol. 185, 657–678.
Vakkur, G. J., Bishop, P. O., and Kozak, W. (1963). Visual optics in the cat, including posterior nodal distance and retinal landmarks. Vision Res. 61, 289–314.
Wong-Riley, M. (1979). Changes in the visual system of monocularly sutured or enucleated cats demonstrated with cytochrome oxidase histochemistry. Brain Res. 171, 11–28.
Worth, C. (1915). Squint: Its Causes, Pathology and Treatment, 4th Edn. London: John Bale and Danielson.
Appendix
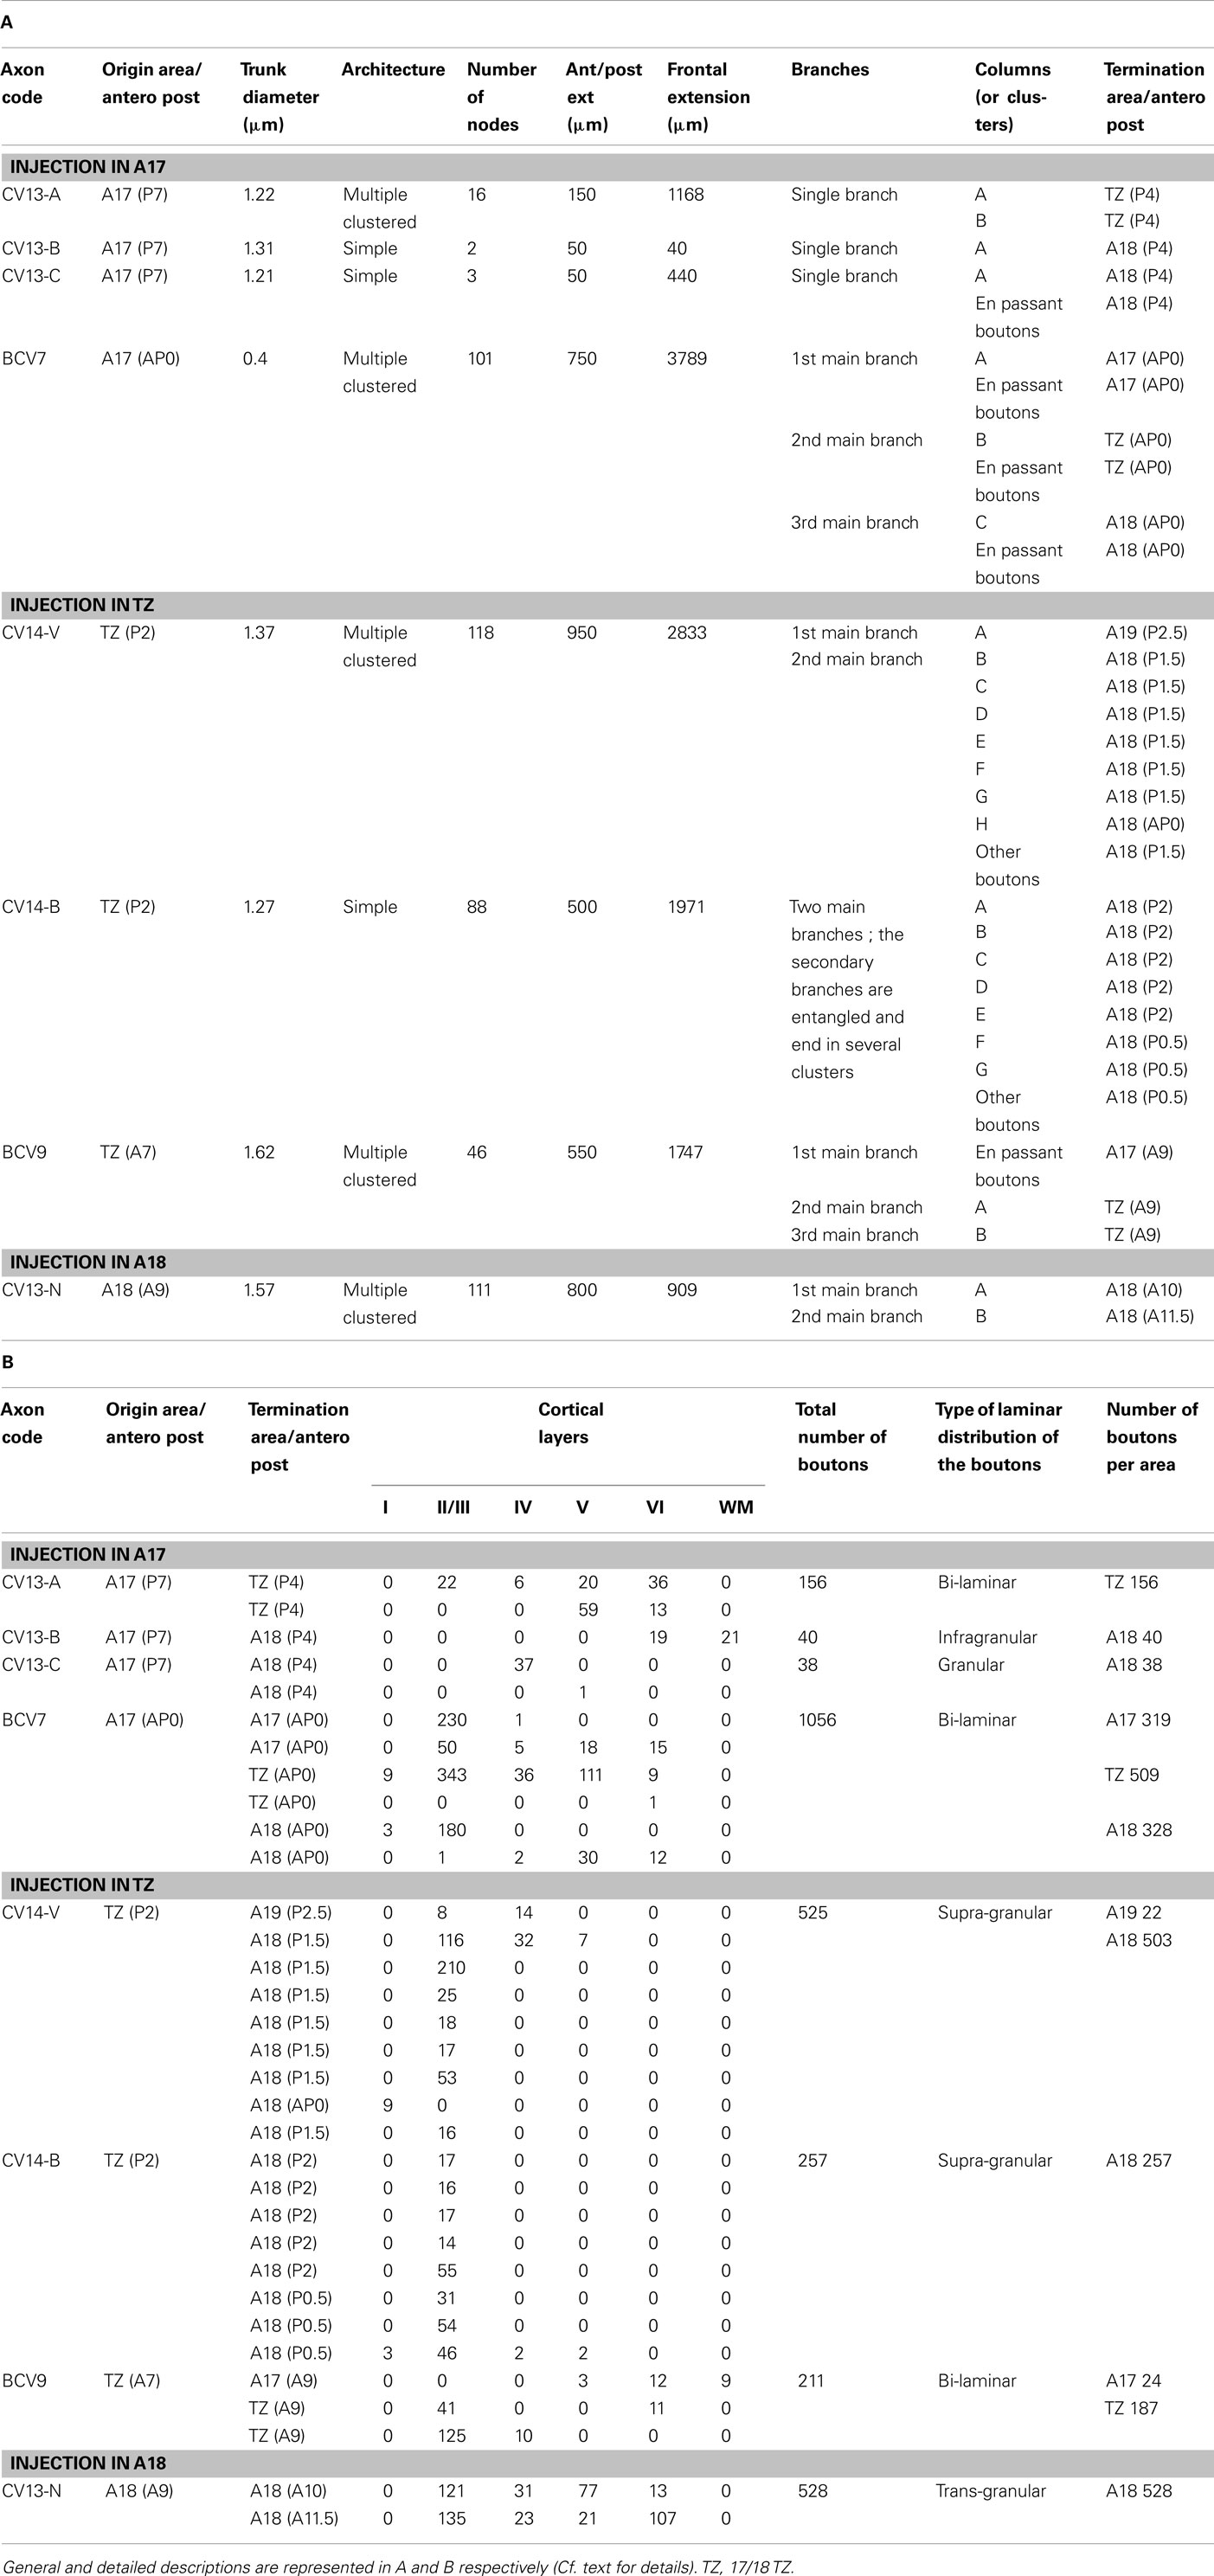
Table A1. Morphological characteristics of each of the eight callosal axons reconstructed in 3D in the CV1 group.
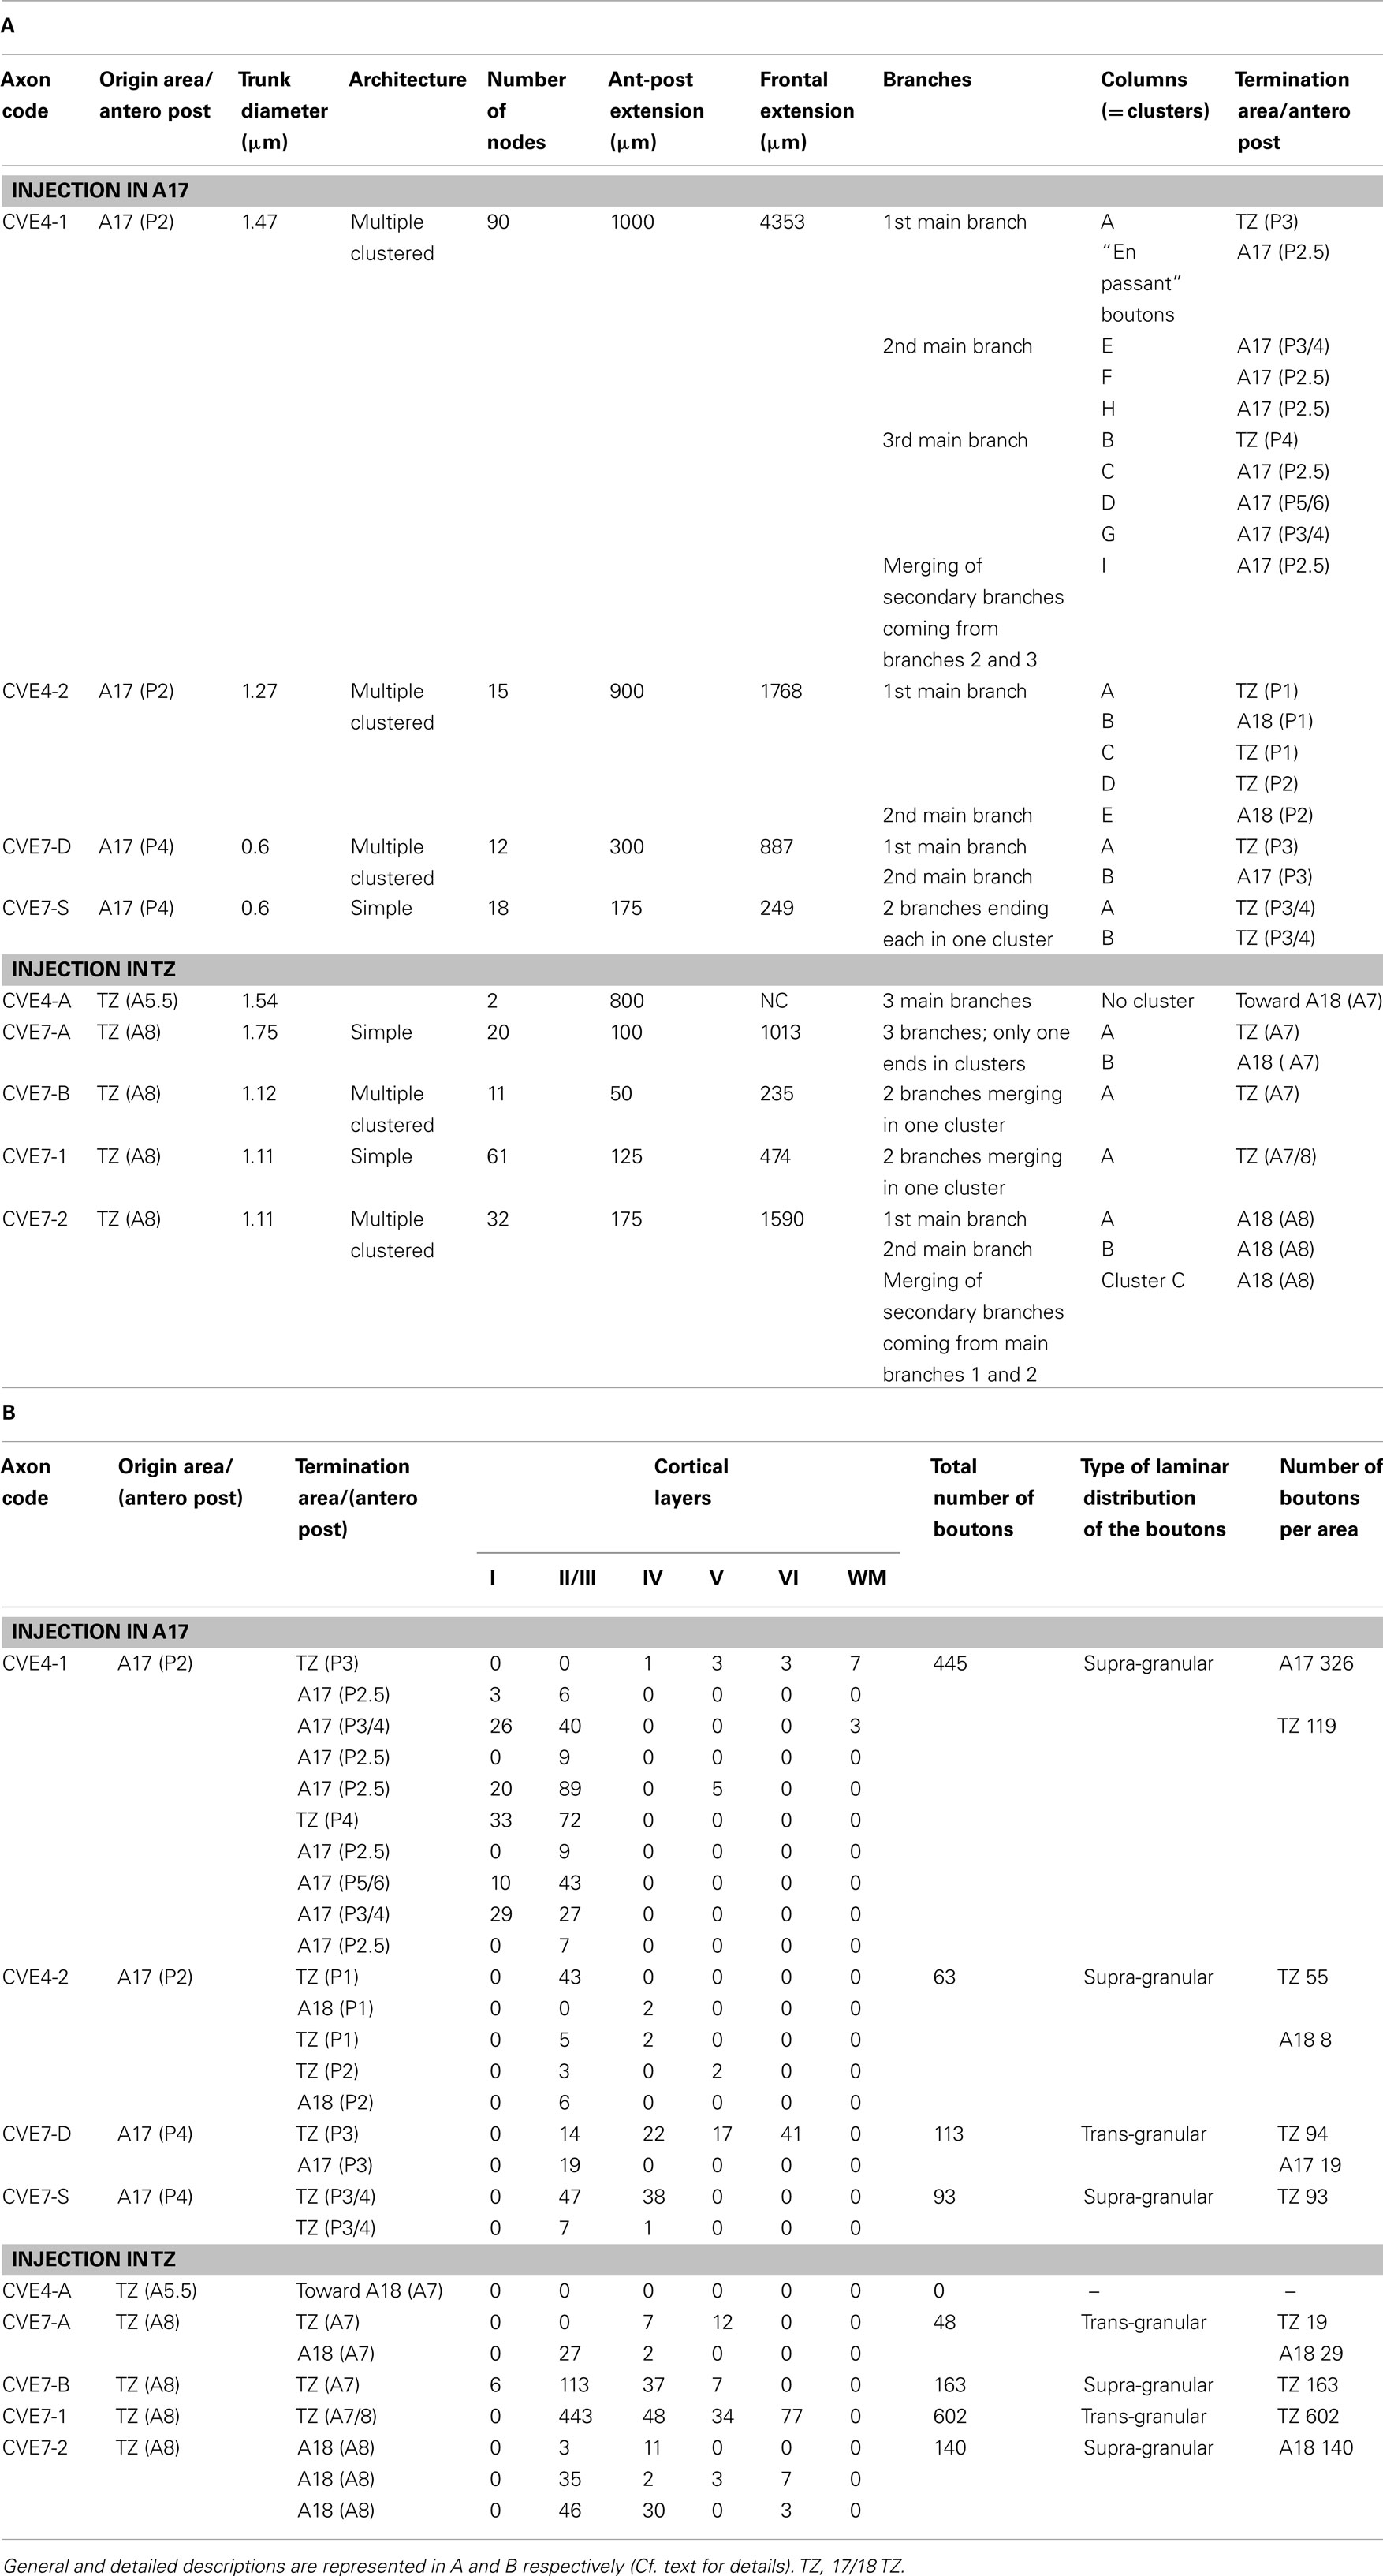
Table A2. Morphological characteristics of each of the nine callosal axons that were reconstructed in 3D in the CV2 group.
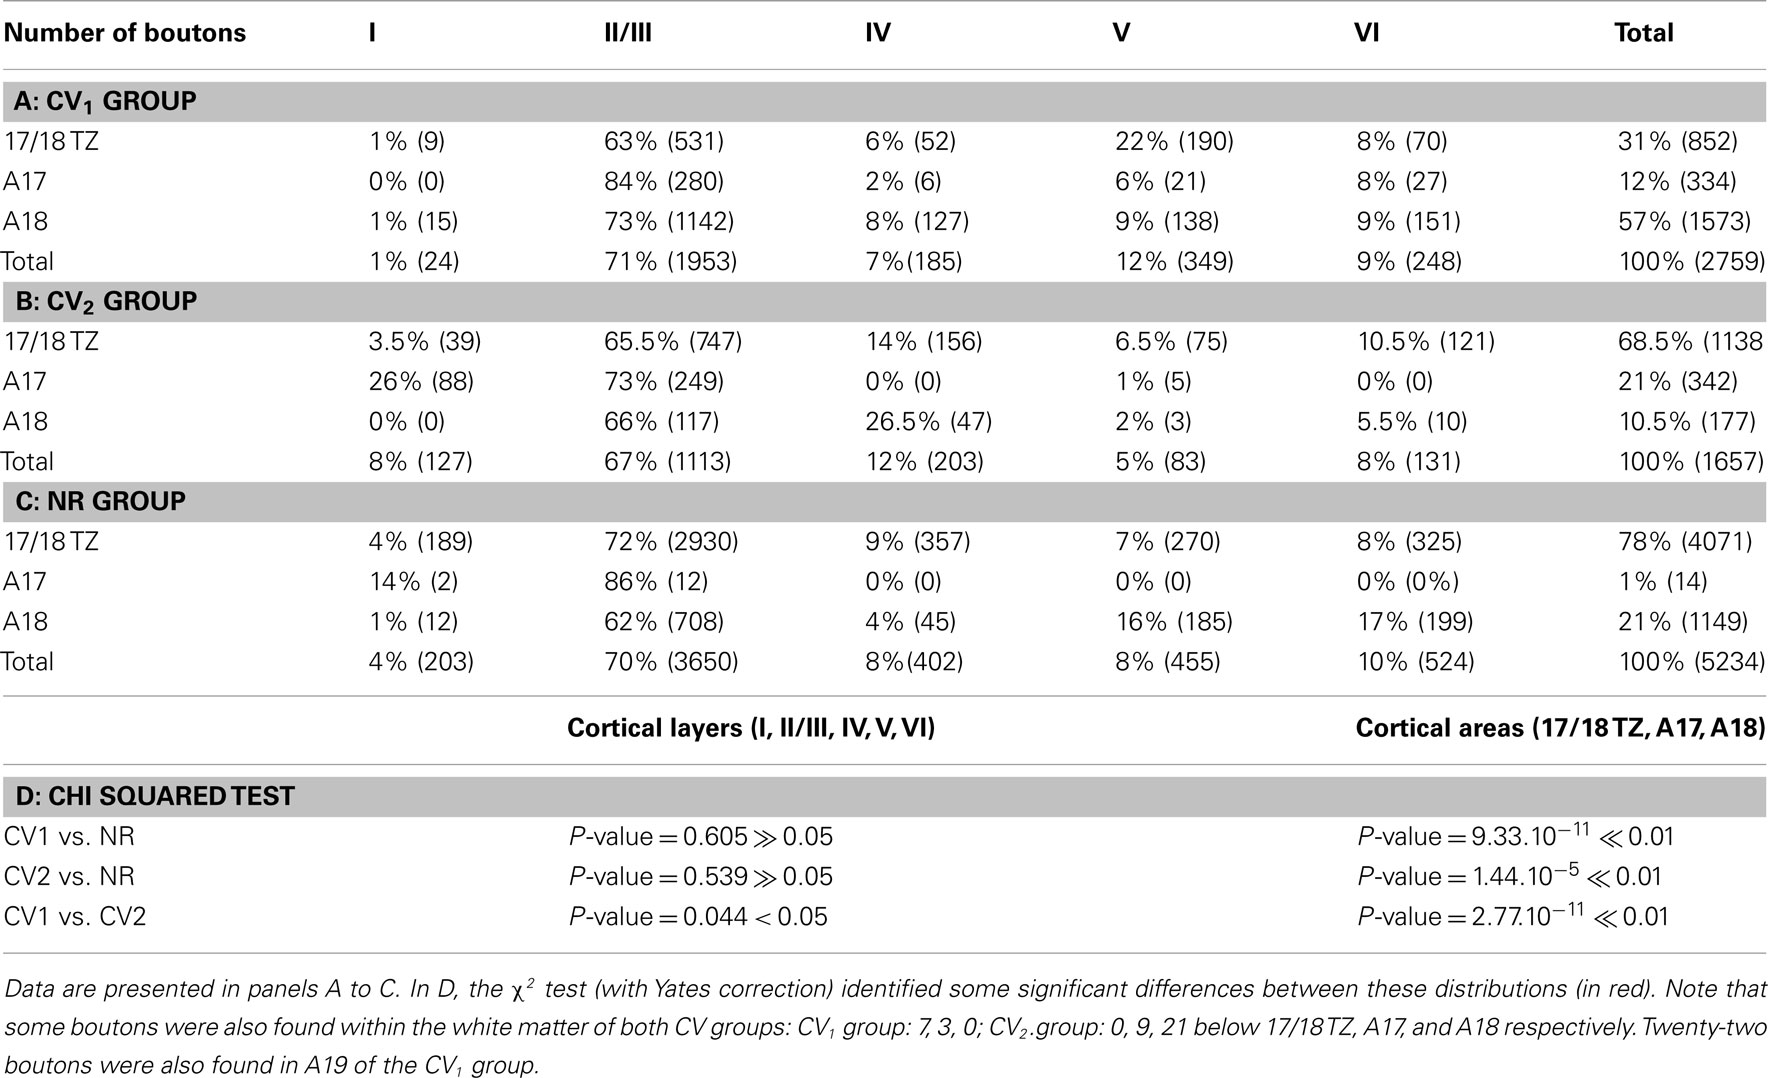
Table A3. Global distributions of the callosal terminal boutons (percentages and numbers) in the CV1, CV2, and NR groups, in cortical areas 17/18 TZ, A17, and A18, and among the cortical layers (I–VI).
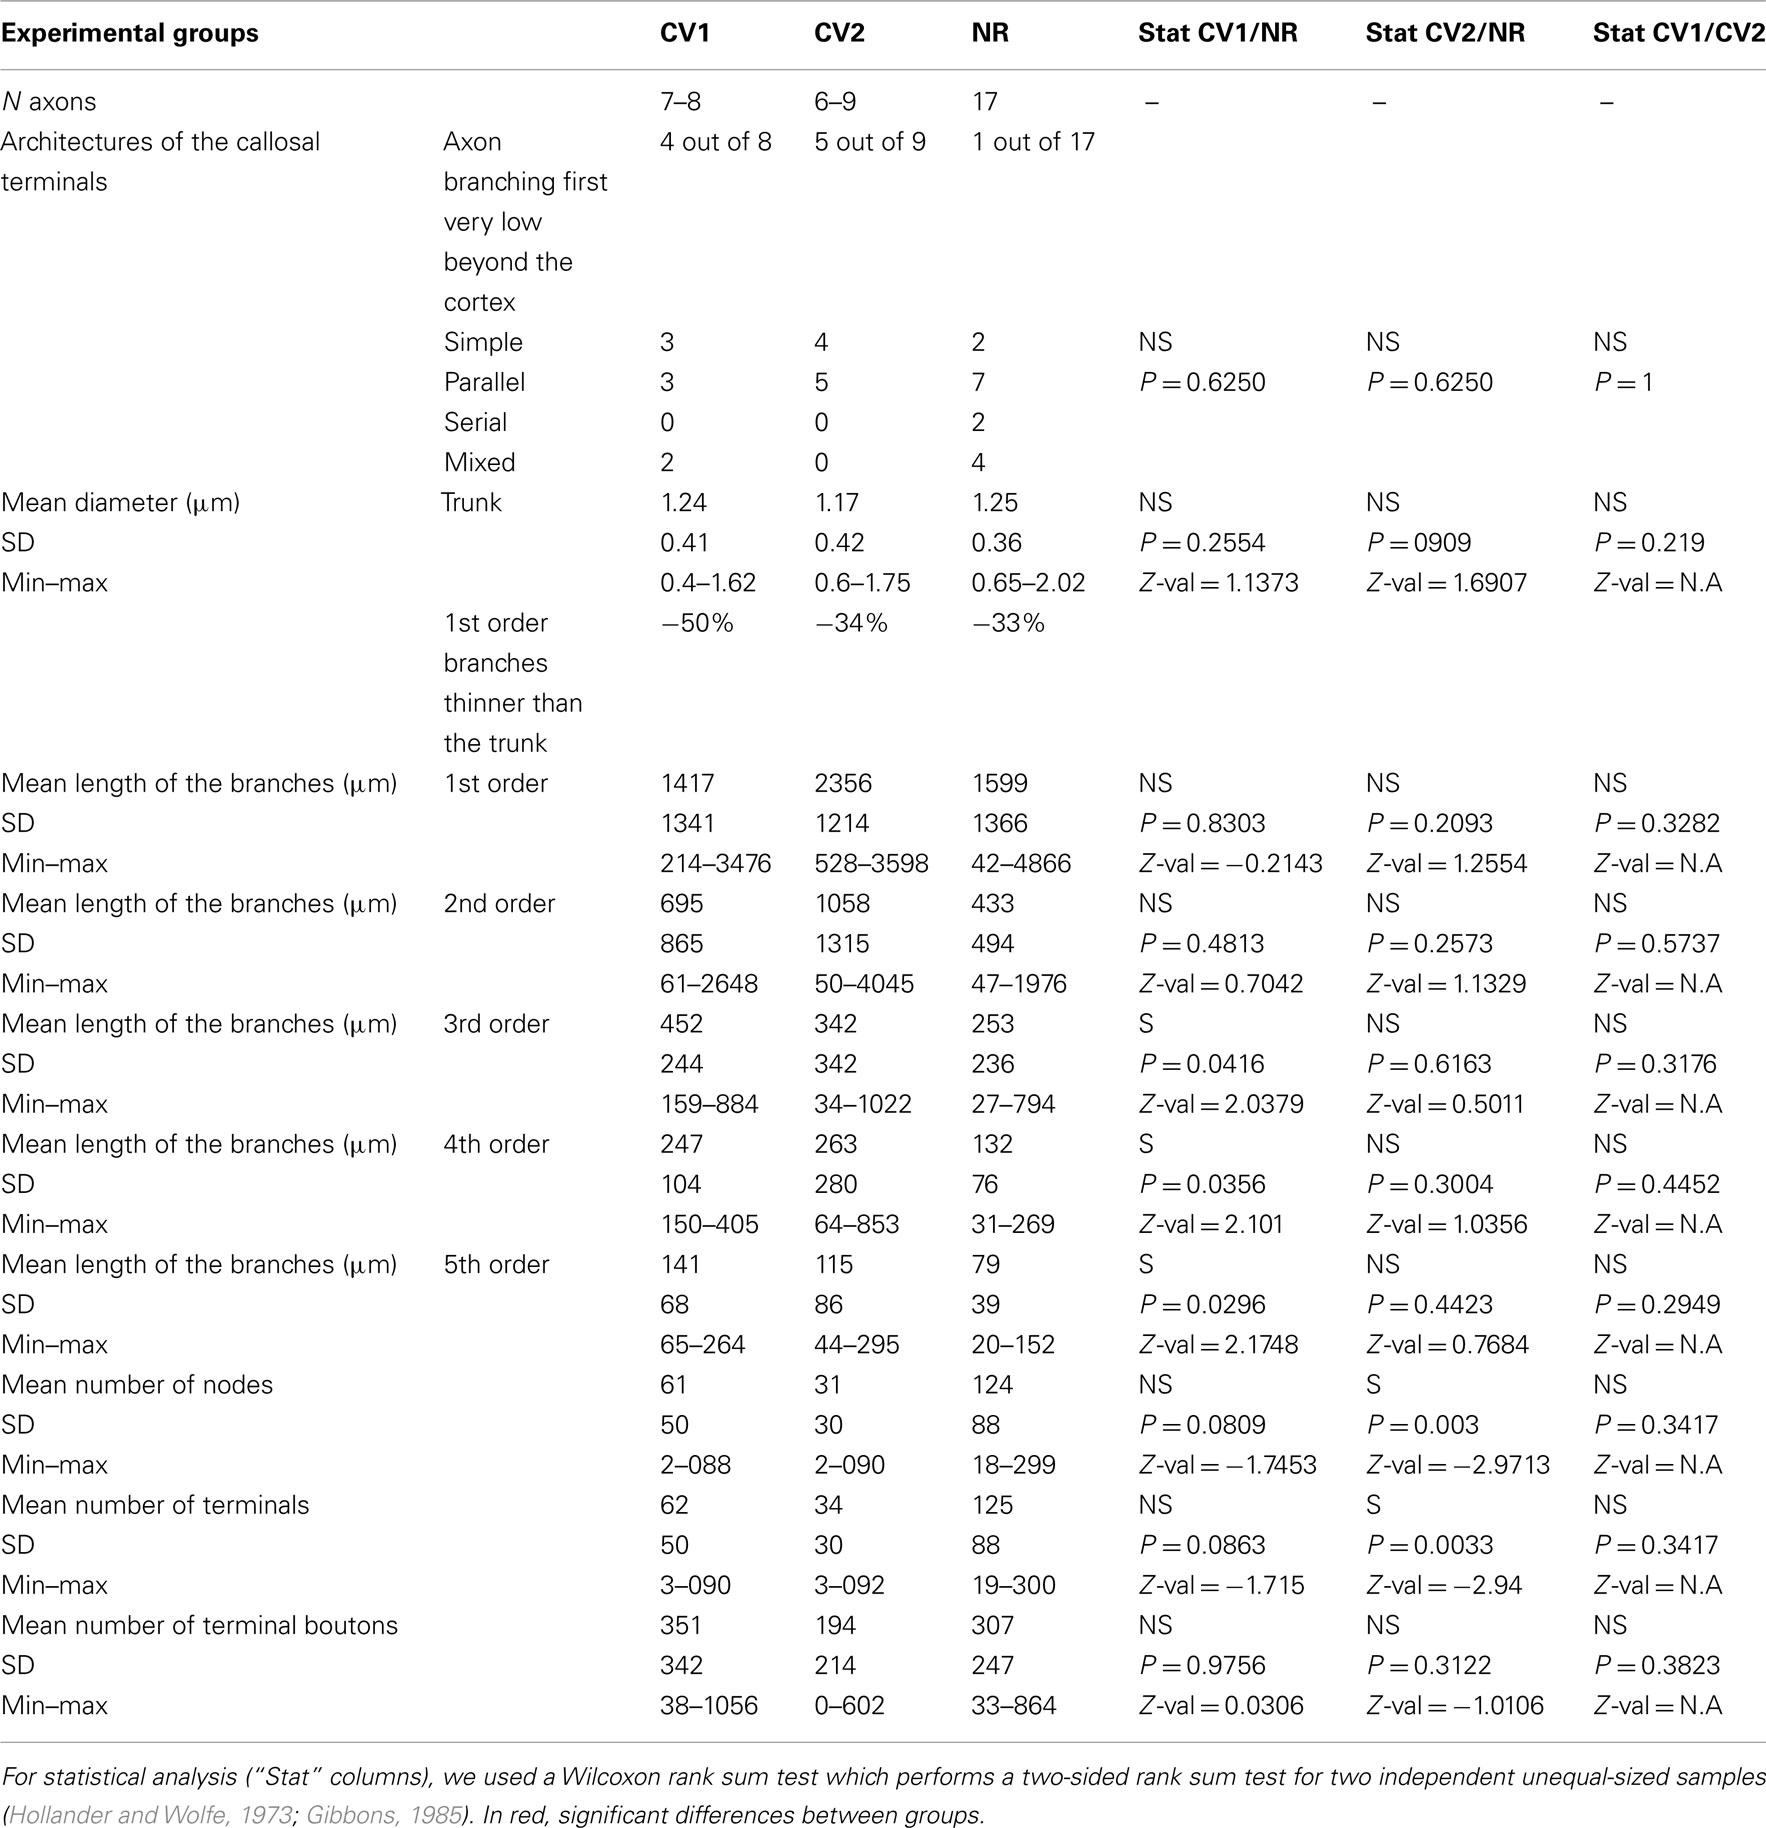
Table A4. Quantitative analysis of the callosal terminal arbors in the CV1, CV2, and NR groups.
Keywords: strabismus, visual interhemispheric integration, cerebral asymmetry, higher mammals
Citation: Bui Quoc E, Ribot J, Quenech’Du N, Doutremer S, Lebas N, Grantyn A, Aushana Y and Milleret C (2012) Asymmetrical interhemispheric connections develop in cat visual cortex after early unilateral convergent strabismus: anatomy, physiology, and mechanisms. Front. Neuroanat. 5:68. doi: 10.3389/fnana.2011.00068
Received: 19 September 2011; Paper pending published: 11 October 2011;
Accepted: 19 December 2011; Published online: 11 January 2012.
Edited by:
Zoltan F. Kisvarday, University of Debrecen, HungaryReviewed by:
Alino Martinez-Marcos, Universidad de Castilla, SpainZoltan F. Kisvarday, University of Debrecen, Hungary
Copyright: © 2012 Bui Quoc, Ribot, Quenech’Du, Doutremer, Lebas, Grantyn, Aushana and Milleret. This is an open-access article distributed under the terms of the Creative Commons Attribution Non Commercial License, which permits non-commercial use, distribution, and reproduction in other forums, provided the original authors and source are credited.
*Correspondence: Chantal Milleret, Laboratoire de Physiologie de la Perception et de l’Action, Collège de France, CNRS UMR 7152, 11 Place Marcelin Berthelot, 75005 Paris, France. e-mail: chantal.milleret@college-de-france.fr
†Emmanuel Bui Quoc and Jérôme Ribot have contributed equally to this work.