Mixed electrical–chemical synapses in adult rat hippocampus are primarily glutamatergic and coupled by connexin-36
- 1 Department of Neurosurgery, Mount Sinai School of Medicine, New York, NY, USA
- 2 Program in Neural and Behavioral Science, Downstate Medical Center, State University of New York, Brooklyn, NY, USA
- 3 Fishberg Department of Neuroscience, Friedman Brain Institute, Mount Sinai School of Medicine, New York, NY, USA
- 4 Department of Biomedical Sciences, Colorado State University, Fort Collins, CO, USA
- 5 Department of Physiology and Pharmacology, Downstate Medical Center, State University of New York, Brooklyn, NY, USA
- 6 Department of Pharmacobiology, Centro de Investigación y Estudios Avanzados del Instituto Politécnico Nacional, México D.F.
- 7 Centre for Molecular Biology and Neuroscience, University of Oslo, Oslo, Norway
- 8 Program in Molecular, Cellular, and Integrative Neurosciences, Colorado State University, Fort Collins, CO, USA
Dendrodendritic electrical signaling via gap junctions is now an accepted feature of neuronal communication in mammalian brain, whereas axodendritic and axosomatic gap junctions have rarely been described. We present ultrastructural, immunocytochemical, and dye-coupling evidence for “mixed” (electrical/chemical) synapses on both principal cells and interneurons in adult rat hippocampus. Thin-section electron microscopic images of small gap junction-like appositions were found at mossy fiber (MF) terminals on thorny excrescences of CA3 pyramidal neurons (CA3pyr), apparently forming glutamatergic mixed synapses. Lucifer Yellow injected into weakly fixed CA3pyr was detected in MF axons that contacted four injected CA3pyr, supporting gap junction-mediated coupling between those two types of principal cells. Freeze-fracture replica immunogold labeling revealed diverse sizes and morphologies of connexin-36-containing gap junctions throughout hippocampus. Of 20 immunogold-labeled gap junctions, seven were large (328–1140 connexons), three of which were consistent with electrical synapses between interneurons; but nine were at axon terminal synapses, three of which were immediately adjacent to distinctive glutamate receptor-containing postsynaptic densities, forming mixed glutamatergic synapses. Four others were adjacent to small clusters of immunogold-labeled 10-nm E-face intramembrane particles, apparently representing extrasynaptic glutamate receptor particles. Gap junctions also were on spines in stratum lucidum, stratum oriens, dentate gyrus, and hilus, on both interneurons and unidentified neurons. In addition, one putative GABAergic mixed synapse was found in thin-section images of a CA3pyr, but none were found by immunogold labeling, suggesting the rarity of GABAergic mixed synapses. Cx36-containing gap junctions throughout hippocampus suggest the possibility of reciprocal modulation of electrical and chemical signals in diverse hippocampal neurons.
Introduction
Electrical synaptic transmission and the ultrastructural correlate of electrical synapses – gap junctions – are now accepted features of neuronal circuitry in many areas of the mammalian central nervous system (CNS; Bennett and Zukin, 2004; Hormuzdi et al., 2004). In the hippocampus, gap junctions and electrical communication between dendrites of interneurons are well-documented ultrastructurally and electrophysiologically (Kosaka, 1983; Fukuda and Kosaka, 2000; Haas et al., 2011). Because gap junction channels also allow direct intercellular passage of small molecules, early observations of cell-to-cell passage of fluorescent dyes (“dye-coupling”) between hippocampal pyramidal cells was taken as evidence of electrical synapses between these cells (MacVicar and Dudek, 1980, 1982). Based on electrical coupling, dye- and tracer-coupling, and computer modeling, electrical synapses were proposed to occur between the axons of hippocampal pyramidal cells, particularly near their somata (Schmitz et al., 2001). Paired recordings from a large number of hippocampal pyramidal cells provided further electrophysiological support for electrical coupling between these cells (Yamamoto, 1972; Mercer et al., 2006). However, proof of electrical coupling via glutamatergic mixed synapses between hippocampal principal cells – dentate granule cells (DG) and pyramidal cells – as well as between glutamatergic interneurons, is lacking. Recently, however, evidence for mixed electrical–chemical synaptic transmission from mossy fibers (MFs) to CA3 pyramidal cells (CA3pyr) has been presented (Vivar et al., 2012). On the other hand, although electrical coupling and connexin-36 (Cx36)-containing gap junctions have been demonstrated between interneuronal dendrites in other regions of neocortex and olfactory bulb (Rash et al., 2005; Fukuda et al., 2006), neither electrical coupling nor the connexin composition of neuronal gap junctions has been adequately examined in hippocampus between MF terminals and CA3pyr, between glutamatergic interneurons, between glutamatergic interneurons and principal cells, or between granule cells and their innervating axons of the perforant path. This pathway, which arises from the entorhinal cortex, forms the major input to the DG, which receives no extrinsic inputs from other cortical structures (Do et al., 2002). In addition to innervating the DG, neurons of the perforant path also innervate CA3pyr on their proximal and distal dendrites (Do et al., 2002), as well as the dendrites of interneurons within the hilus (Acsady et al., 1998), providing additional potential sources of glutamatergic mixed synapses in the hippocampus. In addition, hilar mossy cells (Jackson and Scharfman, 1996) and putative glutamatergic interneurons (Soriano and Frotscher, 1993) synapse on CA3pyr, on granule cells, and on mossy cell dendrites in stratum oriens (pathways summarized in Kondo et al., 2008). Finally, because evidence indicates that CA3pyr synthesize Cx36 (Belluardo et al., 2000), and therefore presumably form gap junctions, local recurrent collaterals of CA3pyr may provide additional sources of glutamatergic mixed synapses.
Four major difficulties in understanding proposed functional contributions of electrical vs. mixed synapses between hippocampal principal cells or between interneurons and other neurons are: (1) the lack of ultrastructural evidence for gap junctions between most of those neurons, (2) the uncertainty regarding the sizes and anatomical locations at which gap junctions might occur, (3) lack of evidence for the connexin composition of the gap junctions, and (4) lack of identification of the neurotransmitter(s) that might be involved at mixed synapses. Despite extensive analysis, thin-section transmission electron microscopic (tsTEM) studies that have described many dozens of large (0.2–0.6 μm diameter) dendrodendritic gap junctions between interneurons in the rat hippocampus (Kosaka, 1983; Kosaka and Hama, 1985; Fukuda and Kosaka, 2000) did not detect gap junctions on principal cells or at axon terminals, potentially because: (a) axodendritic and axosomatic gap junctions between hippocampal neurons may be smaller and more difficult to detect in conventional thin-section images (Rash et al., 1998); (b) the number and distribution of gap junctions may vary considerably in different regions of hippocampus or in different rodent species; or (c) gap junctions may occur at locations other than between the apposed dendrites that were the specific targets of previous studies. With CNS tissues having small intercellular spaces (i.e., ca. 10 nm vs. the 20-nm space found in most other chemically fixed, plastic-embedded, thin-sectioned tissues reviewed in Staehelin, 1974), recognizing small gap junctions in tsTEM images of hippocampus may be especially problematic (Rash et al., 1998). Although electrophysiological recordings from DG and CA3pyr suggest the existence of glutamatergic mixed synapses between MFs and their principal cell targets (Vivar et al., 2012), no ultrastructural evidence has been published for gap junctions between MF terminals and their primary targets on dendritic shafts or spines of CA3pyr. Likewise, neither electrical coupling nor gap junctions have been demonstrated between the glutamatergic axon terminals of the perforant path synapsing on granule cells, CA3pyr, or interneurons, or between interneurons and principal cells or other interneurons. Thus, deciphering the nature of the gap junctions, the types of neurons they connect, and the cellular sites at which these connections are established are critical steps in understanding hippocampal physiology. Indeed, electrical coupling between hippocampal neurons has been proposed for generating gamma (30–80 Hz) and very fast (>80 Hz) oscillations (Traub et al., 2001, 2010) and is also thought to contribute to epileptogenesis (Traub et al., 2001).
The functional importance of neuronal gap junctions at mixed synapses has been extensively documented in lower vertebrates, particularly at the glutamatergic giant club-ending terminals on Mauthner cells in the teleost brain (Pereda et al., 2003). Each of those giant synapses contains 80–200 small to large gap junctions (30–4000 connexons each), intermixed with clusters of 10-nm intramembrane particles (IMPs) on their postsynaptic extraplasmic leaflets (E-faces; Tuttle et al., 1986; Nakajima et al., 1987) that were later shown by freeze-fracture replica immunogold labeling (FRIL) to contain N-methyl-D-aspartate (NMDA) glutamate receptors (Pereda et al., 2003). Intracellular monitoring of those giant mixed synapses documented that a large electrical “spikelet” (or “fast prepotential”) immediately precedes the excitatory postsynaptic potential (Pereda et al., 2003, 2004), thereby revealing the electrophysiological signature of these giant excitatory mixed synapses. However, the smaller and fewer gap junctions found to date on mammalian principal neurons (Rash et al., 2005, 2007) suggest that detection of fast prepotentials will be difficult in hippocampus (Dudek et al., 2010; but see Mercer et al., 2006; Vivar et al., 2012), and indeed, that the function of gap junctions at mammalian mixed synapses may be other than for strong electrical coupling.
This reports presents: (a) tsTEM evidence for gap junctions between glutamatergic MF axon terminals at thorny excrescences of CA3pyr dendrites in adult rat hippocampus, and (b) evidence for limited dye-coupling between CA3pyr somata and dendrites and their closely apposed MF axons. This report also provides: (c) FRIL evidence that connexin-36 (Cx36) is the primary connexin in ultrastructurally identified gap junctions between neurons at diverse locations in hippocampus; (d) that rather than “plaques,” many were unusual “reticular” gap junctions, and (e) that most of the gap junctions occurred immediately adjacent either to glutamate receptor-containing postsynaptic densities (PSDs) and/or to distinctive clusters of 10-nm E-face IMPs within the same axonal contact area, defining most as either glutamatergic mixed synapses or as gap junctions that are closely associated with “extrasynaptic” AMPA (α-amino-3-hydroxy-5-methyl-4-isoxazolepropionic acid) glutamate receptors. Finally, although one presumptive GABAergic mixed synapse was found by tsTEM on a CA3pyr dendrite, 10 of 20 gap junctions found by FRIL were at ultrastructurally or immunocytochemically identified glutamatergic mixed synapses, and three were at likely dendrodendritic electrical synapses, but none were at ultrastructurally identified GABAergic synapses in FRIL replicas, suggesting that glutamatergic mixed synapses are much more abundant than GABAergic mixed synapses, and possibly more abundant than dendrodendritic electrical synapses. Regardless, the functional significance of “miniature” gap junctions at glutamatergic mixed synapses is yet to be determined.
Materials and Methods
All animals used in this study were treated under the protocols approved by the Institutional Animal Care and Use Committees of the State University of New York, Downstate Medical Center, Mount Sinai School of Medicine; Colorado State University; and the Center for Research and Advanced Studies, Mexico City. All experiments were conducted according to Principles of Laboratory Animal Care (U.S. National Institutes of Health Publication No. 86-23, 1985). Chemical agents were purchased from Sigma (Sigma Aldrich, St. Louis, MO, USA) unless separately indicated.
Fluorescent Dye Injection and Confocal Microscopic Imaging
For morphological reconstructions, 20 Sprague-Dawley rats (3-6 month old) were deeply anesthetized by intraperitoneal injection of a 30% solution of chloral hydrate (400 mg/kg) in distilled water and fixed by whole-body perfusion for 1 min via the ascending aorta using cold 1% formaldehyde dissolved in PBS. Secondary fixation was by perfusion with cold 4% formaldehyde plus 0.125% glutaraldehyde in PBS for 12 min. Brains were removed from the skull and post-fixed for 4–6 h in 4% formaldehyde at 4°C. Brains were transferred to PBS, and transverse slices from temporal hippocampus were immediately cut using a VT1000 vibrating-blade microtome (Leica Microsystems, Bannockburn, IL, USA) and placed in PBS for up to 4 days, pending dye injection. Under visual inspection, Lucifer Yellow (LY; mw = 457; Molecular Probes, Eugene, OR, USA) was iontophoretically injected into the weakly fixed CA3pyr neurons using sharp electrodes, according to our published methods (Rodriguez et al., 2003). Detailed methods for imaging and confocal reconstruction are also described elsewhere (Rodriguez et al., 2006, 2008). These samples for 3-D morphological analysis were secondarily found to be useful for analysis of dye-coupling, as shown in this report.
Thin-Section Transmission Electron Microscopy
Ten adult Sprague-Dawley rats (age 6 weeks to 6 months) were deeply anesthetized by intraperitoneal injection of 0.3–0.5 ml of 30% chloral hydrate in distilled water and perfused with warm 1% formaldehyde prepared from freshly depolymerized paraformaldehyde in 2 mM CaCl2, 4 mM MgSO4, and 0.1 M sodium cacodylate buffer (pH 7.25, 38°C). After 1 min, the fixative was switched to 38°C 2.5% formaldehyde and 3% glutaraldehyde in the same buffer for 12 min. The CA3 region was cut from six brain slices, post-fixed with 2% OsO4 in phosphate buffered saline (PBS, 4°C) for 2 h in the dark, washed in sodium acetate buffer, and stained en bloc with aqueous unbuffered 0.5% uranyl acetate at 10°C for 2 h in the dark (modified from Rash and Fambrough, 1973). After washing, tissue slices were dehydrated in ethanol, then propylene oxide, infiltrated with Araldite-Epon plus 1.5% DMP-30 catalyst (Araldite 502/EMbed 812 Kit, Electron Microscopy Sciences, Hatfield, PA, USA), and polymerized at 60°C for 48 h. A series of 50 ultrathin sections (50–90 nm thickness) were cut using a Reichert Ultracut E ultramicrotome (Reichert-Jung, Nussloch, Germany), mounted on Formvar-coated slot grids (Electron Microscopy Sciences, Hatfield, PA, USA) and stained for 45 min with aqueous unbuffered 1% uranyl acetate and 3 min with Reynolds’ lead citrate (procedure modified from Friedrich and Mugnaini, 1981). Approximately 45,000 μm2 of stratum lucidum were examined at 20,000–30,000× magnification at 80 kV in a JEOL 1200EX electron microscope (JEOL USA, Peabody, MA, USA) and photographed using a 2000 × 2000-pixel Advantage CCD camera (Advanced Microscopy Techniques, Danvers, MA, USA). Images were processed using Adobe Photoshop CS2 (Adobe Systems, San Jose, CA, USA), with “Levels” used for maximal contrast expansion, and both “Levels” and “Brightness/Contrast” used to optimize image contrast and definition over large areas within individual images (i.e., equivalent to wide area “dodging”). In montages, composite photographs were matched using contrast and brightness over each entire image component.
FRIL Transmission Electron Microscopy
Six male Sprague-Dawley rats (147–479 g) were deeply anesthetized by intraperitoneal injections of ketamine and xylazine (120–160 and 12–16 mg/kg, respectively) and fixed by whole-body vascular perfusion with 2 or 4% formaldehyde in Sørensen’s phosphate buffer according to our published methods (Hudson et al., 1981; Rash et al., 2005). Coronal and horizontal slices of hippocampus were cut at 100 μm thickness using a refrigerated Lancer Vibratome 3000 (now sold by Leica Microsystems, Inc., Buffalo Grove, IL, USA) that maintained samples at 4°C during slicing (to minimize lipid leaching and the formation of IMP-free lipid blebs; Shelton and Mowczko, 1979). Unfixed hippocampal samples for labeling NR1 and AMPA glutamate receptors (but not gap junctions) were obtained from one adult male Sprague-Dawley rat (585 g) that was anesthetized and decapitated. The brain was quickly removed, the hippocampus was dissected free, chilled to 4°C, 200 μm-thick slices were obtained using a McIlwain Tissue Chopper (Stoelting Co, Wood Dale, IL, USA), the slices were placed in 34°C tissue culture medium, placed on aluminum freezing supports, and ultrarapidly frozen using a Gentleman Jim metal-mirror freezer (Phillips and Boyne, 1984).
Freeze-fracture replicas were made according to our published methods (Rash and Yasumura, 1999). Immediately after fracturing, the samples were pre-coated with a nominal 1–1.5-nm of carbon (i.e., 6–10 atoms thick), which acts as a “wetting agent” for the subsequent coat of ca. 1.5 nm of platinum (Furman et al., 2003). This carbon “tinning” pre-coat provides for improved resolution. However, if the carbon pre-coat is too thin and discontinuous, immunogold labeling efficiency (LE) is reduced, as described and illustrated below, whereas if too thick, replica resolution is reduced, also as described below. After platinum shadowing, a second, 10–20 nm thick coat of “backing” carbon was applied to complete the replica film. The replicated but still frozen samples were bonded to a gold “index” grid using 2.5% Lexan (polycarbonate plastic) dissolved in dichloroethane; the solvent was evaporated at −30°C; and the Lexan-stabilized replicas were thawed and photomapped with a Zeiss LSM510 META laser scanning confocal microscope (Rash et al., 1995, 1997), then washed 29 h at 48.5°C in 2.5% SDS detergent in 0.16% Tris–HCl buffer (pH 8.9; Rash and Yasumura, 1999, as modified in Kamasawa et al., 2006). To minimize re-deposition of glutamate receptors that are dissolved from the bulk tissue slice, with consequent detection as a major source of background “noise” (Rash and Yasumura, 1999), samples were washed in multiple successive wells of SDS detergent.
After rinsing, one replica was single-labeled with rabbit polyclonal antibody to Cx36 (Ab298; characterized in Rash et al., 2000, and further characterized in Pereda et al., 2003; seven gap junctions found; H1–H7; see Table 1); and one replica was triple-labeled for Cx36 (Ab298) and mouse monoclonal antibodies to Cx45 (courtesy of Steven Coppen; as characterized in Coppen et al., 2003) and NMDA receptor subunit NR1 (NR1; Pharmingen #60021a; now BDBiosciences, San Jose, CA, USA; catalog # #556308; nine neuronal gap junctions found; H8–14, H21, and H22). (No gap junctions labeled for Cx45 were detected, but the apparent absence of Cx45 labeling using this one antibody was not considered sufficiently definitive to conclude absence vs. relatively low abundance of that connexin in hippocampal tissues.) To address then-current controversies regarding whether Cx32 might represent a neuronal connexin (Alvarez-Maubecin et al., 2000; Colwell, 2000) vs. a glial connexin (Rash et al., 2001), one replica was double-labeled for Cx36 + Cx32 [rabbit polyclonal Cx36 ab 36-4600, Invitrogen/Zymed Laboratories; now Life Technologies, Grand Island, NY, USA; and anti-Cx32 monoclonal antibody MAB3069, Chemicon; now EMD Millipore, Temecula, CA, USA; two Cx36-labeled neuronal gap junctions found (H17 and H18), plus >20 Cx32-labeled oligodendrocyte gap junctions (not shown here, but relevant data and images were previously shown in Kamasawa et al., 2005), thereby demonstrating the efficacy of the anti-Cx32 labels and providing further evidence that Cx32 is present solely in oligodendrocyte gap junctions and is not present in neuronal gap junctions (Rash et al., 2001; Nagy et al., 2004)]. One sample was double-labeled or Cx36 (#51-6300; Invitrogen; now Life Technologies) plus GluR2 AMPA glutamate receptors (MAB397, Chemicon; now EMD Millipore; gap junction H20). Three samples were double-labeled for both NMDA-R1 and for AMPA glutamate receptors (“pan-AMPA” anti-GluR1-4; courtesy of Elek Molnar, University of Bristol, Bristol, UK), to identify the fraction of E-face PSD clusters that contain glutamate receptors and to determine if NMDA and AMPA subunits are co-localized within individual PSDs. Finally, one replica was double-labeled for Cx36 (Invitrogen/Life Technologies #37-4600) plus “Cx35/Cx36” (“phospho 276” antibody; courtesy of John O’Brien; University of Texas Houston Medical School; H19). (Cx35 is the fish ortholog of Cx36, and these two antibodies were made to two different shared but non-overlapping amino acid sequences of Cx35 and Cx36; O’Brien et al., 2004, 2006). Double-labeling for Cx35 and for Cx36 was used as an internal control to document the specificity of FRIL labeling of connexins within the same gap junction hemiplaque. Two gap junctions on unidentified membrane fragments (probable astrocyte fingers) that had partially overlapping clumps of gold beads for Cx36 were designated as “false positive labeling” or “noise” (Rash and Yasumura, 1999; H15, H16) and, hence, were excluded from this analysis. All primary antibodies were diluted to 10 μg/ml.
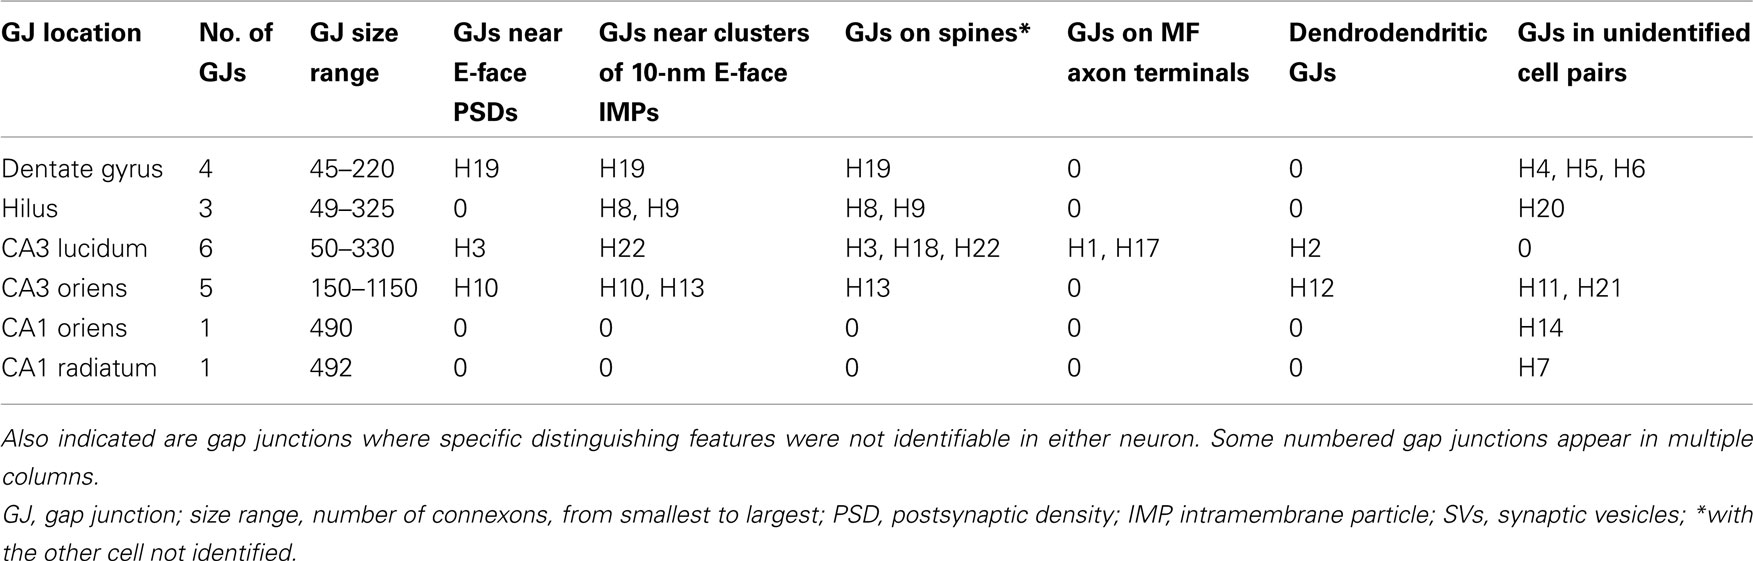
Table 1. Twenty numbered anti-Cx36-immunogold-labeled and grid-mapped gap junctions in adult rat hippocampus, with their anatomical locations, size ranges (number of connexons, if countable), and their associations with labeled and unlabeled glutamate receptor PSDs (as tight patches of 10-nm E-face IMPs) vs. dispersed 10-nm E-face IMPs that are thought to represent extrasynaptic or “reserve” receptors.
After primary labeling, replicas were rinsed and counter-labeled for 17 h using various combinations of goat anti-rabbit immunoglobulin-G (IgG) conjugated to 6-nm and/or 18-nm gold beads (Jackson ImmunoResearch Laboratories, Inc., West Grove, PA, USA) and goat anti-mouse IgG, conjugated to 12-nm gold beads (Jackson ImmunoResearch), according to our detailed methods (Kamasawa et al., 2006). Samples double-labeled for NR1 and pan-AMPA were labeled with 10 and 20-nm gold, respectively (both from Chemicon International Inc., as reported in Rash et al., 2005; Chemicon antibodies now available from EMD Millipore).
After labeling and rinsing but before TEM viewing, the immunogold-labeled samples were coated a third time with 20–30 nm of carbon on the labeled side to: (a) surround and immobilize gold beads, (b) anneal thermal-expansion cracks in the replica prior to removal of the Lexan support film, thereby helping to maintain replica integrity, and (c) prevent displacement of the replicas with respect to the grid during subsequent removal of the Lexan support film. The Lexan support film was then removed by immersing the grids in 60°C dichloroethane for 10–18 h. FRIL samples were examined at 100 kV in a JEOL 2000 EX-II TEM (JEOL, USA). Stereoscopic images obtained with an 8° included angle were used for: (a) assessing complex 3-D membrane topography, (b) confirming that each immunogold bead was on the tissue-side of the replica (Rash and Yasumura, 1999), and (c) discriminating the smaller (6-nm) gold beads from the similarly electron-opaque platinum caps on 5- to 10-nm IMPs (Pereda et al., 2003; Rash et al., 2004). Every immunogold-labeled gap junction found by FRIL was examined at multiple tilts, and where needed, at multiple rotations (i.e., to obtain optimum views of important features, such as PSDs and interiors of spines). Freeze-fractured neuronal and glial processes were identified according to our published criteria (Rash et al., 1997, 2004). FRIL TEM negatives were digitized by an ArtixScan 2500f digital scanner (Microtek; Santa Fe Springs, CA, USA) and processed using Adobe Photoshop CS2 (Adobe Systems, San Jose, CA, USA), with “Levels” used for maximal contrast expansion, and “Brightness/Contrast” used to optimize image contrast and definition.
Labeling Efficiency, Signal-to-Noise Ratio, and Confidence in IMP Labeling
Factors affecting LE
As noted in our previous reports (Pereda et al., 2003; Nagy et al., 2004; Ciolofan et al., 2006; Kamasawa et al., 2006), two or even three sizes of gold labels for a single connexin provide internal controls for assessing labeling specificity of the primary antibody, as well as for assessing LE of each size of immunogold-conjugated secondary antibody. Likewise, using two different primary connexin antibodies (each with a different size of gold-tagged secondary antibody) allows determination of different LEs for different primary antibodies, but more importantly, provides great confidence in assigning a particular connexin to an individual, ultrastructurally identified gap junction hemiplaque (in this case, only neuronal gap junctions) but not to any other ultrastructural feature.
Labeling efficiency in FRIL is defined, not as the number of gold beads vs. number of copies of a specific membrane protein, but instead, LE is defined as the number of gold beads vs. number of IMPs in a target array (Kamasawa et al., 2006), regardless of whether or not other transmembrane or scaffolding proteins may also be present. For example, astrocyte gap junctions have three different connexins (Cx43, Cx30, and Cx26; Rash et al., 2001; Nagy et al., 2003), each with a different LE. The sum of the three connexin LEs provides a relative measure of the overall LE for those gap junctions.
Many factors affect LE, including whether or not a very thin (1–5 nm) “pre-coat” of carbon is applied before platinum replication (Masugi-Tokita and Shigemoto, 2007; Kasugai et al., 2010) or in areas of high replica contour, where carbon is present without platinum (Rash and Yasumura, 1999; Kamasawa et al., 2005; Schlörmann et al., 2007), as illustrated below to document that glutamate receptor IMPs far outnumber their immunogold labels. Conventionally shadowed freeze-fracture replicas [i.e., those shadowed with 1–2 nm of platinum (Pt), followed by 10–30 nm of carbon (C)] typically have LEs between 1:10 and 1:100 (i.e., one gold bead per 10 connexons vs. one per 100 connexons, respectively). However, in samples “pre-coated” with carbon, or in areas where local contour prevented deposition of platinum, LE can be as high as 1:1 (Masugi-Tokita and Shigemoto, 2007; Kasugai et al., 2010), although it should be noted that those authors defined LE as the number of gold beads vs. the number of electrophysiologically determined receptor ion channels, and not with respect to number of IMPs. For tightly packed multi-subunit IMPs, such as connexons (which have center-to-center spacings of ca. 10-nm) and aquaporin-4 arrays (in which the subunit particles have center-to-center spacings of 6.5 nm), this theoretical upper limit for LE of 1:1–1:4 is reached because each primary antibody molecule (usually bivalent IgG; 8 nm × 8 nm × 12 nm; Valentine and Green, 1967) can be conceived of as a barrel that occupies a planar area equal to or greater than the entire surface of the target IMPs in closely packed arrays, precluding binding of multiple primary antibodies per IMP. Moreover, secondary antibodies, whether fluorescently tagged or gold-tagged, further enlarge the labeling complex, with resulting steric hindrance making it impossible to have LEs for tightly clustered IMPs (e.g., gap junctions, AQP4 arrays) greater than ca. 1:1, either by fluorescence microscopy or by FRIL. However, for loosely packed IMPs, such as glutamate receptors, which are separated by 20–30 nm, several antibody “barrels” can be fitted radially in the spaces around each IMP, allowing the potential for LEs ≥1:1.
Factors affecting detectability of different sizes of gold beads
Small gold beads are difficult to discriminate against Pt-coated 8–10 nm IMPs, which may be of greater electron density than the 6-nm gold labels. Thus, stereoscopic viewing is required for positive recognition of small gold beads beneath the replica, as illustrated below. (Recognition of small gold beads is not a problem for thin-sections because there are few if any 6-nm electron-dense granules, except in defective samples having precipitated staining reagents.) Nevertheless, in FRIL, secondary antibodies that are attached to smaller gold beads (i.e., 5–6 nm) have 8–16 times greater LE than 18- to 30-nm larger gold beads (Nagy et al., 2004). On the other hand, larger gold beads (≥18-nm) have such high image contrast and are so large that they are readily detected in low magnification (10,000×) “scans” of the replica (i.e., they act as “flags” or “beacons”). Thus, in FRIL, the use of a combination of large and small gold beads as labels for the same primary antibody gives the dual advantages of increased LE of the small gold beads and increased detectability of the large gold beads. However, a disadvantage of large gold beads, especially at high LE, is that the gold beads often completely obscure the labeled IMPs. Thus, for finding and quantifying target IMP clusters (i.e., gap junctions and glutamate receptor PSDs), we strive for what we consider an “optimum LE” of ca. 1:10, usually by adjusting antibody concentrations and labeling times.
Disadvantages of a carbon “pre-coat”
Vapor-deposited carbon is extremely adsorptive (Dinchuk et al., 1987), and this adsorptivity is the basis for the SDS-FRL technique, which permits labeling of the membrane proteins that remain adsorbed to the C- or Pt/C-replica following detergent washing (Fujimoto, 1995). However, the highly adsorptive carbon pre-coat greatly increases both “signal” (immunogold labeling) and the non-specific adsorption of both primary and secondary antibodies and of any proteins displaced and readsorbed during washing, all of which provide major sources of labeling “noise.” Indeed, we have found that along with increased labeling times, increased thickness of the carbon pre-coat, greater volume of samples/increased release of proteins, inadequate number or volume of detergent or water rinses, or by the use of ineffective blocking buffers, noise often increases faster than signal. Thus, even with a lower LE, manipulation of these factors creates the potential for improving signal-to-noise ratio (SNR). Often, the highest SNR occurs when LE is ca. 1:10 (Rash and Yasumura, 1999; Kamasawa et al., 2005). Failure to optimize LE and SNR results in excessively high “background” and, in the absence of stereoscopic analysis, the inability to assign individual gold beads as either label (signal) or noise.
A separate issue arising for samples rotary-coated with a 5-nm-thick layer of carbon prior to platinum deposition (Masugi-Tokita and Shigemoto, 2007; Kasugai et al., 2010) is that the sizes of all IMPs are increased by 10 nm (i.e., 5 nm of carbon on both sides of an IMP, prior to platinum shadowing), thereby converting nominal 5-nm IMPs to 15-nm IMPs, and 10-nm IMPs to 20-nm IMPs, completely disguising factors that allow approximate molecular weight assignment (Eskandari et al., 1998; Rash et al., 2004). Equally important, membrane pits are often partially or completely obliterated by carbon pre-coating, making it impossible to demonstrate “complementarity” of replica faces (Steere and Moseley, 1969; Challcroft and Bullivant, 1970), an essential element for determining whether a layer of pure “pre-carbon” is present vs. a layer of water vapor contamination. When water vapor contamination is present, adsorptivity of membrane proteins to the carbon layer is reduced, but in addition, the platinum and carbon layers often separate, resulting in fragmentation of some replicas. Also important, when a thick layer of pre-carbon is present, the variably increased IMP sizes makes it difficult to compare data regarding IMP identifications made by different laboratories, and even makes it difficult to discriminate between nearby IMPs differing by as much as 5 nm (Masugi-Tokita et al., 2007), but which in conventional freeze-fracture replicas are easily distinguished (Rash et al., 1979; Rash and Giddings, 1989). Based on the above, we typically use a nominal 1–1.5 nm thick carbon pre-coat (thereby not significantly increasing IMP diameter or significantly decreasing the width or depth of membrane pits), realizing that the replicas will have a slightly reduced LE but improved SNR. For clarity, we illustrate in this report how each of these factors affects replica quality and LE.
Recognition of “noise” and determination of SNR
In our previous reports, we defined SNR as the number of gold beads per unit area of target structure (e.g., gap junction or PSD) vs. number of gold beads on a representative area of non-target structures (typically nucleoplasm, extracellular space, and plasma membranes of different cell types). In “acceptable” FRIL replicas, there are few if any “background” gold beads, yielding SNR = 5000:1–50,000:1 (Meier et al., 2004). Using stereoscopic viewing, we also identified “definitive noise” as any gold bead above the Pt/C-replica, on the side formerly coated with Lexan, where no specific labeling is possible (Rash and Yasumura, 1999). In samples whose non-specific labeling was minimized due to use of adequate “labeling blocking buffers” (Dinchuk et al., 1987), >90% of gold bead “noise” was on the (formerly) Lexan-coated side of the replica, rather than on the tissue-side. When present in our images, gold beads as definitive noise are designated by a white circle with an oblique cross bar (⃠) stereoscopically superimposed over the offending gold bead.
Advantages and disadvantages of FRIL vs. SDS-FRL
“Freeze-fracture replica immunogold labeling” was named by Gruijters et al., 1987, almost a decade before Fujimoto’s landmark report describing sodium dodecylsulfate-digested freeze-fracture replica labeling (SDS-FRL; Fujimoto, 1995), which allows visualization and high-resolution immunogold labeling of diverse membrane proteins in broad expanses of biological membranes. However, SDS-FRL utilized vigorous immersion-washing of unsupported replicas, which resulted in severe fragmentation that precluded histological-scale mapping of complex CNS tissue, which is the object of our research. With its defining additional step of Lexan-stabilization for high-magnification confocal “grid-mapped freeze-fracture” (GMFF) of samples prior to washing and immunogold labeling (Rash et al., 1995; Rash and Yasumura, 1999), we designated the combined technique as FRIL, in deference to the original FRIL method (Gruijters et al., 1987).
Although progress has been made in developing labels for a few types of neurons for SDS-FRL (Masugi-Tokita et al., 2007), most classes of neurons in hippocampus currently cannot be positively identified by any freeze-fracture technique. An additional disadvantage is that, unlike methodical serial-section reconstruction afforded by tsTEM, conventional freeze fracturing results in a single, essentially random fracture, potentially at any depth within the tissue slice. This near-randomness of the fracture plane, combined with searching for immunogold “flags” rather than for specific cell appositions, reduces the potential for investigator bias in the semiquantitative analysis of gap junctions along different types of cell processes (e.g., CA3pyr dendrites vs. interneuronal dendrites for example). Nevertheless, because flatter membrane expanses are preferentially cleaved over highly convoluted membranes (e.g., thorny excrescences), FRIL may result in overestimates of gap junctions on the flatter, elongate dendritic shafts, as well as underestimates of gap junctions within convoluted membranes, such as thorny excrescences. Indeed, by FRIL, we have as yet found no Cx36-labeled gap junctions in the small portions of ca. 10 positively identified thorny excrescences. However, FRIL analysis using highly visible 18-nm gold beads allows sampling over large areas and relatively unbiased quantification of the labeled structures encountered. Finally, additional sources of sampling bias for both tsTEM and for FRIL include: (a) reduced detection of the smallest gap junctions (particularly those smaller than 30 connexons and therefore having few or no large gold beads to act as “flags”), and conversely, (b) a relative overestimation of the proportion of the large gap junctions that were the subjects of previous reports (Kosaka, 1983; Kosaka and Hama, 1985; Katsumaru et al., 1988; Fukuda and Kosaka, 2000).
Results
Pyramidal Cell-Mossy Fiber Dye-Coupling
Based on the need for high-resolution 3-D reconstructions of CA3pyr for our computer modeling, we injected the strongly fluorescent dye Lucifer Yellow (LY) under direct microscopic visualization into lightly fixed CA3pyr slices from adult rat ventral hippocampus (see Materials and Methods). Serendipitously during image analysis, LY was occasionally noted to reveal apparent CA3pyr-to-MF dye-coupling, apparently at MF axon contact areas within thorny excrescences (Figure 1), as we later confirmed by tsTEM of conventionally fixed samples (Figure 2). However, dye-coupling in these weakly fixed slices occurred at a much lower frequency than that demonstrated between adjacent CA3pyr in living tissue slices injected with LY (MacVicar and Dudek, 1980; Andrew et al., 1981). Using maximum intensity projection of confocal laser scanning microscopy image stacks, we examined ca. 500 dye-loaded CA3pyr, four of which (∼1%) had dye-loaded smooth processes or thin processes with varicosities, but in each case, clearly contacting thorny excrescences in their proximal apical dendrites (Figures 1A,D). Most of the smooth dye-labeled processes were oriented approximately perpendicular to the spiny apical dendrites of CA3pyr, and all four were in the stratum lucidum, with none in the infra-pyramidal bundles in stratum oriens. The smooth processes were either single (n = 1, Figures 1B,C) or appeared in bundles (n = 3, Figure 1E). Based on the morphology and location, we identified these fine-diameter smooth processes as MF axons with varicosities. Their identity as MF axons was further confirmed by high-resolution 3-D morphological reconstruction (Figures 1B,C,E) of local dilatations that had the shape and large size of MF boutons (Figures 1B,C; double arrows). Moreover, the dye-coupled MF axons established direct contacts with dye-injected CA3pyr dendrites (Figure 1B) or with their smaller spine-covered dendrites (Figure 1E, lower left arrowhead), potentially revealing the sites for gap junctional dye transfer. [Note: As in CA1pyr (Megías et al., 2001), the proximal 10–20 μm of CA3pyr dendrites are essentially devoid of spines (Figure 1A inset, yellow brackets), providing a potential confounding factor in the FRIL identification of mixed synapses on proximal dendritic shafts of CA3pyr vs. aspiny interneurons.] Overall, the relatively low frequency of dye transfer detected (ca. 1%) may reflect the use of the classical dye, LY (457 mw), which is slightly above or very near the cutoff molecular weight for gap junction-permanent dyes in vertebrate species (ca. 450 mw; Hu and Dahl, 1999). We are also aware that the rate of permeation of LY though open vs. closed connexon channels may be significantly reduced by even brief, weak formaldehyde-fixation. However, the improvement in structural detail, as well as the reduced likelihood of simultaneously impaling and injecting two cells, gives this approach certain added advantages. Thus, we suggest that future experiments by others should simultaneously inject LY and Neurobiotin (286 mw, Kita and Armstrong, 1991) to better assess the rate and extent of dye transfer for both dyes though gap junctions in living vs. briefly fixed CA3pyr neurons.
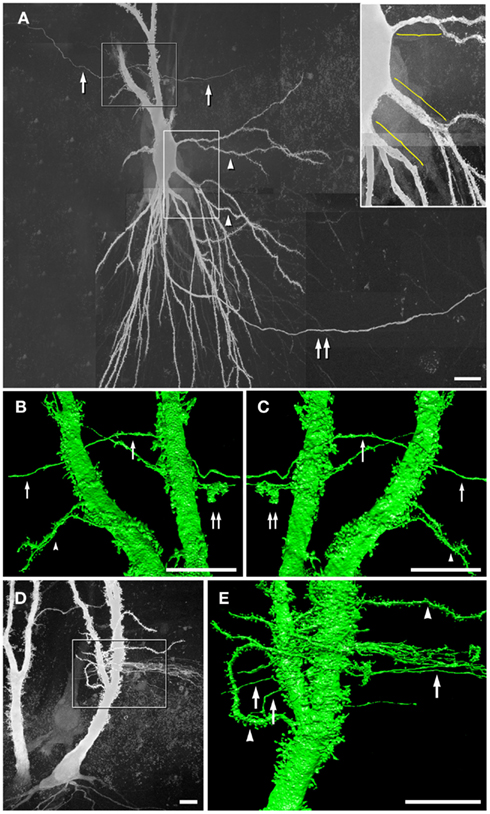
Figure 1. Dye-coupling between lightly fixed CA3pyr neurons and MF axons. (A) Maximum intensity projection of confocal z-stack showing a LY-injected CA3pyr and dye-coupled MF axons (arrows). Arrowheads, CA3pyr dendrites. Double arrow, CA3pyr axon. Inset, Higher magnification view of the bases of several dendrites, showing that few if any spines occur within 10–20 μm of the soma (yellow brackets). (B,C) High-resolution 3-D reconstructions (in two opposite z directions) of the boxed area in A showing CA3pyr dendrites dye-coupled to MFs. Arrows, MFs. Double arrow, MF boutons. Arrowheads, CA3pyr dendrites. (D) Maximum intensity projection of a confocal z-stack showing two LY-injected CA3pyr. (E) High-resolution 3-D reconstruction of the boxed area in (D) showing CA3pyr dendrite dye-coupled to a bundle of MF axons (single right arrow). The left two arrows mark MF axons that appear to be dye-coupled to CA3pyr dendritic spines at a different coupling site than the coupling site of the MF bundle. Arrowhead, CA3pyr dendrite. Scale bars are 10 μm.
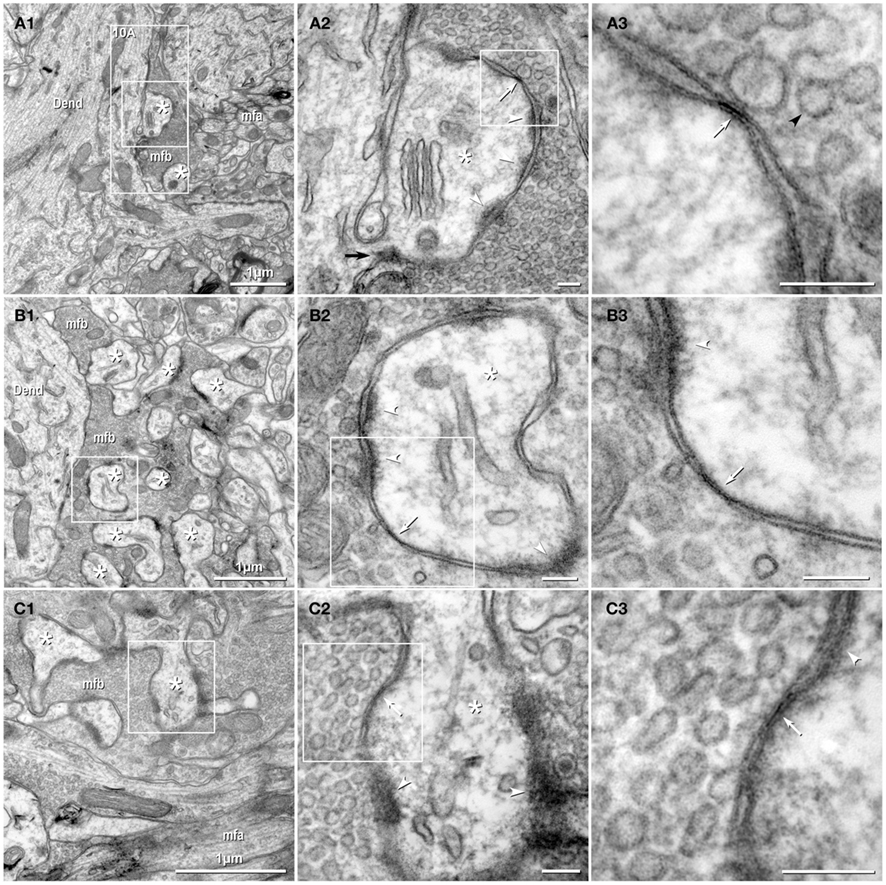
Figure 2. Thin-section TEM evidence for MF-CA3pyr mixed synapses. (A1) Image showing part of a CA3pyr dendrite (Dend) and adjacent MF boutons (mfb) and MF axons (mfa), with multiple dendritic spines (asterisks). (A2) Higher magnification of boxed area in (A1). A typical large-diameter MF bouton containing numerous synaptic vesicles surrounds a CA3pyr dendritic spine at a synaptic contact containing both close membrane appositions characteristic of gap junctions (white arrows) and wider membrane appositions with asymmetric dense cytoplasmic material (arrowheads) characteristic of postsynaptic densities (PSDs). Often these PSDs were opposite clustered 50-nm-diameter round synaptic vesicles that characterize glutamatergic chemical synapse. Black arrow, spine neck. (A3) Higher magnification of boxed area in (A2) showing the gap junction contact (white arrow) between the MF bouton and the CA3pyr dendritic spine. Synaptic vesicle (black arrowhead). (B1) Image showing a CA3pyr dendrite (Dend) and adjacent MF boutons (mfb) and CA3pyr dendritic spines (asterisks) within a complex thorny excrescence. (B2) Higher magnification of boxed area in B1. At this MF synapse with a CA3 dendritic spine, a five-layered gap junction contact [arrow in (B2) boxed area, enlarged as (B3)], as well as PSDs (arrowheads) of the closely associated chemical synapse. (B3) Higher magnification of boxed area in (B2) showing a putative gap junction contact (arrow) between MF bouton and CA3pyr dendritic spine, adjacent to the PSD of a chemical synapse (arrowhead). (C1) Image showing part of a CA3pyr dendrite thorny excrescence, with several CA3pyr dendritic spines (asterisks) and adjacent MF boutons (mfb) and MF axons (mfa). (C2) Higher magnification of boxed area in (C1). MF bouton containing numerous 50-nm round synaptic vesicles surrounding a CA3pyr dendritic spine. The synaptic contact contains a five-layered membrane apposition, identified as a gap junction (arrow), and several PSDs of a chemical synapse (arrowheads). (C3) Higher magnification of boxed area in (C2) showing a presumptive gap junction (arrow) between a MF bouton and a CA3pyr dendritic spine. Scale bars in all tsTEM and FRIL micrographs are 0.1 μm, unless otherwise indicated.
Gap Junctions between Mossy Fiber Terminals and Pyramidal Cell Dendritic Spines
Using tsTEM as the preferred method for detecting gap junctions in thorny excrescences, we examined an estimated 45,000 μm2 of CA3b stratum lucidum from adult rat ventral hippocampus in ca. 50 ultrathin sections (ca. 30 μm × 300 μm in each section). Five synapses with close membrane appositions that we designated as putative gap junctions were found between the glutamatergic MF terminal boutons and branched CA3pyr dendritic spines within classical thorny excrescences (Figure 2; dendritic spines indicated by asterisks). In four of these five glutamatergic MF terminals, components of chemical synapses [i.e., PSDs opposite clusters of 50-nm synaptic vesicles at presynaptic electron densities of presumptive active zones (Figures 2A2,B2,C2, arrowheads point to PSDs)] were observed in close proximity to putative gap junctions (Figures 2A3,B3,C3; arrows), thereby defining these glutamatergic synapses as probable mixed synapses. In the fifth example (not shown), the presumptive gap junction was on the neck of a spine of a CA3pyr dendrite, with the spine surrounded by and enclosed within a MF terminal, also consistent with its classification as a glutamatergic mixed synapse on a spine within a thorny excrescence. Within these putative gap junctions, the plasma membranes showed a pentalaminar configuration, with a total thickness of 18–20 nm, characteristic of gap junctions in many other tissues prepared by similar fixation and staining methods (Staehelin, 1974, also Kosaka, 1983; Kosaka and Hama, 1985; Fukuda and Kosaka, 2000). However, the small gap junctions described above lack the “semi-dense cytoplasmic matrix” found in those larger neuronal gap junctions (Sotelo and Korn, 1978; Kosaka, 1983; Kosaka and Hama, 1985; Fukuda and Kosaka, 2000). These presumptive gap junctions had profiles ranging from 35 to 70 nm (mean = 53 nm) in width, suggesting that they contain only a few dozen connexons, as compared to the 200–600 nm-diameter dendrodendritic gap junctions reported in hippocampal interneurons (Kosaka and Hama, 1985), that due to their larger sizes, we estimate to contain 400 to >3000 connexons.
FRIL Analysis of Mixed Synapses in Adult Rat Hippocampus: Proximity of Cx36-Containing Gap Junctions and Glutamate Receptor-Containing PSDs
In freeze-fracture replicas of adult rat hippocampus, neurons, and glia were identified according to established criteria (Rash et al., 1997). Using FRIL, we identified 20 neuronal gap junctions scattered throughout adult rat hippocampus (Table 1), all of which were found because they were labeled for Cx36 by the high-visibility 18-nm gold “flags.” Although additional gap junctions were found on glial cells, no unlabeled neuronal gap junctions were found, suggesting that Cx36-labeled most if not all neuronal gap junctions in these samples.
In a sample that was triple-labeled for Cx36, Cx45, and NMDA-R1 glutamate receptor subunits (6 and 18-nm gold beads for Cx36 and 12-nm gold beads for both Cx45 and NMDA-R1; Figures 3A–C), no gap junctions labeled for Cx45 were found. However, nine Cx36-labeled gap junctions were found, including one large axodendritic gap junction (Figure 3B, blue overlay; from stratum oriens). Its ∼360 connexons were labeled by 21 6-nm and six 18-nm gold beads, the latter of which are easily detected even at low magnification (Figure 3A). (See Materials and Methods for multiple rationales for using two sizes of gold beads for Cx36.) This large crystalline plaque gap junction was on a dendrite (red overlay) of either a spiny interneuron or of a CA3pyr, the latter possibility suggested by its location within stratum oriens, abundance of attached larger-diameter axon terminals covering most of its surface (purple overlays), and by its continuity with a branched spine (Figure 3C, arrow) that may represent the base of a thorny excrescence. In stratum oriens, thorny excrescences are found only on CA3pyr cells, at contacts between the infra-pyramidal MF axons and CA3pyr basal dendrites (Gonzales et al., 2001), but not on interneurons (Amaral, 1978; Scharfman, 1993). The base of a second probable thorny excrescence (Figure 3A, branched red overlay at bottom) may also represent a portion of the same dendrite, but a 20-nm break in membrane continuity (narrow break between red overlays) prevented its certain identification. Thus, these images are consistent with the identification of this medium-size dendrite as a portion of either a spiny interneuron or a CA3pyr. However, because the abundant spines of CA3pyr distal dendrites are much more numerous and are often club-shaped, whereas the spines of spiny interneurons are often branched tubes (as seen here), and most of their synapses are onto their dendrite shafts (as illustrated next), we interpret this glutamatergic mixed synapse as on a spiny interneuron in stratum oriens.
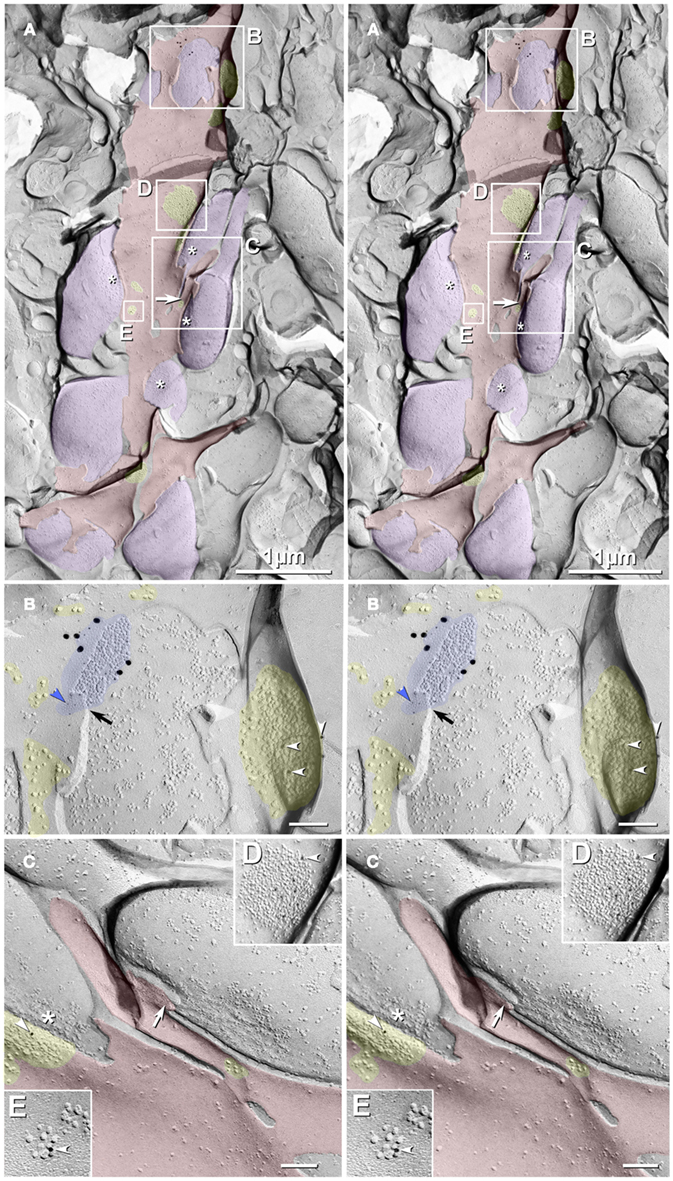
Figure 3. Freeze-fracture replica immunogold labeling images of a spiny dendrite in stratum oriens, with gap junction double-labeled for Cx36 (6 and 18-nm gold beads; within blue overlay) and cluster of 10-nm E-face IMPs labeled for NR1 glutamate receptor subunits (12-nm gold beads within yellow overlays). (A) Low magnification stereoscopic images of one of three gap junctions labeled for Cx36 found in a 20 × 20 μm area of stratum oriens. A narrow branched spine [arrow; shown at higher magnification as (C)] is consistent with identification of this neuronal plasma membrane E-face as either a portion of a CA3pyr dendrite (Chicurel and Harris, 1992) or of a spiny interneuron. A second branched spine is at the bottom (red overlay), separated from the co-planar dendritic shaft by ca. 20 nm, potentially indicating that the two membrane areas were continuous before fracturing. (B) Higher magnification stereoscopic image from (A) showing a medium-diameter gap junction (blue overlay) that is postsynaptic to a glutamatergic nerve terminal, identified by the presence of a shared PSD that is immunogold-labeled for NMDA-R1 by five 12-nm gold beads (arrowheads). Tilting, rotation, and stereoscopic analysis was required to clearly discern the PSD and gold labels beneath the almost vertical aspect of the replicated PSD in (A). Note narrowing of the extracellular space (black arrow) at edge of gap junction. Air-drying of the high-relief replicas caused compression and artifactual tilting and overlap (similar to a geologic thrust fault) at the upper right [and at higher magnification in (B)], artificially causing the PSD to appear tilted to near vertical. However, the comparable length of the shadows cast by the 10-nm E-face IMPs clearly reveal that the left edge of the PSD, at the instant of fracture and shadowing, was essentially co-planar with the immediately adjacent axon terminal P-face. (C) Higher magnification, rotated, and tilted stereoscopic view of a branched spine that is characteristic almost exclusively of CA3pyr dendrites. The extended spine is 0.15 μm in diameter and, unlike branching dendrites (Kasugai et al., 2010), maintains a uniform diameter beyond the branch point (at arrow). (D) Higher magnification stereoscopic view of a large cluster of 10-nm E-face IMPs that were immunogold-labeled for NR1 glutamate receptor subunits. Seven 12-nm gold beads are visible beneath this PSD. In this and other samples of hippocampus, >90% of larger P-face IMP clusters, and most of those containing >50 IMPs, were immunogold-labeled for various of the glutamate receptor subunits (see Figure 6). (E) Higher magnification stereoscopic view of a small cluster of 10-nm E-face IMPs labeled by one 12-nm gold bead for NMDA R1.. Scale bars are 0.1 μm, unless otherwise indicated.
In addition to the nearby immunogold-labeled PSD, multiple clusters of 10-nm E-face IMPs that were immunogold-labeled for NMDA-R1 surround this large gap junction, which is shared with a freeze-fractured axon terminal protoplasmic leaflet (P-face; purple overlay in Figure 3A). Six NR1-labeled and three small unlabeled glutamate receptor clusters are indicated in Figure 3A (nine yellow overlays), and three of these are enlarged as Figures 3B,D,E. In Figure 3B, arrowheads point to three of six 12-nm gold beads, some of which are partially obscured by the overlying carbon film that is within the unshadowed, artifactually tilted convex postsynaptic plasma membrane. (See detailed description in the figure legend.) This labeled PSD extends to within 30 nm of the edge of the fracture face shared with the co-planar axon terminal. This small distance would disallow the presence of another axon terminal between the edge of the visualized axon terminal and the glutamate PSD. (At the minimum, an additional axon terminal would require 20 nm for two additional plasma membranes (one for each axon terminal, both immediately turning at right angles away from the plasma membrane), plus 10-nm for the intervening extracellular space, and 10 nm for minimal cytoplasm in each axon terminal, for a minimal distance at least twice as large as that present between the visualized axon terminal and the PSD.) In either case, however, this configuration of axon terminal with gap junction in immediate proximity to a glutamate receptor PSD is consistent with its identification as either a glutamatergic mixed synapse or, with less likelihood, as a tripartite “functionally mixed” synapse, as recently characterized in inferior olive (Hoge et al., 2011).
In Figure 3C, one larger PSD was labeled for NR1 (arrowhead), whereas a few smaller E-face receptor clusters (i.e., those containing 10–20 IMPs) were unlabeled, consistent with the relatively low LE of this antibody (as illustrated below), the stochastic nature of immunogold labeling, and because NMDA receptors constitute only a fraction of the glutamate receptors present at these PSDs, which contain primarily AMPA-type glutamate receptors (Takumi et al., 1999). (Notably, their analysis specifically excluded all immunogold labeling that they found on dendritic shafts, presumably because of the relatively low density of extrasynaptic receptors on shafts and the potential that others who do not accept the existence of shaft synapses would have interpreted that dispersed labeling as “noise.”) In contrast, we show FRIL images below for simultaneous colocalizations of AMPA and NMDA receptor subunits, both to 10-nm E-face glutamate receptor IMP clusters on dendritic shafts (presumably corresponding to puncta adherentia, as described by Petralia et al., 2002), as well as to tightly clustered E-face IMPs in identified PSDs, which are abundant on both spines of CA3pyr and on dendritic shafts of interneurons.) In Figure 3D, seven gold beads label another glutamate receptor PSD (arrowhead; enlarged from numbered block D in Figure 3A), and a nearby glutamate receptor cluster is also labeled for NR1. The relatively low LE but high SNR in this replica allows definitive identification of these IMP clusters as containing extrasynaptic glutamate receptors and suggests that the associated axon terminals and axon varicosities release glutamate as their neurotransmitter. This identification of clustered 10-nm IMPs as containing glutamate receptors is appropriate regardless of whether the synaptic configuration involves discrete PSDs or more dispersed puncta adherentia, which also reportedly contain AMPA and NMDA receptors (Petralia et al., 2002; Deng et al., 2006). It has also been proposed that glutamate receptors may cluster prior to synapse formation (Scheiffele, 2003).
In Figure 3A, purple overlays indicate axon terminals that are sufficiently large to correspond to MF terminals (2–6 μm; Gonzales et al., 2001) or to their abundant axonal varicosities (0.2–1 μm; Amaral, 1978). (Asterisks indicate the freeze-fracture correlate of active zone IMPs at axon terminals). This glutamatergic mixed synapse may represent either an axon terminal of a local recurrent collateral of a CA3pyr, a local glutamatergic interneuron (see Kondo et al., 2008), or an axon terminal from a distant hilar mossy cell (Jackson and Scharfman, 1996), the latter of which are also mostly glutamatergic.
In a replica that was single-labeled for Cx36 (i.e., not for glutamate receptors), a second glutamatergic mixed synapse was found on a presumptive large spine in stratum lucidum (Figure 4; Table 1). A portion of this synapse was previously shown in Nagy et al., 2004.). This club-shaped spine, which is approximately the same size as the CA3pyr dendritic spines illustrated in Figures 2A1,B1, was tentatively identified as that of a CA3pyr dendrite based on its anatomical location within stratum lucidum, among other CA3pyr dendrites, which were oriented parallel and within the plane of the FRIL replica (Figures 4A,B, red overlays). In contrast, the perpendicularly oriented, small-diameter cross-fractured profiles of interdigitating MF axon terminals (purple overlays) and MF axons (cyan overlays) contained bundles of cross-fractured neurofilaments and neurotubules characteristic of axons but were devoid of rough endoplasmic reticulum, which is a marker for dendrites. This “miniature” non-crystalline plaque gap junction (Rash et al., 2007), found solely because it was heavily labeled (LE = 1:6) by 10 18-nm gold beads for Cx36 (Figure 4B), consisted of 56 densely packed E-face pits that were immediately adjacent to (i.e., ca. 0.2 μm from) a distinctive cluster of ca. 45 10-nm E-face IMPs (yellow overlay), tentatively identified as a glutamate receptor PSD, as shown below. Note also that there are additional small clusters of 10-nm E-face IMPs surrounding the gap junction, suggesting the presence of both synaptic and extrasynaptic glutamate receptors at this synapse (documented below). However, we acknowledge that in the absence of evidence that the PSD and gap junction are shared with the same axon terminal, this close configuration of PSD and gap junction could also represent that of a “functional mixed synapse” (Hoge et al., 2011).
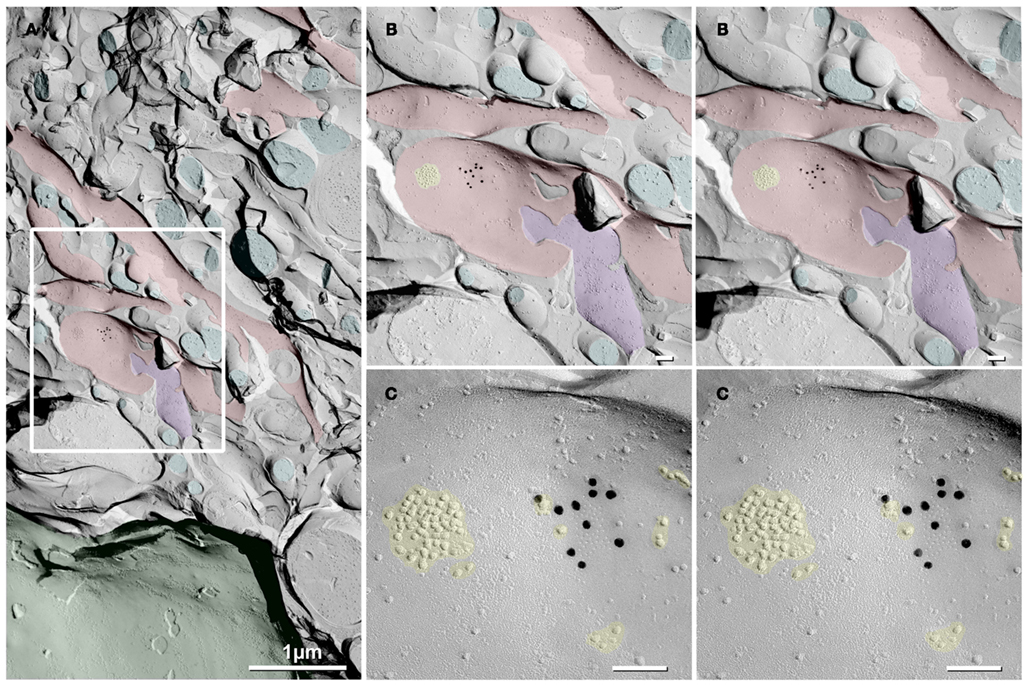
Figure 4. Low- to high-magnification images showing complex dendritic field in stratum lucidum. (A) CA3pyr dendrites (red overlays) are oriented perpendicular to the cross-fractured MF axons (aqua overlays). Dendrites run parallel to the fracture plane (diagonally from upper left to lower right), and cross-fractured MF axons run perpendicular to the fracture plane. Axons are identified by their high content of cross-fractured neurofilaments, as shown in (B). (B,C) Higher-magnification stereoscopic FRIL images of the boxed area in (A) containing a mixed synapse on a probable large CA3pyr dendritic spine near the center of the field. (C) A single gap junction was detected by the presence of 10 18-nm gold beads (labeling for Cx36) that are tightly clustered around the 56 non-crystalline E-face pits, whose center-to-center spacing is ca. 10 nm. A nearby PSD contains ca. 45 10-nm E-face particles, characteristic of glutamate receptor clusters (Harris and Landis, 1986; Rash et al., 2004, 2005), suggesting that this is a glutamatergic mixed synapse, presumably on a CA3pyr dendritic knob or spine that is postsynaptic to the large MF terminal (purple overlay). Scale bars are 0.1 μm, unless otherwise indicated.
Several additional axon varicosities (Figures 5A–C; purple overlays) also contained anti-Cx36-immunogold-labeled gap junctions. These included a simple “reticular” gap junction (defined in Kamasawa et al., 2006) at the tip of a small- to medium-size club-shaped spine head (Figure 5A; from stratum lucidum, and therefore likely to correspond to a CA3pyr spine); a larger and more complex reticular gap junction on a large spine head (Figure 5B; from hilus, and therefore possibly from either a hilar mossy cell or a CA3pyr dendrite); and a simple reticular gap junction at a site directly adjacent to where a portion of the dendrite or the base of a dendritic spine was fractured away (Figure 5C; from stratum lucidum, but not otherwise identifiable as to cell type). (Reticular gap junctions in hippocampus were previously called “anastomosing” gap junctions; Rash et al., 1997.) Scattered and slightly clustered 10-nm E-face IMPs (Figure 5C, yellow overlays) are associated with the upper two gap junctions, presumably corresponding to extrasynaptic glutamate receptors, as shown below. Often, however, the coupling partner at these mixed synaptic endings could not be positively identified, either because no portion of the coupling partner was visible in the replica (images not shown), only the tips of spines were visible (Figure 5A), or the identity of the postsynaptic cell could not be positively determined due to insufficient structural markers (Figure 5C). Nevertheless, glutamate-receptor-like clusters of 10-nm E-face IMPs (Figure 5C, yellow overlay) define the small area as dendritic plasma membrane in stratum lucidum of CA3.
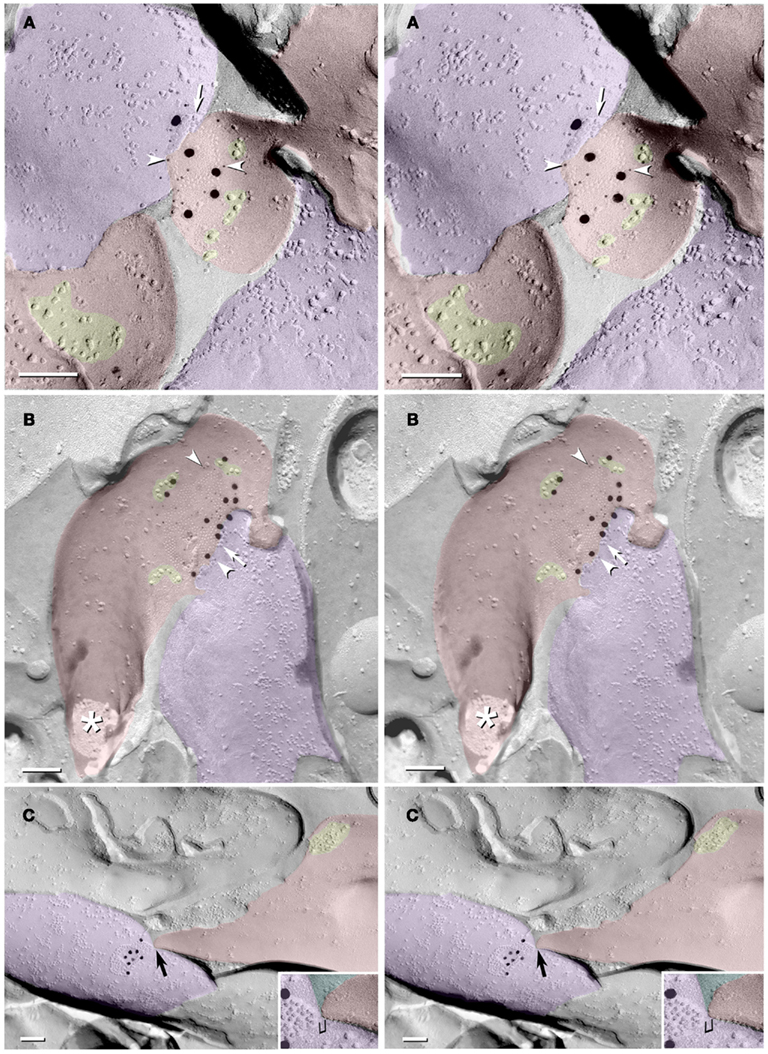
Figure 5. Stereoscopic images of gap junctions shared between dendritic spines and MF axon varicosities. (A) Small circular reticular gap junction on a short spine head in stratum lucidum; labeled by 15 6-nm gold beads (arrowheads) and five 18-nm gold beads, both for Cx36. (B) Medium-size reticular gap junction (ca. 200 connexon E-face pits and eight P-face particles) on a large spine head on a presumptive mossy cell or other spiny interneuron in the hilus; labeled by 22 6-nm gold beads and 12 18-nm gold beads, both for Cx36. The asterisk marks the cross-fractured neck of this large spine. (C) Small reticular gap junction on presumptive MF terminal close to a narrowed portion of a dendrite at the margin of CA3c/hilus. Stereoscopic viewing of the 10- to 15-nm step (bracket) between the apposed dendritic plasma membrane and the gap junction reveals that the extracellular space is much too narrow for another cell process to be interposed. Scale bars are 0.1 μm.
Exact locations of 16 of the 20 immunogold-labeled gap junctions, at both mixed synapses and at probable electrical synapses, were “grid-mapped” (see Materials and Methods) in their corresponding slices of hippocampus (Figures 6A,B). Yellow dots with numbered arrows correspond to figure numbers. Unnumbered yellow dots mark exact locations of seven non-illustrated gap junctions found in these same two FRIL replicas. In contrast, blue dots mark the approximate locations of four other of the 20 gap junctions found in three other FRIL replicas, as marked in these as representative slices. As shown here, gap junctions were found in all layers of the hippocampal formation that we examined.
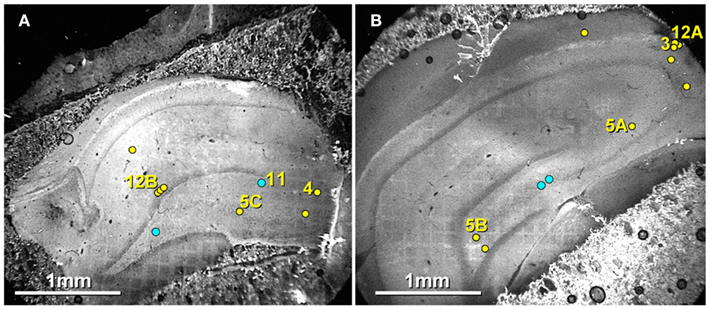
Figure 6. Confocal maps showing exact locations of 20 Cx36-immunogold-labeled gap junctions found in adult rat hippocampus. (A,B) The labeled gap junctions shown in Figures 3, 4, 5A–C, 11, and 12A,B are indicated by numbered yellow dots. Exact locations of seven other Cx36-labeled gap junctions (unnumbered yellow dots) found in these same two replicas are also indicated. In addition, the approximate locations of four other Cx36-labeled gap junctions found in three other replicas are indicated (unnumbered blue dots). Note the faint image of the gold “index”TEM grid beneath and bonded to the tissue slice. Scale bars are 1 mm.
Effects of an Initial Coat of Vaporized Carbon on LE and SNR
In our pursuit to further characterize the 10-nm E-face IMPs surrounding gap junctions, we first examined the effects of platinum vs. carbon coating on the LE for both NMDA and AMPA receptors. Where the fracture plane created areas of steep membrane contour that were not coated with platinum, some PSDs were platinum-shadowed over only about half of their areas (Figures 7A,B). In the lower magnification overview (Figure 7A), three PSDs are seen with immunogold labeling for NMDA receptors (two ovals and one rectangle, the latter of which is shown in higher magnification stereoscopic images in Figure 7B). The two circled PSDs were platinum-shadowed over their entireties. One was labeled by two 12-nm gold beads and one by six 12-nm gold beads, for an LE of 1:50–1:100. In contrast, the PSD within the rectangle was shadowed at a low angle such that it had its upper half shadowed by platinum, and its lower half coated only with carbon (Figure 7B; double-ended arrowhead). Importantly, the platinum-shadowed half (>190 IMPs) is labeled by only one 12-nm gold bead (LE = 1:190), whereas the unshadowed lower half (ca. 200 IMPs weakly delineated by carbon) is labeled by 32 gold beads (LE ≈ 1:7), with an additional two gold beads in the overlapping margin between Pt/C and pure C. This approximately 30-fold difference in LE for carbon-coated vs. platinum-shadowed IMPs demonstrates that the platinum coat reduced LE by about 97%, as compared with labeling under the pure carbon coats, a reduction in LE caused by platinum coating that has been demonstrated for numerous other transmembrane proteins (Fujimoto, 1995; Schlörmann et al., 2007). Because many of the gap junctions in this study were from this same sample (Figures 3, 5A,B, 6B, 7, 9B, and 11A), we infer that the nearby PSDs and clusters of immunogold-labeled 10-nm IMPs in those samples had similarly depressed immunogold labeling for NMDA receptors, and that each gold bead, on average, represents about 3% of the number possible for IMPs coated only with carbon.
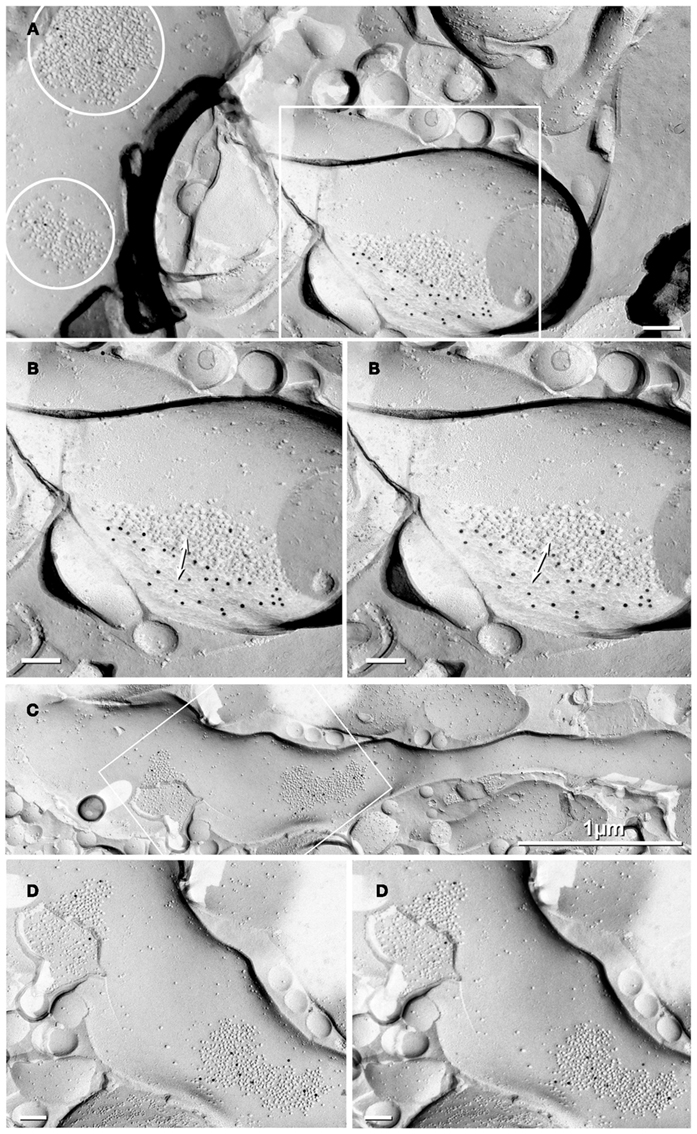
Figure 7. Labeling compared for NMDA vs. AMPA glutamate receptors in PSDs of probable interneurons. (A) Low magnification overview of three glutamate receptor-containing PSDs (white circles and white box). The circled PSDs are conventionally shadowed with platinum and have a low (but typical) LE of ca. 1:50–1:100, whereas the boxed PSD, within a large spine, is shadowed by platinum on only about half its surface, revealing a much higher LE (ca. 1:6) of the glutamate receptors in the unshadowed half. (B) A higher magnification stereoscopic view of the PSD within the large spine had its upper half shadowed by Pt/C and its lower half coated only with carbon (double-ended arrow). Interestingly, the Pt-shadowed half has only one 12-nm gold bead on >190 IMPs, whereas the carbon-replicated half is labeled by 32 12-nm gold beads on ca. 200 IMPs that are weakly delineated by carbon, for a 30-fold higher LE of glutamate receptors beneath carbon as compared with those beneath Pt/C. Two additional gold beads are at the margin between unshadowed and Pt-shadowed IMPs. This image also shows that it is possible to visualize glutamate receptor PSDs even where the Pt replica is not present. (C,D) In an adult rat hippocampal interneuron, FRIL reveals that NMDA receptors (10-nm gold beads, arrowheads) are concentrated at PSDs, but that few clusters of glutamate receptor IMPs are present in the E-face. Scale bars are 0.1 μm, unless otherwise indicated.
FRIL Analysis of Glutamate Receptors on Dendritic Shafts of Interneurons vs. CA3pyr
Dendrites of interneurons have few spines but are enriched in PSDs that, by FRIL, are immunogold-labeled for NR1 glutamate receptors (Figures 7C,D). Their few extrasynaptic receptors are usually tightly clustered against PSDs (Figure 7D, bottom center). For both labels, we presume that the platinum layer greatly reduced LE, and therefore, that each label in similarly prepared replicas indicates the presence of 10×–30× as many glutamate receptors, as revealed above in Figures 7A,B. In contrast, dendritic shafts of CA3pyr are characterized by their abundant spines (Figure 8), which have labeling for NR1 primarily on spines (Figures 8B,C; 10-nm gold beads, arrows), as well as by their abundant clusters of 10-nm E-face that are labeled primarily for AMPA receptors (Figure 8B, 20-nm gold beads). Note especially that the gold labels closely follow the sinuous distribution of 10-nm E-face IMPs (Figure 8B). Gold beads (as “noise”) are present at much lower density in areas outside the labeled dendrite (Figure 8A). Stated differently, this particular replica, with slightly increased thickness of pre-carbon, has a moderate level of noise but a high SNR. (See Materials and Methods for definitions and descriptions of LE, SNR, and labeling noise.) In a sample labeled for NR1 but not for AMPA receptors (Figure 8C), a CA3pyr dendrite (identified by multiple spines and spine necks, numbers 1–7) shows moderate labeling for NR1 at the tips of both a club-shaped spine (#3) and a stubby spine (#7) but a lower level of labeling on the clusters of 10-nm E-face IMPs on the dendritic shaft (arrows).
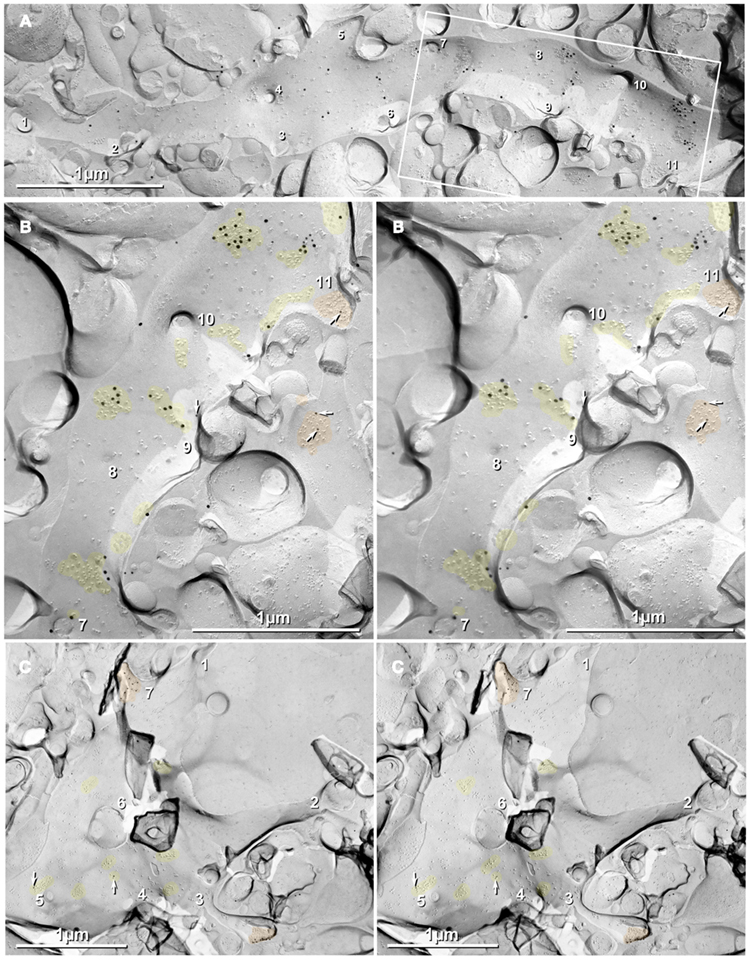
Figure 8. Dendritic shafts of CA3pyr are characterized by their abundant spines and by abundant clusters of glutamate receptors on their shafts. (A,B) Eleven spines and spine necks are numbered. (B) Higher magnification stereoscopic view of the boxed area in Figure 8A. Spines have labeling for NR1 primarily at their tips (Figures 8B,C; 12-nm gold beads, arrows), but on their shafts, labeling is primarily for AMPA receptors (18-nm gold beads). (C) Stereoscopic view of hippocampal replica labeled for NMDA receptors but not for AMPA receptors. Labeling for NMDA receptors is much greater on the tips and sides of spines (#3 and #7, respectively) than on dendritic shafts (arrows). If the platinum layer greatly reduces labeling efficiency, as implied in Figure 7B, each gold bead would indicate the presence of many additional glutamate receptors in the clustered IMPs. Thus, AMPA receptors (18-nm gold beads) are present along with NMDA receptors in spine PSDs (orange overlays), but are present at higher relative density in the dispersed 10-nm E-face IMPs on dendritic shafts (A,B). Scale bars are 1 μm.
It should be noted that of the 10–20% of the IMPs that are present on E-faces (Rash et al., 1997), most are 3–8 nm and only a few percent are 10-nm E-face IMPs. Notably, these are usually near glutamatergic axon terminals or are on the shafts of CA3pyr dendrites (Figures 8A,B). When immunogold-labeled for glutamate receptors, CA3pyr neuronal somata and dendrites containing irregularly distributed 10-nm E-face IMPs are almost always labeled with a few gold beads, whereas all other areas remain unlabeled. Considering the relatively low LE in platinum-shadowed areas (1:30–1:190; see above) but high SNR, we conclude that many/most of the remaining irregularly distributed 10-nm E-face IMPs correspond to “extrasynaptic” glutamate receptors (Ottersen and Landsend, 1997; Sattler et al., 2000). In contrast, most other neurotransmitter receptors and voltage-gated ion channels have been identified as P-face IMPs (e.g., GABA receptors, acetylcholine receptors, voltage-gated sodium channels, and voltage-gated L-type calcium channels). Nevertheless, we recognize that there remain a few widely dispersed neurotransmitter receptors, such as dopamine receptors that have not been assigned to either E-face or P-face, nor have their sizes been determined, allowing for the possibility that some of the 10-nm E-face IMPs may correspond to other, as yet unidentified, transmembrane proteins. Regardless, whether on shafts or spines, the dense clusters of 10-nm E-face IMPs representing PSDs (Harris and Landis, 1986) are confirmed to contain glutamate receptor subunits, either at axon terminals or at en passant axon varicosities, whereas the irregularly distributed clusters of 10-nm E-face IMPs are herein identified by FRIL as containing at least a few glutamate receptors. Consequently, in all hippocampal samples, whether labeled for glutamate receptors or not, we tentatively identify the population of dispersed 10-nm E-face IMPs on postsynaptic membranes as “extrasynaptic” glutamate receptors, with it yet undetermined as to whether the extrasynaptic receptors constitute a “reserve pool,” a forming synapse, the remnants of a disassembling synapse, or the freeze-fracture correlate of puncta adherentia, which reportedly are enriched in either or both NMDA and AMPA glutamate receptors (Petralia et al., 2002; Tomita et al., 2003; Deng et al., 2006).
CA3pyr Dendritic Shafts Have Occasional Glutamatergic Synapses Near Thorny Excrescences
In higher magnification views from the same images used to show close membrane appositions as putative gap junctions (Figure 2), and hence not pre-selected for other purposes, we found evidence for asymmetric/glutamatergic synapses on dendritic shafts (Figure 9A). Synaptic vesicles were clustered opposite postsynaptic electron-dense material (the original definition of PSD), with the MF terminal containing small columnar presynaptic cytoplasmic densities corresponding to the tsTEM correlate of active zones (Figure 9A, arrowheads). In FRIL replicas, MF terminals at thorny excrescences (Figure 9B) were distinguished from varicosities forming synapses at spines along axon shafts (Figures 4 and 5) and from synaptic endings of recurrent collaterals and perforant path axon terminals: (a) by their much larger sizes (2–6 μm in diameter; Gonzales et al., 2001), (b) the complex interdigitations with multiply branched dendritic spines (red overlays), and (c) by the presence of much more abundant, densely packed 40- to 50-nm-diameter hemispherical synaptic vesicles (SV) in the MF terminal cytoplasm. Synaptic vesicles were clustered at the axon terminal plasma membrane at sites where the cytoplasm fractured irregularly (Figure 9B; yellow arrows) similar to freeze-fractured active zones in other chemical synapses (Figure 18 in Gulley et al., 1978). These configurations could represent either conventional glutamatergic shaft synapses, with conventional pre- and postsynaptic densities, or paired appositions that have been called puncta adherentia, which in hippocampus reportedly contain AMPA receptors and their tightly associated scaffolding and targeting proteins (Tomita et al., 2003; Deng et al., 2006).
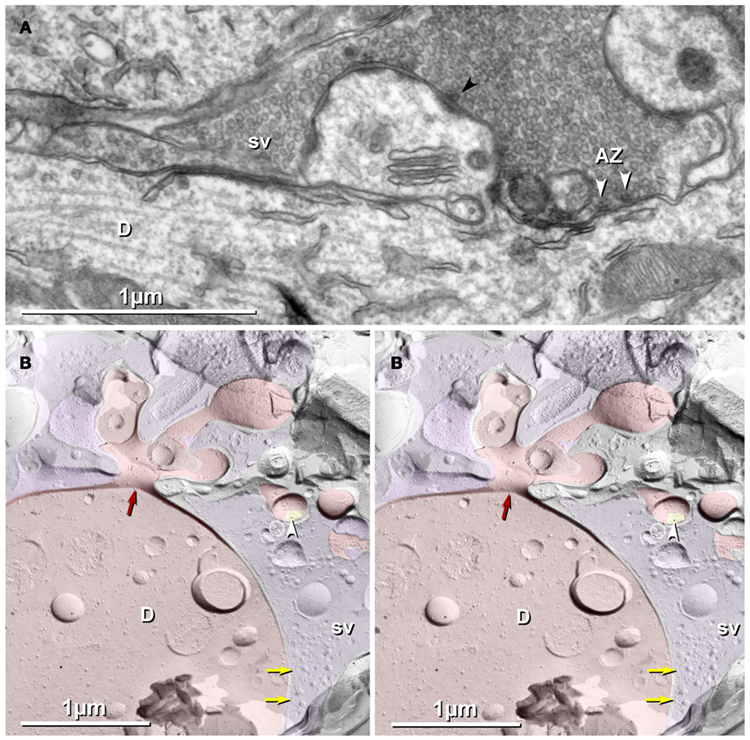
Figure 9. Thin-section (A) and freeze-fracture images (B) of thorny excrescences, with lateral extension of MF terminal forming glutamatergic synapses onto dendritic shafts of CA3pyr. Tightly clustered synaptic vesicles are at asymmetric synapses, occasionally with electron-dense presynaptic active zones [(A); white arrowheads opposite dendritic shaft; black arrowhead opposite spine]. (B) FRIL image of cross-fractured dendrite shaft, with thorny excrescence extending into the complex spine apparatus. (Base of spine indicated by red arrow.) One PSD (yellow overlay) with a single gold bead (white arrowhead) is labeled for NMDA-R1. A portion of a complex MF terminal (purple overlay) is traceable from an included spine to its contact with the cross-fractured CA3pyr dendrite (D; red overlay). In the apposed, MF terminal, synaptic vesicles (sv) are densely clustered at probable active zones (yellow arrows). Scale bars are 1 μm.
In a FRIL sample that was double-labeled for Cx35 + Cx36 (monoclonal and polyclonal antibodies directed at two different non-overlapping sequences in the Cx36 protein; see Materials and Methods), a “figure-eight” reticular gap junction, was found on a two-lobed mushroom-shaped spine projecting from a large expanse of the E-face of the soma of a DG neuron (Figure 10). The granule cell was situated among four other cross-fractured granule cells, including an abutting granule cell whose ovoid nucleus (Nu) was exposed, revealing its distinctive nuclear pores. Identification of this cell as a DG neuron was based on anatomical location (see confocal map, Figure 6B), size of somatic plasma membrane (ca. 10 μm × 10 μm of plasma membrane E-face; about half of which is shown here), presence of only a few spines (Figures 10B,C), and by its contact with abundant large-diameter glutamatergic axon terminals (Figure 10A; purple overlays) abutting the soma and proximal dendrites, as confirmed at most places where the fracture plane exited the granule cell plasma membrane and exposed the axon terminals beneath (Figures 10A,B). Numerous small to medium clusters of 10-nm E-face IMPs (yellow overlays, and inset, lower left), inferred to be glutamate receptors PSDs based on evidence shown above, were opposite these axon terminals. On both the left and right margins of the axon terminal (Figures 10B), the fracture plane stepped up from the axon terminal P-face (purple overlay) to clusters of glutamate-receptor-like IMPs (yellow overlay) in the DG cell E-face, providing strong anatomical evidence that this is a glutamatergic axon terminal. In higher magnification stereoscopic images (Figure 10B), the two-lobed or mushroom spine is seen to contain a medium-size reticular gap junction surrounded by both clustered and dispersed glutamate-receptor-like 10-nm E-face IMPs (yellow overlays; Figures 10B,C). Due to the depth of the spine, it was fortunate that we use a high shadowing angle (60° instead of 45°), which allowed sufficient penetration of the platinum shadow into this shallow spine to weakly delineate the gap junction (Figures 10B,C; red overlay) at the side and tip of the spine. This gap junction, which consists of ca. 150 E-face connexon pits, was heavily double-labeled (LE = 1:8) for Cx36 by 18 6-nm gold beads (goat anti-mouse monoclonal anti-Cx36 antibodies) and for Cx35/Cx36 by three 18-nm gold beads (goat anti-rabbit polyclonal antibodies against Cx35, see Materials and Methods). (One additional gold bead on the “wrong” side of the replica [designated by “⃠” (barred circle); Figure 10B] represents the only labeling “noise” within this 200 μm2 area, attesting to the high LE, high SNR, and high labeling specificity.) Faintly resolvable in the stereoscopic images of the unshadowed portion of the mushroom spine are several clusters of carbon-replicated large-diameter E-face IMPs (yellow overlays) surrounding and located less than 0.1 μm from the gap junction, further supporting our identification of this spine as the postsynaptic portion of a large glutamatergic mixed synapse with multiple PSDs.
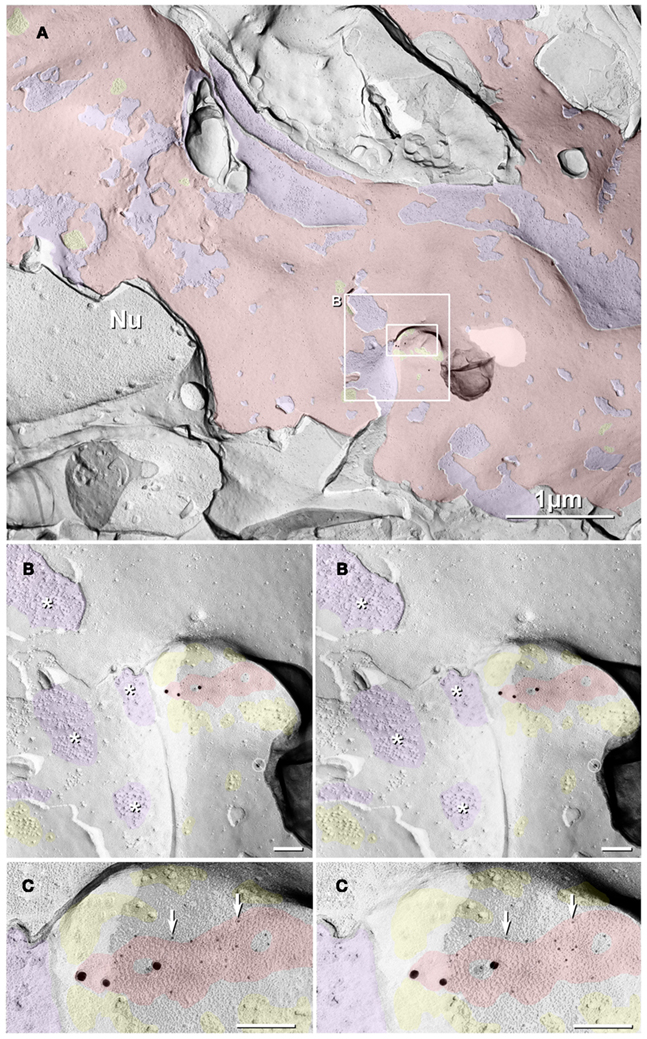
Figure 10. Dentate granule cell somatic and proximal dendrite plasma membrane E-face, with immunogold-labeled reticular gap junction. Large area of exposed neuronal plasma membrane (red overlay; ca. 1/4 of the 10 μm × 10 μm area is shown) is abutted by multiple large-diameter glutamatergic axon terminals (purple overlays). This replica was double-labeled for Cx35 + Cx36. Boxed areas are enlarged as stereoscopic images. (B) At intermediate magnification, active zones (*) are visible in the axon terminal P-face, and clusters of 10-nm E-face IMPs are seen in the subjacent granule cell proximal dendrite E-face, demonstrating two primary components defining multiple chemical synapses. In the center of the image is a two-lobed “mushroom” spine that, fortuitously, was shadowed deeply [enlarged as (C)]. Several active zones (* and purple overlays), one with a closely-associated PSD (yellow overlay), are indicated. A single gold bead above the replica, and therefore representing “definitive noise,” is indicated by “⃠.” (C) At high-magnification, a medium-size (>150 connexons) “reticular” gap junction (red overlay) was faintly resolved deep in the spine head, but was easily detected because it is double-labeled by three 18-nm gold beads attached to rabbit polyclonal antibody for Cx35 (fish ortholog of Cx36; O’Brien et al., 2004, 2006) and by 18 6-nm gold beads (white arrows) that label mouse monoclonal antibody for Cx36. Glutamate-receptor-like E-face IMPs (yellow overlays) are seen as Pt/C-replicated IMPs, while some are faintly delineated only by the carbon coat in the area not shadowed by platinum. One of several active zones (*) and one of the closely associated PSDs, composed of unshadowed and edge of tangentially shadowed E-face IMPs is at the left edge of the gap junction, and a small PSD is at the right edge of the gap junction. Purple overlay, tangentially shadowed active zone [enlarged from (B)]. Scale bars are 0.1 μm, unless otherwise indicated.
Because the primary excitatory (i.e., glutamatergic) inputs to the somata and proximal dendrites of the granule cells are from the perforant pathway, which arises from layers II-III of the entorhinal cortex, and because the DG receives no direct inputs from other cortical structures (Do et al., 2002), we conclude that this glutamatergic mixed synapse is from an unidentified axon terminal onto a hippocampal principal neuron (granule cell), most likely representing input from an extrinsic principal cell from layer II-III of the entorhinal cortex, but possibly from a glutamatergic hilar mossy cell (Jackson and Scharfman, 1996; Kondo et al., 2008), the latter of which also innervate granule cells. With glutamatergic axons of the perforant path also innervating CA3pyr on both their apical and basal dendrites, some of the other glutamatergic mixed synapses in other layers of the hippocampus may also arise from perforant path axon terminals. Finally, rare spiny glutamatergic interneurons may also innervate CA3pyr (Scharfman, 1993), potentially further confounding future electrophysiological analysis of gap junctionally coupled neurons.
Large Gap Junctions between Dendrites
Three of 20 Cx36-labeled gap junctions were between apposed dendrites (Figure 11A). Two of the dendrodendritic gap junctions were large – this one contains 1140 connexons and is 0.3 μm × 0.4 μm in its minor and major axes – but one was small (ca. 50 connexons; not shown). This large reticular gap junction was labeled for Cx36 by more than 88 6-nm gold beads and 26 18-nm gold beads. [Stereoscopic imaging reveals that two 12-nm gold beads (marked by ⃠), ostensibly for NMDA receptors, are on the wrong side (Lexan-coated side) of the replica and thus are definitively “noise.”] Because of their sizes and anatomical locations, and because the dendrites contained large cytoplasmic membrane structures, lacked spines, and lacked synaptic vesicles, we infer that the large dendrodendritic gap junctions were between interneurons, as shown by Kosaka (1983) and Kosaka and Hama (1985). In the absence of evidence for reciprocal glutamatergic transmission, as was seen in olfactory bulb (Rash et al., 2005), dendrodendritic gap junctions are presumed to represent electrical synapses rather than mixed synapses.
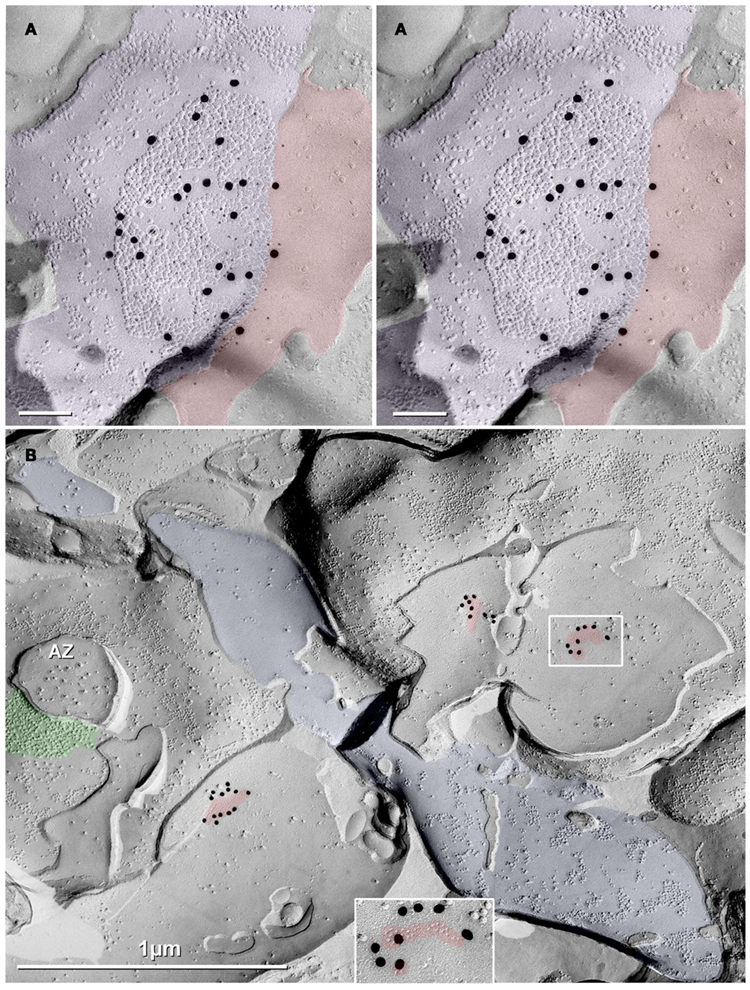
Figure 11. Images of freeze-fracture replica of immunogold labeled dendritic gap junctions in hippocampus. (A) Large reticular gap junction found between dendritic shafts of two probable interneurons in stratum oriens. It is labeled for Cx36 by ca. 88 6-nm gold beads and 26 18-nm gold beads. (B) Image of three Cx36-immunogold-labeled gap junctions between unidentified neuronal processes (axon terminals or dendrites). A nearby GABAergic synapse (green overlay) is on an unidentified cell process. The adjacent neuronal P-face (purple overlay) has the high density of IMPs associated with MF axon varicosities. Green overlay = GABA receptor 9-nm P-face IMPs. One of the gap junctions (box) is enlarged as an inset (bottom center). AZ, active zone of putative GABAergic synapse. Scale bars are 0.1 μm, unless otherwise indicated.
Gap Junctions in FRIL Replicas Were not Colocalized with GABAergic Synapses
Three closely spaced miniature “meandering” gap junctions (defined in Kamasawa et al., 2006) were found between a dendrite P-face and an E-face of an unidentified cell process (dendrite or axon terminal) approximately 0.5 μm from a GABAergic synapse, recognized by its distinctive 10-nm P-face IMPs (Kulik et al., 2006; Kasugai et al., 2010; Figure 11B; green overlay). (These P-face IMPs are to be contrasted with the equally distinctive 10-nm E-face IMPs of glutamatergic synapses.) Interestingly, the presynaptic active zones (AZ) of GABAergic synapses are characterized by multiple vesicle attachment sites having abundant 8-nm E-face IMPs, interspersed with 5–7 nm membrane pits. Regardless, by FRIL, none of 20 immunogold-labeled gap junctions were at identified GABAergic synapses, and at least 12 were at glutamatergic mixed synapses, with only two occurring at confirmed dendrodendritic appositions (Table 1). In all cases where Cx36-labeled gap junctions were found, these were either at confirmed glutamatergic synapses or at locations that lacked any markers for GABAergic synapses (e.g., clusters of 10-nm P-face IMPs or clusters of 9-nm E-face pits). Thus, by FRIL, we found no evidence for the rare GABAergic mixed synapses found between inhibitory interneurons (Fukuda and Kosaka, 2000).
Basis for Quantification of Glutamatergic Mixed Synapses vs. Unidentified Mixed Synapses vs. Purely Electrical Synapses
Overall, the 20 gap junctions found by FRIL ranged from 45 to 1140 connexons (most containing <200 connexons; Table 1), with the largest gap junction found between dendrites of putative interneurons in stratum oriens (Figure 11A), consistent with previous reports of relatively larger gap junctions on hippocampal parvalbumin-positive GABAergic interneurons (Kosaka and Hama, 1985). Cx36-containing gap junctions were found in all layers of the hippocampal formation: three near PSDs at mixed synapses, five additional near clusters of 10-nm E-face IMPs, eight with insufficient area to identify, and two additional at dendrodendritic appositions. Of the 20, four were in DG (from Figures 6A, 10, and 11B), three were in hilus (Figures 5B and 6), six were in stratum lucidum (Figures 4 and 5A,C; mapped in Figures 6A,B), five were in CA3 stratum oriens (Figures 3 and 12A), plus one in CA1 stratum radiatum and one in CA1 stratum oriens (see corresponding yellow dots in Figures 6A,B). The Table 1 also notes the anatomical locations of all neuronal gap junctions encountered and the basis for identifying the gap junctions as occurring near glutamate receptor-containing PSDs vs. near clusters of 10-nm E-face IMPs vs. at probable dendrodendritic electrical synapses vs. where neither neuron was identifiable.
Possible GABAergic Mixed Synapse Found in Thin-Sections
Fukuda and Kosaka (2000) provided convincing evidence for a few GABAergic mixed synapses linking hippocampal interneurons. We now provide tsTEM evidence for a small cluster of putative miniature gap junctions at a presumptive GABAergic mixed synapse on a CA3pyr (Figure 12, boxes and arrows). The CA3pyr dendrite was identified based on multiple spines projecting into multiple MF axon terminals (Figures 12A,B). The putative GABAergic terminal was identified by its content of characteristic small pleomorphic synaptic vesicles, as contrasted with the larger spherical vesicles in the MF terminal on the opposite side of the CA3pyr. To our knowledge, this represents the first putative GABAergic mixed synapse found on an identified principal cell (CA3pyr) anywhere in the mammalian neocortex. As has been proposed for excitatory glutamatergic mixed synapses (Pereda et al., 2003), the gap junctions may function to modulate the amount of GABA released at these rare inhibitory mixed synapses.
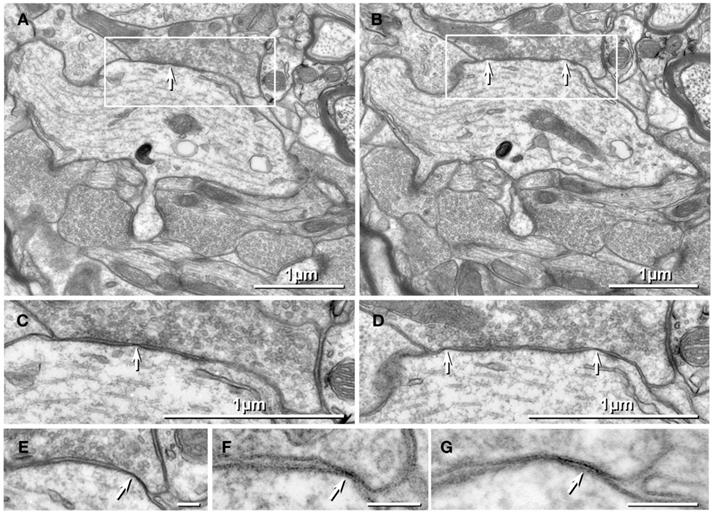
Figure 12. Images selected from serial-section electron micrographs showing gap junctions between a probable GABAergic inhibitory axon terminal on a CA3 pyramidal neuron dendrite. (A,B) Giant mossy fiber terminals also make asymmetric synapses onto the dendritic spines of this CA3 pyramidal neuron. One of two dendritic spines in this area is seen in two consecutive serial-sections (center). Boxes indicate areas shown at higher magnification, below. Arrows point to putative gap junctions. (C–G) Serial-section images of gap junctions (boxes) linking the CA3pyr dendrite with the putative GABAergic axon terminal, identified by its characteristic smaller (30–40 nm), flattened, pleomorphic synaptic vesicles. Gap junctions are marked with white arrows. Scale bars are 0.1 μm, unless otherwise indicated.
Discussion
Using tsTEM, FRIL TEM, and a new dye-coupling method, we describe widespread distribution of glutamatergic mixed synapses in the adult rat hippocampus, in part, supporting our recent physiological studies showing mixed electrical–chemical synaptic transmission from MF to CA3pyr (Vivar et al., 2012). First, following detection of a few MF axons that were dye-coupled to CA3pyr, particularly at thorny excrescences, we used serial-section tsTEM to demonstrate pentalaminar close appositions as presumptive gap junctions within glutamatergic MF terminals at thorny excrescences on CA3pyr spines in stratum lucidum, defining that subset as MF/CA3pyr glutamatergic mixes synapses. Second, by confocal “grid-mapped” freeze-fracture replica immunogold labeling (FRIL), we: (a) identified Cx36 as the primary connexin in 20 neuronal gap junctions in CA3, dentate gyrus, and hilus of adult rat hippocampus, (b) found that three of those 20 gap junctions were immediately adjacent to distinctive patches of 10-nm E-face IMPs that constitute the freeze-fracture correlate for the postsynaptic densities (PSDs) seen in conventional thin-section images of chemical synapses, thereby defining these as “mixed” (chemical plus electrical) synapses; (c) used immunogold labeling to identify virtually 100% of such E-face PSDs as containing either or both NMDA and AMPA glutamate receptor subunits, defining three of the gap junctions as present in glutamatergic mixed synapses, (d) showed that glutamatergic mixed synapses (including possible functionally mixed synapses) occurred on dendritic shafts and spines, some within stratum lucidum and stratum oriens, but others in hilus, dentate gyrus, and CA1, suggesting their widespread distribution throughout adult rat hippocampus, and (e) showed that distinctive clusters of 10-nm E-face IMPs, in some samples labeled for NR1 and/or AMPA glutamate receptors, were closely associated with four additional gap junctions, consistent with the identification of the IMP clusters as either extrasynaptic receptors or as AMPA receptor-containing puncta adherentia, both of which are abundant opposite MF terminals but have not been found by us or reported by others in interneurons. Finally, by tsTEM, we found one probable GABAergic mixed synapse on a CA3pyr dendrite, on the opposite side of the dendrite from one of its thorny excrescences.
These observations are consistent with reports that Cx36 is the only neuronal connexin protein that is strongly detectable in hippocampus (Condorelli et al., 2000). Although Cx30.2 expression markers have been reported in some GABAergic interneurons (Kreuzberg et al., 2008), to date, no reliable immunocytochemical evidence for Cx30.2 or any other connexin protein other than Cx36 has been reported in hippocampus. In that regard, we found only Cx36 and not Cx32 or Cx45 at neuronal gap junctions, whereas Cx32 was found much more abundantly and exclusively in oligodendrocyte gap junctions in the same replica. Data for limited or no Cx45 in hippocampal gap junctions are considered preliminary, and new experiments will be conducted using antibodies against Cx45 that we have shown to label about 10% of gap junctions in rat and mouse retina (Li et al., 2008).
Notably, none of the 20 FRIL-labeled gap junctions encountered were within GABAergic synapses that are defined by equally distinctive P-face IMP clusters that have been identified by SDS-FRL as GABA receptors (Kulik et al., 2006; Kasugai et al., 2010). Our data, obtained by searching for immunogold beads (rather than for large gap junctions) suggest that glutamatergic mixed synapses with small gap junctions are more abundant than either the larger dendrodendritic electrical synapses between interneurons (Kosaka, 1983; Kosaka and Hama, 1985; Fukuda and Kosaka, 2000) or the gap junctions at inhibitory GABAergic mixed synapses on interneurons (Fukuda and Kosaka, 2000).
Of the glutamatergic mixed synapses seen in this study, most could NOT be ascribed to MF terminals, consistent with the likelihood that many/most of these mixed synapses may represent glutamatergic axon terminals of interneurons, CA3pyr axon collaterals, or neurons of the perforant path. Finally, by confocal 3-D reconstruction of dye-filled CA3pyr, we found four LY-filled MF axons arising at giant boutons/thorny excrescences, consistent with dye-coupling at these glutamatergic mixed synapses. However, the low frequency of tracer-coupling (<1%) may be due in part to the properties of vertebrate gap junctions, which greatly restrict intercellular passage of LY (Srinivas et al., 1999) and other tracer dyes larger than ∼400 mw (Hu and Dahl, 1999), or to the use of lightly fixed hippocampal slices for improved cell imaging (rather than for the purpose of measuring dye-coupling). Moreover, the small size/few connexons of most of these neuronal gap junctions (half were between 25 and 150 connexons) may also limit the amount of dye that can be transferred and detected, even if Neurobiotin were to be used. Further, the possible low frequency at which gap junctions couple MF to CA3pyr, and the deafferentation and closing of connexon channels caused by the slicing procedure itself, are likely contributing factors to the limited number of dye-coupled MF-CA3pyr. Also relevant to this low dye-coupling ratio, only a small percentage of the few neuronal connexons in those junctions may be in an open conductive state in living neurons (Bukauskas et al., 2000), potentially further restricting dye transfer and electrophysiological detection, where only 5% of the recorded CA3pyr responded with electrical spikelets to MF activation (Vivar et al., 2012).
MF Mixed Synapses onto CA3pyr
Our tsTEM data provide evidence for gap junctions in a small fraction of MF terminals, supporting both detailed immunocytochemical evidence for Cx36 puncta at large VGLUT1-positive axon terminals concentrated in stratum lucidum of rat (but not mouse) ventral hippocampus (Nagy, 2012), as well as functionally characterized mixed electrical–chemical synapses between MF and CA3 pyramidal cells (Vivar et al., 2012). One functional consequence of mixed transmission might be related to the modulation of feed-forward inhibition. Indeed, granule cells (glutamatergic) activate interneurons, which, in turn, produce strong inhibition of CA3pyr (Mori et al., 2007). Thus, MF/CA3pyr gap junctions could ensure an effective activation of a selective set of CA3pyr, potentially bypassing the strong action of the interneuronal inhibitory circuit. On the other hand, mixed electrical-glutamatergic MF synapses onto interneurons could modulate the inhibitory action of the DG on CA3. This possibility, however, needs further investigation. Also, because a remarkable characteristic of DG neurons is their ability to convey analog signals from their dendrites to their MF terminals (Alle and Geiger, 2006), trans-synaptic analog transmission through mixed synapses at MF or other terminals could provide an effective means for graded, possibly bidirectional, synaptic communication; and this could be of particular importance for synapses with low release probability (Jonas et al., 1993; Jaffe and Gutierrez, 2007). In this regard, gap junctions may enhance cooperativity of glutamate release at MF or other glutamatergic mixed synapses.
Mixed Synapses between CA3 Pyramidal Neurons
Dye-coupling between living CA3 pyramidal cells and dentate granule cells was originally observed by MacVicar and Dudek(1980, 1982) using Lucifer Yellow. Our observation of close membrane appositions resembling gap junctions in a few thorny excrescences on CA3pyr proximal dendrites (Figure 2) might also account for the dye-coupling of adjacent CA3pyr observed by MacVicar and Dudek. In intracellular recordings in dentate granule cells, it was observed that fast prepotentials, or spikelets, could follow stimulation of the MFs, in media that blocked chemical synaptic transmission (MacVicar and Dudek, 1982). These observations also suggest the possibility that gap junctions at glutamatergic axon terminals may jointly couple to two nearby dendrites, thereby acting as “intermediaries” between two larger neurons (diagrammed in Figure 13). (These would augment the pathway proposed via gap junctionally coupled MF axons; Hamzei-Sichani et al., 2007.) A relatively few mixed synapses formed by MF terminals and varicosities may allow a single axon to establish electrical contacts with dendrites of several CA3pyr (Figure 13; see Vivar et al., 2012). Under physiological conditions, this “chaining” could play an important role in amplification of the effects of firing in single dentate granule cells by allowing the spread of action potentials or of subthreshold potentials from CA3pyr to CA3pyr via MF terminals. Precedence for this concept is provided in the lateral vestibular nucleus of the rat, where electrical coupling occurs between neurons that appear not to be directly connected by gap junctions; rather, the dendrites of different neurons locally form two or more mixed synapses with branches of the same presynaptic axon (Korn et al., 1973).
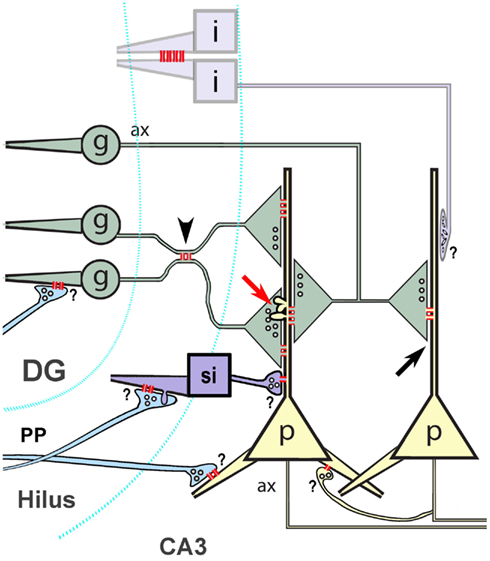
Figure 13. Schematic drawing of hippocampal principal neurons, the potential sources of glutamatergic axons innervating those cells, and potential sites for gap junctional coupling. In this study, we provided ultrastructural evidence for mixed chemical/electrical synapses between MF terminals at thorny excrescences (red arrow) and CA3pyr dendrite shaft synapses (arrows), as well as for mixed synapses from unidentified neurons throughout hippocampus (sites with “?”). Previously, others have shown gap junctions between dendrites of interneurons (top). ax, axon; g, DG granule cell; i, interneuron; p, CA3pyr; PP, perforant path axons; si, spiny interneuron.
Potential Relevance of Glutamatergic Mixed Synapses to Hippocampal Function and Dysfunction
The presence of small gap junctions at mixed synapses throughout adult rat hippocampus may have profound and lasting effects on the electrical and metabolic properties of coupled neurons and their synapses, as reported in the physiological studies of Vivar et al. (2012). It is possible that a spikelet preceding an EPSP can provide the added depolarization needed for an EPSP to reach threshold for action potential initiation. Also, retrograde sub- and suprathreshold electrical activity in the presynaptic boutons may enhance glutamate release at any or all of these mixed synapses. On the other hand, gap junctions may chemically couple multiple neurons, potentially enabling localized modulation by means of transfer of metabolites and second messengers, such as cyclic nucleotides and calcium ions. Such a process may provide an alternate or additional mechanism for neuronal communication and neuromodulation, complementing the classical retrograde chemical signaling conveyed, for instance, by cannabinoids (Lee et al., 2010; Uchigashima et al., 2011) and nitric oxide (Nicolarakis et al., 1994).
The different subregions of the hippocampus must be fine-tuned in order to maintain a proper excitatory-inhibitory balance; and inter-regional control of excitability (by fast electrical transmission) may be a mechanism that enables synchrony in pattern transmission. One of the major consequences of the disruption of such balance is the emergence of epileptic activity. In humans, seizures of focal origin - particularly complex partial seizures - have a propensity to originate in temporal lobe structures, including hippocampus, entorhinal cortex, and nearby regions, with seizure activity arising in the temporal lobe entering the hippocampus via the perforant path from the entorhinal cortex. Noteworthy, the CA3 region plays a crucial role in the generation of oscillatory activity and in the generation and propagation of seizures (Traub et al., 1996), and gap junction channels are strongly modulated by changes that epileptiform activity produces in the microenvironment (Traub et al., 2010).
Conclusion
Using tsTEM of CA3pyr thorny excrescences within stratum lucidum of adult rat hippocampus, we found five small close membrane appositions linking CA3pyr dendritic spines to mossy fiber axon terminals. These putative gap junctions represent the first reported between the two types of principal neurons of the hippocampus, and suggest the existence of glutamatergic mixed chemical/electrical synapses at this location. Using several antibodies against Cx36, we found 20 Cx36-immunogold-labeled gap junctions by FRIL, supporting Cx36 as the primary connexin at neuronal gap junctions throughout the hippocampus. Twelve neuronal gap junctions were at glutamatergic mixed synapses [defined by the presence of PSDs (three), presence in spines (seven), or presence in identified axon terminals (two); Table 1]. The two largest gap junctions were at dendrodendritic and presumptive dendrodendritic electrical synapses (i.e., they lacked evidence for PSDs or active zones). In stratum oriens, one gap junction labeled for Cx36 was found on the shaft of a spiny dendrite, immediately adjacent to an immunogold-labeled glutamate receptor PSD, defining this as a glutamatergic mixed synapse, possibly involving a spiny interneuron or a CA3pyr dendrite within the infra-pyramidal bundle. These data demonstrate widespread distribution of neuronal gap junctions in hippocampus, with most either at glutamatergic mixed synapses or in association with extrasynaptic glutamate receptor clusters. We also demonstrated dye-coupling of CA3pyr-to-MF axons in weakly fixed hippocampal slices, extending prior dye-coupling data also obtained using LY. These data provide direct anatomical evidence supporting our recent functional evidence for glutamatergic transmission from dentate granule cells to CA3pyr (Vivar et al., 2012), but more generally provide evidence for widespread glutamatergic mixed synapses throughout the hippocampal formation.
Author Contributions
John E. Rash, Farid Hamzei-Sichani, Ole P. Ottersen, Rafael Gutiérrez, and Roger D. Traub designed research; Farid Hamzei-Sichani conducted dye-coupling and TEM studies; John E. Rash, Kimberly G. V. Davidson, Farid Hamzei-Sichani, and Ole P. Ottersen conducted the FRIL studies; Farid Hamzei-Sichani prepared samples for thin-section TEM and William G. M. Janssen helped with the thin-section TEM studies; Thomas Yasumura prepared samples for FRIL; and John E. Rash, Farid Hamzei-Sichani, Kimberly G. V. Davidson, Rafael Gutiérrez, Ole P. Ottersen, Patrick R. Hof, and Roger D. Traub wrote the paper.
Conflict of Interest Statement
The authors declare that the research was conducted in the absence of any commercial or financial relationships that could be construed as a potential conflict of interest.
Acknowledgments
This study was supported by NIH grants NS044133 (Roger D. Traub); MH58911 (Patrick R. Hof); and NS044395, S10 RR08329, S10 RR015706 (John E. Rash), and by Consejo Nacional de Ciencia y Tecnología, Mexico, I020/193/10 FON.INST.-29-10 (Rafael Gutiérrez). We wish to thank Dr. Naomi Kamasawa for early examinations of several of the FRIL replicas and for useful comments on the manuscript.
Abbreviations
AMPA, α-amino-3-hydroxy-5-methyl-4-isoxazolepropionic acid; CA3pyr, Cornu Ammonis area 3 pyramidal cell; CNS, central nervous system; Cx36, connexin-36 (36 kDa); DG, dentate granule (cell or layer); E-face, extraplasmic leaflet; FRIL, freeze-fracture replica immunogold labeling; GluR1-4, AMPA-type glutamate receptors; IgG, immunoglobin-G; IMP, intramembrane particle/intramembrane protein; LE, labeling efficiency; LY, Lucifer yellow; MF, mossy fiber; NMDA, N-methyl-D-aspartate; NMDR1 or NR1, NMDA-type glutamate receptor; PBS; phosphate buffered saline; P-face, protoplasmic leaflet; PSD, postsynaptic densities; SDS-FRL, sodium dodecyl sulfate washed fracture replica label; SNR, signal-to-noise ratio; tsTEM, thin-section transmission electron microscopy.
References
Acsady, L., Kamondi, A., Sik, A., Freund, T., and Buzsaki, G. (1998). GABAergic cells are the major postsynaptic targets of mossy fibers in the rat hippocampus. J. Neurosci. 18, 3386–3403.
Alle, H., and Geiger, J. R. (2006). Combined analog and action potential coding in hippocampal mossy fibers. Science 311, 1290–1293.
Alvarez-Maubecin, V., Garcia-Hernandez, F., Williams, J. T., and Van Bockstaele, E. J. (2000). Functional coupling between neurons and glia. J. Neurosci. 20, 4091–4098.
Amaral, D. G. (1978). A golgi study of cell types in the hilar region of the hippocampus in the rat. J. Comp. Neurol. 182, 851–914.
Andrew, R. D., MacVicar, B. A., Dudek, F. E., and Hatton, G. I. (1981). Dye transfer through gap junctions between neuroendocrine cells of rat hypothalamus. Science 211, 1187–1189.
Belluardo, N., Mudo, G., Trovato-Salinaro, A., Le Gurun, S., Charollais, A., Serre-Beinier, V., Amato, G., Haefliger, J. A., Meda, P., and Condorelli, D. F. (2000). Expression of connexin36 in the adult and developing rat brain. Brain Res. 19, 121–138.
Bennett, M. V., and Zukin, R. S. (2004). Electrical coupling and neuronal synchronization in the mammalian brain. Neuron 41, 495–511.
Bukauskas, F. F., Jordan, K., Bukauskiene, A., Bennett, M. V., Lampe, P. D., Laird, D. W., and Verselis, V. K. (2000). Clustering of connexin 43-enhanced green fluorescent protein gap junction channels and functional coupling in living cells. Proc. Natl. Acad. Sci. U.S.A. 97, 2556–2561.
Challcroft, J. P., and Bullivant, S. (1970). An interpretation of liver cell membrane and junction structure based on observation of freeze-fracture replicas of both sides of the fracture. J. Cell Biol. 47, 49–60.
Chicurel, M. E., and Harris, K. M. (1992). Three-dimensional analysis of the structure and composition of CA3 branched dendritic spines and their synaptic relationships with mossy fiber boutons in the rat hippocampus. J. Comp. Neurol. 325, 169–182.
Ciolofan, C., Li, X., Olson, C., Kamasawa, N., Yasumura, T., Morita, M., Rash, J. E., and Nagy, J. I. (2006). Association of connexin36 and ZO-1 with ZO-2 and the MsY3 transcription factor ZO-1 associated nucleic acid-binding protein (ZONAB) in mouse retina. Neuroscience 140, 433–451.
Colwell, C. S. (2000). Rhythmic coupling among cells in the suprachiasmatic nucleus. J. Neurobiol. 43, 379–388.
Condorelli, D. F., Belluardo, N., Trovato-Salinaro, A., and Mudo, G. (2000). Expression of Cx36 in mammalian neurons. Brain Res. Brain Res. Rev. 32, 72–85.
Coppen, S. R., Kaba, R. A., Halliday, D., Dupont, E., Skepper, J. N., Elneil, S., and Severs, N. J. (2003). Comparison of connexin expression patterns in the developing mouse heart and human foetal heart. Mol. Cell. Biochem. 242, 121–127.
Deng, F., Price, M. G., Davis, C. F., Mori, M., and Burgess, D. L. (2006). Stargazin and other transmembrane AMPA receptor regulating proteins interact with synaptic scaffolding protein MAGI-2 in brain. J. Neurosci. 26, 7875–7884.
Dinchuk, J. E., Johnson, T. J. A., and Rash, J. E. (1987). Postreplication labeling of E-leaflet molecules: membrane immunoglobulins localized in sectioned labeled replicas examined by TEM and HVEM. J. Electron Microsc. Tech. 7, 1–16.
Do, V. H., Martinez, C. O., Martinez, J. L., and Derrick, B. E. (2002). Long-term potentiation in direct perforant path projections to the hippocampal CA3 region in vivo. J. Neurophysiol. 87, 669–678.
Dudek, F. E., Shao, L. R., and Rash, J. E. (2010). “Possible roles of nonsynaptic mechanisms in synchronization of epileptic seizures: potential antiepileptic targets?” in Epilepsy: Mechanisms, Models, and Translational Perspectives, eds M. R. Jong, S. Raman, and C. E. Stafstrom (Boca Raton: CRC Press), 209–228.
Eskandari, S., Wright, E. M., Kreman, M., Sterace, D. M., and Zampighi, G. A. (1998). Structural analysis of cloned plasma membrane proteins by freeze-fracture electron microscopy. Proc. Natl. Acad. Sci. U.S.A. 95, 11235–11240.
Friedrich, V. L. J., and Mugnaini, E. (1981). “Electron microscopy: preparation of neural tissues for electron microscopy,” in Neuroanatomical Tract Tracing Methods, eds L. Heimer, and M. J. Robards (New York: Plenum Press), 345–376.
Fujimoto, K. (1995). Freeze-fracture replica electron microscopy combined with SDS digestion for cytochemical labeling of integral membrane proteins. Application to the immunogold labeling of intercellular junctional complexes. J. Cell Sci. 108, 3443–3449.
Fukuda, T., and Kosaka, T. (2000). Gap junctions linking the dendritic network of GABAergic interneurons in the hippocampus. J. Neurosci. 20, 1519–1528.
Fukuda, T., Kosaka, T., Singer, W., and Galuske, R. A. W. (2006). Gap junctions among dendrites of cortical GABAergic neurons establish a dense and widespread intercolumnar network. J. Neurosci. 26, 3434–3443.
Furman, C. S., Gorelick-Feldman, D. A., Davidson, K. G. V., Yasumura, T., Neely, J. D., Agre, P., and Rash, J. E. (2003). Aquaporin-4 square array assembly: opposing actions of M1 and M23 isoforms. Proc. Natl. Acad. Sci. U.S.A. 100, 13609–13614.
Gonzales, R. B., DeLeon Galvan, C. J., Rangel, Y. M., and Claiborne, B. J. (2001). Distribution of thorny excrescences on CA3 pyramidal neurons in the rat hippocampus. J. Comp. Neurol. 430, 357–368.
Gruijters, W. T., Kistler, J., Bullivant, S., and Goodenough, D. A. (1987). Immunolocalization of MP70 in lens fiber 16-17-nm intercellular junctions. J. Cell Biol. 104, 565–572.
Gulley, R. L., Landis, D. M. D., and Reese, T. S. (1978). Internal organization of membranes at end bulbs of Held in the anteroventral cochlear nucleus. J. Comp. Neurol. 180, 707–742.
Haas, J. S., Zavala, B., and Landisman, C. E. (2011). Activity-dependent long-term depression of electrical synapses. Science 334, 389–393.
Hamzei-Sichani, F., Kamasawa, N., Janssen, W. G., Yasumura, T., Davidson, K. G., Hof, P. R., Wearne, S. L., Stewart, M. G., Young, S. R., Whittington, M. A., Rash, J. E., and Traub, R. D. (2007). Gap junctions on hippocampal mossy fiber axons demonstrated by thin-section electron microscopy and freeze fracture replica immunogold labeling. Proc. Natl. Acad. Sci. U.S.A. 104, 12548–12553.
Harris, K. M., and Landis, D. M. (1986). Membrane structure at synaptic junctions in area CA1 of the rat hippocampus. Neuroscience 19, 857–872.
Hoge, G., Davidson, K. G., Yasumura, T., Castillo, P. E., Rash, J. E., and Pereda, A. E. (2011). The extent and strength of electrical coupling between inferior olivary neurons is heterogeneous. J. Neurophysiol. 105, 1089–1101.
Hormuzdi, S. G., Filippov, M. A., Mitropoulou, G., Monyer, H., and Bruzzone, R. (2004). Electrical synapses: a dynamic signaling that shapes the activity of neuronal networks. Biochim. Biophys. Acta 1662, 113–137.
Hu, X., and Dahl, G. (1999). Exchange of conductance and gating properties between gap junction hemichannels. FEBS Lett. 451, 113–117.
Hudson, C. S., Rash, J. E., and Shinowara, N. (1981). “Freeze-fracture and freeze-etch methods,” in Current Trends in Morphological Techniques, Vol. II, ed. J. E. Johnson (Boca Raton: CRC Press), 183–217.
Jackson, M. B., and Scharfman, H. E. (1996). Positive feedback from hilar mossy cells to granule cells in the dentate gyrus revealed by voltage-sensitive dye and microelectrode recording. J. Neurophysiol. 76, 601–616.
Jaffe, D. B., and Gutierrez, R. (2007). Mossy fiber synaptic transmission: communication from the dentate gyrus to area CA3. Prog. Brain Res. 163, 109–132.
Jonas, P., Major, G., and Sakmann, B. (1993). Quantal components of unitary EPSCs at the mossy fibre synapse on CA3 pyramidal cells of rat hippocampus. J. Physiol. 472, 615–663.
Kamasawa, N., Furman, C. S., Davidson, K. G., Sampson, J. A., Magnie, A. R., Gebhardt, B. R., Kamasawa, M., Yasumura, T., Zumbrunnen, J. R., Pickard, G. E., Nagy, J. I., and Rash, J. E. (2006). Abundance and ultrastructural diversity of neuronal gap junctions in the OFF and ON sublaminae of the inner plexiform layer of rat and mouse retina. Neuroscience 142, 1093–1117.
Kamasawa, N., Sik, A., Morita, M., Yasumura, T., Davidson, K. G. V., Nagy, J. I., and Rash, J. E. (2005). Connexin47 and connexin32 in gap junctions of oligodendrocyte somata, myelin sheaths, paranodal loops, and Schmidt-Lanterman incisures: implications for ionic homeostasis and potassium siphoning. Neuroscience 136, 65–86.
Kasugai, Y., Swinny, J. D., Roberts, J. D., Dalezios, Y., Fukazawa, Y., Sieghart, W., Shigemoto, R., and Somogyi, P. (2010). Quantitative localisation of synaptic and extrasynaptic GABAA receptor subunits on hippocampal pyramidal cells by freeze-fracture replica immunolabelling. Eur. J. Neurosci. 32, 1868–1888.
Katsumaru, H., Kosaka, T., Heizmann, C. W., and Hama, K. (1988). Gap junctions on GABAergic neurons containing the calcium-binding protein parvalbumin in the rat hippocampus (CA1 region). Exp. Brain Res. 72, 363–370.
Kita, H., and Armstrong, W. (1991). A biotin-containing compound N-(2-aminoethyl) biotinamide for intracellular labeling and neuronal tracing studies: comparison with biocytin. J. Neurosci. Methods 37, 141–150.
Kondo, H., Lavenex, P., and Amaral, D. G. (2008). Intrinsic connections of the macaque monkey hippocampal formation: I. Dentate gyrus. J. Comp. Neurol. 511, 497–520.
Korn, H., Sotelo, C., and Crepel, F. (1973). Electronic coupling between neurons in the rat lateral vestibular nucleus. Exp. Brain Res. 16, 255–275.
Kosaka, T. (1983). Gap junctions between non-pyramidal cell dendrites in the rat hippocampus (CA1 and CA3 regions). Brain Res. 271, 157–161.
Kosaka, T., and Hama, K. (1985). Gap junctions between non-pyramidal cell dendrites in the rat hippocampus (CA1 and CA3 regions): a combined Golgi-electron microscopy study. J. Comp. Neurol. 231, 150–161.
Kreuzberg, M. M., Deuchars, J., Weiss, E., Schober, A., Sonntag, S., Wellershaus, K., Draguhn, A., and Willecke, K. (2008). Expression of connexin30.2 in interneurons of the central nervous system in the mouse. Mol. Cell. Neurosci. 37, 119–134.
Kulik, A., Vida, I., Fukazawa, Y., Guetg, N., Kasugai, Y., Marker, C. L., Rigato, F., Bettler, B., Wickman, K., Frotscher, M., and Shigemoto, R. (2006). Compartment-dependent colocalization of Kir3.2-Containing K+ Channels and GABAB receptors in hippocampal pyramidal cells. J. Neurosci. 26, 4289–4297.
Lee, S. H., Földy, C., and Soltesz, I. (2010). Distinct endocannabinoid control of GABA release at perisomatic and dendritic synapses in the hippocampus. J. Neurosci. 30, 7993–8000.
Li, X., Kamasawa, N., Ciolofan, C., Olson, C. O., Lu, S., Davidson, K. G. V., Yasumura, T., Shigemoto, R., Rash, J. E., and Nagy, J. I. (2008). Connexin45-containing neuronal gap junctions in rodent retina also contain connexin36 in both apposing hemiplaques, forming bi-homotypic gap junctions, with scaffolding contributed by zonula occludens-1. J. Neurosci. 28, 9769–9789.
MacVicar, B. A., and Dudek, F. E. (1980). Dye coupling between CA3 pyramidal cells in slices of rat hippocampus. Brain Res. 196, 494–497.
MacVicar, B. A., and Dudek, F. E. (1982). Electrotonic coupling between granule cells of rat dentate gyrus: physiological and anatomical evidence. J. Neurophysiol. 47, 579–592.
Masugi-Tokita, M., and Shigemoto, R. (2007). High-resolution quantitative visualization of glutamate and GABA receptors at central synapses. Cur. Opin. Neurobiol. 17, 387–393.
Masugi-Tokita, M., Tarusawa, E., Watanabe, M., Molnar, E., Fujimoto, K., and Shigemoto, R. (2007). Number and density of AMPA receptors in individual synapses in the rat cerebellum as revealed by SDS-digested freeze-fracture replica labeling. J. Neurosci. 27, 2135–2144.
Megías, M., Emri, Z., Freund, T. F., and Gulyás, A. I. (2001). Total number and distribution of inhibitory and excitatory synapses on hippocampal CA1 pyramidal cells. Neuroscience 102, 527–540.
Meier, C., Dermietzel, R., Davidson, K. G. V., Yasumura, T., and Rash, J. E. (2004). Connexin32-containing gap junctions in Schwann cells at the internodal zone of partial myelin compaction and in Schmidt-Lanterman incisures. J. Neurosci. 24, 3186–3198.
Mercer, A., Bannister, A. P., and Thomson, A. M. (2006). Electrical coupling between pyramidal cells in adult cortical regions. Brain Cell Biol. 35, 13–27.
Mori, M., Gahwiler, B. H., and Gerber, U. (2007). Recruitment of an inhibitory hippocampal network after bursting in a single granule cell. Proc. Natl. Acad. Sci. U.S.A. 104, 7640–7645.
Nagy, J. I. (2012). Evidence for connexin36 localization at hippocampal mossy fiber terminals suggesting mixed chemical/electrical transmission by granule cells. Brain Res. (in press).
Nagy, J. I., Dudek, F. E., and Rash, J. E. (2004). Update on connexins and gap junctions in neurons and glia in the mammalian central nervous system. Brain Res. Brain Res. Rev. 47, 191–215.
Nagy, J. I., Ionescu, A. V., Lynn, B. D., and Rash, J. E. (2003). Coupling of astrocyte connexins Cx26, Cx30, Cx43 to oligodendrocyte Cx29, Cx32, Cx47: implications from normal and connexin32 knockout mice. Glia 44, 205–218.
Nakajima, Y., Tuttle, R., Masuko, S., Betz, H., and Pfeiffer, F. (1987). Synapses on the Mauthner cell of the goldfish: thin section, freeze-fracture, and immunocytochemical studies. J. Electron Microsc. Tech. 6, 143–153.
Nicolarakis, P. J., Lin, Y. Q., and Bennett, M. R. (1994). Effect of nitric oxide synthase inhibition on long-term potentiation at associational-commissural and mossy fibre synapses on CA3 pyramidal neurones. Br. J. Pharmacol. 111, 521–524.
O’Brien, J., Nguyen, H. B., and Mills, S. L. (2004). Cone photoreceptors in bass retina use two connexins to mediate electrical coupling. J. Neurosci. 24, 5632–5642.
O’Brien, J. J., Li, W., Pan, F., Keung, J., O’Brien, J., and Massey, S. C. (2006). Coupling between A-type horizontal cells is mediated by connexin 50 gap junctions in the rabbit retina. J. Neurosci. 26, 11624–11636.
Ottersen, O. P., and Landsend, A. S. (1997). Organization of glutamate receptors at the synapse. Eur. J. Neurosci. 9, 2219–2224.
Pereda, A., O’Brien, J., Nagy, J. I., Bukauskas, F., Davidson, K. G., Kamasawa, N., Yasumura, T., and Rash, J. E. (2003). Connexin35 mediates electrical transmission at mixed synapses on Mauthner cells. J. Neurosci. 23, 7489–7503.
Pereda, A., Rash, J. E., Nagy, J. I., and Bennett, M. V. L. (2004). Dynamics of electrical transmission at club endings on the Mauthner cells. Brain Res. Brain Res. Rev. 47, 227–244.
Petralia, R. S., Wang, Y. X., and Wenthold, R. J. (2002). NMDA receptors and PSD-95 are found in attachment plaques in cerebellar granular layer glomeruli. Eur. J. Neurosci. 15, 583–587.
Phillips, T. E., and Boyne, A. F. (1984). Liquid nitrogen-based quick freezing: experiments with bounce-free delivery of cholinergic nerve terminals to a metal surface. J. Electron Microsc. Tech. 1, 9–29.
Rash, J. E., Davidson, K. G., Kamasawa, N., Yasumura, T., Kamasawa, M., Zhang, C., Michaels, R., Restrepo, D., Ottersen, O. P., Olson, C. O., and Nagy, J. I. (2005). Ultrastructural localization of connexins (Cx36, Cx43, Cx45), glutamate receptors and aquaporin-4 in rodent olfactory mucosa, olfactory nerve and olfactory bulb. J. Neurocytol. 34, 307–341.
Rash, J. E., Pereda, A., Kamasawa, N., Furman, C. S., Yasumura, T., Davidson, K. G., Dudek, F. E., Olson, C., Li, X., and Nagy, J. I. (2004). High-resolution proteomic mapping in the vertebrate central nervous system: close proximity of connexin35 to NMDA glutamate receptor clusters and co-localization of connexin36 with immunoreactivity for zonula occludens protein-1 (ZO-1). J. Neurocytol. 33, 131–151.
Rash, J. E., Dillman, R. K., Morita, M., Whalen, L. R., Guthrie, P. B., Fay-Guthrie, D., and Wheeler, D. W. (1995). “Grid-mapped freeze fracture: correlative confocal laser scanning microscopy and freeze-fracture electron microscopy of preselected cells in tissue slices,” in Rapid Freezing, Freeze Fracture, and Deep Etching, eds N. J. Severs, and D. M. Shotton (New York, NY: Wiley-Liss, Inc.), 127–150.
Rash, J. E., Duffy, H. S., Dudek, F. E., Bilhartz, B. L., Whalen, L. R., and Yasumura, T. (1997). Grid-mapped freeze-fracture analysis of gap junctions in gray and white matter of adult rat central nervous system, with evidence for a “panglial syncytium” that is not coupled to neurons. J. Comp. Neurol. 388, 265–292.
Rash, J. E., and Fambrough, D. (1973). Ultrastructural and electrophysiological correlates of cell coupling and cytoplasmic fusion during myogenesis in vitro. Develop. Biol. 30, 166–186.
Rash, J. E., and Giddings, F. D. (1989). Counting and measuring IMPs and pits: why accurate counts are exceedingly rare. J. Electron Microsc. Tech. 13, 204–215.
Rash, J. E., Graham, W. F., and Hudson, C. S. (1979). “Sources and rates of contamination in a conventional Balzers freeze-etch device,” in Freeze Fracture: Methods, Artifacts, and Interpretations, eds J. E. Rash, and C. S. Hudson (New York: Raven Press), 111–122.
Rash, J. E., Olson, C. O., Pouliot, W. A., Davidson, K. G., Yasumura, T., Furman, C. S., Royer, S., Kamasawa, N., Nagy, J. I., and Dudek, F. E. (2007). Connexin36 vs. connexin32, “miniature” neuronal gap junctions, and limited electrotonic coupling in rodent suprachiasmatic nucleus. Neuroscience 149, 350–371.
Rash, J. E., Staines, W. A., Yasumura, T., Patel, D., Furman, C. S., Stelmack, G. L., and Nagy, J. I. (2000). Immunogold evidence that neuronal gap junctions in adult rat brain and spinal cord contain connexin-36 but not connexin-32 or connexin-43. Proc. Natl. Acad. Sci. U.S.A. 97, 7573–7578.
Rash, J. E., and Yasumura, T. (1999). Direct immunogold labeling of connexins and aquaporin-4 in freeze-fracture replicas of liver, brain, and spinal cord: factors limiting quantitative analysis. Cell Tissue Res. 296, 307–321.
Rash, J. E., Yasumura, T., and Dudek, F. E. (1998). Ultrastructure, histological distribution, and freeze-fracture immunocytochemistry of gap junctions in rat brain and spinal cord. Cell Biol. Int. 22, 731–749.
Rash, J. E., Yasumura, T., Dudek, F. E., and Nagy, J. I. (2001). Cell-specific expression of connexins, and evidence for restricted gap junctional coupling between glial cells and between neurons. J. Neurosci. 21, 1983–2001.
Rodriguez, A., Ehlenberger, D., Kelliher, K., Einstein, M., Henderson, S. C., Morrison, J. H., Hof, P. R., and Wearne, S. L. (2003). Automated reconstruction of three-dimensional neuronal morphology from laser scanning microscopy images. Methods 30, 94–105.
Rodriguez, A., Ehlenberger, D. B., Dickstein, D. L., Hof, P. R., and Wearne, S. L. (2008). Automated three-dimensional detection and shape classification of dendritic spines from fluorescence microscopy images. PLoS ONE 3, e1997. doi: 10.1371/journal.pone.0001997
Rodriguez, A., Ehlenberger, D. B., Hof, P. R., and Wearne, S. L. (2006). Rayburst sampling, an algorithm for automated three-dimensional shape analysis from laser scanning microscopy images. Nat. Protoc. 1, 2152–2161.
Sattler, R., Xiong, Z., Lu, W. Y., MacDonald, J. F., and Tymianski, M. (2000). Distinct roles of synaptic and extrasynaptic NMDA receptors in excitotoxicity. J. Neurosci. 20, 22–33.
Scharfman, H. E. (1993). Spiny neurons of area CA3c in rat hippocampal slices have similar electrophysiological characteristics and synaptic responses despite morphological variation. Hippocampus 3, 9–28.
Scheiffele, P. (2003). Cell-cell signaling during synapse formation in the CNS. Annu. Rev. Neurosci. 26, 485–508.
Schlörmann, W., John, M., Steiniger, F., Westermann, M., and Richter, W. (2007). Improved antigen retrieval in freeze-fracture cytochemistry by evaporation of carbon as first replication layer. Histochem. Cell Biol. 127, 633–639.
Schmitz, D., Schuchmann, S., Fisahn, A., Draguhn, A., Buhl, E. H., Petrasch-Parwez, E., Dermietzel, R., Heinemann, U., and Traub, R. D. (2001). Axo-axonal coupling: a novel mechanism for ultrafast neuronal communication. Neuron 31, 831–840.
Shelton, E., and Mowczko, W. E. (1979). “Scanning electron microscopy of membrane blisters produced by glutaraldehyde fixation and stabilized by postfixation in osmium tetroxide,” in Freeze Fracture: Methods, Artifacts, and Interpretations, eds J. E. Rash, and C. S. Hudson (New York: Raven Press), 67–69.
Soriano, E., and Frotscher, M. (1993). Spiny nonpyramidal neurons in the CA3 region of the rat hippocampus are glutamate-like immunoreactive and receive convergent mossy fiber input. J. Comp. Neurol. 333, 435–448.
Sotelo, C., and Korn, H. (1978). Morphological correlates of electrical and other interactions through low-resistance pathways between neurons of the vertebrate central nervous system. Int. Rev. Cytol. 55, 67–107.
Srinivas, M., Rozental, R., Kojima, T., Dermietzel, R., Mehler, M., Condorelli, D. F., Kessler, J. A., and Spray, D. C. (1999). Functional properties of channels formed by the neuronal gap junction protein connexin36. J. Neurosci. 19, 9848–9855.
Staehelin, L. A. (1974). Structure and function of intercellular junctions. Int. Rev. Cytol. 39, 191–283.
Steere, R. L., and Moseley, M. (1969). New dimensions in freeze-etching. Proc. Electon Microsc. Soc. Am. 27, 202–203.
Takumi, Y., Ramirez-Leon, V., Laake, P., Rinvik, E., and Ottersen, O. P. (1999). Different modes of expression of AMPA and NMDA receptors in hippocampal synapses. Nat. Neurosci. 2, 618–624.
Tomita, S., Chen, L., Kawasaki, Y., Petralia, R. S., Wenthold, R. J., Nicoll, R. A., and Bredt, D. S. (2003). Functional studies and distribution define a family of transmembrane AMPA receptor regulatory proteins. J. Cell Biol. 161, 805–816.
Traub, R. D., Duncan, R., Russell, A. J. C., Baldeweg, T., Tu, Y., Cunningham, M. O., and Whittington, M. A. (2010). Spatiotemporal patterns of electrocorticographic very fast oscillations (>80 Hz) consistent with a network model based on electrical coupling between principal neurons. Epilepsia 51, 1587–1597.
Traub, R. D., Whittington, M. A., Buhl, E. H., LeBeau, F. E., Bibbig, A., Boyd, S., Cross, H., and Baldeweg, T. (2001). A possible role for gap junctions in generation of very fast EEG oscillations preceding the onset of, and perhaps initiating, seizures. Epilepsia 42, 153–170.
Traub, R. D., Whittington, M. A., Colling, S. B., Buzsaki, G., and Jefferys, J. G. (1996). Analysis of gamma rhythms in the rat hippocampus in vitro and in vivo. J. Physiol. 493, 471–484.
Tuttle, R., Masuko, S., and Nakajima, Y. (1986). Freeze-fracture study of the large myelinated club ending synapse on the goldfish Mauthner cell: specialized reference to the quantitative analysis of gap junctions. J. Comp. Neurol. 246, 202–211.
Uchigashima, M., Yamazaki, M., Yamasaki, M., Tanimura, A., Sakimura, K., Kano, M., and Watanabe, M. (2011). Molecular and morphological configuration for 2-arachidonoylglycerol-mediated retrograde signaling at mossy cell-granule cell synapses in the dentate gyrus. J. Neurosci. 31, 7700–7714.
Valentine, R. C., and Green, N. M. (1967). Electron microscopy of an antibody-hapten complex. J. Mol. Biol. 27, 615–617.
Vivar, C., Traub, R. D., and Gutierrez, R. (2012). Mixed electrical-chemical transmission between hippocampal mossy fibers and pyramidal cells. Eur. J. Neurosci. 35, 76–82.
Keywords: CA3, dentate gyrus, interneuron, pyramidal neuron, principal cell, mossy fiber, gap junction
Citation: Hamzei-Sichani F, Davidson KGV, Yasumura T, Janssen WGM, Wearne SL, Hof PR, Traub RD, Gutiérrez R, Ottersen OP and Rash JE (2012) Mixed electrical–chemical synapses in adult rat hippocampus are primarily glutamatergic and coupled by connexin-36. Front. Neuroanat. 6:13. doi: 10.3389/fnana.2012.00013
Received: 28 December 2010; Accepted: 19 April 2012;
Published online: 15 May 2012.
Edited by:
Ryuichi Shigemoto, National Institute for Physiological Sciences, JapanReviewed by:
Javier DeFelipe, Cajal Institute, SpainRichard J. Weinberg, University of North Carolina, USA
Copyright: © 2012 Hamzei-Sichani, Davidson, Yasumura, Janssen, Wearne, Hof, Traub, Gutiérrez, Ottersen and Rash. This is an open-access article distributed under the terms of the Creative Commons Attribution Non Commercial License, which permits non-commercial use, distribution, and reproduction in other forums, provided the original authors and source are credited.
*Correspondence: John E. Rash, Department of Biomedical Sciences, Colorado State University, Fort Collins, CO 80523, USA. e-mail: john.rash@colostate.edu
†Present address: Roger D. Traub, IBM T.J. Watson Research Center, Yorktown Heights, NY 10598, USA.
‡Farid Hamzei-Sichani and Kimberly G. V. Davidson have contributed equally to this work.
#Deceased September 4, 2009.