Fluorescent labeling of dendritic spines in cell cultures with the carbocyanine dye “DiI”
 Connie Cheng
 Olivia Trzcinski
 Laurie C. Doering
- Department of Pathology and Molecular Medicine, McMaster University, Hamilton, ON, Canada
Analyzing cell morphology is a key component to understand neuronal function. Several staining techniques have been developed to facilitate the morphological analysis of neurons, including the use of fluorescent markers, such as DiI (1,1′-dioctadecyl-3,3,3′,3′-tetramethylindocarbocyanine perchlorate). DiI is a carbocyanine membrane dye that exhibits enhanced fluorescence upon insertion of its lipophilic hydrocarbon chains into the lipid membrane of cells. The high photostability and prominent fluorescence of the dye serves as an effective means of illuminating cellular architecture in individual neurons, including detailed dendritic arborizations and spines in cell culture and tissue sections. Here, we specifically optimized a simple and reliable method to fluorescently label and visualize dissociated hippocampal neurons using DiI and high-resolution confocal microscopic imaging. With high efficacy, this method accurately labels neuronal and synaptic morphology to permit quantitative analysis of dendritic spines. Accurate imaging techniques of these fine neuronal specializations are vital to the study of their morphology and can help delineate structure-function relationships in the central nervous system.
Introduction
Dendritic spines are small protrusions from the dendritic shaft of various types of neurons that act as the postsynaptic compartments of most excitatory synapses in the central nervous system (CNS). They are known to play a significant role in neuronal plasticity and synaptic integration through their ability to undergo structural rearrangements during development (Rochefort and Konnerth, 2012). Morphological features of spines, such as size, shape, and density, have been shown to reflect important synaptic functional attributes and the potential for plasticity. Spine morphology is highly variable and has been classified into several different types based on their structure: filopodia, long-thin, stubby, and mushroom-shaped (Yuste, 2011; Figure 1). On the same dendrite, a continuum of shapes can be observed and the morphology can change rapidly through activity-dependent and -independent mechanisms (Penzes and Rafalovich, 2012). The density of spines can be understood in terms of the levels of connectivity within the neuronal network, as well as the integrative capabilities of the neuron. As such, abnormalities in the shape and density of spines can often signify an aspect of disease (Fiala et al., 2002). Therefore, structural classifications of spines with accurate labeling and imaging techniques can spawn vital information on neuronal function, and in turn offer insight into the etiology of neurological diseases (Lin and Koleske, 2010; Penzes et al., 2011).
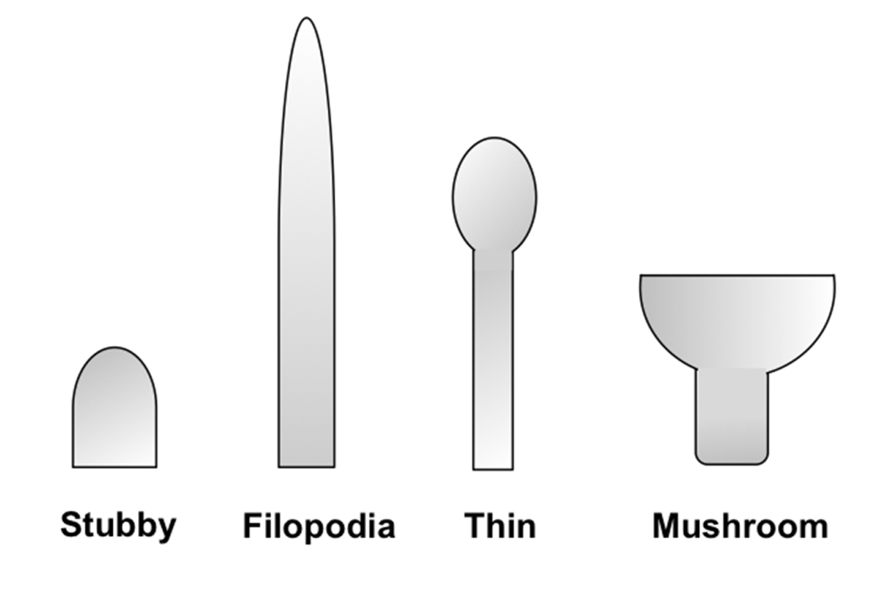
FIGURE 1. Schematic representation of spine morphologies. Spines display a wide diversity of morphologies. They are commonly classified into four different categories (as illustrated from left to right): stubby, filopodia, thin, and mushroom-shaped. Stubby spines are devoid of a neck and are particularly prominent during postnatal development. Thin spines are most common and have a thin, long neck and a small bulbous head, whereas mushroom spines are those with a large head. Lastly, dendritic filopodia are typically longer, normally have no clear head, and often represent immature spines.
For over a century, the Golgi staining technique has been the classical method for neuronal labeling and dendritic spine analysis (Neely et al., 2009). Although Golgi staining has played a crucial role in the advancement of anatomical neurobiology, a major drawback of this technique is that the tissue fixation used for Golgi is often incompatible with other methods to study morphology, such as immunocytochemistry. Furthermore, the Golgi method provides inconsistent, low frequency staining, which results in the insecurity of a selection bias (Staffend and Meisel, 2011b). In addition, long periods of time (often weeks) are required to reach the final product. Due to the lack of specificity and reproducibility, researchers have decreasingly relied on this technique (Ranjan and Mallick, 2010). A variety of methods have been developed to circumvent some of the limitations of the Golgi staining, most notably through the use of fluorescent markers. In fact, labeling cells and tissues with fluorescent markers is one of the most widely used methods of cellular examination employed to date (Colello et al., 2012). Fluorescence immunolabeling is a highly specific method that is commonly used to visualize cell structure, facilitate protein localization, and study cell interactions at the light microscopic level. Some of these other methods used to evaluate cellular morphology include various commercially available dyes, fluorochrome labeled antibodies, and genetically encoded fluorescent proteins, such as green fluorescent protein (GFP; Staffend and Meisel, 2011a). Specifically with GFP, transgenic animals and cultured cells can be designed to drive fluorescent expression under specific promoters (Malinow et al., 2010). However, although GFP-labeling provides great specificity of fluorescent expression, a similar end result can be accomplished in a much shorter time frame and with far fewer supplies/materials by employing lipophilic DiI labeling.
The fluorescent lipophilic dye dialkylcarbocyanine, also called “DiI” [1,1′-dioctadecyl-3,3,3′,3′-tetramethylindocarbocyanine perchlorate; DiIC18(3)], has traditionally been used for anterograde and retrograde neuronal tracing (Honig and Hume, 1989). Structurally, the molecule consists of a hydrophilic head that lies above the plasma cell membrane and two lipophilic hydrocarbon side chains that insert into the hydrophobic plasma membrane (Bruce et al., 1997; Figure 2). The orange-red fluorescent dye is weakly fluorescent until it is incorporated into the membrane. DiI partitions and diffuses through the cell membrane to sufficiently highlight dendrites and their spinous protrusions, providing a well-defined outline of neuronal processes (Sherazee and Alvarez, 2013). The fluorescence provided by the carbocyanine dye is very strong and robust and withstands illumination, e.g., in a confocal laser scanning microscope (Gan et al., 1999; Lanciego and Wouterlood, 2011). Typical applications of this technique include the study of neuronal morphology during development and altered development in neurological disorders (Bruce et al., 1997; Braun and Segal, 2000; Smith et al., 2009; Li et al., 2010). This dye can be applied to a variety of cell types, live or fixed tissue (Terasaki et al., 1994), as well as diverse species such as rodents, primates, and zebrafish (Gan et al., 2000; O’Brien and Lummis, 2006; Seabold et al., 2010; Arsenault and O’Brien, 2013). In slice preparations, DiI labeling is commonly known as “DiOlistic labeling,” in which beads coated with the lipophilic dye are “ballistically” ejected with a gene gun on to brain tissue (Lo et al., 1994). This technique has been developed as a useful and simple means to label neurons and glia in their entirety, unveiling even the most detailed structures, such as dendritic spines (Haber et al., 2006). To date, very few procedures are available that allow the direct application of DiI to cultured cells. Our protocol described here results in high quality staining and imaging of dissociated cell cultures with lipophilic DiI labeling and confocal microscopy. This visualization approach enables a detailed analysis of dendritic spine morphology, density, topographical distribution, and connectivity.
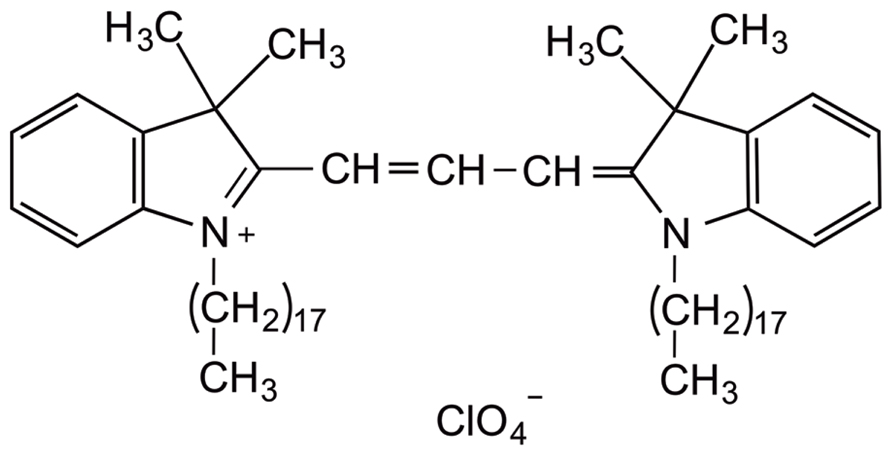
FIGURE 2. Chemical structure of carbocyanine dye DiI. The fluorescent lipophilic dye “DiI” [1,1′-dioctadecyl-3,3,3′,3′ tetramethylindocarbocyanine perchlorate; DiIC18(3)] is commonly used as an anterograde and retrograde neuronal tracer. DiI labels cell membranes by inserting its two long (C18 carbon) hydrocarbon chains into the lipid bilayers.
Materials and Methods
Animals
An in-house mouse breeding colony was used to generate primary cell cultures of hippocampal neurons for DiI labeling. The mice were housed and bred at the McMaster University Central Animal Facility. All experiments complied with the guidelines set out by the Canadian Council on Animal Care and were approved by the McMaster Animal Research Ethics Board.
Cell Culture Preparation
Primary hippocampal neurons were generated as previously described by our laboratory with minor modifications (Jacobs and Doering, 2010). Briefly, four embryonic day 15–17, E15–17 (day of sperm plug counted as E1) pups were randomly removed from the pregnant dam. Hippocampi were dissected in calcium and magnesium-free Hank’s buffered salt solution (CMF-HBSS) and tissues were digested with 2.5% trypsin for 15 min in a 37°C water bath. The supernatant was removed, rinsed with three successive washes of CMF-HBSS and re-suspended in neural growth media (NGM) containing 1X Neurobasal (Life Technologies), 0.5 mM GlutaMAX (Life Technologies), and 2.0% B-27 Supplement (Invitrogen). Cells were subsequently plated on 12 mm glass coverslips (Bellco) in 24 multi-well plates, pre-treated with 1 mg/mL poly-L-lysine (Sigma) and 10 μg/ml laminin (Life Technologies), immediately after dissociation at a density of 16,000 cells per well. Neurons were subsequently incubated at 37°C with 5% CO2 and remained in culture for 17 days in vitro (DIV) to allow for the development and maturation of dendritic spines. Every 3–4 days, the neurons were fed by replacing one half of the media with fresh NGM.
DiI Labeling Procedure
Dendritic spines were identified using the well-characterized fluorescent marker DiI. Application of the dye was adapted from established protocols (Westmark et al., 2011). The neurons were fixed with freshly prepared 2.0% paraformaldehyde (PFA) for 15 min. Each well was gently washed with Dulbecco’s phosphate-buffered saline (DPBS, Invitrogen). For the staining, the wells were aspirated and sprinkled with solid DiI crystals (Life Technologies-Molecular Probes, Cat. #D-3911). Approximately 2–3 crystals were added using a pair of fine forceps to each well. To prevent dehydration of the cells, a small amount of DPBS was dispensed to the edge of the wells. Special care was taken to deliver the smallest crystals to prevent clumping of the dye. The neurons were exposed to the crystals for 10 min on an orbital shaker set at a low speed. The shaker motion ensured that the crystals were adequately distributed to augment complete staining across the surface of the coverslip. The plate was then removed from the shaker and the wells were copiously washed with DPBS to remove all crystals. This procedure was repeated until no crystals were visible. The cells were incubated with DPBS in the dark overnight at room temperature to allow for the diffusion of the dye. The following day, the coverslips were rinsed three times with dH20 for 5–10 min each. The coverslips were removed, completely air-dried, and mounted on slides with prolong gold antifade (Life Technologies – Molecular Probes). Coverslips cured for a minimum of 24 h to allow the liquid mountant to form a semi-rigid gel. Cells were visualized after 72 h from the time of the initial staining to allow the dye to fully migrate across neuronal membranes and diffuse throughout the neurons to highlight spine structures. All images were taken within 7–10 days after coverslipping to minimize fading.
Confocal Imaging
Visual imaging of the dendritic spines was acquired using a Zeiss 510 confocal laser-scanning microscope (LSM 510). All images were taken using a 63×/1.2 water immersion lens. A 543 nm Hene-1 Rhodamine laser was utilized to visualize the fluorescence emitted by DiI. To view the specimen with reflected fluorescent light, the reflector turret was programmed to position F set 15 in correlation to the Rhodamine laser, and the single-track configuration was chosen. We used 1024 × 1024 pixels for image size and set the scan speed at a setting of 4. Scan direction and line averaging were also adjusted to a setting of 4. The pinhole diameter was configured to 1 Airy unit (124 μm). Series stacks were collected from the bottom to the top covering all dendrites and protrusions, with an optical slice thickness of 0.5–1 μm. The resulting images (4–6) were then reconstructed to identify hidden protrusions according to Z-stack projections of the maximum intensity.
Dendritic Spine Analysis
ImageJ software (http://rsbweb.nih.gov/ij/) was used for viewing the confocal images and for spine quantification. In order to increase the magnification for a better view of the spines without loss of image quality, the resolution of the stack image was increased by a factor of 5 in the X and Y directions with the plug-in Transform J Scale (Pop et al., 2012). The length of a spine was obtained by drawing a line from its emerging point on the dendrite to the tip of its head. Approximately, 8–10 neurons selected at random were analyzed per condition across two coverslips. Density and morphology of spines were scored in dendritic segments 10 μm in length. Spines were classified into one of the four morphological subtypes: filopodial, thin, stubby, and mushroom-shaped.
Statistical Analysis
Spine density was determined by summing the total number of spines per dendritic segment length and then calculating the average number of spines per 10 μm. These values were then averaged to yield the number of spines per 10 μm for each animal. Statistics were performed using GraphPad Prism. Differences were detected with a one-way analysis of variance. Following one-way ANOVA, post hoc differences were resolved using the Tukey’s multiple comparison test. A p-value of <0.05 was considered significant. All values are expressed as mean ± SEM.
Results
Laboratory Prepared Versus Commercial Grade Paraformaldehyde Fixation
To determine an optimized protocol for the fluorescent visualization of dendritic spines with the carbocyanine dye in dissociated cultures, we explored patterns of DiI labeling in neurons fixed with laboratory prepared paraformaldehyde (PFA) in PBS or commercial grade formalin at 2.0%. When the cells were prepared with either fixative, the DiI crystals diffused efficiently along the neuronal membranes to permit the effective visualization of the somas and dendritic processes studded with delicate spinous protrusions. However, the laboratory prepared PFA samples facilitated enhanced staining and clarity for the crisp visualization of spines compared to formalin. Commercial grade formalin which typically contains ~10–15% methanol prevents polymerization in storage. Given that DiI is soluble in organic solvents, the use of methanol or acetone fixation is highly discouraged. Taking this into consideration, we investigated whether neurons fixed with acetone would be ineffectively labeled with DiI. We were able to confirm that cells had adhered to the coverslip (as visualized by DAPI) when fixed with acetone, but as expected, the dye unsuccessfully permeated throughout the dendritic segments (results not shown). Additionally, it is important to note that the use of any fixative stored for extended periods of time may risk decomposition and in turn yield poor fixation of samples.
Variations in Paraformaldehyde Concentration Alter Clarity
Labeling neurons with the fluorescent marker DiI provides a well-defined outline of neuronal cell bodies, dendritic arbors (Figure 3), and spine subtypes (Figure 4). To determine the most effective conditions for optimal DiI diffusion along dendritic segments, we tested varying concentrations of laboratory PFA fixative at 1.5, 2.0, and 4.0%. Qualitative analysis revealed that the structural integrity of dendrites could not be maintained with a higher concentration of fixation. Namely, the extent of dendritic branching visualized by the dye in cells fixed with 4.0% PFA was hindered compared to cells fixed using 1.5 or 2.0% PFA (Figure 5A). In some cases, dye diffusion was limited to where the dye was applied, such that distal dendrites and spines on the same neuron were often not stained, including other neighboring neurons. Swelling of the dendrites (varicosities) were also apparent often hindering accurate measurements of the spines (Figure 5B). For instance, the dye would aggregate along the dendrites at spines, causing them to appear “stubby” in shape. However, this often yielded a false morphological classification, as the shape or appearance of spines was attributed to the dye’s inability to completely diffuse throughout the neuronal processes. Furthermore, higher concentrations of PFA typically yielded autofluorescence, which may explain the diffuse background fluorescence coupled with reduced illumination of the spines evident in Figure 5B. Ultimately, we discovered that laboratory prepared PFA utilized at lower concentrations was most effective, as it encouraged complete filling of the dendritic segments and finer processes through rapid dye diffusion. Specifically, the images obtained with 1.5–2.0% PFA delineated fine dendritic spines in comparable detail to the traditional Golgi staining method (Figures 5C–F). Hence, optimal fixation can greatly improve the quality of DiI neuronal labeling.
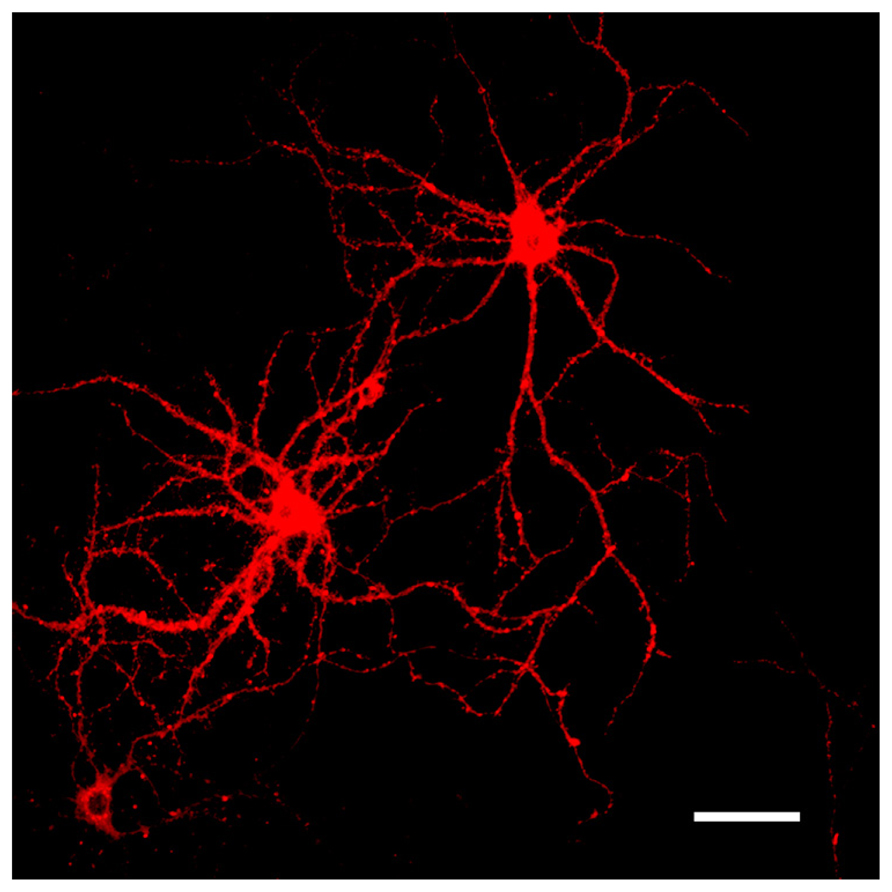
FIGURE 3. Representative images of DiI labeled neurons. DiI highlighting the dendritic complexity and topographical connectivity of neurons. Dendritic arbors and spines are sufficiently filled and visualized in their entirety with the fluorescent dye. Scale bar = 50 μm.
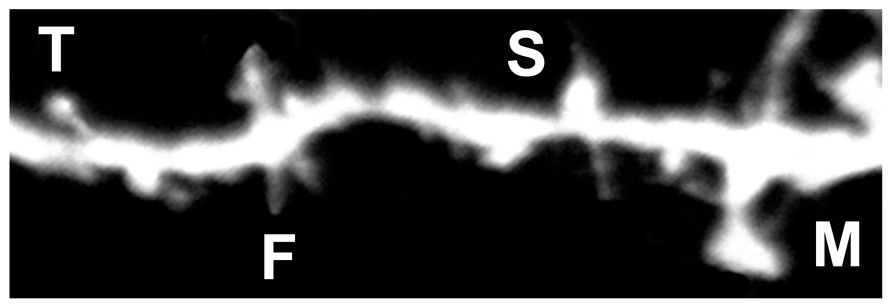
FIGURE 4. Representative image of DiI labeled spines. Filopodia-like (F), long-thin (T), stubby (S), and mushroom (M) spines are identified based on structural measures.

FIGURE 5. DiI labeled neurons fixed with varying concentrations of paraformaldehyde (PFA). Application of DiI crystals on fixed cells produces a very high degree of detail. (A) Cell fixed with 4.0% PFA. (B) The use of 4.0% PFA fixative significantly compromises DiI diffusion through the dendrites. Multiple varicosities are highlighted along the dendrite and spines are poorly resolved. (C) Cell fixed with 2.0 % PFA. (D) The use of 2.0% PFA generates high quality DiI labeling of spines. Various subtypes of spines are evident along the dendritic segment. (E) Cell fixed with 1.5% PFA. (F) The use of 1.5% PFA yields comparable results to the use of 2.0% fixative. Fine, thin filopodial projections are resolved. Scale bar (A,C,E) = 50 μm; Scale bar (B,D,F) = 5 μm.
Quantitative Analysis of Spine Density and Morphology
Spine density and morphology were assessed in DiI labeled neurons fixed with varying concentrations of PFA (1.5, 2.0, and 4.0%) to investigate dye permeability. No significant differences in spine density were observed in neurons fixed with either 1.5 or 2.0% PFA (Figure 6). Alternatively, neurons fixed with 2.0% PFA yielded significantly higher spine densities when compared to neurons fixed with 4.0% PFA (*p = 0.012), potentially as a result of increased DiI labeling. These findings suggest and reinforce our observation that the use of a stronger fixative hinders the dye’s ability to completely diffuse and fill fine processes, like spines. Notably, despite the appearance of an increased proportion of “stubby” spines in neurons fixed with a higher concentration of fixative (Figure 5B), no significant differences resulted in any of the comparisons made in the composition of spine morphologies with varying concentrations of fixative (results not shown). Still, our recommendation holds that initial fixation with milder concentrations of PFA fixative at 1.5–2.0% generates the most consistent and superior results.
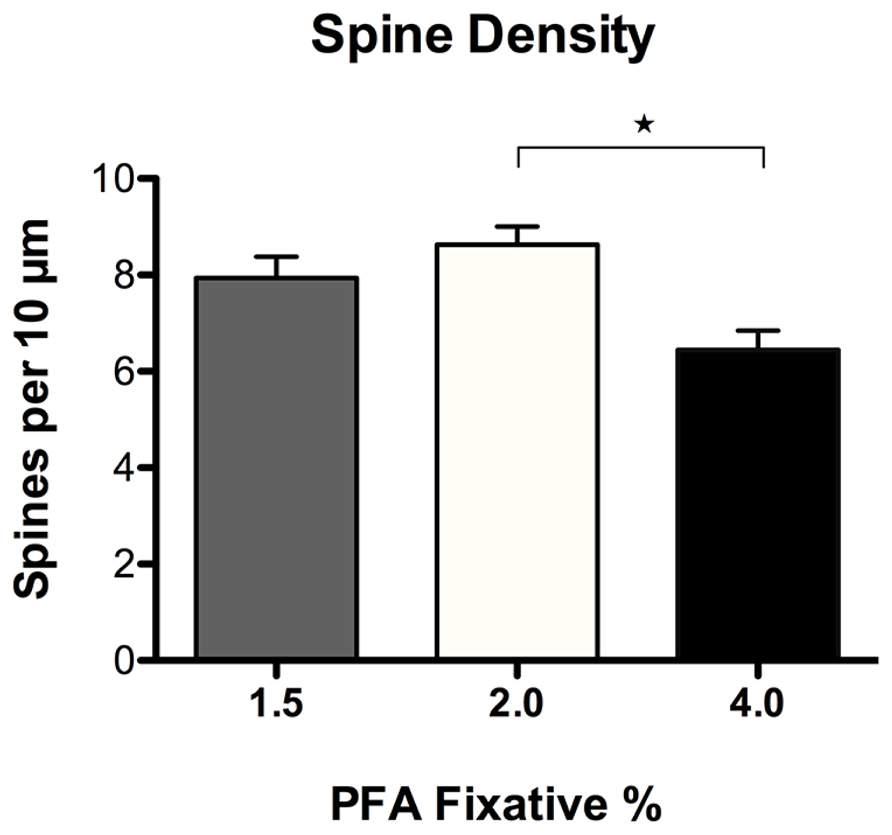
FIGURE 6. Spine density analysis of DiI labeled neurons fixed with varying concentrations of paraformaldehyde (PFA). No significant differences in spine density were observed in neurons fixed with 1.5% or 2.0% PFA. Neurons fixed with 2.0% PFA yielded significantly higher spine densities when compared to neurons fixed with 4.0% PFA (*p < 0.05).
Summary of Findings
The results obtained through this protocol demonstrated that DiI staining in cells prepared with a lower percentage of fixative yielded the highest quality of images. The detailed images generated by this protocol allow us to perform an accurate quantitative analysis of spine structures and spine density. Stubby and mushroom shaped dendritic spines were most evident by their prominent “pinhead” fluorescence directly on the dendritic spine when positioned perpendicularly to the plane of focus on the microscope slide, or as thick protrusions off the dendrite. Filopodial dendritic spines were most visible when their characteristic long and thin protrusions extended upward/downward from the dendritic branch. The high-resolution images that can be obtained using this technique allow us to delineate spine morphologies to provide insight into the areas of synapse formation, development, and remodeling in the CNS.
Discussion
Several methods to study neuronal structure include histological stains, immunocytochemistry, electroporation of fluorescent dyes, transfection of fluorescent constructs, and the Golgi technique. Although the Golgi technique offers valuable results, this method is time consuming and often lacks reliability. DiI fluorescence labeling has gained popularity, but optimization of the method is essential to accurately quantitate and evaluate fine neuronal structures such as dendritic spines. In lieu of the DiOlistic literature, reported protocols differ vastly for cell/tissue fixation, dye delivery, and diffusion times, with no report on the impact that these different conditions have on the quality of labeling. Here, we outlined a procedure that allows the direct application of DiI to cells in culture; a method that has not been thoroughly explored. The present protocol sought to define the optimal conditions for the fluorescent illumination of individual neurons, including the soma, dendritic arborizations, and spines in cell culture through the use of confocal microscopy. Confocal microscopic analysis of fluorescently labeled neurons has improved resolution of dendritic morphology and has been suggested to provide a more accurate measurement of spines (Lee et al., 2009; Schmitz et al., 2011). Among the most important parameters of this procedure, fixation properties impacted the success of labeling most profoundly.
Optimization of Cell Fixation
Amid the DiOlistic literature, a variety of fixation conditions have been reported that produce acceptable levels of DiI labeling. The use of 4.0% PFA is most commonly reported by standard immunohistochemical and immunocytochemical protocols, while many DiI labeling protocols indicate the use of both 1.5 or 4.0% PFA (i.e., Kim et al., 2007; Staffend and Meisel, 2011b; Westmark et al., 2011). To explore this range, we compared the image quality of neurons obtained from 1.5, 2.0, and 4.0% concentrations of fixative. The use of 4.0% PFA fixative significantly compromised DiI diffusion through the dendritic processes (Figure 5B). This was apparent by reduced image quality due to increased background fluorescence and inconsistent labeling. However, fixation with both 1.5 and 2.0% PFA yielded similar results with superior diffusion of the lipophilic dye DiI along the neuronal membranes (Figures 5C–F). We determined this to be a significant finding since 4.0% PFA has been reported to yield successful results in both tissue slices and cell culture labeling. We discovered that a milder concentration of PFA fixative increased the extent of DiI diffusion, resulting in complete visualization of dendrites and spines. A higher concentration of fixative may interfere and prevent the dye from penetrating the membrane. We strived to further augment our cell fixation technique through a direct comparison of the effectiveness of using freshly prepared laboratory PFA versus commercially produced formalin. Utilization of 1.5–2.0% laboratory PFA produced images with higher clarity and less background fluorescence. The use of commercially -produced formalin (containing methanol) may have adversely impacted the labeling. When evaluating spine density, we found that milder fixation conditions with 2.0% PFA more effectively incorporated DiI into the spines than their 4.0% PFA counterpart. With the use of a weaker fix, more spines were resolved and identified, resulting in an increase in spine density. Together, our results suggest the use of 1.5–2.0% freshly prepared buffered PFA as the superior fixative. As a precaution, utilizing 2.0% (rather than 1.5%) PFA fixative ensures that the cells are effectively fixed and adhered to the coverslip.
Dendritic Order of Analysis
To quantitatively analyze the dendritic spines, we utilized confocal imaging of the cells. The resolution obtained with the confocal microscope permitted the study of individual spines. However, Z stack images with a step interval of 0.5–1 μm supplemented each XY image for accurate spine quantification. The sides of the dendrite were meticulously examined for vertical protrusions stretching upward and downward off the dendrite in addition to the spines extending upward toward the observer. At higher magnification, we were able to morphologically classify some of the dendritic protrusions. However, the spines that extended vertically toward the observer were difficult to morphologically classify from an aerial perspective. Additionally, extra care was taken while examining possible protrusions positioned on the dendritic trunk that extended vertically upward toward the observer; filopodia and thin shaped spines were likely to exhibit less fluorescence in comparison to stubby and mushroom-shaped counterparts, due to less absorption of the dye with reduced surface volume. This point was particularly significant in accurately deciphering the morphology of spines. Moreover, the aggregation of overlapping dendritic processes and complex branching/arborization at times hindered the accurate evaluation of spines. For instance, the areas of the dendritic trunk located closer to the soma-exhibited extreme intertwining with numerous surrounding dendrites that complicated the isolation and differentiation of spines. Additionally, swellings of the dendritic trunk tended to conceal the presence of shorter spines even with a detailed analysis using a series of Z stack images.
Providing that spine density may vary across different order dendrites (primary, secondary, tertiary, etc.), systematic sampling of dendritic order is necessary when analyzing spine density and morphology. Branch ordering schemes are frequently used, wherein the dendrites emerging from the cell soma are primary, their first branches are secondary and so on, with increasing order until the tips are reached. Branches may also vary in diameter. The total number of images collected will depend on the experimental requirements and the degree of variability within a neuron, and across neurons and animals (Ruszczycki et al., 2012). For the purpose of this study, image collection was restricted to the three-dimensional structure of secondary and tertiary dendrites. These parameters were consciously considered to improve accuracy in conducting spine measurements (Rosenzweig and Wojtowicz, 2011). Differences in spine measurements on different order dendrites could potentially draw further insight on neural connectivity in the brain.
Optimization of DiI Delivery
Less than optimal cellular DiI labeling can be attributed to a variety of sources. For troubleshooting purposes, the most common problems, probable causes, and solutions are outlined in Table 1.
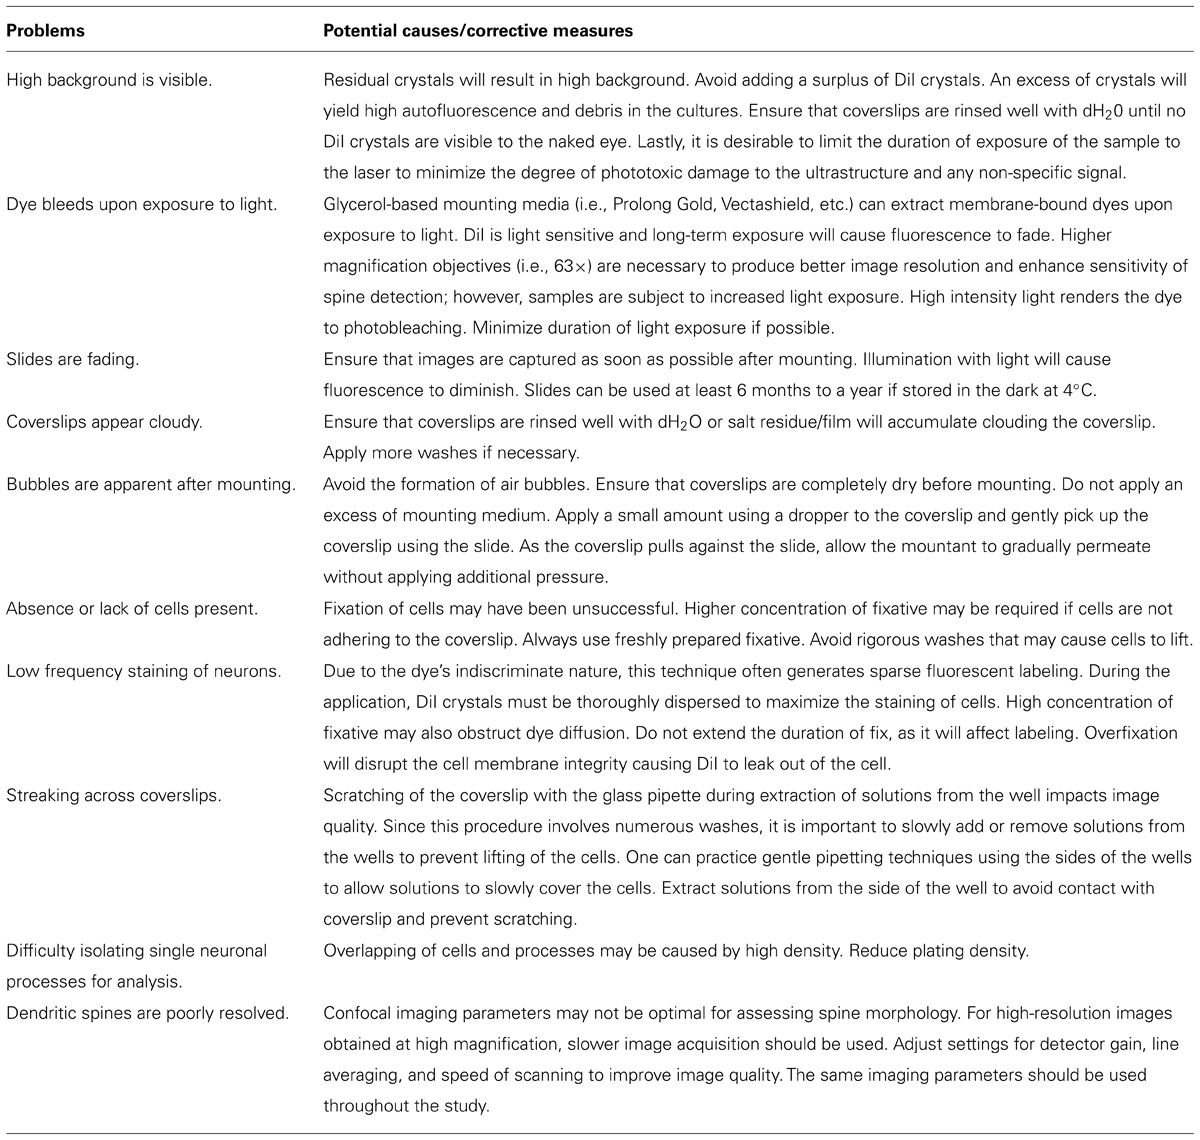
TABLE 1. Troubleshooting guide for optimal DiI labeling.
Possible Limitations of this Method
Although this approach has proven to be effective, it is important to address some of the limitations to the technique. For instance, DiI labeling can be highly variable, because dye crystal size, density, and penetration are all very difficult factors to control. Despite the majority of cells being labeled, the application of extracellular solid DiI crystals often restricted complete staining of all neurons in its entirety within a culture well. Dye diffusion was constrained to neurons that were in close proximity to the crystals, whereas more distal neurons or terminal branches were not prominently stained or filled in. As such, this method is most appropriate for the structural analysis of dendritic spines rather than a comprehensive analysis of dendritic arborization. While these methods produce an accurate analysis on a single-cell resolution, extrapolating the acquired data to a larger neuronal population might prove inaccurate if the staining technique selectively labels only subsets of neurons. Additional selection bias might also occur in these cases if the researcher chooses to measure “convenient” cells, which are visualized more clearly and without overlap with other neurons. Therefore, it is of the utmost importance to ensure that cultures are grown at a sufficient density that limits overlapping processes and permits the isolation of single entities (spines). By using the appropriate concentration of fixative, this can ensure that most neuronal processes are appropriately filled in. Additionally, ensuring that the solid dye is thoroughly distributed during the staining procedure will highlight a larger proportion of cells per sample in a well.
As the morphology of dendritic spines is highly variable, a sufficient sampling size is essential for statistical analysis. With light or epifluorescent microscopy, the dendrite may obscure spines that lie above or below the visual plane, such that only spines extending laterally can be accurately counted. However, this problem cannot be completely remedied by three-dimensional confocal microscopy. To compensate, some studies have applied correction factors for hidden spines (Bannister and Larkman, 1995).
It is also desirable to combine DiI labeling with immunofluorescent staining, with which detailed co-localization can be analyzed using confocal microscopy. The two techniques, however, are often incompatible because Triton X-100, a conventional detergent or permeabilization reagent commonly used to enhance antibody penetration into tissues or cells, causes diffusion of DiI from the labeled structures (Neely et al., 2009). Since Triton X-100 solubilizes lipid molecules almost indiscriminately, it is most likely that Triton X-100 compromises the retention of DiI in the cellular membrane. As a result, the dye potentially leaks out of the membrane, causing the label to disappear after immunocytochemical procedures (Matsubayashi et al., 2008). The ability to perform a dual staining would better allow investigators to phenotypically characterize DiI labeled cells. In future studies, it may be valuable to couple DiI labeling with other fluorescent markers and/or antibodies to immunocytochemically identify other target proteins of interest within a neuron. Investigating appropriate fluorescent immunocytochemical protocols compatible with DiI neuronal tracing would serve as a useful tool in advancing current labeling techniques.
Advantages of this Method
The methods outlined above using DiI labeling offer a reproducible protocol that have several advantages for the analysis of dendritic spine structures using photostable fluorescence. This protocol offers the opportunity to systematically analyze a large quantity of dendritic spines in high detail, which cannot be achieved through other neuronal identification methods. Furthermore, fluorescent staining and imaging by confocal microscopy yields a series of Z stack images. Many densely compacted segments and spine protrusions often do not lie favorably in the plane of focus and thus cannot be reliably counted. Confocal imaging with DiI labeling permits the sensitive detection of spines by allowing a three-dimensional analysis of spines and dendrites to avoid over and undersaturated pixels. This is particularly vital for the identification of spinous protrusions on the dendritic trunk and most proximal to the soma, and in other cases where there is frequent overlap of the dendrites. Finally, our described methods are simple and do not increase the costs or effort, and more importantly do not compromise the integrity of the neurons or the quality of the staining and data acquired. Taken together, these characteristics make DiI a powerful technique for identifying and studying early events in neuronal development and brain connectivity with significant implications for neurological disease.
Conclusion
Given the literature, a variety of labeling and diffusion conditions can produce acceptable levels of fluorescent DiI labeling. Our goal was to explicitly compare specific methodological components to determine a DiI protocol that produces reproducible staining of dendritic spines in dissociated cultures. Dendritic spines are significant structural substrates for synaptic plasticity and in turn are vital to the proper functioning of the CNS. Spines serve as a functional integrative unit whose morphology is tightly correlated with its function. An accurate neuronal visualization method provides valuable insight into the neuronal organization of various areas of the brain. Importantly, our technique provides an alternative method to fluorescently label neurons and dendritic spines in a convenient and cost-effective manner. Our technique further enables the analysis of dendritic spine topographical distribution, quantitative measurement, and morphological assessment. Such findings would be highly applicable to the investigation of the etiology of various disorders in which spine pathology has been implicated. As a result, this accurate, efficient, and economical staining technique has a wide array of applicability to the study of CNS neurobiology in normal and disease states.
Conflict of Interest Statement
The authors declare that the research was conducted in the absence of any commercial or financial relationships that could be construed as a potential conflict of interest.
Acknowledgments
This work has been supported by NSERC (National Sciences and Engineering Research Council of Canada) and the Fondation Jérôme LeJeune (Paris).
References
Arsenault, J., and O’Brien, J. A. (2013). Optimized heterologous transfection of viable adult organotypic brain slices using an enhanced gene gun. BMC Res. Notes 6:544. doi: 10.1186/1756-0500-6-544
Bannister, N. J., and Larkman, A. U. (1995). Dendritic morphology of CA1 pyramidal neurones from the rat hippocampus: II. Spine distributions. J. Comp. Neurol. 360, 161–171. doi: 10.1002/cne.903600112
Braun, K., and Segal, M. (2000). FMRP involvement in formation of synapses among cultured hippocampal neurons. Cereb. Cortex 10, 1045–1052. doi: 10.1093/cercor/10.10.1045
Bruce, L. L., Christensen, M. A., and Fritzsch, B. (1997). Electron microscopic differentiation of directly and transneuronally transported DiI and applications for studies of synaptogenesis. J. Neurosci. Methods 73, 107–112. doi: 10.1016/S0165-0270(96)02218-2
Colello, R. J., Tozer, J., and Henderson, S. C. (2012). Confocal laser scanning microscopic photoconversion: a new method to stabilize fluorescently labeled cellular elements for electron microscopic analysis. Curr. Protoc. Neurosci. Chap. 2, Unit 2.15. doi: 10.1002/0471142301.ns0215s58
Fiala, J. C., Spacek, J., and Harris, K. M. (2002). Dendritic spine pathology: cause or consequence of neurological disorders? Brain Res. Rev. 39, 29–54. doi: 10.1016/S0165-0173(02)00158-3
Gan, W. B., Bishop, D. L., Turney, S. G., and Lichtman, J. W. (1999). Vital imaging and ultrastructural analysis of individual axon terminals labeled by iontophoretic application of lipophilic dye. J. Neurosci. Methods 93, 13–20. doi: 10.1016/S0165-0270(99)00096-5
Gan, W. B., Grutzendler, J., Wong, W. T., Wong, R. O., and Lichtman, J. W. (2000). Multicolor “DiOlistic” labeling of the nervous system using lipophilic dye combinations. Neuron 27, 219–225. doi: 10.1016/S0896-6273(00)00031-3
Haber, M., Zhou, L., and Murai, K. K. (2006). Cooperative astrocyte and dendritic spine dynamics at hippocampal excitatory synapses. J. Neurosci. 26, 8881–8891. doi: 10.1523/JNEUROSCI.1302-06.2006
Honig, M. G., and Hume, R. I. (1989). Dil and diO: versatile fluorescent dyes for neuronal labelling and pathway tracing. Trends Neurosci. 12, 333–341. doi: 10.1016/0166-2236(89)90040-4
Jacobs, S., and Doering, L. C. (2010). “Primary dissociated astrocyte and neuron co-culture,” in Protocols for Neural Cell Culture, 4th Edn, ed. L. C. Doering (Berlin: Springer), 269–283.
Kim, B. G., Dai, H. N., McAtee, M., Vicini, S., and Bregman, B. S. (2007). Labeling of dendritic spines with the carbocyanine dye DiI for confocal microscopic imaging in lightly fixed cortical slices. J. Neurosci. Methods 162, 237–243. doi:10.1016/j.jneumeth.2007.01.016
Lanciego, J. L., and Wouterlood, F. G. (2011). A half century of experimental neuroanatomical tracing. J. Chem. Neuroanat. 42, 157–183. doi: 10.1016/j.jchemneu.2011.07.001
Lee, P.-C., Chang, H.-M., Lin, C.-Y., Chiang, A.-S., and Ching, Y.-T. (2009). Constructing neuronal structure from 3D confocal microscopic images. J. Med. Biol. Eng. 29, 1–6.
Li, M., Cui, Z., Niu, Y., Liu, B., Fan, W., Yu, D., et al. (2010). Synaptogenesis in the developing mouse visual cortex. Brain Res. Bull. 81, 107–113. doi: 10.1016/j.brainresbull.2009.08.028
Lin, Y.-C., and Koleske, A. J. (2010). Mechanisms of synapse and dendrite maintenance and their disruption in psychiatric and neurodegenerative disorders. Annu. Rev. Neurosci. 33, 349–378. doi: 10.1146/annurev-neuro-060909-153204
Lo, D. C., McAllister, A. K., and Katz, L. C. (1994). Neuronal transfection in brain slices using particle-mediated gene transfer. Neuron 13, 1263–1268. doi: 10.1186/1756-0500-6-544
Malinow, R., Hayashi, Y., Maletic-Savatic, M., Zaman, S. H., Poncer, J.-C., Shi, S.-H., et al. (2010). Introduction of green fluorescent protein (GFP) into hippocampal neurons through viral infection. Cold Spring Harb. Protoc. 2010:pdb.prot5406. doi: 10.1101/pdb.prot5406
Matsubayashi, Y., Iwai, L., and Kawasaki, H. (2008). Fluorescent double-labeling with carbocyanine neuronal tracing and immunohistochemistry using a cholesterol-specific detergent digitonin. J. Neurosci. Methods 174, 71–81. doi: 10.1016/j.jneumeth.2008.07.003
Neely, M. D., Stanwood, G. D., and Deutch, A. Y. (2009). Combination of diOlistic labeling with retrograde tract tracing and immunohistochemistry. J. Neurosci. Methods 184, 332–336. doi: 10.1016/j.jneumeth.2009.08.016
O’Brien, J. A., and Lummis, S. C. R. (2006). Diolistic labeling of neuronal cultures and intact tissue using a hand-held gene gun. Nat. Protoc. 1, 1517–1521. doi: 10.1038/nprot.2006.258
Penzes, P., Cahill, M. E., Jones, K. A., VanLeeuwen, J.-E., and Woolfrey, K. M. (2011). Dendritic spine pathology in neuropsychiatric disorders. Nat. Neurosci. 14, 285–293. doi: 10.1038/nn.2741
Penzes, P., and Rafalovich, I. (2012). Regulation of the actin cytoskeleton in dendritic spines. Adv. Exp. Med. Biol. 970, 81–95. doi: 10.1007/978-3-7091-0932-8_4
Pop, A. S., Levenga, J., Esch, C. E. F., Buijsen, R. A. M., Nieuwenhuizen, I. M., Li, T., et al. (2012). Rescue of dendritic spine phenotype in Fmr1 KO mice with the mGluR5 antagonist AFQ056/Mavoglurant. Psychopharmacology doi: 10.1007/s00213-012-2947-y
Ranjan, A., and Mallick, B. N. (2010). A modified method for consistent and reliable Golgi-cox staining in significantly reduced time. Front. Neurol. 1:157. doi: 10.3389/fneur.2010.00157
Rochefort, N. L., and Konnerth, A. (2012). Dendritic spines: from structure to in vivo function. EMBO Rep. 13, 699–708. doi: 10.1038/embor.2012.102
Rosenzweig, S., and Wojtowicz, J. M. (2011). Analyzing dendritic growth in a population of immature neurons in the adult dentate gyrus using laminar quantification of disjointed dendrites. Front. Neurosci. 5:34. doi: 10.3389/fnins.2011.00034
Ruszczycki, B., Szepesi, Z., Wilczynski, G. M., Bijata, M., Kalita, K., Kaczmarek, L., et al. (2012). Sampling issues in quantitative analysis of dendritic spines morphology. BMC Bioinformatics 13:213. doi: 10.1186/1471-2105-13-213
Schmitz, S. K., Hjorth, J. J., Joemai, R. M. S., Wijntjes, R., Eijgenraam, S., de Bruijn, P., et al. (2011). Automated analysis of neuronal morphology, synapse number and synaptic recruitment. J. Neurosci. Methods 195, 185–193. doi: 10.1016/j.jneumeth.2010.12.011
Seabold, G. K., Daunais, J. B., Rau, A., Grant, K. A., and Alvarez, V. A. (2010). DiOLISTIC labeling of neurons from rodent and non-human primate brain slices. J. Vis. Exp. 6:pii 2081. doi: 10.3791/2081
Sherazee, N., and Alvarez, V. A. (2013). DiOlistics: delivery of fluorescent dyes into cells. Methods Mol. Biol. 940, 391–400. doi: 10.1007/978-1-62703-110-3_28
Smith, D. L., Pozueta, J., Gong, B., Arancio, O., and Shelanski, M. (2009). Reversal of long-term dendritic spine alterations in Alzheimer disease models. Proc. Natl. Acad. Sci. U.S.A. 106, 16877–16882. doi: 10.1073/pnas.0908706106
Staffend, N. A., and Meisel, R. L. (2011a). DiOlistic labeling in fixed brain slices: phenotype, morphology, and dendritic spines. Curr. Protoc. Neurosci. Chap. 2, Unit 2.13. doi: 10.1002/0471142301.ns0213s55
Staffend, N. A., and Meisel, R. L. (2011b). DiOlistic labeling of neurons in tissue slices: a qualitative and quantitative analysis of methodological variations. Front. Neuroanat. 5:14. doi: 10.3389/fnana.2011.00014
Terasaki, M., Slater, N. T., Fein, A., Schmidek, A., and Reese, T. S. (1994). Continuous network of endoplasmic reticulum in cerebellar Purkinje neurons. Proc. Natl. Acad. Sci. U.S.A. 91, 7510–7514.
Westmark, C. J., Westmark, P. R., O’Riordan, K. J., Ray, B. C., Hervey, C. M., Salamat, M. S., et al. (2011). Reversal of fragile X phenotypes by manipulation of AβPP/Aβ levels in Fmr1KO mice. PLoS ONE 6:e26549. doi: 10.1371/journal.pone.0026549
Keywords: DiI, carbocyanine dye, dendritic spine, morphology, confocal microscopy, paraformaldehyde, neuronal function
Citation: Cheng C, Trzcinski O and Doering LC (2014) Fluorescent labeling of dendritic spines in cell cultures with the carbocyanine dye “DiI.” Front. Neuroanat. 8:30. doi: 10.3389/fnana.2014.00030
Received: 31 January 2014; Accepted: 20 April 2014;
Published online: 09 May 2014.
Edited by:
Ruth Benavides-Piccione, Cajal Institute, SpainReviewed by:
Noritaka Ichinohe, National Institute of Neuroscience – National Center of Neurology and Psychiatry, JapanTom Reese, National Institutes of Health, USA
Copyright © 2014 Cheng, Trzcinski and Doering. This is an open-access article distributed under the terms of the Creative Commons Attribution License (CC BY). The use, distribution or reproduction in other forums is permitted, provided the original author(s) or licensor are credited and that the original publication in this journal is cited, in accordance with accepted academic practice. No use, distribution or reproduction is permitted which does not comply with these terms.
*Correspondence: Laurie C. Doering, Department of Pathology and Molecular Medicine, McMaster University, 1280 Main Street West, Hamilton, ON L8S 4K1, Canada e-mail: doering@mcmaster.ca