Searching for learning-dependent changes in the antennal lobe: simultaneous recording of neural activity and aversive olfactory learning in honeybees
- 1 Centre de Recherches sur la Cognition Animale, Université de Toulouse, UPS, Toulouse, France
- 2 Centre de Recherches sur la Cognition Animale, CNRS, Toulouse, France
Plasticity in the honeybee brain has been studied using the appetitive olfactory conditioning of the proboscis extension reflex, in which a bee learns the association between an odor and a sucrose reward. In this framework, coupling behavioral measurements of proboscis extension and invasive recordings of neural activity has been difficult because proboscis movements usually introduce brain movements that affect physiological preparations. Here we took advantage of a new conditioning protocol, the aversive olfactory conditioning of the sting extension reflex, which does not generate this problem. We achieved the first simultaneous recordings of conditioned sting extension responses and calcium imaging of antennal lobe activity, thus revealing on-line processing of olfactory information during conditioning trials. Based on behavioral output we distinguished learners and non-learners and analyzed possible learning-dependent changes in antennal lobe activity. We did not find differences between glomerular responses to the CS+ and the CS− in learners. Unexpectedly, we found that during conditioning trials non-learners exhibited a progressive decrease in physiological responses to odors, irrespective of their valence. This effect could neither be attributed to a fitness problem nor to abnormal dye bleaching. We discuss the absence of learning-induced changes in the antennal lobe of learners and the decrease in calcium responses found in non-learners. Further studies will have to extend the search for functional plasticity related to aversive learning to other brain areas and to look on a broader range of temporal scales.
Introduction
A general question in the study of associative learning and memory is how stimulus-specific and outcome-related information is stored in the nervous system. Neural correlates of memory traces are difficult to delimit because changes in neural activity resulting from even simple learning forms may be distributed among different structures and regions of the brain. This renders difficult the definition of which traces are important for the expression of behavior, at which time they are operative and how they relate to each other (Thompson et al., 1986; Squire, 1987). Even more difficult is the technical challenge of visualizing the neural activity corresponding to a memory trace while simultaneously recording behavioral responses revealing this memory trace (Gottfried et al., 2002).
Invertebrate models are especially suited to tackle this challenge because they learn and memorize relevant information of their environments and because their nervous systems present a reduced number of neurons accessible to different recording techniques (Giurfa, 2007a; Menzel et al., 2007). Both levels of analysis can be combined as invertebrates are robust enough to facilitate parallel access to behavioral responses and neural recordings using various invasive techniques (Giurfa, 2007a).
A standard invertebrate model for the study of learning and memory is the honeybee Apis mellifera. This insect exhibits a rich behavioral repertoire, in which learning and memory play a fundamental role in a natural context (Menzel and Giurfa, 2001; Giurfa, 2007b). The study of honeybee learning benefited from careful anatomical and physiological descriptions of the honeybee nervous system (Menzel, 1999, 2001) and from a conditioning protocol that reproduces in the laboratory the natural situation of olfactory learning in a foraging context. The protocol exploits the fact that hungry bees exhibit, even when they are harnessed, an unconditioned response (UR), the proboscis extension reflex (PER), triggered by stimulation of their antennae with sucrose solution (Takeda, 1961; Bitterman et al., 1983). Sucrose acts, therefore, as an unconditioned stimulus (US) replacing nectar reward. Presentation of a neutral odor does not elicit PER in naïve bees; however, pairing the odor and sucrose reward results in the establishment of an associative link between both stimuli so that the odor becomes a conditioned stimulus (CS) capable of eliciting PER after successful learning (conditioned response or CR). Neural pathways for CS (olfactory pathway) and US processing (sucrose pathway) have been partially characterized in the honeybee brain so that olfactory PER conditioning allows recording of behavioral performances (PER) and of neural activity in the bee brain, usually before and after conditioning.
The olfactory pathway (CS pathway) has been well described in honeybees: axons of olfactory receptor neurons located on each antenna project to the antennal lobes where they synapse with approximately 4000 local interneurons and 800 projection neurons. Each antennal lobe is made of 166 glomeruli, which are the contact sites of these different neuron classes. Projection neurons convey the processed information via two principal tracts to higher brain structures, the mushroom bodies and the lateral horn. The sugar pathway (US pathway) is less known. Sucrose gustatory receptors located on gustatory appendages of the head (i.e., antennae and mouth pieces) send their projections to the subesophagic ganglion (de Brito Sanchez et al., 2007). Activity of a neuron whose cell body is located in the subesophagic ganglion – the VUMmx1 neuron (from Ventral Unpaired Median neuron 1 of the maxillary neuromere) – is thought to represent the neural correlate of sucrose reward (Hammer, 1993). This neuron arborizes in the antennal lobes, the calyces of the mushroom bodies and the lateral horn, which constitute sites of convergence between CS and US pathways.
In the honeybee, optophysiological recordings of neural activity based on imaging of intracellular calcium levels have been particularly useful to study learning-induced modifications in two of these convergence sites, the antennal lobe and the mushroom bodies (antennal lobe: Faber et al., 1999; Sandoz et al., 2003; Peele et al., 2006; Fernandez et al., 2009; mushroom bodies: Faber and Menzel, 2001; Szyszka et al., 2005, 2008). In the antennal lobe, odors give rise to odor-specific glomerular activation patterns (Joerges et al., 1997) that are conserved between individuals (Galizia et al., 1999a; Sachse et al., 1999). Learning-dependent changes of such patterns have been found in different variants of the olfactory conditioning of PER (Faber et al., 1999; Sandoz et al., 2003; Fernandez et al., 2009). Basically, learning leads to a decorrelation of the glomerular patterns corresponding to the odors that need to be discriminated. However, a recent work, using a different staining technique, could not replicate some of these findings (Peele et al., 2006). These studies suffered from an important limitation, which is the impossibility of recording simultaneously calcium activity and PER as a readout of learning success. Such a dual recording is especially difficult because proboscis extension involves a set of muscles placed under the brain so that their contraction during PER induces brain movements that prevent recording calcium signals. This is why studies on learning-dependent neural plasticity in the antennal lobe had to record behavioral responses independently of imaging recordings (i.e., before or after conditioning but never during it).
This problem could be overcome by the advent of a new conditioning protocol in which this problem is absent. In this novel protocol, bees learn to associate an odor (CS) with a mild electric shock (US) eliciting the UR of the sting extension reflex (SER) (Vergoz et al., 2007; Giurfa et al., 2009). Bees learn the association between the odor and the shock and then respond to the odor with a SER (CR). Learning is indeed aversive as shown by the fact that bees trained in this way and transferred to the operant context of a Y-maze, where they can freely walk and choose between the shock-associated odor and a non-shock-associated odor, explicitly avoid the punished odor and choose the non-shock-associated odor (Carcaud et al., 2009). Since SER involves the contraction of abdominal muscles, it is now possible to ask whether the antennal lobe of honeybees hosts an aversive memory trace while simultaneously recording CR confirming the presence of such memory trace. Contrarily to PER, SER does not introduce undesired movements of brain preparation. In this way, movement-free recordings of brain activity can be obtained during SER conditioning with a freely responding animal.
Here we achieved simultaneous recordings of odor-evoked calcium signals in the antennal lobe and of behavioral responses (SER) during conditioning. Based on SER, we could separate learners from non-learners so that we could relate brain activity to learning success and ask whether odor-induced calcium signals in the antennal lobe are modified by the formation of an odor-shock association, consistent with the presence of a memory trace.
Materials and Methods
Honey Bee Preparation
Apis mellifera L. workers were taken from a hive and brought to the laboratory where they were fixed in a Plexiglas recording chamber using low-temperature melting wax. The preparation followed the standard method used for calcium imaging recordings performed at the level of the antennal lobe of worker honeybees (Galizia et al., 1997; Sandoz et al., 2003; Deisig et al., 2006). The recording chamber was nevertheless modified to allow visual access to the SER during imaging. To this end, a hole was drilled in the frontal part of the chamber so that the abdomen could be passed through this hole. In this way, the abdomen tip protruded in front of the experimenter and the SER could be visually recorded. The abdomen was isolated from the rest of the body by means of a piece of transparent plastic to prevent the bee from smelling eventual emissions of its own sting alarm pheromone during the recordings. The efficiency of such isolation was checked by presenting isopentyl acetate (IPA) – the main component of the sting alarm pheromone – to bees prepared in this way and by recording antennal lobe activity. Under these circumstances, it is possible to record the glomerular pattern normally activated by IPA (Wang et al., 2008); the glomerular patterns recorded for the odors used during conditioning did not coincide with that elicited by IPA showing that our isolation method was effective.
Two metal plates smeared with E.E.G. gel (Spectra 360 Electrode Gel, Parker Laboratories) were inserted at the back of the chamber to create a contact with the anterior and the posterior parts of the thorax. The bee established a bridge between the plates, which were connected to the shock delivery system (Figure 1A). Odor and shock delivery were controlled by the imaging computer so that CS and US presentations could be temporally paired for conditioning (see below). The antennae were fixed to the front of the chamber using cactus spikes and two-component epoxy glue (Red Araldite, Bostik Findley S.A., France). Small pieces of plastic foil were then waxed to create a small pool around the brain region. A rectangular window was cut in the head cuticle between the eyes on the sides, behind the antennae to the front and the median ocellus at the back. Glands and trachea were removed to expose the brain. The brain was then washed thoroughly with saline solution (in mmol/l: NaCl, 130; KCl, 6; MgCl2, 4; CaCl2, 5; sucrose, 160; glucose, 25; Hepes, 10; pH 6.7, 500 mOsmol; all chemicals from Sigma-Aldrich, Lyon, France). The saline solution was gently removed, and the brain was bathed with 20 μl of calcium green-2 AM solution. The dye consisted of 10 μg Calcium Green-2 AM dissolved with 4 μl Pluronic F-127 (20% in dimethylsulfoxide, DMSO) (all from Molecular Probes, Invitrogen, OR, USA) in 160 μl saline. The bee was left for 45 min on ice. After staining, the brain was thoroughly washed with saline.
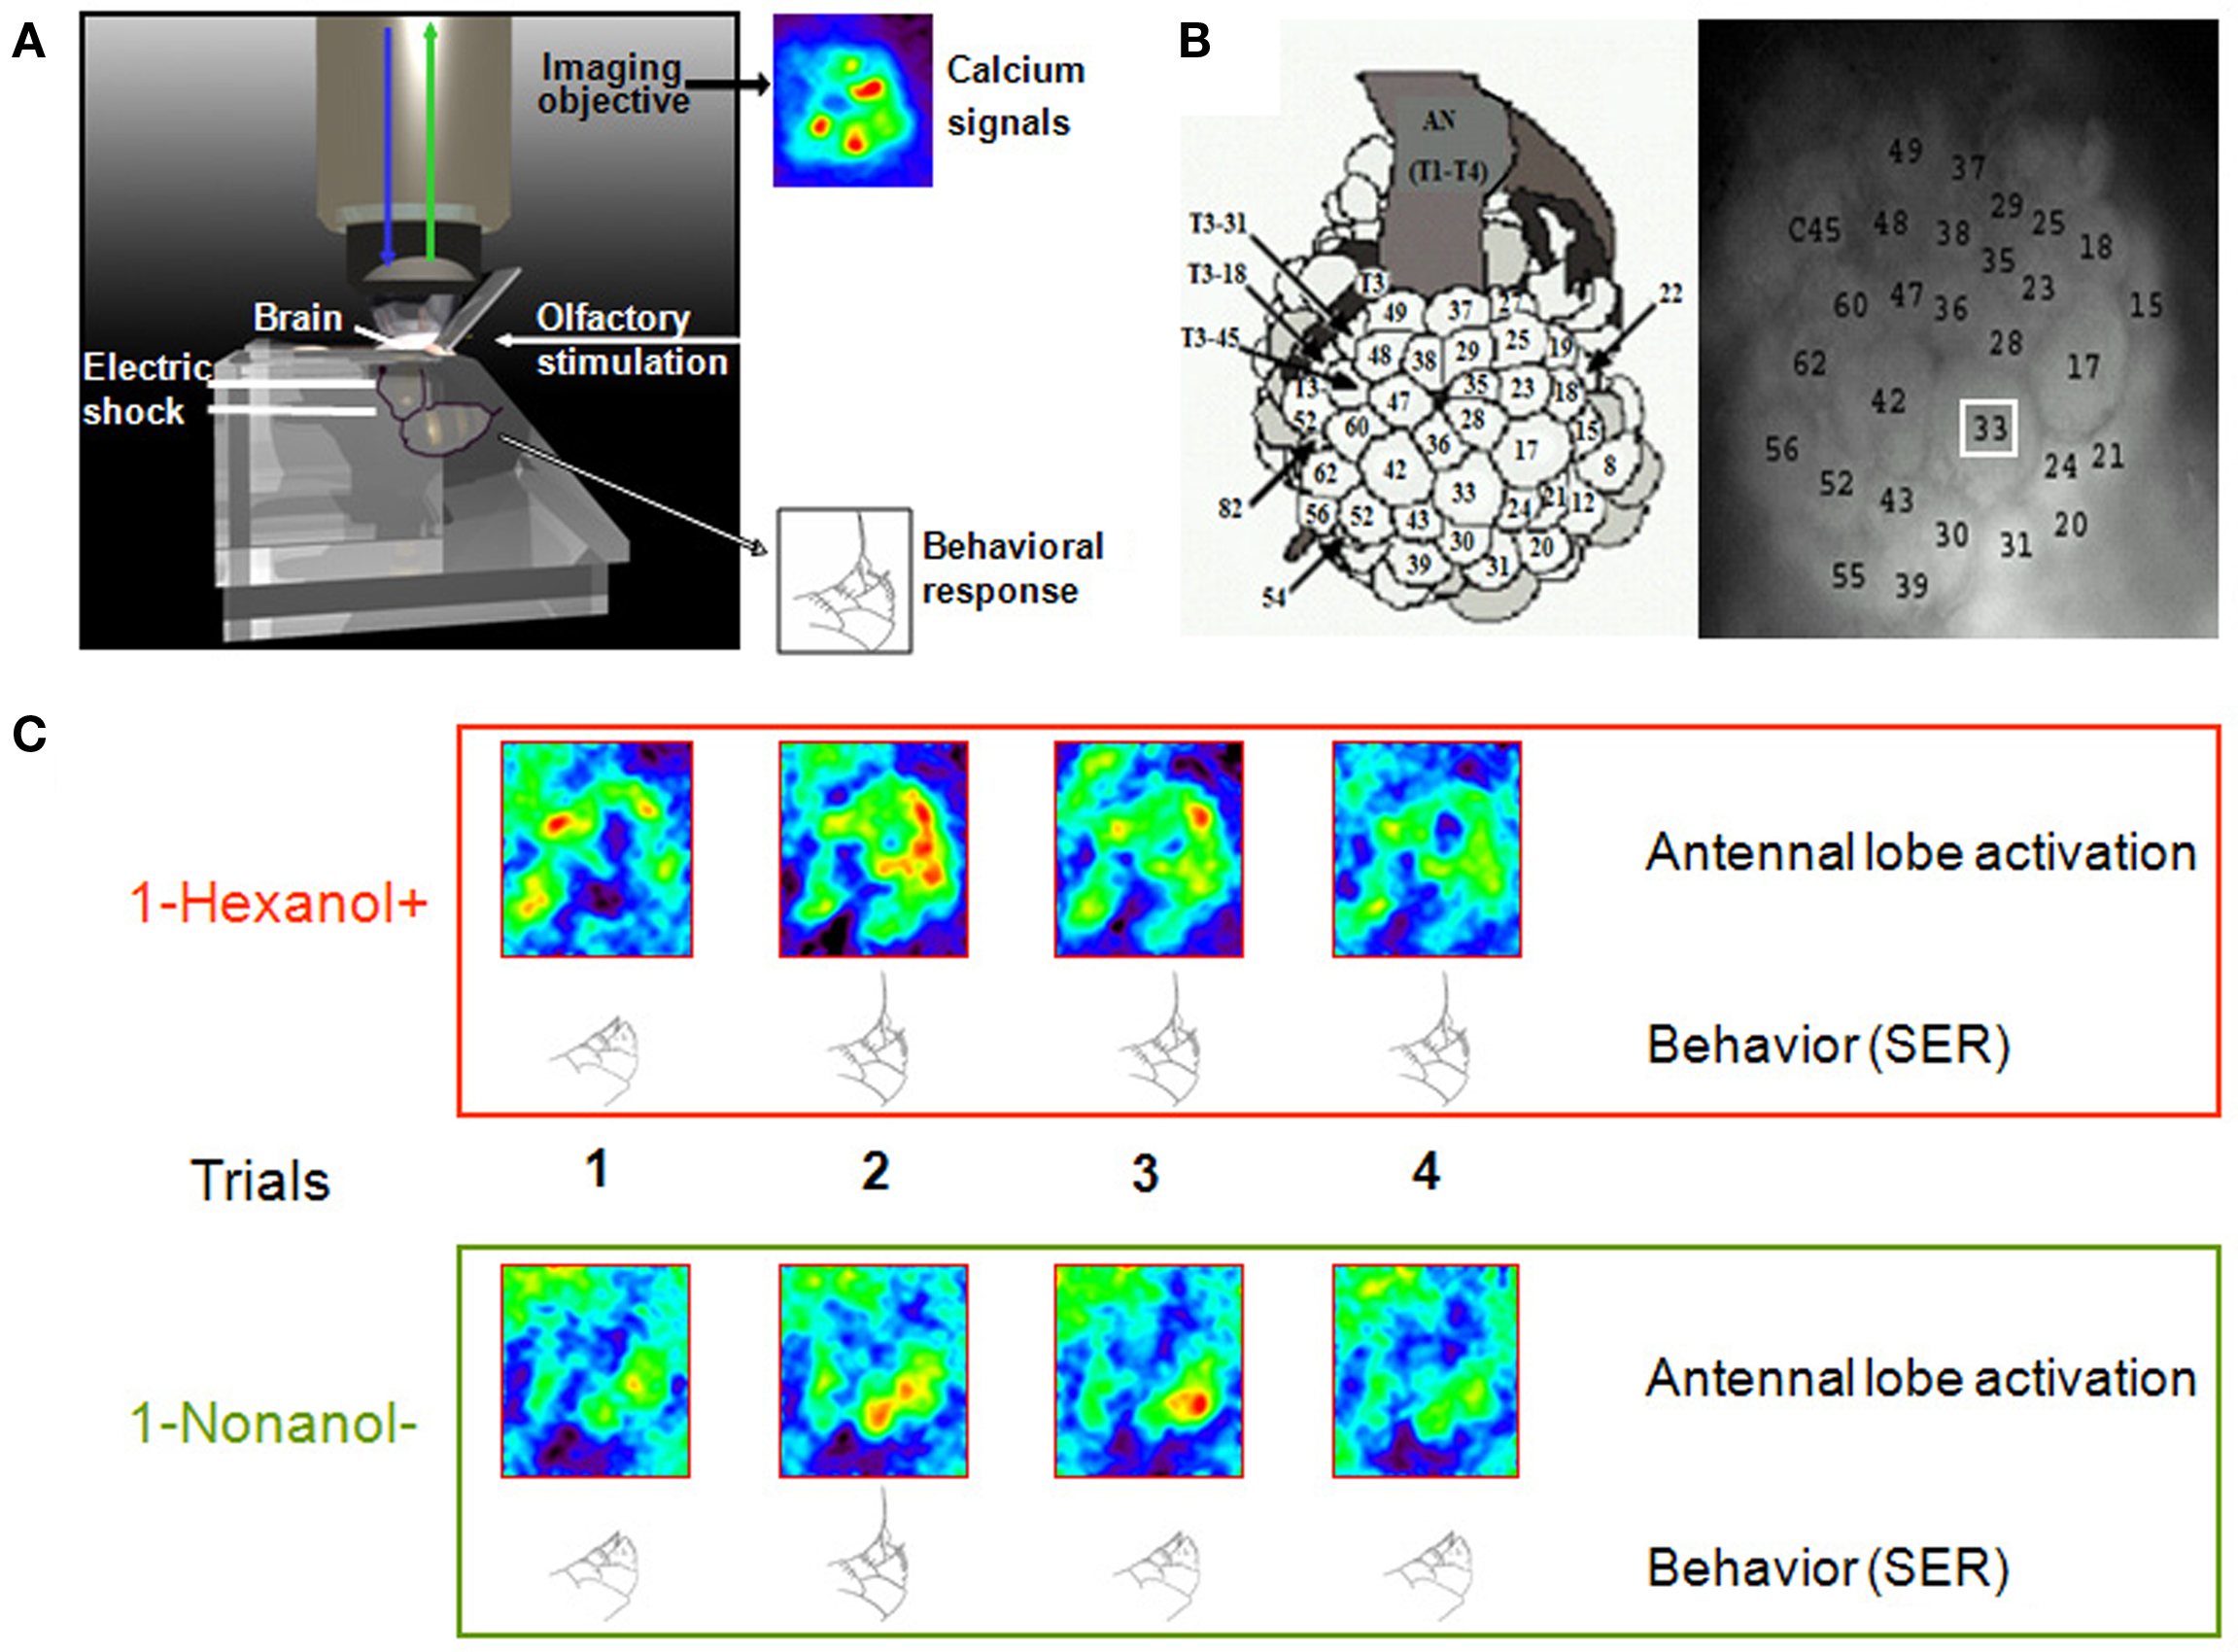
Figure 1. Simultaneous recording of calcium signals in the bee brain and behavioral responses during aversive conditioning. (A) The bee is fixed in the recording chamber, with its brain exposed and bathed with Ringer, and placed under the imaging objective. The antennae can freely move so that they can be stimulated with odorants. Odorant presentations can be paired with electric shocks delivered to the thorax, by means of two conducting plates at the back of the chamber. A hole at the front of the chamber allows visualizing the end of the abdomen, so that the experimenter can observe the behavioral response of sting extension and score behavioral performance during conditioning. Brain activity is monitored throughout the experiment. (B) Left, atlas of the honeybee antennal lobe developed by Galizia et al. (1999b) and right, anatomical staining of an antennal lobe allowing recognition of individual glomeruli. The white square is an example of the area in which calcium signal amplitude is calculated for each glomerulus. (C) Example of on-line recordings of calcium signals and behavioral responses of individual bees during conditioning. In this experiment, 1-hexanol was paired with shock and 1-nonanol was not paired with shock. During the four reinforced and four non-reinforced trials, we were able to record calcium activity in the antennal lobe upon odor presentations while the bee was learning the associations. We had simultaneous access to the behavioral responses of the bee (sting extensions); in the example shown, the bee started responding with a sting extension to the punished odorant from the second trial on and responded incorrectly to the non-reinforced odorant once in the second trial.
Optical Recordings of Odor-Evoked Activity
In vivo calcium imaging recordings were carried out using a T.I.L.L. photonics imaging system (Martinsried, Germany). Stained bees were placed under an epifluorescent microscope with a 10× water-immersion objective (NA 0.3), and the head region was immersed in saline solution. The preparation was slightly tipped to the front to offer a view of the antennal lobe surface.
Images were taken using a 640 × 480·pixel 12-bit monochrome CCD-camera (T.I.L.L. Imago) cooled to −12°C. Each measurement consisted of 100 frames at a rate of 5 frames/s (interval between frames 200 ms); the mean integration time was 40–120 ms. Light was shut off between frames. Pixel image size corresponded to 4.8μm × 4.8 μm after 4 × 4 binning on chip. Monochromatic excitation light at 475 nm was applied using a monochromator (T.I.L.L Polychrom IV). The filter set on the microscope was composed of a 505 nm dichroic filter and a LP 515 nm emission filter.
Odor Stimulation
Under the microscope, a constant air-stream, into which odor stimuli could be injected, was directed to the bee’s antennae (distance 2 cm). Odor presentation started at frame 15 and lasted for 5 s. During odor stimulation, a secondary airflow was diverted from the main airflow and passed through an interchangeable glass pipette containing the odor source. Stimulations were controlled by the computer of the imaging system.
The odors used for conditioning were 1-hexanol and 1-nonanol, which can be easily discriminated by honeybees (Guerrieri et al., 2005). In addition, octanal was used before conditioning to test the preparation for good-quality calcium signals. Odor sources were prepared by applying 5 μl of substance onto a 1 cm2 piece of filter paper inserted in a Pasteur pipette. Pipettes containing a clean piece of filter paper (air control) were presented to the bees before and after conditioning trials. All odors were obtained from Sigma-Aldrich.
Conditioning
After successful recording of calcium signals upon presentation of octanal (see above), we started the conditioning procedure. The protocol was inspired by the olfactory aversive conditioning developed by Vergoz et al. (2007) and adapted to the constraints of optical imaging. It consisted of a differential conditioning procedure involving eight trials. In four trials an odor was associated with an electric shock (CS+) while in four other trials a different odor was presented without shock (CS−). CS+ and CS− were presented in a pseudo-randomized sequence starting with the CS+ in half of the animals and with the CS− in the other half. The aversive US was a 5 V electric shock. The odor was presented for 5 s; in CS+ trials, the electric shock was given during the last 2 s of odor presentation. The interstimulus interval was therefore 3 s, and is therefore in the range of ISIs promoting the most robust aversive memories in honeybees (Giurfa et al., 2009). A red light was directed toward the abdomen and away from the microscope objective, so that sting extensions upon odorant and electric shock presentations could be visually recorded. We scored sting extensions during the first 3 s of odor presentation, before shock delivery (i.e., CR). Bees that did not respond with SER to the electric shock were discarded. For half of the bees, 1-nonanol was the CS+ and 1-hexanol the CS−; for the other half odor valence was reversed.
Anatomical Staining
During optical imaging, the glomerular structure of the antennal lobes is not visible and fluorescence is homogeneous over the whole antennal lobe surface. To reveal the glomeruli, the brain was first bathed with protease (from Bacillus licheniformis in propylene glycol; Sigma-Aldrich) during 45 min. It was then rinsed with saline and bathed with neutral red solution (4%, diluted in water) during 20 min. Afterwards the brain was again carefully washed with saline solution. Fluorescence photographs were taken at different focal planes (around 50) using 530 nm excitation light provided by a monochromator and a filter set composed of a 570 nm dichroic filter and LP 590 nm emission filter. We could then identify individual glomeruli using the atlas of the honeybee antennal lobe developed by Galizia et al. (1999b). In all bees we identified the same 21 glomeruli (Figure 1B). Physiological responses of these glomeruli account for the behavior of odor-conditioned bees (Guerrieri et al., 2005).
Activity Maps
Calcium imaging data were analyzed using custom-made software written in IDL (Research Systems Inc., Boulder, CO, USA). Each odor recording corresponded to a 3-dimensional array with two spatial dimensions (x, y pixels of the area of interest) and a temporal dimension (100 frames). Three steps were carried out to calculate the signals: first, to reduce photon (shot) noise, the raw data were filtered in spatial and temporal dimensions using a median filter with a size of 7 pixels. Second, relative fluorescence changes (ΔF/F) were calculated as (F − F0)/F0, taking as reference background F0 the average of three frames before any odor stimulation (here frames 5–7). Third, to correct for bleaching and possible irregularities of lamp illumination in the temporal dimension, a subtraction was made at each pixel of each frame, of the median value of all the pixels of that frame. Such a correction stabilizes the baseline of the recordings, without removing pertinent signals. Odor-evoked signals were the typical stereotyped biphasic signals obtained upon bath application of Calcium Green. They showed a first, fast fluorescence increase followed by a slow fluorescence decrease below baseline (Galizia et al., 1997; Stetter et al., 2001; Sandoz et al., 2003). The maximum signal was obtained 1.8 s after odor delivery and the minimum before odor application. For visual observation of the signals, activity maps are shown with the best possible spatial definition of odor-induced signals. Each pixel represents the mean of three frames after 1.8 s minus the mean of three frames just before odor presentation. Activity maps are presented in a false-color code, from dark blue (no signal) to red (maximum signal).
Signal Amplitude Calculation
For a quantitative analysis of signal amplitude, we focused on the fast (positive) signal component evoked by odor stimulation (Galizia et al., 1999a; Sachse et al., 1999; Sandoz et al., 2003). This calcium increase upon odor stimulation can be ascribed to an intracellular calcium increase from the extracellular medium, directly related to neuronal activity (see also Galizia and Kimmerle, 2004). In the antennal lobe, it reflects most probably presynaptic neuronal activity from OSNs (Galizia et al., 1998; Sachse and Galizia, 2003; see Deisig et al., 2010 for discussion on the signal origin). Moreover, studies recording neuronal responses downstream of the antennal lobe showed that these neurons (projection neurons and clawed Kenyon cells, Sachse and Galizia, 2002; Szyszka et al., 2005) respond well within the first second after odor application. Therefore, relevant neuronal activity should be measured early after odor application. Finally, as during conditioning trials, the reinforced odorant is presented with an electric shock, we had to analyze the amplitude of activation in the 3 s during which the odor was presented alone, and before the presentation of the electric shock (US), in order to obtain a neural response to the CS only.
For each glomerulus, the time course of relative fluorescence changes was calculated by averaging 25 pixels (5 × 5) (Figure 1B). The amplitude of odor-induced responses was calculated as the mean of 3 frames after odor onset (frames 23–25), minus the mean of 3 frames just before the odor stimulus (frames 11–13). This value was used in all computations.
The Search for Learning-Induced Modifications of Odor Responses
As we had access to behavioral responses during conditioning, we could classify each bee as a learner or as a non-learner. Bees showing more responses to the CS+ than to the CS−, were considered as learners (n = 18) whereas other bees were considered as non-learners (n = 17). In this separation, we excluded spontaneous responses in the first trial given that bees were naïve at this stage. We compared antennal lobe activity in both groups as they experienced the same conditioning procedure, leading to different results in each case. We also compared, within each group, the evolution of calcium responses to the CS+ and the CS−.
Different variables were used to quantify antennal lobe activity. We analyzed the following global measures: (1) the total activation of the antennal lobe, i.e., the sum of the amplitudes of calcium signals in the 21 glomeruli, both for the CS+ and CS−, and for learners and non-learners; (2) the number of activated glomeruli, i.e., the number of glomeruli that are activated by a given odor; a glomerulus was considered to be activated when the amplitude of the calcium signal was above 2 SD of the signal calculated before stimulus presentation, i.e., between frames 1 and 14; this variable was compared between learners and non-learners and within groups, between CS+ and CS−; (3) the similarity between CS+ and CS−; i.e., the Euclidian distance between odor-response patterns when represented in a putative neural space of 21 dimensions defined by the 21 glomeruli identified in all bees (Sandoz et al., 2003). The Euclidian distance (dij) between odors i and j was calculated as:
Where p is the number of measured glomeruli (corresponding to the dimensionality of the Euclidian space, in our case 21) and Xik and Xjk are the calcium responses to odor i and j, respectively, in glomerulus k. Similarity between CS+ and CS− measured in this way could be compared between learners and non-learners.
Besides measures of global activity, we also analyzed (4) possible changes in individual glomerular activation. To this end, we quantified the amplitude of activation in each of the 21 glomeruli along the conditioning trials for learners and non-learners, and for the CS+ and the CS−. Learning-induced plasticity may differentially affect individual glomeruli. We paid particular attention to those glomeruli that were maximally activated by each odorant (glomerulus 28 for 1-hexanol and 17 for 1-nonanol). We analyzed the evolution of the amplitude of activation of these two glomeruli along trials for learners and non-learners, when their corresponding odors were presented as CS+ or CS−. The same analysis was performed on the 19 remaining glomeruli for both odorants.
Finally, to determine whether variations in individual glomerular responses were not determined by fitness differences or by a high bleaching of the calcium dye, we quantified the basal level of fluorescence before odor presentation (mean level of fluorescence taken from frame 5 to 14) for each glomerulus, for learners and non-learners and for both odorants, 1-hexanol and 1-nonanol, when presented as CS+ or CS−.
Statistical Analysis
All variables were compared between groups or within group along conditioning trials, using repeated measurement ANOVAs. Within each group, we wanted to compare the responses to the CS+ and to the CS−. However, since different odors were used as CS+ and CS−, absolute measures of antennal lobe activation before conditioning were different and could not be directly compared. For instance, 1-hexanol and 1-nonanol, used as CS+ and CS−, do not induce the same global activation of the antennal lobe. For these reasons, all values for a given odor were normalized with respect to the value obtained at the first trial with that odor, i.e., when the bees were still naïve. In most cases, we subtracted the absolute value at the first trial from the absolute values at each subsequent trial. Thus, in the graphs, the normalized value at trial 1 was 0. The only exception was the number of activated glomeruli, which was normalized by dividing the value at each trial by the average number of activated glomeruli at trial 1. This normalization allowed direct comparison of the evolution of responses between CS+ and CS−, which was otherwise not possible.
Results
Behavioral Recordings
We recorded simultaneously odor-induced calcium signals in the antennal lobe and behavioral responses in 35 honeybees subjected to differential olfactory conditioning of the SER. Examples of simultaneous calcium imaging and recordings of SER during conditioning trials are shown in Figure 1C. Access to behavioral responses allowed determining whether or not bees learned the association between odorant and shock. To reveal possible modifications of odor representations in the antennal lobe resulting from conditioning, we divided bees into “learners” (n = 18) and “non-learners” (n = 17). While the former exhibited more responses to the CS+ than to the CS− during conditioning, the latter did not exhibit preferential responses to the CS+ despite having experienced the same conditioning procedure (Figure 1C).
For both learners and non-learners, we found no differences between the behavioral responses of the two subgroups trained respectively with 1-nonanol+ vs. 1-hexanol− or with 1-nonanol− vs. 1-hexanol+ (ANOVA for repeated measurements; learners: F1,16 = 0.28, NS; non-learners: F1,14 = 1.58, NS) so that results were pooled within each group. Figure 2 shows the resulting learning performances of learners and non-learners. Given the classification criterion used for individual bees, learners obviously mastered the discrimination between the CS+ and the CS− (stimulus effect: F1,34 = 40.51, p < 0.001) while non-learners did not (stimulus effect: F1,32 = 0.11, NS). Moreover, learners and non-learners behaved differently along trials (group × stimulus × trial ANOVA, group effect: F1,33 = 33.81).
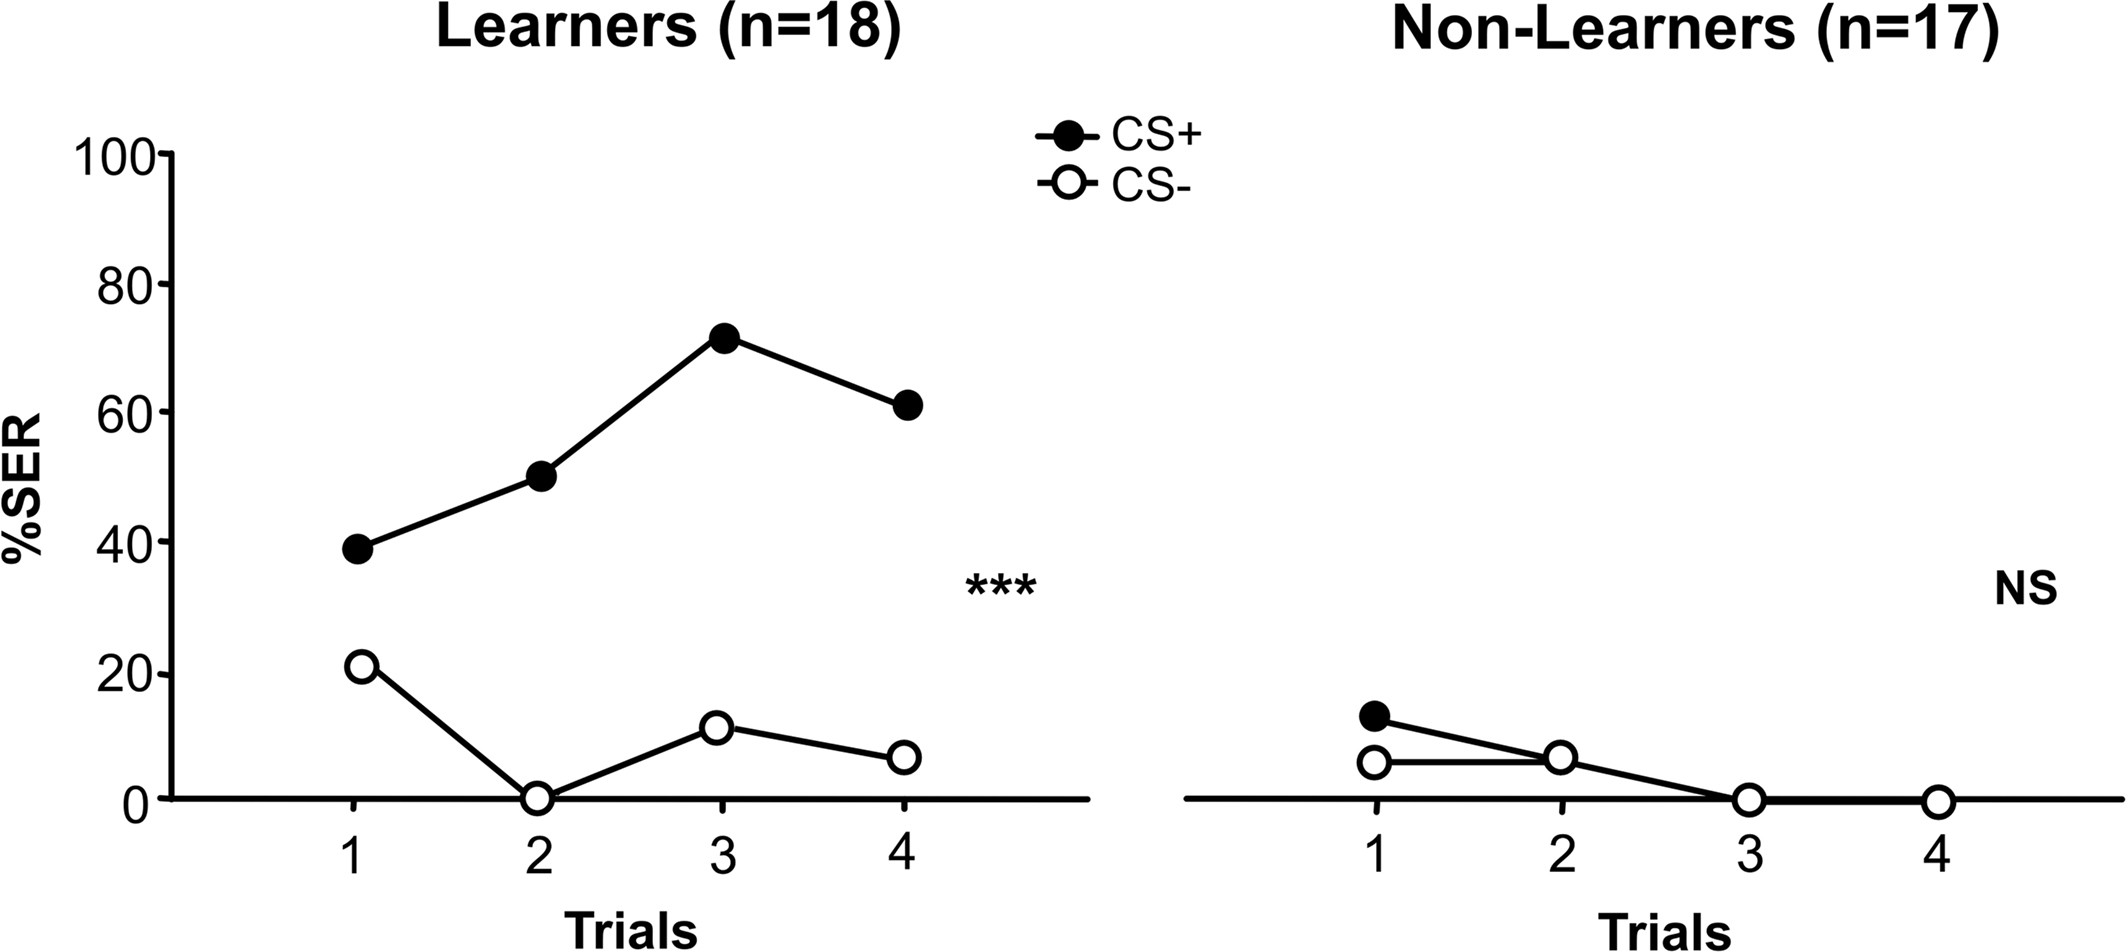
Figure 2. Learning curves of conditioned bees. We distinguished learners from non-learners. Learners mastered the olfactory discrimination as they responded more to the CS+ than to the CS− during conditioning trials (stimulus effect: ***p < 0.001); non-learners, on the contrary, were unable to master the discrimination (stimulus effect: p = NS).
Calcium Imaging Recordings
Parallel to behavioral measurements of SER, we recorded odor-induced calcium signals in the antennal lobe of learners and non-learners. We were, therefore, able to determine whether neural activity changes as a consequence of learning and whether such changes, if any, allow better decorrelation between CS+ and CS−. To this end we asked whether variables characterizing neural activity in the antennal lobe uncover differences between learners and non-learners, and more specifically, between CS+ and CS−.
Does the global amplitude of activation in the antennal lobe vary between learners and non-learners and between CS+ and CS−?
We first compared the global amplitude of activation of the antennal lobe between learners and non-learners, both for the CS+ and the CS− (Figure 3A). To this end, we measured the sum of the responses recorded in the 21 measured glomeruli, and we normalized them to the global intensity of activation recorded for odors at the first trial, when bees are still naïve (0 level). This procedure allows discarding possible variations in basal intensity of activation so that CS+ and CS− curves, and learners and non-learners, have a common starting point allowing a better appreciation of variations due to learning.
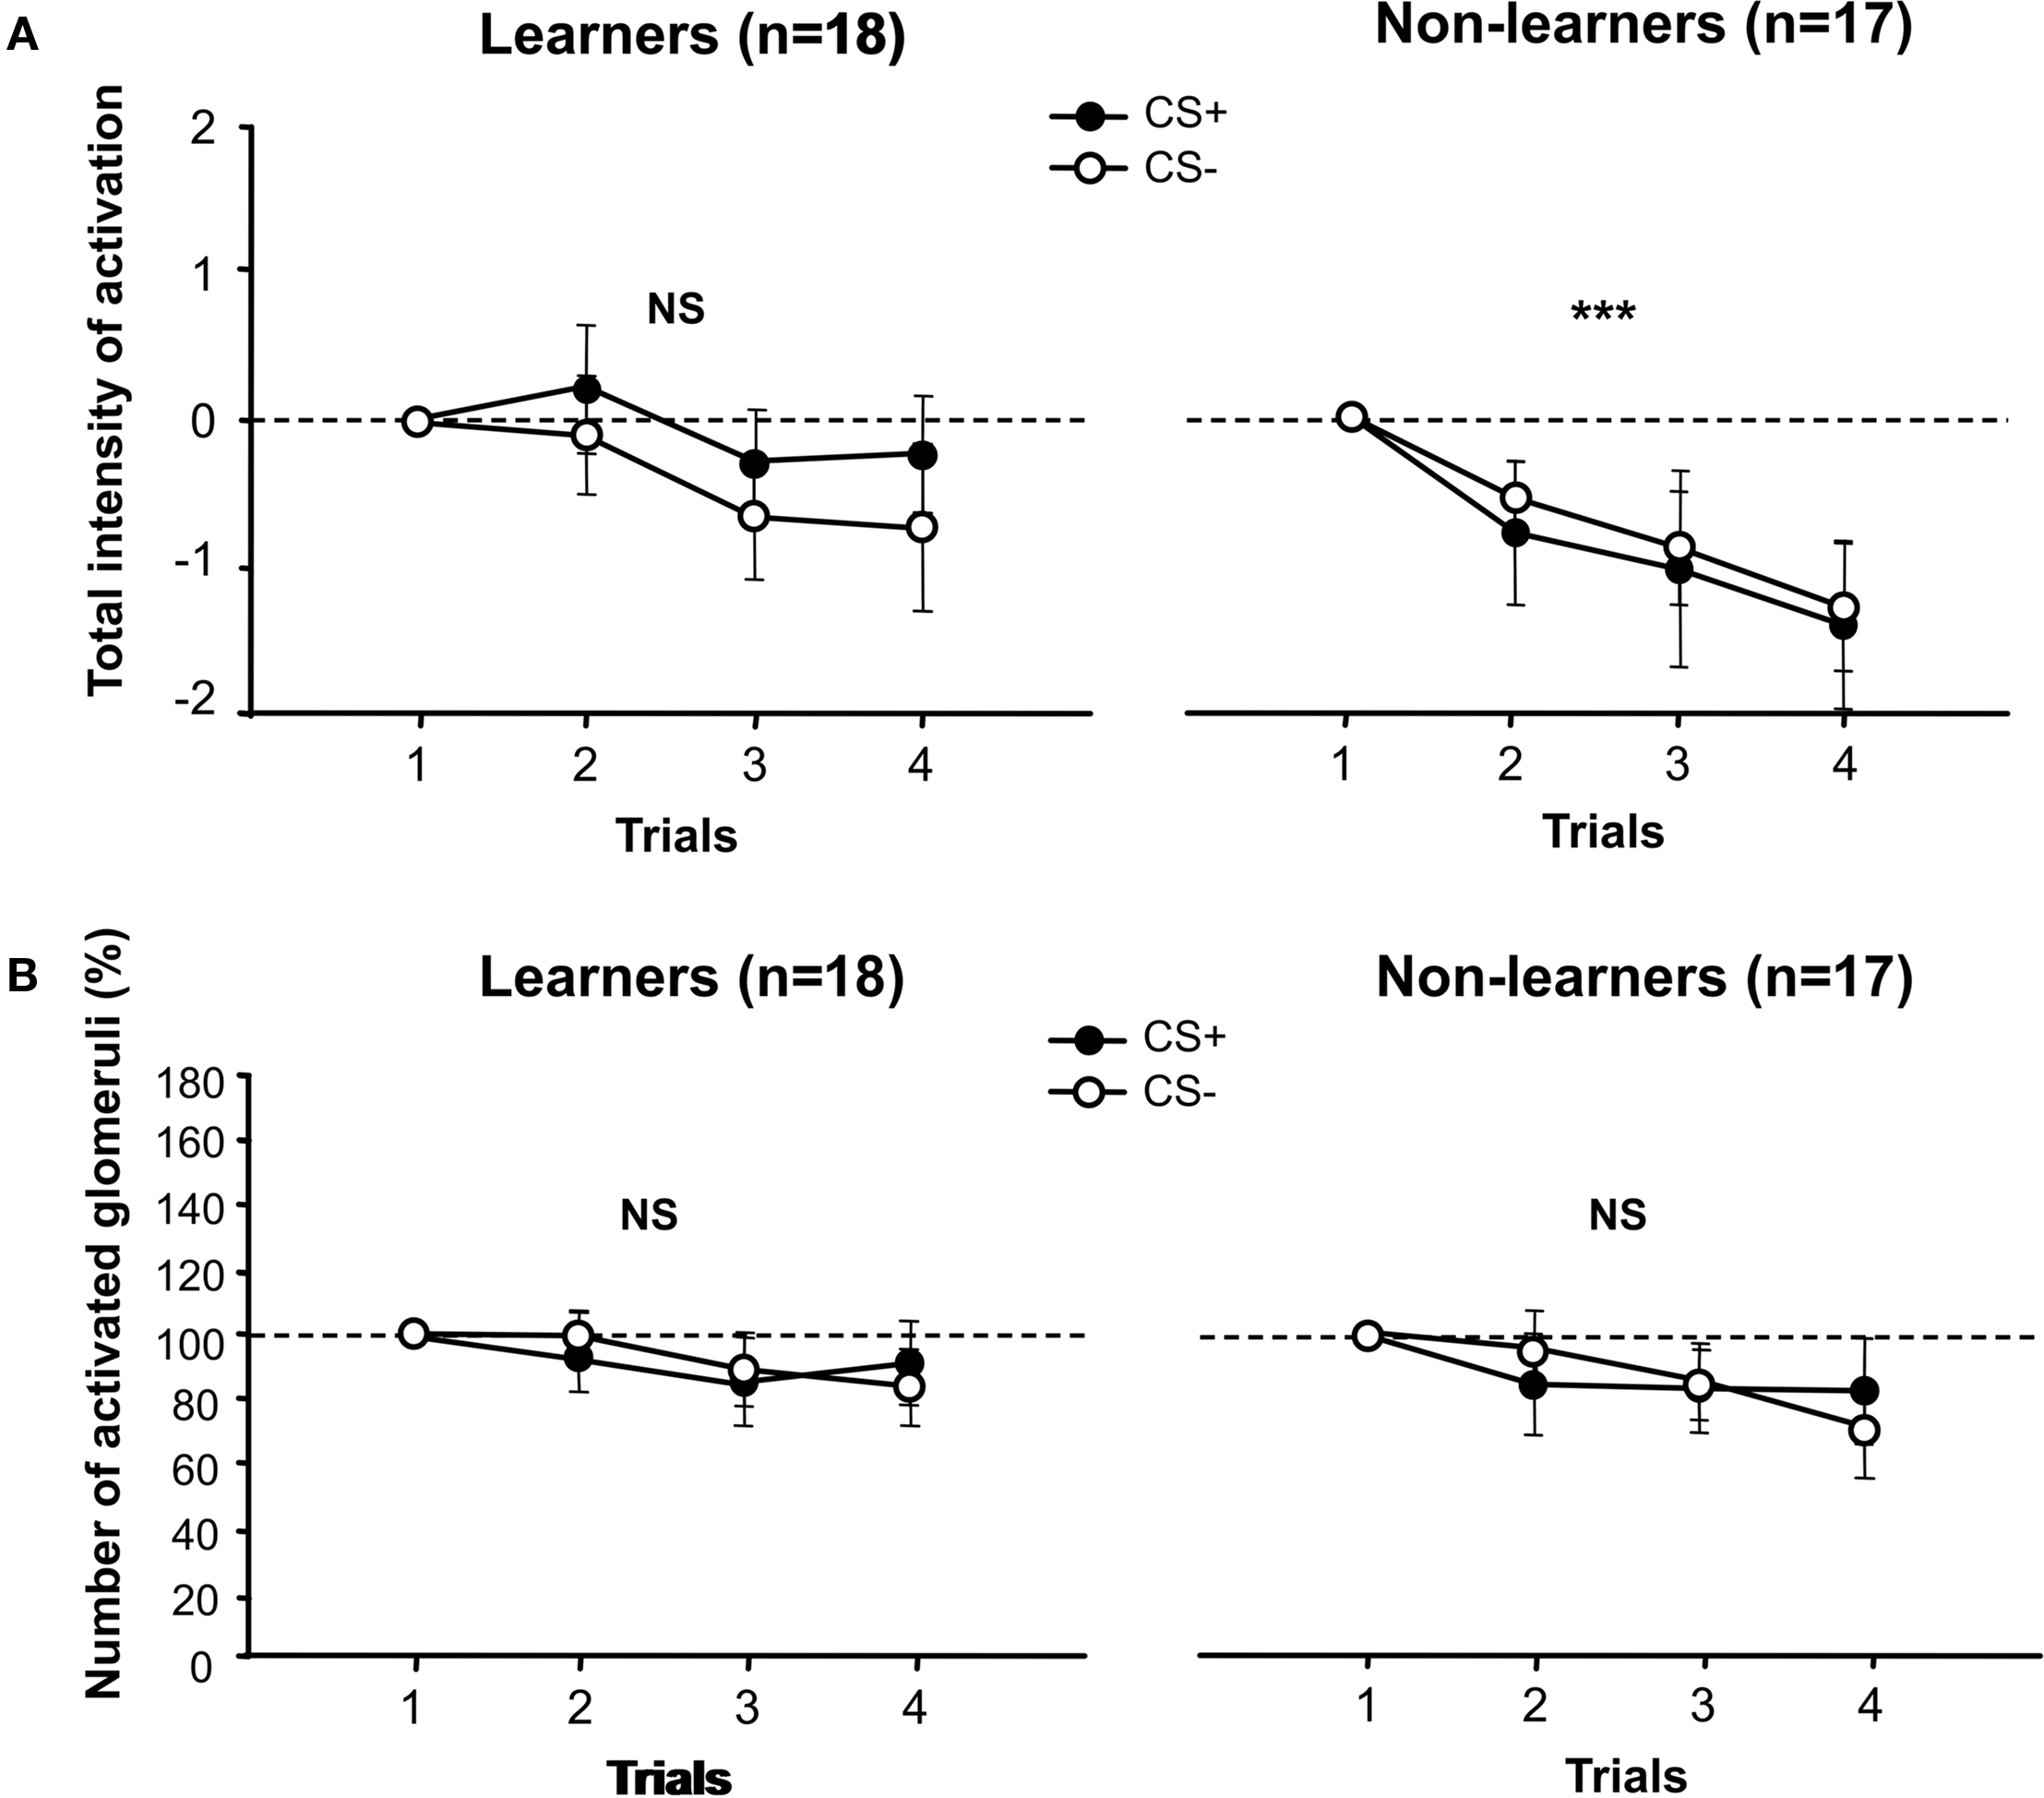
Figure 3. Calcium activity in the antennal lobe. (A) Total intensity of activation of the antennal lobe. Amplitudes are normalized to the global intensity of activation recorded for odors in the first trial, when bees are still naïve (0 level). Left: for learners, no difference was found between CS+ and CS− during conditioning trials (stimuli effect, p = NS). Right: the same lack of differentiation was observed for non-learners, but these bees exhibited a significant decrease of the total antennal lobe activation during conditioning trials (trial effect, ***p < 0.001). Learners did not exhibit such a decrease (trial effect, p = NS). (B) Number of activated glomeruli. To get rid of that different odors activate different numbers of glomeruli in naïve bees, we normalized the data to the number of glomeruli activated by each odor in the first trial (100%). Left: for learners no difference was found between the number of glomeruli activated by the CS+ and the CS− during conditioning trials (stimulus effect, p = NS). Right: for non-learners, there was also no difference between the number of glomeruli activated by the CS+ and the CS− during conditioning trials (stimulus effect, p = NS). Aversive conditioning does not modify global activity of the antennal lobe in a learning-dependent manner.
For both learners and non-learners, we did not find any significant difference in the global amplitude of activation recorded for CS+ and CS− (learners; stimulus effect: F1,34 = 0.58, NS; interaction stimulus × trial: F3,102 = 0.23, NS; non-learners; stimulus effect: F1,32 = 0.058, NS; interaction stimulus × trial: F3,96 = 0.03, NS). Although learners definitely managed to discriminate the CS+ from the CS− at the end of training (see Figure 2), neural activity elicited by the CS+ and the CS− did not reflect such a differentiation, at least for the global variable we considered. In the case of non-learners, which did not master the behavioral discrimination, the fact that there was no difference between CS+ and CS− in terms of global activation was not surprising. However, in their case, the total intensity of activation decreased along trials both for the CS+ and for the CS− (Figure 3A, right panel; trial effect: F3,96 = 6.42, p < 0.001) while it remained constant for learners (Figure 3A, left panel; trial effect: F3,102 = 1.84, NS). Yet, differences between groups (learners vs. non-learners) were not high enough to reach significance (group effect: F1,33 = 2.48, NS; interaction group × stimulus: F1,33 = 0.56, NS; interaction group × trial: F3,99 = 1.19, NS). Thus, the fact that some bees learned to differentiate the CS+ and the CS−, while other bees did not, was not reflected by differences in the global amplitude of activation of the antennal lobe. This variable differed, however, between learners and non-learners in a non-specific way, so that non-learners exhibited a general decrease of activation along trials which learners did not show.
Does the number of activated glomeruli vary between learners and non-learners and between CS+ and CS−?
Even if the global amplitude of activation was not modified by learning, the number of activated glomeruli could have been modified in a CS−specific manner. One may hypothesize that in the case of CS+ activation patterns of learners, there would be more glomeruli activated with smaller amplitude of activation, or less activated glomeruli with higher amplitude of activation. We, therefore, calculated, for learners and non-learners, the number of glomeruli activated by the CS+ and the CS− along conditioning trials. To correct for the fact that different odors activate different numbers of glomeruli in naïve bees, we normalized the data to the number of glomeruli activated by each odor in the first trial (100%) (Figure 3B). This procedure determines a common starting point for both CS+ and CS− curves, and for learner and non-learner curves, so that their variation along trials can be compared.
For both learners and non-learners, we found that the number of activated glomeruli did not change between CS+ and CS− (Figure 3B; learners; stimulus effect: F1,34 = 1.27, NS; interaction stimulus × trial: F3,102 = 0.86, NS; non-learners; stimulus effect: F1,31 = 0.79, NS; interaction stimulus × trial: F3,93 = 0.55, NS). Similarly, there were no significant differences within groups related to a trial effect (learners; trial effect: F3,102 = 1.39, NS; non-learners: F3,93 = 1.05, NS). A comparison between groups (learners vs. non-learners) was also not significant (group effect: F1,32 = 0.40, NS; interaction group × stimulus: F1,32 = 0.01, NS; interaction group × trial: F1,96 = 0.60, NS). Even if learners mastered the discrimination between CS+ and CS− (see Figure 2), the number of glomeruli activated by the CS+ and the CS− did not reflect such a differentiation.
Does the similarity between CS+ and CS− vary between learners and non-learners along conditioning trials?
Even if no global changes of neural activity were detected for the CS+ and the CS− in either learners or non-learners, we analyzed whether the similarity between CS+ and CS− was modified in learners vs. non-learners during conditioning. To this end, we calculated the Euclidian distance between CS+ and CS− activity patterns, for both learners and non-learners, in the putative neural space of 21 dimensions defined by the 21 glomeruli under study (Sandoz et al., 2003; Deisig et al., 2006, 2010). Euclidean distance between two odors in this olfactory space provides a good estimation of their perceptual similarity: odors whose loci lie close to each other in the space are perceptually more similar than odors whose loci are separated (Deisig et al., 2006, 2010). In our case, the analysis should reveal if the distance between the CS+ and the CS− increases in learners, consistently with their increased discrimination. We first analyzed whether the distance between CS+ and CS− on trial one predicts behavioral performance, i.e., whether separability between CS+ and CS− before training accounts for the learner or non-learner status of a bee. To this end, we compared the Euclidian distance between 1-hexanol and 1-nonanol for learners and non-learners and found no difference between groups (t-test: t33 = 1.81, NS). This means that this parameter cannot predict whether a bee will be successful in mastering or not the discrimination between CS+ and CS−. The original distance between odors before conditioning (i.e., at the first trial) was then normalized to 0 to facilitate comparisons between learners and non-learners. An increase of distance (positive values) along trials reflects better discrimination between odors, while a decrease (negative values) reflects a reduction of the capacity to distinguish odors.
Figure 4 shows the variation of Euclidean distance between CS+ and CS− during conditioning trials, both for learners and non-learners. The trial effect was highly significant showing that there were changes in distance during conditioning (F3,99 = 5.88, p < 0.001); however, neither the group effect (learners vs. non-learners: F1,33 = 0.13, NS) nor the interaction (F3,99 = 1.25, NS) were significant. Separated analyses performed on each group showed that learners did not exhibit a significant variation of the distance between CS+ and CS− along trials (trial effect: F3,51 = 1.31, NS), while non-learners did (F3,48 = 8.09, p < 0.001). However, this difference was not high enough to render significant the group effect of the two-factorial repeated measurements ANOVA (see above). Due to this, we will not further insist on this difference. Note, however, that a reduction of the distance between CS+ and CS− would be difficult to understand in the case of learners, which successfully managed to differentiate these odors.
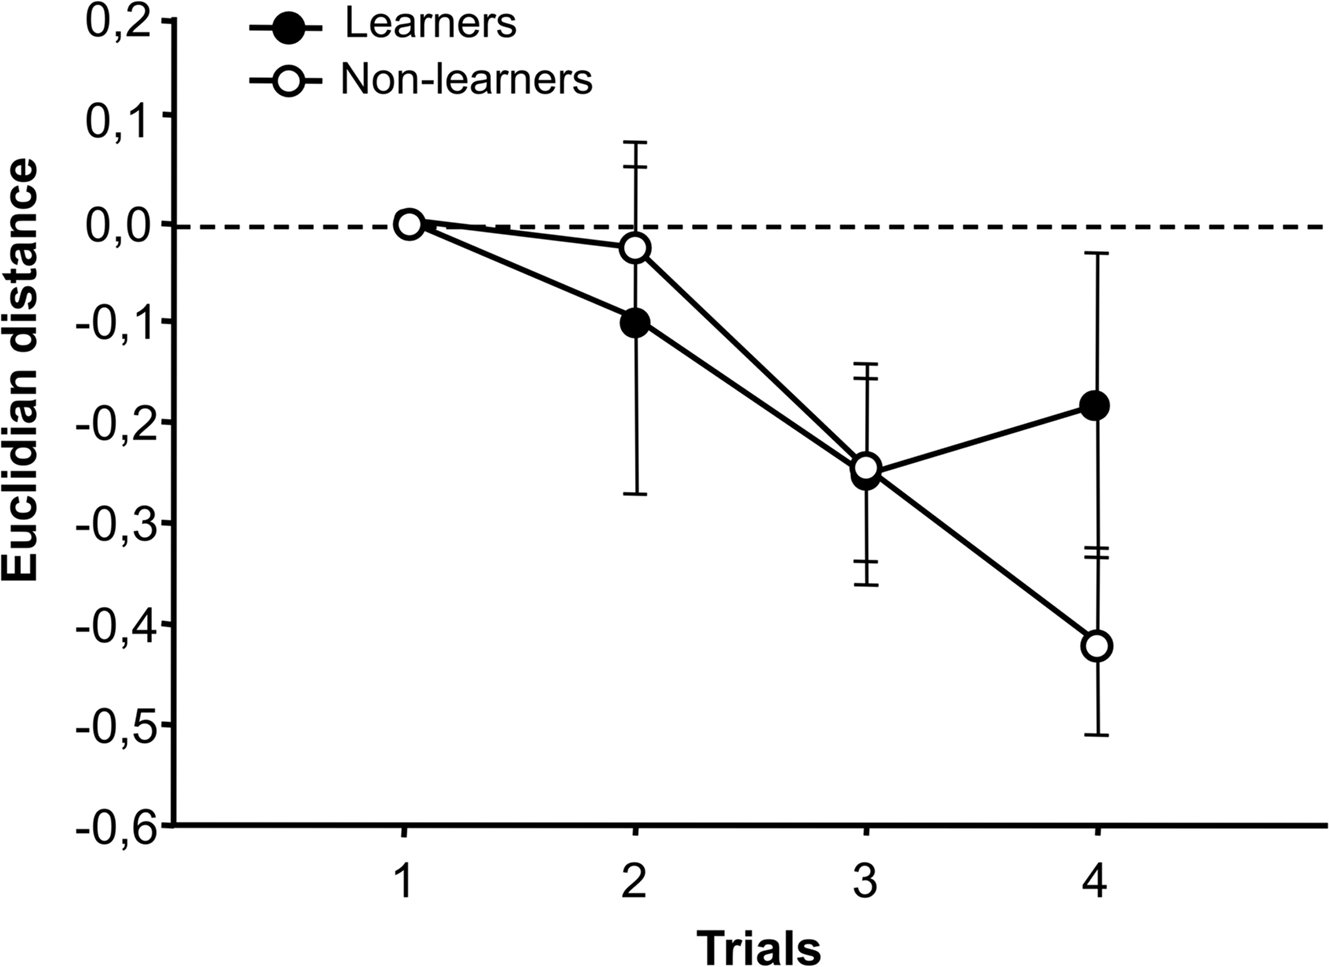
Figure 4. Similarity between activity patterns of CS+ and CS−. The Euclidian distance between CS+ and CS− activity patterns was calculated both for learners and non-learners in the putative neural space with 21 dimensions defined by the 21 glomeruli under study. This distance is a measure of perceptual similarity between odors (larger distance: less similarity, shorter distance: more similarity). The original distance between odors before conditioning (i.e., in the first trial) was normalized to 0 to facilitate comparisons between learners and non-learners. We found no changes in perceptual similarity between CS+ and CS− activity patterns in the course of training between groups (group effect: p = NS) but whereas the similarity between CS+ and CS− did not change along trials for learners (trial effect, p = NS), the similarity decreases for non-learners (trial effect, ***p < 0.001).
Does the amplitude of activation of individual glomeruli vary between learners and non-learners and between CS+ and CS−?
As global measures of antennal lobe activity did not reveal any CS-specific effect, neither in learners nor in non-learners, we focused on activity within single glomeruli. We analyzed whether learning-dependent variations that were possibly masked by global measures, could occur at this level. We compared, for learners and non-learners, the amplitude of activation of individual glomeruli in their responses to the CS+ and the CS− along conditioning trials. Data were normalized to the amplitude of activation recorded at the first trial, when bees are still naïve (0 level).
Given that 1-hexanol and 1-nonanol activate a different set of glomeruli, responses were compared separately. We first focused on the two glomeruli that are most strongly activated by each odor, glomerulus 28 (Figure 5A) for 1-hexanol, and glomerulus 17 (Figure 5B), for 1-nonanol. We quantified, for learners and non-learners, the amplitude of activation of these glomeruli along conditioning trials. Note that for each bee, the maximally activating odorant of each glomerulus was either CS+ or CS−. Therefore, this factor was added to the analysis.
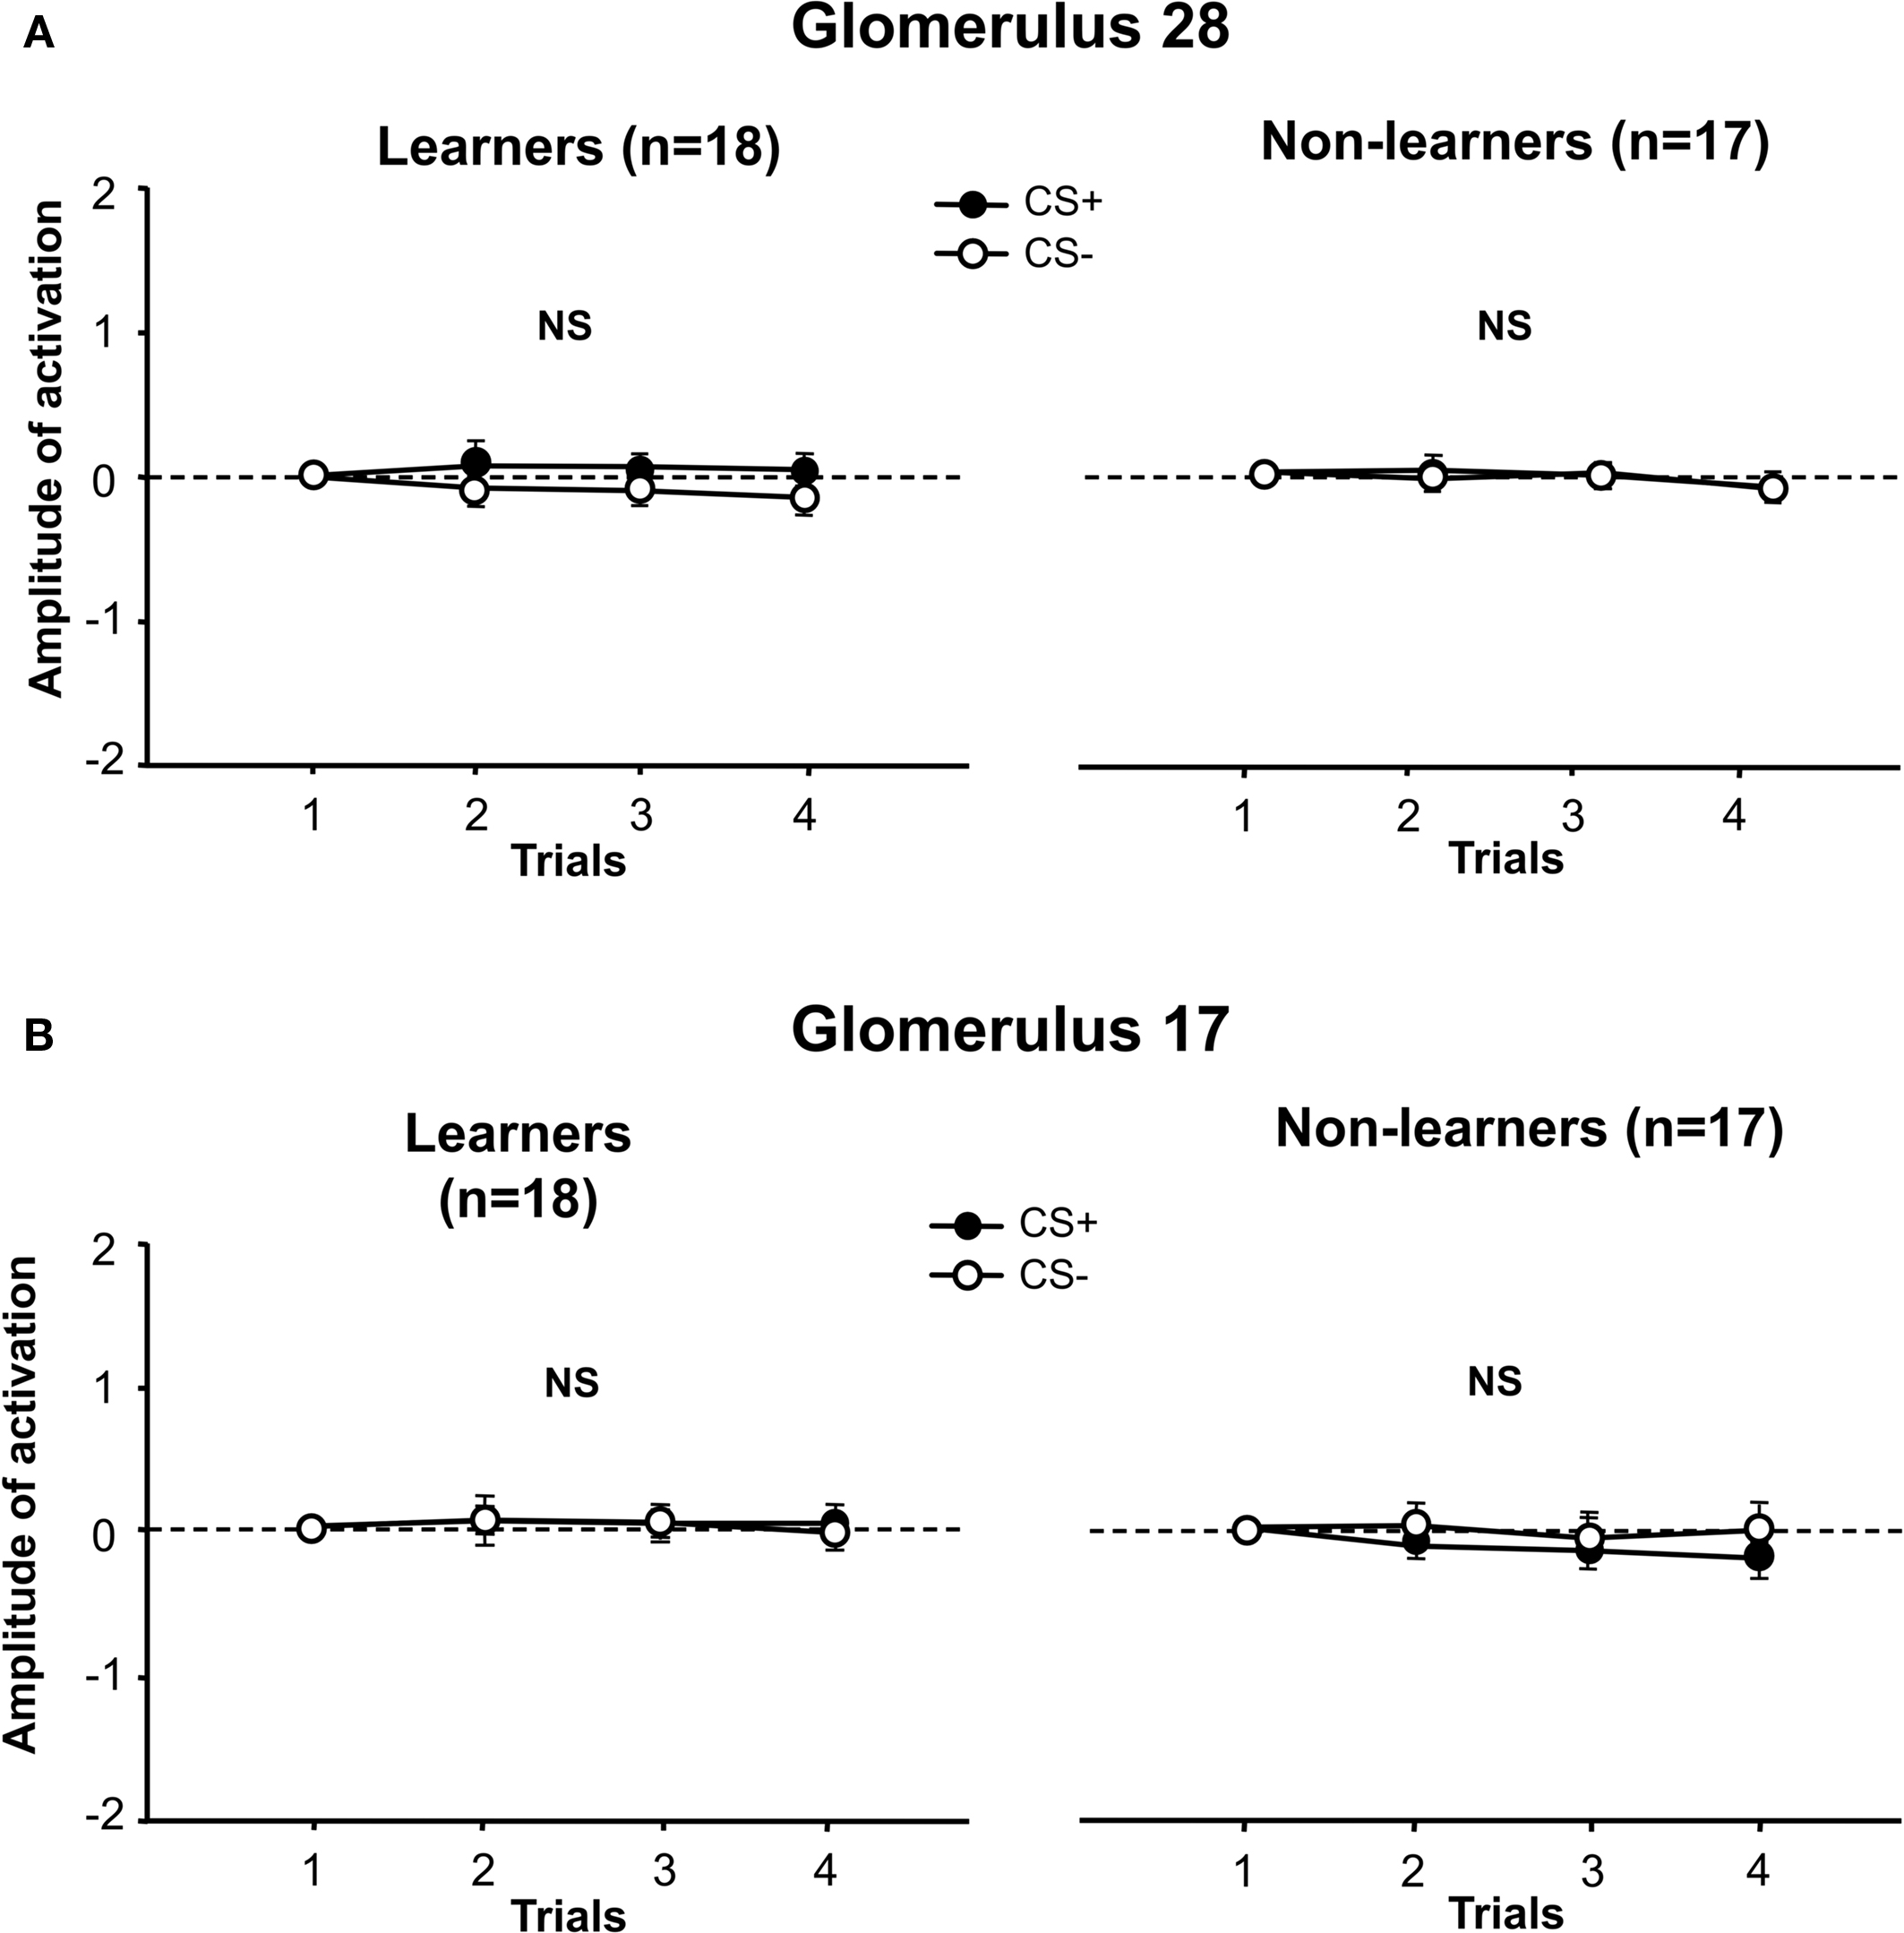
Figure 5. Activation amplitude of individual glomeruli during conditioning. (A) For learners and non-learners, in glomerulus 28, the amplitude of activation did not change along conditioning trials and there was no difference between groups (stimulus effect: p = NS, group effect: p = NS). (B) For learners and non-learners, in glomerulus 17, the amplitude of activation did not change along conditioning trials and there was no difference between groups (stimulus effect: p = NS, group effect: p = NS).
For glomerulus 28 (Figure 5A), there were no significant differences in the amplitude of activation when 1-hexanol was used as CS+ or as CS−, for both learners (left panel) and for non-learners (right panel) (learners: stimulus effect: F1,16 = 1.09, NS, interaction stimulus × trial: F3,48 = 0.48, NS; non-learners: stimulus effect: F1,15 = 0.034, NS; interaction stimulus × trial: F1,45 = 0.18, NS). No differences were found between learners and non-learners with respect to the amplitude of activation of glomerulus 28 (group effect: F1,15 = 0.001, NS; interaction group × stimulus: F1,31 = 0.59, NS; interaction group × trial: F3,93 = 0.15, NS).
Similarly, for glomerulus 17 (Figure 5B), there were no significant differences in the amplitude of activation when 1-nonanol was used as CS+ or as CS− both for learners (left panel) and for non-learners (right panel) (learners: stimulus effect: F1,16 = 0.01, NS, interaction stimulus × trial: F3,48 = 0.07, NS; non-learners: stimulus effect: F1,15 = 1.22, NS, interaction stimulus × trial: F3,45 = 1.04, NS). There were no differences between learners and non-learners with respect to the amplitude of activation of glomerulus 17 (group effect: F1,15 = 1.98, NS; interaction group × stimulus: F1,31 = 0.72, NS; interaction group × trial: F3,93 = 0.6, NS).
Thus, the amplitude of activation of the glomeruli that were maximally activated by the odorants used did not yield any significant learning-dependent effect. It may be, however, that glomeruli exhibiting less activation upon odor stimulation are those showing significant learning-dependent changes. The same analysis was then performed on the remaining 19 glomeruli and the same results were found both for learners and non-learners, i.e., for each glomerulus, there were no significant differences in the amplitude of activation when 1-hexanol or 1-nonanol were used as CS+ or CS− (not shown).
Finally, we analyzed whether non-learner responses were affected by a problem of fitness or a high bleaching of the dye. To answer this question, we determined and compared the basal level of fluorescence before odor presentation (mean level of fluorescence taken from frame 5 to 14) for each glomerulus, for learners and non-learners and for odorants, 1-hexanol and 1-nonanol, when presented as CS+ or CS−.
The basal level of fluorescence increased significantly during conditioning trials (data not shown) in all glomeruli, both for learners and non-learners, and for both odors used as CS+ and CS−. We found no difference between groups (learners vs. non-learners), odors (1-hexanol vs. 1-nonanol) and CS (CS+ vs. CS−). This suggests that although the basal level of fluorescence increased during trials for all bees, non-learners exhibited a progressive decrease of calcium responses (see Figure 3A) that was specific to odor delivery. In any case, this decrease was neither due to a fitness problem nor to an abnormal bleaching of the dye.
Discussion
In the present work, we achieved the first simultaneous recording of conditioned and optophysiological responses in honeybees, successfully linking the behavioral and neurobiological levels. We coupled the novel olfactory aversive conditioning of the SER (Vergoz et al., 2007; Giurfa et al., 2009) with calcium imaging recordings of the antennal lobe, which is the first olfactory center of the honeybee brain. The possibility of having a simultaneous behavioral readout (SER) allowed us to separate honeybees that mastered the discrimination between a punished (CS+) and a non-punished odor (CS−) (learners) from those that did not learn the task (non-learners). As these two groups received exactly the same conditioning procedure, they would in principle be well-suited for detecting learning-specific modifications of odor-evoked responses in the antennal lobe. To this end, our analysis focused on a population of glomeruli that is commonly accessed in such recordings (Sachse et al., 1999; Deisig et al., 2006, 2010) and whose responses effectively predict perceptual measures of odor similarity in honeybees (Guerrieri et al., 2005).
Our calcium imaging recordings did not yield evidence for learning-dependent changes in neural activity at the level of the antennal lobe during aversive SER conditioning. Specifically, no differences between glomerular responses to the CS+ and to the CS− could be detected in learners although these bees showed consistent differentiation between these odors. We found however an unexpected effect in non-learners, namely a progressive decrease in physiological responses to odors, irrespective of their valence, in the course of conditioning. While learners exhibited a rather constant level of responses to odors throughout conditioning, non-learners showed a significant decrease of calcium responses both for the CS+ and the CS− (see Figure 3A). As decreases in responses in a neurophysiological experiment are often due to a worsening of the animals’ condition, one should be careful in analyzing such a result. However, the effects observed in non-learners did not seem to be due to a fitness problem because all the bees responded with a SER to all shock presentations throughout conditioning. Additionally abnormal dye bleaching can also be excluded because calcium levels before stimulus delivery were identical between learners and non-learners throughout conditioning (data not shown).
Absence of a Neural Correlate of Olfactory Discrimination During Aversive SER Conditioning
The differential odor-shock association established through aversive SER conditioning in learners did not lead to any measurable modification in the neural activity of the antennal lobe in response to the CS+ and the CS−. The question therefore arises as to whether experience-dependent plasticity should be expected at this level. Given that our recordings emphasize the responses of olfactory receptor neurons (see above), one could argue that modifications of neural activity resulting from learning should not be visible at a presynaptic level but rather at a postsynaptic level, for instance at the level of 2nd-order neurons such as projection neurons conveying the olfactory message reshaped by the antennal lobe network to higher-order centers (mushroom bodies and lateral horn). From this perspective, the lack of a neural correlate for the differentiation between CS+ and CS− in learners would not be surprising.
This argument can be, however, partially questioned by previous findings, which found experience-dependent neural plasticity at the presynaptic, olfactory receptor level in the honeybee. Two studies on appetitive olfactory PER conditioning used the same dye and staining method as in our work and found learning-dependent changes in calcium activity in the antennal lobe on a medium-term basis. In one study (Faber et al., 1999), differential conditioning in which one odor was paired with sucrose (CS+) and another odor with absence of reinforcement (CS−) resulted in medium-term (10–30 min post-conditioning) quantitative changes in the glomerular pattern of the CS+, which became more intense. The glomerular pattern of the CS− remained unaffected. The result of this variation was that the activation patterns of CS+ and CS− could be decorrelated (Faber et al., 1999). In the other study, Sandoz et al. (2003) used the same staining and imaging procedure to detect learning-dependent modifications of antennal lobe activity in a side-specific olfactory discrimination. Bees were differentially conditioned using two odors CS1 and CS2. When odorants were delivered to one antenna, CS1 was rewarded with sucrose and CS2 was not (CS1+ vs. CS2−), while it was the opposite when odors were delivered to the other antenna (CS1− vs. CS2+). Imaging calcium responses in both antennal lobes simultaneously showed that in naïve bees, odor-response patterns were highly symmetrical, suggesting that before conditioning, the same odorant elicited the same activation pattern in both antennal lobes. In conditioned bees, topical differences between sides were found. After side-specific conditioning, the left and right representations of the same odorant became slightly different (Sandoz et al., 2003). This form of discrimination resulted, therefore, in a decorrelation of the representations of the conditioning odors between sides.
No such effect was found in our recordings, which used the same imaging procedure (Calcium Green-2 AM staining). One may be tempted to conclude that appetitive PER and aversive SER conditioning have different neuronal substrates, and that a form of peripheral plasticity (involving receptor neuron input) is found only in the case of appetitive PER conditioning. This conclusion would be, however, premature. Firstly, the medium-term changes in glomerular activity reported for olfactory PER conditioning were observed between 10 and 30 min after the last acquisition trial (Faber et al., 1999) or 24 h after conditioning (Sandoz et al., 2003) while in our case measures of glomerular activity were obtained “on-line” during conditioning trials. Secondly, the medium-term qualitative changes in glomerular activation reported for olfactory PER conditioning (Faber et al., 1999) have been contradicted by a recent study (Peele et al., 2006) that failed to demonstrate the same modifications in the medium term following similar differential conditioning. Peele et al. (2006) stained one of the tracts of projection neurons conveying information from the antennal lobe toward higher-order brain centers (lateral antenno-cerebralis tract, l-ACT), and found no changes within 15 min after appetitive differential conditioning. These authors concluded that the l-ACT may serve reliable and stable odor-coding while other projection neuron tracts (like the medial or mediolateral tracts, m- and ml-ACT) might be involved in carrying plastic changes to other brain areas. However, this idea was again contradicted very recently, as 24 h after differential conditioning with binary mixtures, a decorrelation between CS+ and CS− representations was found within l-ACT projection neurons (Fernandez et al., 2009). In electrophysiological experiments, differential conditioning leads to both increases and decreases in spike rates of projection neurons for all odors, including the CS+, the CS− and a control odor introduced to test odor generalization (Denker et al., 2010).
Despite these contradictory results, a number of studies indicate that the honeybee antennal lobe is subject to plastic changes following appetitive learning. The formation of long-term appetitive memories leads to structural changes in the antennal lobe which are odor-specific (Hourcade et al., 2009). Specifically, 3 days after PER conditioning, a period that corresponds to the presence of long-term memory in successfully conditioned bees, certain glomeruli increase significantly their volume in an odor-specific manner in comparison to pseudo-conditioned bees that did not establish such a long-term memory. Furthermore, an intracellular calcium increase at the time of appetitive PER conditioning is both necessary and sufficient for inducing transcription-dependent olfactory long-term memory (Perisse et al., 2009). How this calcium increase takes place in the brain, and how long it lasts is still unknown, but the modified calcium response observed by Faber et al. (1999), Sandoz et al. (2003), and Fernandez et al. (2009) could correspond to different phases of this process. In this case, the changes recorded by these authors would not correspond to a change in odor representation, but would rather be the by-product of molecular cascades leading to the long-term storage of appetitive information. At this moment, it is still unknown whether the formation of an aversive olfactory memory also depends on such early calcium signaling phenomenon. To answer this question we would need to search for this kind of signaling in a temporal window similar to that used by Faber et al. (1999), Sandoz et al. (2003), and Fernandez et al. (2009) in their recordings, i.e., 10–30 min and 24 h after the last acquisition trial, respectively.
These arguments attribute an inherent plasticity to the antennal lobe which would reflect the location of a memory trace within its network. A different view can be, however, proposed, suggesting that the olfactory memory trace generated by olfactory conditioning would be located downstream the antennal lobe, for instance, in the mushroom bodies (Heisenberg and Gerber, 2008). Within this conceptual framework, experience-dependent plasticity as occurring in the antennal lobe would be due to feedback processes from the mushroom bodies to the antennal lobes. Interestingly such processes exist in the form of feedback neurons (ALF-1 neurons) connecting mushroom bodies and antennal lobes (Kirschner et al., 2006). Studying if and how these neurons modulate the activity of the antennal lobe network following olfactory learning should help clarifying the issue of olfactory memory location.
A Decrease of Calcium Signals Upon Odor Stimulation in Non-Learners
In order to understand the significant effect found in our work, it is necessary to have in mind what our calcium imaging recordings really represent when it comes to analyze neural activity of the antennal lobe. We used a permeable calcium sensitive dye, Calcium Green-2 AM, to stain the antennal lobe. This dye can potentially stain all neuronal populations of the antennal lobe: afferents of olfactory receptor neurons, local interneurons, projection neurons and glial cells. However, the signals recorded at the level of the antennal lobe are thought to mainly represent the contribution of olfactory receptors (Galizia and Vetter, 2005; Deisig et al., 2006, 2010). This is due to the numeric overrepresentation of olfactory receptors with respect to other neuronal types in the antennal lobe and to the fact that recorded signals are highly stereotyped and never show any spontaneous activity or any inhibitory responses, which are typical for local interneurons and projection neurons (Sachse and Galizia, 2002). The participation of local interneurons or projection neurons in the compound signal recorded is thought to be negligible (Deisig et al., 2006, 2010). A significant part of the signal may come from glial cells surrounding each glomerulus but even if glial cells participate in the calcium signal their response would be directly correlated to olfactory receptor signals. Thus, the calcium signals recorded in our study mainly represent the signals conveyed by olfactory receptor neurons to the antennal lobe.
Why should these signals decrease (Figure 3A) upon olfactory stimulation during conditioning trials in non-learners? Clearly this effect was common both for the CS+ and the CS− and does not seem to be attributable to a fitness problem. Learners received the same amount of electric shocks and did not show such a decrease in calcium responses. Moreover, and most importantly, the decrease was specific to the olfactory stimulations as basal levels of fluorescence prior to odor delivery evolved in the same manner in learners and non-learners. It cannot thus be argued that non-learners exhibited a general, non-specific decrease in neural activity consistent with depressed levels of responsiveness.
In this context, the decrease in calcium signals upon olfactory stimulation may reflect inhibitory modulation of olfactory receptor neuron activity. In lobsters, presynaptic inhibition of olfactory receptor neurons has been demonstrated by recording from the afferent nerve terminals (Wachowiak and Ache, 1997, 1998). A preparation using the isolated but intact brain of the spiny lobster in combination with voltage-sensitive dye staining has allowed recording stimulus-evoked responses of olfactory receptor axons with optical imaging methods. The cellular mechanism underlying presynaptic afferent inhibition appears to be a reduction of action potential amplitude in the axon terminal via two inhibitory transmitters, GABA and histamine, which can independently mediate presynaptic inhibition. GABA- and histaminergic interneurons constitute dual, functionally distinct inhibitory pathways that are likely to play different roles in regulating primary olfactory input to the lobster olfactory lobe (Wachowiak et al., 2002). Interestingly, the same two inhibitory networks – GABAergic and histaminergic – have been found in the honeybee antennal lobe (Sachse and Galizia, 2002; Barbara et al., 2005; Sachse et al., 2006). One may hypothesize that the decrease of calcium responses upon olfactory stimulation in non-learners may be the result of an increased, maximized inhibitory action of inhibitory neurons, which would span the entire antennal lobe, affecting both CS+ and CS− processing. This effect would be different from less drastic increases in antennal lobe inhibition, which result in better olfactory discrimination performances (Stopfer et al., 1997). In our scenario, increased global inhibition affecting all or most glomeruli may have as a consequence a progressive reduction in perceptual distances between CS+ and CS−, which would impede discrimination. Why should inhibition progressively increase in non-learners? So far, we have no answer for this question. It could be seen, nevertheless, as a dysfunction of the olfactory network that prevented non-learners to provide adaptive responses in an olfactory discrimination.
Conclusion
Our results show how difficult the search for the neural correlates of associative learning can be. As these changes appear to be highly dependent on the time after conditioning, and sometimes correspond to a very short time-window, the search for learning-induced plasticity has to be carried out on a large scale. This temporal analysis should span numerous periods after conditioning, from the moment in which the association is formed to the latest stages of long-term memory (Berry et al., 2008). Moreover, different brain structures should be considered (Haehnel et al., 2009) in order to determine where the learning trace is located at different post-association periods. The development of this new tool to study aversive learning-induced modifications in the insect brain may be applied to such a large scale study.
Furthermore, it will be possible for the first time to perform comparative analyses between appetitive and aversive learning in honeybees, both at the behavioral and the cellular levels. Besides the established fact that US reinforcing properties are mediated by different aminergic systems in these two learning forms (octopaminergic system for sucrose reward, and dopaminergic system for electric-shock punishment), questions about the kind of discrimination problems that can be solved within these two experimental frameworks, the specific location of aversive vs. appetitive memories, and the nature of CS representation in both forms of conditioning can be now raised and answered.
Conflict of Interest Statement
The authors declare that the research was conducted in the absence of any commercial or financial relationships that could be construed as a potential conflict of interest.
Acknowledgments
We thank BEESHOP (European research grant “Bees in Europe and Sustainable Honey Production”), the French National Research Agency (Project BLAN08-3-337040 INSAVEL), the French Research Council (CNRS), and the University Paul Sabatier for generous support.
References
Barbara, G. S., Zube, C., Rybak, J., Gauthier, M., and Grünewald, B. (2005). Acetylcholine, GABA and glutamate induce ionic currents in cultured antennal lobe neurons of the honeybee, Apis mellifera. J. Comp. Physiol. A 191, 823–836.
Berry, J., Krause, W. C., and Davis, R. L. (2008). Olfactory memory traces in Drosophila. Prog. Brain Res. 169, 293–304.
Bitterman, M. E., Menzel, R., Fietz, A., and Schäfer, S. (1983). Classical conditioning of proboscis extension in honeybees (Apis mellifera). J. Comp. Physiol. A 97, 101–119.
Carcaud, J., Roussel, E., Giurfa, M., and Sandoz, J. C. (2009). Odour aversion after olfactory conditioning of the sting extension reflex in honeybees. J. Exp. Biol. 212, 620–626.
de Brito Sanchez, G., Ortigao-Farias, J. R., Gauthier, M., Liu, F., and Giurfa, M. (2007). Taste perception in honeybees: just a taste of honey? Arthropod Plant Interact. 1, 69–76.
Deisig, N., Giurfa, M., Lachnit, H., and Sandoz, J. C. (2006). Neural representation of olfactory mixtures in the honeybee antennal lobe. Eur. J. Neurosci. 24, 1161–1174.
Deisig, N., Giurfa, M., and Sandoz, J. C. (2010). Antennal lobe processing increases separability of odor mixture representations in the honeybee. J. Neurophysiol. 103, 2185–2194.
Denker, M., Finke, R., Schaupp, F., Grün, S., and Menzel, R. (2010). Neural correlates of odor learning in the honeybee antennal lobe. Eur. J. Neurosci. 31, 119–133.
Faber, T., Joerges, J., and Menzel, R. (1999). Associative learning modifies neural representations of odors in the insect brain. Nat. Neurosci. 2, 74–78.
Faber, T., and Menzel, R. (2001). Visualizing a mushroom body response to a conditioned odor in honeybees. Naturwissenschaften 88, 472–476.
Fernandez, P. C., Locatelli, F. F., Person-Rennell, N., Deleo, G., and Smith, B. H. (2009). Associative conditioning tunes transient dynamics of early olfactory processing. J. Neurosci. 29, 10191–10202.
Galizia, C. G., Joerges, J., Küttner, A., Faber, T., and Menzel, R. (1997). A semi-in-vivo preparation for optical recording of the insect brain. J. Neurosci. Methods 76, 61–69.
Galizia, C. G., and Kimmerle, B. (2004). Physiological and morphological characterization of honeybee olfactory neurons combining electrophysiology, calcium imaging and confocal microscopy. J. Comp. Physiol. A 190, 21–38.
Galizia, C. G., Nägler, K., Hölldobler, B., and Menzel, R. (1998). Odour coding is bilaterally symmetrical in the antennal lobes of honeybees (Apis mellifera). Eur. J. Neurosci. 10, 2964–2974.
Galizia, C. G., Sachse, S., Rappert, A., and Menzel, R. (1999a). The glomerular code for odor representation is species specific in the honeybee Apis mellifera. Nat. Neurosci. 2, 473–478.
Galizia, C. G., McIlwrath, S. L., and Menzel, R. (1999b). A digital three-dimensional atlas of the honeybee antennal lobe based on optical sections acquired by confocal microscopy. Cell Tissue Res. 295, 383–394.
Galizia, C. G., and Vetter, R. S. (2005). “Optical methods for analyzing odor-evoked activity in the insect brain,” in Methods in Insect Sensory Neuroscience, ed. T. A. Christensen (Boca Raton: CRC Press), 350–382.
Giurfa, M. (2007a). Behavioral and neural analysis of associative learning in the honeybee: a taste from the magic well. J. Comp. Physiol. A 193, 801–824.
Giurfa, M. (2007b). “Invertebrate cognition: nonelemental learning beyond simple conditioning,” in Invertebrate Neurobiology, eds G. North and R. J. Greenspan (New York: Cold Spring Harbor Monograph Series), 281–308.
Giurfa, M., Fabre, E., Flaven-Pouchon, J., Groll, H., Oberwallner, B., Vergoz, V., Roussel, E., and Sandoz, J. C. (2009). Olfactory conditioning of the sting extension reflex in honeybees: Memory dependence on trial number, interstimulus interval, intertrial interval, and protein synthesis. Learn. Mem. 16, 761–765.
Gottfried, J. A., O’Doherty, J., and Dolan, R. J. (2002). Appetitive and aversive olfactory learning in humans studied using event-related functional magnetic resonance imaging. J. Neurosci. 22, 10829–10837.
Guerrieri, F., Schubert, M., Sandoz, J. C., and Giurfa, M. (2005). Perceptual and neural olfactory similarity in honeybees. PLoS Biol. 3, e60. doi: 10.1371/journal.pbio.0030060.
Haehnel, M., Froese, A., and Menzel, R. (2009). In vivo Ca2+ imaging of mushroom body neurons during olfactory learning in the honey bee. J. Vis. Exp. 18, 1353.
Hammer, M. (1993). An identified neuron mediates the unconditioned stimulus in associative olfactory learning in honeybees. Nature 366, 59–63.
Heisenberg, M., and Gerber, B. (2008). “Behavioral analysis of learning and memory in Drosophila,” in Learning and Memory: A Comprehensive Reference, Vol. 1, ed. J. Byrne (Oxford: Elsevier), 549–560.
Hourcade, B., Perisse, E., Devaud, J. M., and Sandoz, J. C. (2009). Long-term memory shapes the primary olfactory center of an insect brain. Learn. Mem. 16, 607–615.
Joerges, J., Küttner, A., Galizia, C. G., and Menzel, R. (1997). Representations of odours and odour mixtures visualized in the honeybee brain. Nature 387, 285–288.
Kirschner, S., Kleineidam, C. J., Zube, C., Rybak, J., Grünewald, B., and Rössler, W. (2006). Dual olfactory pathway in the honeybee, Apis mellifera. J. Comp. Neurol. 499, 933–952.
Menzel, R. (2001). Searching for the memory trace in a mini-brain, the honeybee. Learn. Mem. 8, 53–62.
Menzel, R., Brembs, B., and Giurfa, M. (2007). “Cognition in invertebrates,” in Evolution of Nervous Systems, Vol. II: Evolution of Nervous Systems in Invertebrates, ed. J. H. Kaas (Oxford: Academic Press), 403–422.
Menzel, R., and Giurfa, M. (2001). Cognitive architecture of a mini-brain: the honeybee. Trends. Cogn. Sci. 5, 62–71.
Peele, P., Ditzen, M., Menzel, R., and Galizia, C. G. (2006). Appetitive odor learning does not change olfactory coding in a subpopulation of honeybee antennal lobe neurons. J. Comp. Physiol. A 192, 1083–1103.
Perisse, E., Raymond-Delpech, V., Neant, I., Matsumoto, Y., Leclerc, C., Moreau, M., and Sandoz, J. C. (2009). Early calcium increase triggers the formation of olfactory long-term memory in honeybees. BMC Biol. 7, 30. doi: 10.1186/1741-7007-7-30.
Sachse, S., and Galizia, C. G. (2002). Role of inhibition for temporal and spatial odor representation in olfactory output neurons: a calcium imaging study. J. Neurophysiol. 87, 1106–1117.
Sachse, S., and Galizia, C. G. (2003). The coding of odour-intensity in the honeybee antennal lobe: local computation optimizes odour representation. Eur. J. Neurosci. 18, 2119–2132.
Sachse, S., Peele, P., Silbering, A. F., Gühmann, M., and Galizia, C. G. (2006). Role of histamine as a putative inhibitory transmitter in the honeybee antennal lobe. Front. Zool. 3:22. doi: 10.1186/1742-9994-3-22.
Sachse, S., Rappert, A., and Galizia, C. G. (1999). The spatial representation of chemical structures in the AL of honeybees: steps towards the olfactory code. Eur. J. Neurosci. 11, 3970–3982.
Sandoz, J. C., Galizia, C. G., and Menzel, R. (2003). Side-specific olfactory conditioning leads to more specific odor representation between sides but not within sides in the honeybee antennal lobes. Neuroscience 120, 1137–1148.
Stetter, M., Greve, H., Galizia, C. G., and Obermayer, K. (2001). Analysis of calcium imaging signals from the honeybee brain by nonlinear models. Neuroimage 13, 119–128.
Stopfer, M., Bhagavan, S., Smith, B. H., and Laurent, G. (1997). Impaired odour discrimination on desynchronization of odour-encoding neural assemblies. Nature 390, 70–74.
Szyszka, P., Ditzen, M., Galkin, A., Galizia, C. G., and Menzel, R. (2005). Sparsening and temporal sharpening of olfactory representations in the honeybee mushroom bodies. J. Neurophysiol. 94, 3303–3313.
Szyszka, P., Galkin, A., and Menzel, R. (2008). Associative and non-associative plasticity in Kenyon cells of the honeybee mushroom body. Front. Syst. Neurosci. 2:3. doi: 10.3389/neuro.06.003.2008.
Thompson, R. F., McCormick, D. A., and Lavond, D. G. (1986). “Localization of the essential memory trace system for a basic form of associative learning in the mammalian brain,” in One Hundred Years of Psychological Research in America, eds S. H. Hulse, B. F. Green Jr (Baltimore: Johns Hopkins University Press), 125–171.
Vergoz, V., Roussel, E., Sandoz, J. C., and Giurfa, M. (2007). Aversive learning in honeybees revealed by the olfactory conditioning of the sting extension reflex. PLoS ONE 2, e288. doi: 10.1371/journal.pone.0000288.
Wachowiak, M., and Ache, B. W. (1997). Dual inhibitory pathways mediated by GABA- and histaminergic interneurons in the lobster olfactory lobe. J. Comp. Physiol. A 180, 357–372.
Wachowiak, M., and Ache, B. W. (1998). Multiple inhibitory pathways shape odor-evoked responses in lobster olfactory projection neurons. J. Comp. Physiol. A 182, 425–434.
Wachowiak, M., Cohen, L. B., and Ache, B. W. (2002). Presynaptic inhibition of olfactory receptor neurons in crustaceans. Microsc. Res. Tech. 58, 365–375.
Keywords: learning, memory, aversive conditioning, antennal lobe, calcium imaging, honeybee, Apis mellifera, sting extension reflex
Citation: Roussel E, Sandoz J-C and Giurfa M (2010) Searching for learning- dependent changes in the antennal lobe: simultaneous recording of neural activity and aversive olfactory learning in honeybees. Front. Behav. Neurosci. 4:155. doi: 10.3389/fnbeh.2010.00155
Received: 03 June 2010;
Paper pending published: 04 July 2010;
Accepted: 29 July 2010;
Published online: 01 September 2010
Edited by:
Jean-Marc Devaud, University Paul Sabatier, FranceReviewed by:
Bertram Gerber, Universität Würzburg, GermanyVanina Vergoz, University of Sydney, Australia
Copyright: © 2010 Roussel, Sandoz and Giurfa. This is an open-access article subject to an exclusive license agreement between the authors and the Frontiers Research Foundation, which permits unrestricted use, distribution, and reproduction in any medium, provided the original authors and source are credited.
*Correspondence: Jean-Christophe Sandoz, Laboratory Evolution Genomes Speciation, CNRS, 1 avenue de la Terrasse, F-91198 Gif-sur-Yvette, France. e-mail: sandoz@legs.cnrs-gif.fr