
94% of researchers rate our articles as excellent or good
Learn more about the work of our research integrity team to safeguard the quality of each article we publish.
Find out more
ORIGINAL RESEARCH article
Front. Behav. Neurosci. , 30 September 2010
Sec. Learning and Memory
Volume 4 - 2010 | https://doi.org/10.3389/fnbeh.2010.00158
 Stephan G. Anagnostaras1,2* Suzanne C. Wood1 Tristan Shuman1 Denise J. Cai1 Arthur D. LeDuc3 Karl R. Zurn3 J. Brooks Zurn3,4 Jennifer R. Sage1 Gerald M. Herrera3
The Pavlovian conditioned freezing paradigm has become a prominent mouse and rat model of learning and memory, as well as of pathological fear. Due to its efficiency, reproducibility and well-defined neurobiology, the paradigm has become widely adopted in large-scale genetic and pharmacological screens. However, one major shortcoming of the use of freezing behavior has been that it has required the use of tedious hand scoring, or a variety of proprietary automated methods that are often poorly validated or difficult to obtain and implement. Here we report an extensive validation of the Video Freeze system in mice, a “turn-key” all-inclusive system for fear conditioning in small animals. Using digital video and near-infrared lighting, the system achieved outstanding performance in scoring both freezing and movement. Given the large-scale adoption of the conditioned freezing paradigm, we encourage similar validation of other automated systems for scoring freezing, or other behaviors.
“The frightened man at first stands like a statue motionless and breathless, or crouches down as if instinctively to escape observation.” – Charles Darwin, The Expression of the Emotions in Man and Animals, 1872 (pp. 290–291).
The rapid growth of large scale genetic and pharmacological screening approaches has necessitated the development of efficient, accurate, automated phenotyping tools in rats and mice, including tools for the assessment of behavior, and assays of cognitive function (Clark et al., 2004; Crabbe and Morris, 2004; Tecott and Nestler, 2004; Reijmers et al., 2006; Matynia et al., 2008; Gale et al., 2009; Page et al., 2009). Research areas generating a high level of interest include the cognitive effects of genetic and pharmacological manipulation, especially effects on memory. In terms of drug development, assays of cognitive function serve a dual role: (1) providing characterization of important pharmacological targets (e.g., memory) for diseases such as Alzheimer’s or attention-deficit hyperactivity disorder, and (2) detection of unwanted cognitive side effects by using the assay as a toxicological screen (Takahashi, 2004; Shuman et al., 2009; Wood and Anagnostaras, 2009). In recent years, Pavlovian fear conditioning has become a leading model by which to study memory (Anagnostaras et al., 2000; Maren, 2008). Indeed, to a large degree the paradigm has displaced other tasks because of its efficiency and reproducibility.
In Pavlovian fear conditioning, an initially neutral conditional stimulus (CS; such as a tone) is paired with a fear-inducing, aversive unconditional stimulus (US; usually a footshock) in a novel chamber. After pairing, the animal develops a long-lasting fear of the discrete tone CS, known as tone or cued fear, as well as a fear of the environmental chamber, which has come to be known as contextual fear. Fear is often measured as freezing (defined as the suppression of all movement except that required for respiration) (Curti, 1935, 1942; Grossen and Kelley, 1972; Fanselow and Bolles, 1979; Fanselow, 1984), a prominent species-specific defense reaction in both rats and mice, with a long history of study (discussed below) (Bolles, 1970).
Contextual fear has garnered a very high level of interest because it is dependent on the hippocampus and as such, has become a leading model of declarative memory. As with human declarative memory, hippocampal lesions produce a time-limited and selective deficit of contextual fear, such that lesions made 1 day after training produce a severe retrograde amnesia of contextual fear, but those made one month or more after training produce little or no deficit (Kim and Fanselow, 1992; Anagnostaras et al., 1999b). Cued memory usually does not depend on the hippocampus, but can, especially as in trace conditioning, or when the ventral hippocampus is included (Maren, 1999; Maren and Holt, 2004; Quinn et al., 2008; Esclassan et al., 2009). In contrast, both contextual and tone fear depend on the amygdala for the lifetime of the animal (Gale et al., 2004; Poulos et al., 2009). Pavlovian fear conditioning is an effective assay for memory enhancements and deficits because:
(1) The task is robust in rats and mice, with conditioning occurring even after a single trial (Anagnostaras et al., 2000).
(2) The assay is not labor intensive; for example, a training session lasts 3–10 min, with 1-15 tone-shock pairings, as compared to several training days for most other forms of hippocampus-dependent memory.
(3) The equipment is readily available and compact, allowing many animals to be tested at once (up to 16 in a small office-sized room).
(4) The behavioral psychology of fear conditioning is well understood, and the stimuli well controlled, as it is one of the most studied forms of learning. Fear conditioning experiments form the cornerstones of contemporary theories of learning (e.g., Rescorla, 1968), and contextual learning has also been theoretically explored (Nadel and Willner, 1980).
(5) The assay is a model for both learning and memory, as well as pathological fear such as in the anxiety disorders (Anagnostaras et al., 1999a; Fendt and Fanselow, 1999).
(6) The learning episode is punctate, and the memory is very long-lasting, allowing for the study of memory phases with high temporal resolution (Bourtchuladze et al., 1994; Kida et al., 2002; Frankland et al., 2006; Reijmers et al., 2007; Matynia et al., 2008; Cai et al., 2009a,b).
(7) Some form of fear conditioning is shown by all animals in which it has been attempted, including Drosophila (Davis, 2005), C. elegans (Wen et al., 1997), and Aplysia (Walters et al., 1981), allowing for the possibility that some mechanisms are conserved across the entire animal kingdom (Davis, 2005; LeDoux, 2002).
(8) The neuroanatomy and molecular biology of fear conditioning have been extensively studied, offering a rich basis for future experiments (Selden et al., 1991; Phillips and LeDoux, 1992; Bourtchuladze et al., 1994; Kogan et al., 1997; Anagnostaras et al., 1999c; Kida et al., 2002; Miller et al., 2002; Frankland et al., 2004, 2006; Davis, 2005; Reijmers et al., 2006, 2007; Maren, 2008; Ehninger and Silva, 2009).
One aspect of the fear conditioning paradigm that may be improved is the measurement of freezing behavior. Historically, freezing has been scored by human observers, or by a variety of proprietary and often unvalidated automated systems. For manual scoring, rodent freezing is measured as percent time freezing for a given test period, which can be measured continuously with a stopwatch, or by instantaneous time sampling every 3–10 s (e.g., Bolles and Riley, 1973; Fanselow and Bolles, 1979; Bouton and Bolles, 1980; Collier and Bolles, 1980; Fanselow, 1980; Sigmundi et al.,1980; Phillips and LeDoux, 1992).
Although manual scoring has proven highly reliable, it is time consuming and tedious for experimenters and could lead to unwanted variability or bias. A number of automated systems have been proposed, which measure movement either using video algorithms or other forms of movement detection, and then threshold a particularly low movement value as freezing.
Despite the apparent simplicity of this task, a reliable and well-validated automated scoring system has been difficult to develop. In a prior report, Anagnostaras et al. (2000) detailed an accurate automated system and argued that very high correlation and excellent linear fit (intercept of 0 and slope of 1) between human and automated freezing scores were essential, as was the ability to score very low freezing (i.e., detect small movements), or very high freezing (detect no movement). Likewise, a system meeting these criteria would produce mean computer and human values (for group data) that are nearly identical (e.g., Anagnostaras et al., 2000, their Figure 3, and our Figure 4 below). Correlation alone is insufficient, because high correlation can be achieved with scores that are on a totally different scale, with a non-linear shape, and only across a small range of freezing values (Anscombe, 1973; Bland and Altman, 1986; Anagnostaras et al., 2000; Marchand et al., 2003). Although the system of Anagnostaras et al. (2000) scored freezing well it had several limitations, most prominently that it was not commercially available, and thus not feasible to update, distribute or support. Unfortunately, even 10 years later, few systems are well validated. Table 1 is an overview of the systems in mice for which we could find some validation published in scientific journals. A few have good validation and seem to score freezing well (Anagnostaras et al., 2000; Kopec et al., 2007; Pham et al., 2009). For others, no linear fit between human and automated scores is given, or it is unexceptional (Milanovic et al., 1998; Valentinuzzi et al., 1998; Stiedl et al., 1999; Fitch et al., 2002; Nielsen and Crnic, 2002; Misane et al., 2005). For example, Valentinuzzi et al. (1998) and Misane et al. (2005) use photobeam-based systems that produce fairly high intercepts (∼20%). In the case of Valentinuzzi et al. (1998) the system effectively doubles human scores as well (see their Figure 2). Although both authors suggest you could transform the data by subtracting the intercept, this would yield negative freezing scores for some animals, and instead Misane et al. (2005) rightfully treat it as a separate, but related measure, immobility. Photobeam-based systems, that have detectors placed 13 or more mm apart, may have difficulty achieving the spatial resolution needed to detect the very small movements (such as minor grooming or head sway) that are still not considered freezing (Marchand et al., 2003). Other automated systems did not report any human scores, and just demonstrated that their system could produce freezing scores of some sort (Richmond et al., 1998). Still others have not undertaken the step to fully publish a proper validation of their system as is undertaken here. Finally, others systems have been validated to some extent for rats, and may or may not be effective for mice (Maren, 1998, 2001; Takahashi, 2004).
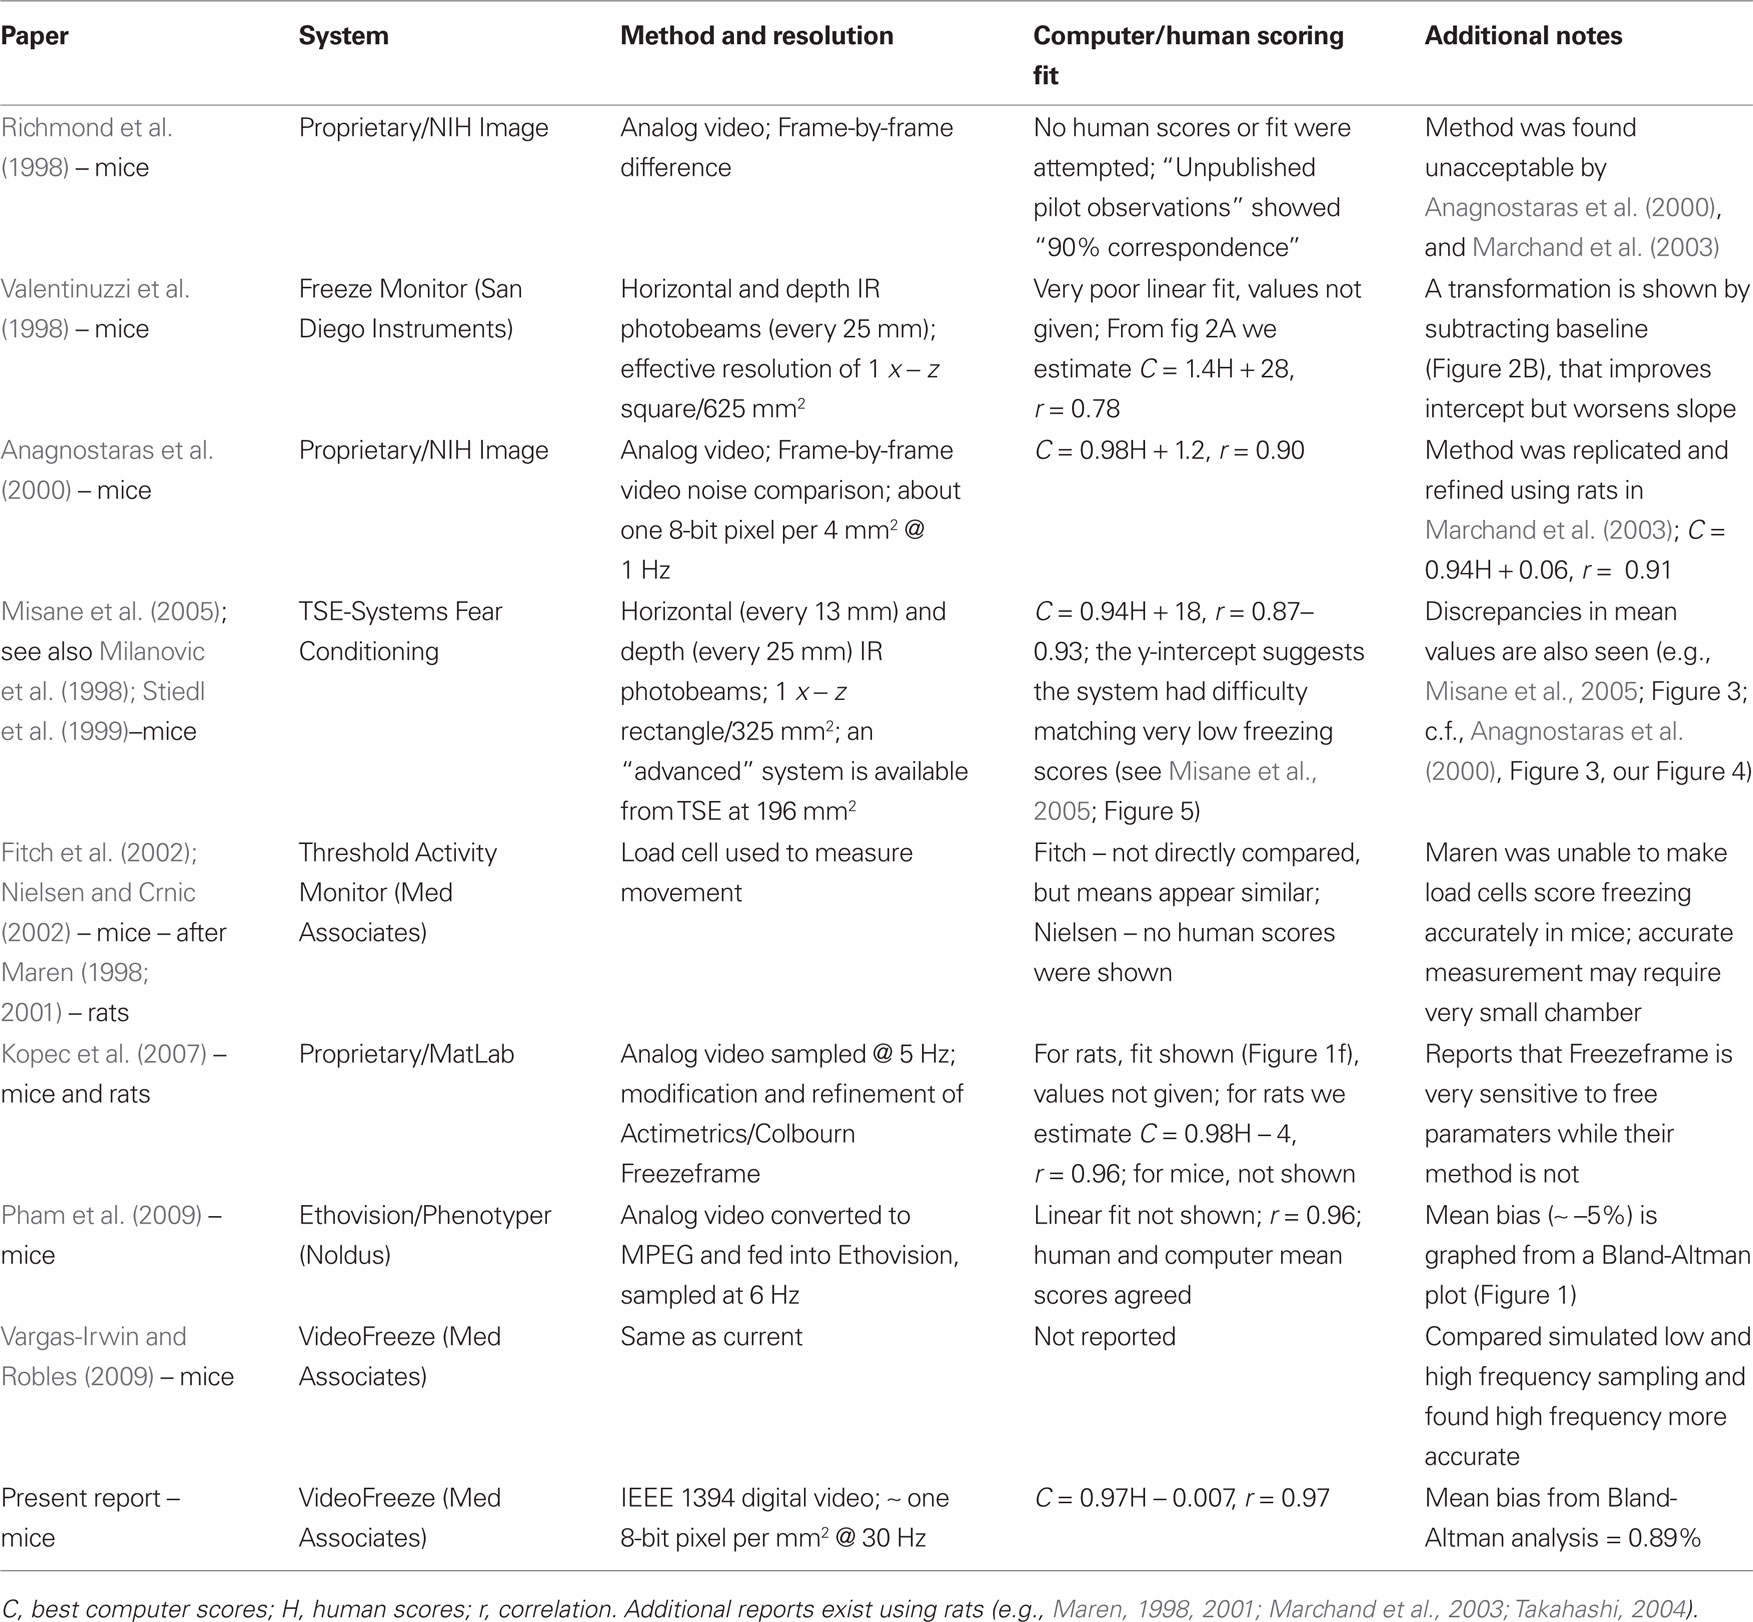
Table 1. Published methods for scoring freezing behavior in mice.
Here we report on the performance of the VideoFreeze system, developed in collaboration with Med-Associates Inc. This system includes significant advances, including (1) a turn-key behavioral system, with dedicated fear conditioning software, and everything needed to run and score fear conditioning experiments including chambers, software, lighting, ventilation, and environmental modifications, (2) progressive-scan digital video which eliminates problems associated with analog video and video storage, and reduces lighting sensitivity, and (3) LED-based white and near-infrared lighting, within an enclosure, along with a visible light filter for the camera, which ensures that the camera treats all lighting conditions as equal. This latter modification allows visible lighting conditions inside the chamber to be altered dramatically without affecting the camera’s image or how the computer scores movement or freezing. In this report, we validate the ability of this novel system to accurately score freezing. And, as in Anagnostaras et al. (2000) we document the use of this automated system to accurately assess locomotor activity, activity suppression, and shock reactivity, as auxiliary measures of fear conditioning.
Twenty Hybrid C57BL/6Jx129T2SvEms/J (129B6, stock from the Jackson Laboratory, West Sacramento, CA, USA) male and female (approximately equal numbers) agouti mice were used for this experiment. Mice were weaned 3 weeks after birth and were at least 10 weeks old at the time of testing. Mice were group housed (two to five mice per cage) with unrestricted access to food and water under a 14:10-h light-dark cycle. All animal care and experimental procedures were approved by the University of California, San Diego Institutional Animal Care and Use Committee and were in accordance with the National Research Council Guide for the Care and Use of Laboratory Animals.
Four mice were tested concurrently in individual conditioning chambers within a single room. Each clear polycarbonate (top, front), white acrylic (back), and stainless steel (sides, shock grids, drop pan) conditioning chamber (32 cm wide, 25 cm high, 25 cm deep; Med Associates Part Number VFC-008) was encased in a white sound-attenuated box (63.5 cm wide, 35.5 cm high, 76 cm deep; NIR-022MD) and was equipped with a speaker in the side wall and a stainless steel grid floor (36 rods, each rod 2-mm diameter, 8-mm center to center) and drop-pan. A proprietary overhead LED-based light source (Med Associates NIR-100) provided visible broad spectrum White Light (450–650 nm) and near-infrared light (NIR; 940 nm) (Zurn et al., 2007). Lab mice have color vision with cones of maximal sensitivity to ultraviolet (370 nm, short) and bluish-green (510 nm, middle) light, as well as a small number of melanopsin-expressing photoreceptors regulating circadian rhythm (480 nm), with little or no vision in the NIR range (rats are similar) (Jacobs et al., 1991; Hattar et al., 2003; Gouras and Ekesten, 2004). Mouse rods also have maximum absorption around 505 nm with no sensitivity beyond 700 nm (Lem et al., 1999). LED based lighting was chosen for its reliability, longevity, low power consumption, and low heat generation. Background noise (65 dBA) was provided by internal ventilation fans as well as an iPod/speaker combination playing white noise placed centrally in the testing room. Video images of the behavioral sessions were recorded at a frame rate of 30 frames per second (640 × 480, downsampled within the driver to 320 × 240 pixels; about 1 pixel per visible mm2) via an IEEE 1394a (Firewire 400) progressive scan CCD video camera (VID-CAM-MONO-2A) with a visible light filter (VID-LENS-NIR-1) contained within each chamber and connected to a computer in an adjacent room. Downsampling of pixels was necessary for real-time analysis of four chambers but did not adversely affect scoring. In contrast, a reduction in time sampling (e.g., from 30 to 15 Hz) reduced the quality of scores (not shown; see Vargas-Irwin and Robles, 2009). The interior of the training context, and a sample video frame can be seen in Figure 1A. A general activity index (Motion Index; see below) was derived in real time from the video stream by computer software (Video Freeze; SOF-843) running on a Windows computer. After a 2-min baseline period, 3 tone-shock pairings were administered, consisting of a 30-s pure tone (2.8-kHz, 85 dBA) coterminating with a 2-s scrambled footshock (0.75 mA, RMS, AC constant current) delivered through the floor of the cages. The mice remained in the context in order to score post-shock freezing behavior (which served as a way to measure Context freezing), resulting in a total of 10 min exposure to the conditioning context. Each chamber was cleaned and scented with 7% isopropyl alcohol between trials.
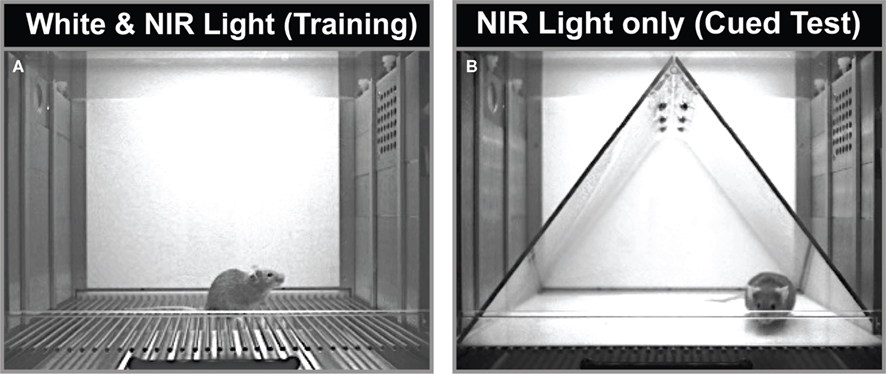
Figure 1. (A) Training and context test environment. Video still image (320 × 240, 8-bit grayscale) showing the environment with white and near-infrared light. (B) Tone Test Context. Video still showing the same chamber with environmental modifications, including a flat white acrylic sheet over the shock grids, a black triangular tee-pee (translucent only to NIR light, as shown), and NIR light only. The actual environment appeared to the unassisted eye as total darkness. The odor was also changed between the two environments.
Forty-eight hours after training, mice were placed in the original conditioning chambers, modified along a number of dimensions. The modified context contained a smooth white acrylic insert (ENV-005-GFCW) instead of the grid floor, and had a black plastic triangular tent (ENV-008-IRT translucent to only NIR light, placed inside the chamber. Mice, therefore, perceived their experience in the new context as being in near total darkness, while the camera, which has a visible light filter, saw little difference in lighting from one context to another. The chamber, from the camera’s view, can be seen in Figure 1B. Please note, however, that to the unassisted human or mouse eye, the tent appears black, and the chamber is in near total darkness. A 7% white vinegar solution replaced the alcohol solution for cleaning and scenting to provide a novel odor. The mice remained in this new context for a total of 5 min, consisting of a 2-min baseline period, followed by a 3-min presentation of the tone.
Freezing behavior of each mouse was scored post hoc by an experimenter using instantaneous time sampling while viewing the digital video playback of the experiment. Four chambers were viewed concurrently during scoring, in order to more closely replicate previous scoring protocols (Fanselow, 1980; Anagnostaras et al., 1999b, 2000). Freezing was defined in the tradition of the R.C. Bolles lab, as the absence of all movement, aside from that required for respiration (without regard to posture) (Grossen and Kelley, 1972; Bolles and Riley, 1973; Bolles and Collier, 1976; Fanselow and Bolles, 1979). This definition was developed in rats but is identically applied to mice (DeLorey et al., 1998; Anagnostaras et al., 2003). Every 2-s, a lap-interval timer signaled the experiment-blind observer to score freezing for a given animal at that moment. The observer rotated scoring among the four chambers being viewed, resulting in a single freezing score per mouse every 8 s. Percent freezing for a given period was then calculated by dividing the total number of freezing bouts by the total number of scores for each mouse (Bouton and Bolles, 1979, 1980; Fanselow and Bolles, 1979; Sigmundi et al., 1980). Two observers with inter-observer reliability of 0.94 scored behavior and their scores were averaged to generate a single human score. This sampling procedure is an efficient way of estimating continuous observation with a stopwatch (i.e., turning a count-up timer on whenever an animal froze and turning it off whenever the animal started moving; then taking the total time freezing over the total observation time (Bolles and Riley, 1973; Bolles and Collier, 1976; Phillips and LeDoux, 1992). Our test periods were divided into four blocks: (1) Training Baseline, the first 2 min of training prior to the first tone-shock pairing; (2) Post-Shock/Context, the last 5 min of training, after the shock; (3) Tone-Baseline, the first 2 min of the tone test, before the tone was turned on; and (4) Tone, the 3-min when the tone was on during the tone test). Each block was treated as a separate observation for correlational and linear fit analysis (i.e., there were 80 total human–computer pairs of observations, four pairs for each mouse). This approach allowed us to have observations from both the computer and human scorers at a variety of low and high levels of freezing.
A proprietary motion analysis algorithm was used to generate a Motion Index from the digital video stream in order to estimate the amount of mouse movement. This algorithm analyzed the video stream in real time, as it was being saved to disk, and it was capable of analyzing up to four video cameras simultaneously recording at 30 frames per second, 320 × 240 pixels, 8-bit grayscale. Briefly, a reference video sample is taken prior to placing the mouse into the chamber (“calibration”). This reference sample establishes the amount of baseline noise inherent in the video signal on a per pixel basis, across multiple successive frames. Once the mouse is placed in the chamber, successive video frames are continuously compared to each other and to the reference sample on a pixel by pixel basis. Any differences between pixels in the current video signal larger than those in the reference sample are interpreted as animal movement. These differences (in pixels) are summed for each image frame, and this summation is counted as the Motion Index. The Motion Index is the number of pixels that have changed within a designated time period more than they would change if the mouse was not present (i.e., video noise). As detailed below, the Motion Index is subjected to a Motion Index Threshold to generate freezing scores. Computer-derived freezing scores were systematically compared to hand scored freezing (below) across a range of user-entered parameters in order to generate the best linear fit and correlation between the computer-derived scores and human scores. For video storage, the four streams from the four chambers are saved into one Windows Media Video 9 file (WMV3 codec), 320 × 240 pixels (32 bits) per stream, 30 frames/s, with a variable total bitrate averaging about 1200 kb/s. These videos (Figure 1) require only 2.3 MB/min, per chamber, and therefore thousands of videos can be cheaply stored for many years on digital media.
Two algorithm parameters can be adjusted to generate freezing scores. VideoFreeze software now defaults these parameters to the values derived in this study for mice. The two parameters that can be adjusted are the Motion Index Threshold (below which freezing is scored), and the number of frames that the Motion Index must remain below the Motion Index Threshold to be considered freezing (Minimum Freeze Duration). In order for the animal to be considered freezing, the Motion Index must remain below the Motion Index Threshold for the Minimum Freeze Duration. In prior work, we found that a Minimum Freeze Duration of one full second (30 frames) produced the scores closest to human observers (who are instructed to make an instantaneous or momentary judgment) (Anagnostaras et al., 2000).
For this reason we examined correlation (Figure 2A) and the linear fit equation1 [y-intercept (b; Figure 2B) and slope (m; Figure 2C)] between human (x) and computer (y) scored freezing under varying conditions of Minimum Freeze Duration at 30 Hz (5, 10, 15, or 30 frames, i.e., 0.17, 0.33, 0.5 or 1 s) and varying Motion Index Thresholds (19-21, from pilot work, which was further refined from 15 to 25 once we settled on 30 frames for the Minimum Freeze Duration). A perfect scoring system would generate a correlation of 1.0, slope of 1.0, and y-intercept of 0 (i.e., y = 1x + 0). We feel that the y-intercept is of primary importance because any nonzero y-intercept would inflate or deflate freezing scores, including baseline freezing, by that amount (Anagnostaras et al., 2000). Graphpad Prism (La Jolla, CA, USA) was used for all analyses. Figure 2A depicts the correlation compared to the number of frames for various motion thresholds. Although the correlations between computer and human scores were always high (0.960 – 0.972), 30 frames (at 30 Hz = 1 full sec) of Minimum Freeze Duration generated the best correlations. We focused on 30 frames for the Minimum Freeze Duration and added additional Motion Index Threshold values, as shown in Figure 2. Figure 2B depicts the y-intercept (b) of the linear fit between computer and human scores for various motion thresholds. Again, 30 frames produced the smallest y-intercepts (–0.55 to 1.13%, compared to up to 8.74% for five frames), with a Motion Index Threshold of 18 producing the intercept closest to 0 (–0.007). Finally, Figure 2C depicts the slope (m) of the linear fit between computer and human scored freezing for various motion thresholds. 30 Frames easily generated the best slope (0.964 – 0.989, compared to as low as 0.950 for five frames). A Motion Index Threshold of 18 was chosen because of high correlation (0.971) and slope (0.974), with the y-intercept closest to 0 (–0.007 %). Again, the near-zero y-intercept is considered of primary importance because an automated scorer should not systematically generate inflated or deflated baseline freezing scores. Finally, a Minimum Freeze Duration of 30 frames (1 s) was chosen because this always produced the best correlation and linear fit across all conditions. Even when 30 frames are used as the Minimum Freeze Duration, the system still has a one second resolution for scoring freezing, which is far better than investigators need. Together, the chosen parameters are referred to as (18,30) and are explored further below. The final overall linear model comparing Video Freeze scores to human scores was VideoFreeze(18,30) = 0.974 (Human) – 0.007, r = 0.971, p < 0.0001 (Fisher’s r-to-z).
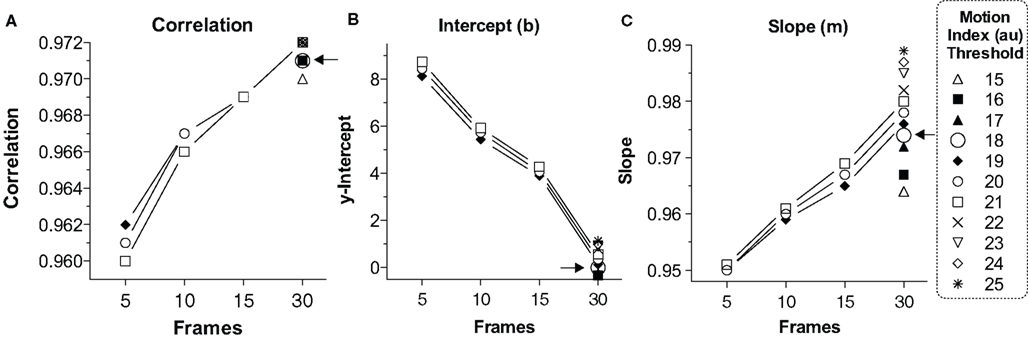
Figure 2. Linear fit and correlation for various video parameters. (A) Correlation. The linear correlation between VideoFreeze-scored and human-scored freezing is compared with number of frames (minimum freeze duration) for various motion index thresholds. A larger number of frames yielded higher correlations. (B) Intercept. The linear fit between VideoFreeze-scored and human-scored freezing is compared for the y-intercept. The y-intercept is important because it reflects how much the system overestimates or underestimates freezing. Larger number of video frames and lower motion thresholds yielded lower y-intercepts. A threshold of 18 yielded the lowest nonnegative intercept. (C) Slope. The slope term from the linear fit is depicted compared with frames and motion threshold. Larger frame numbers yielded a slope closer to 1. A motion threshold of 18 and number of frames of 30 was chosen for having the best combination of high correlation, intercept close to 0, and slope close to 1. Au, arbitrary units.
Training/contextual testing and tone (cued) testing are usually conducted in two different environments, on separate days (e.g., Anagnostaras et al., 1999b). In order to enhance efficiency and reduce cost and space requirements, our setup used the same physical chambers, but these were varied along several dimensions. The training chamber (Figure 1A) had shock grid floors, was lit with near infrared (NIR) and white light, and was scented with a 7% ethanol solution. On a separate day, tone testing was completed in the same chambers, but with a flat white acrylic sheet floor, a triangular teepee-like insert that was translucent to NIR but not visible light (Figure 1B), and a 7% white vinegar (10% acetic acid) solution for scenting. The use of weakly concentrated volatile non-oily odorants with low boiling points and high water solubility (e.g., 5–10% of ethanol, isopropanol, vinegar, ammonium hydroxide), which dissipate quickly and can be easily cleaned, is strongly preferred over the plethora of oily immiscible odorants which do not clear readily. The camera always had a visible light filter, so from the camera’s perspective, the lighting conditions remained the same (only NIR light was visible to the camera) during both testing days. From the eye’s perspective, however, lighting conditions appear to change dramatically between the contexts, since the mouse’s eye has no sensitivity in the NIR range. The tone testing context appears very dark when the visible light is turned off, whereas the other is quite bright. In order to ensure good scoring for the (18,30) parameters in each context, individual linear fit is shown for White Light (Figure 3A), or NIR light (Figure 3B). Linear fit and correlation remained exceptional across lighting conditions. Finally, Pham et al. (2009) argue that the Bland-Altman plot (widely used to estimate agreement in the medical sciences) may be more appropriate. This analysis, also known as the Tukey mean-difference plot, compares the deviation between computer and human scores, which is then called “bias” (Bland and Altman, 1986). Although we think a combination of linear fit and correlation are also critical, the mean bias (VideoFreeze–Handscore) computed using the Bland-Altman analysis was 0.90% ± .7.22 (μ ± 1 SD), and the Bland-Altman plot for all freezing data is shown (Figure 3C). Bias remained low within the White (1.49 ± 7.23) or NIR-only (0.30 ± 7.25) conditions. These compare favorably with the plotted value of about –5% in the Pham et al. study.
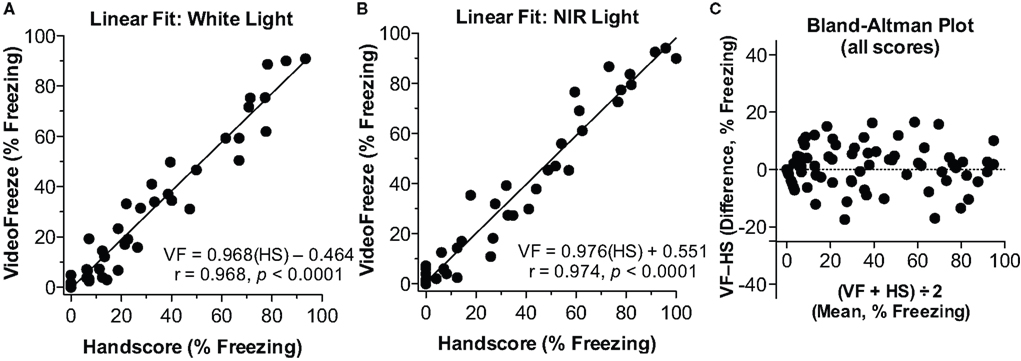
Figure 3. Linear fit and correlation for (18,30). (A) White Light. The linear fit between computer (VideoFreeze, VF) and human (Handscore, HS) scored freezing is depicted for the white light condition. (B) NIR light. The linear fit is depicted for the NIR light condition. In both cases, a nearly perfect fit and correlation were observed. (C) Bland–Altman Plot. The difference between computer (VF) and human (HS) scores is plotted against the mean of those two scores. There was good agreement between human and computer scores across the range of freezing scores. Mean bias was 0.89%.
Computer and human-scored group means were compared for the test components and are depicted in Figure 4. The training day (Figure 4A) consists of Baseline freezing (the first 2 min of the training day), and Context freezing (the last 5 min of the training day).
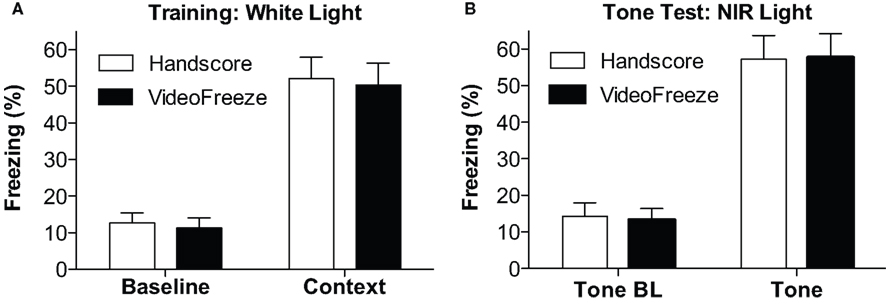
Figure 4. Comparison of mean freezing for (18,30). (A) Training. Freezing observed by humans and VideoFreeze is depicted for the baseline (first 2 min) during the training day and post-shock freezing (Context, last 3 min). (B) Tone Test. Freezing during the tone baseline (Tone BL, first 2 min) and during the tone (last 3 min) is depicted. In all cases, VideoFreeze estimated the means error nearly perfectly.
The Tone Test (Figure 4B) consists of Tone Baseline (the first two minutes of the tone test), and Tone (the period when the tone was on during the tone test). In all cases, the (18,30) algorithm generated means with <2% difference from hand-scored means, and standard errors with <0.5% difference from hand-scored data. Univariate ANOVAs for each measure (comparing human and computer scores) yielded F values <0.2, with p values >0.9. Therefore, the computer and hand scores were virtually identical.
An additional benefit of automated systems is the ability to measure locomotor activity, which can be useful in at least three different ways: First, baseline activity, prior to any tone or shock on the training day, can be a useful measure of general activity effects (such as in the open field). Activity during this period, for example, can readily detect the effects of hippocampal lesion or psychostimulant drugs (Anagnostaras et al., 1999b; Wood et al., 2007; Shuman et al., 2009; Wood and Anagnostaras, 2009). Raw mouse movement, as Motion Index, is shown in Figure 5A, for the initial training baseline, post-shock (context) period, tone test baseline, and tone test period. One can see that activity is high during initial placement into the chamber, and then drops as the animal sets into freezing [paired two-tailed t-test, t(19) = 8.64, p < 0.0001]. Moreover, activity is somewhat higher in the dark (NIR) environment, when the animal is placed in a novel context for the baseline of the tone test [versus training baseline, t(19) = 3.28, p < 0.01], and activity drops again when the tone is turned on [t(19) = 11.8, p < 0.0001]. We do not advocate the use of raw activity as a measure of fear, due to substantial variability in the individual animal’s baseline activity (Maren, 1998; Anagnostaras et al., 1999b). Rather, an activity suppression ratio (SR) can be computed, using the equation SR = (Activity on test)/(Activity on Test + Activity on Baseline). Suppression ratios of 0.5 indicate no fear (i.e., the same level of activity on test as on baseline), whereas those less than 0.5 indicate fear, and those more than 0.5 can indicate safety (Annau and Kamin, 1961; Bouton and Bolles, 1980; Maren et al., 1998; Anagnostaras et al., 2000). The use of conditioned suppression as an index of fear, including suppression of spontaneous activity, is well-validated and has some emerging popularity (Bouton and Bolles, 1980; Maren et al., 1998; Anagnostaras et al., 2000, 2003; Frankland et al., 2001; Matynia et al., 2008). When used with appropriate interpretive cautions, suppression scores can be particularly useful for handling situations where baseline differences in activity or freezing exist (Maren et al., 1998; Anagnostaras et al., 2000; Frankland et al., 2001; Restivo et al., 2009). Figure 5B shows activity suppression for the context and tone test. Finally, the gross motor reactivity to shock, known as the activity burst, or unconditioned response (UR), during the actual 2-s shock, can be used a measure of shock reactivity or pain (DeLorey et al., 1998; Anagnostaras et al., 1999c, 2000; Maren, 1999; Wood et al., 2007; Shuman et al., 2009; Wood and Anagnostaras, 2009). This can be important in situations where some concern exists that the animals might not feel the shock. In previous studies we have emphasized the use of a semi-automated procedure that required digitizing 10 Hz video and clicking on individual frames to identify the mouse and compute true speed (for full details see Maren, 1999; Anagnostaras et al., 2000). This is compared to the fully automated Motion Index from the Video Freeze software, captured at 30 Hz for the first 2 s shock, as shown in Figure 5C. The average Motion Index captured most of the variability of true speed (r = 0.841, p < 0.0001). Moreover, there was a good linear fit between Motion Index and true speed; although we prefer to report the Motion Index as arbitrary units (au), one can grossly compute activity burst speed (in cm/s) using this equation in mice: Speed = (Motion Index – 97.3)/36.8, with the appreciation that this estimate has some error. Overall, Motion Index is a good replacement for semi-automated methods of scoring the activity burst UR.
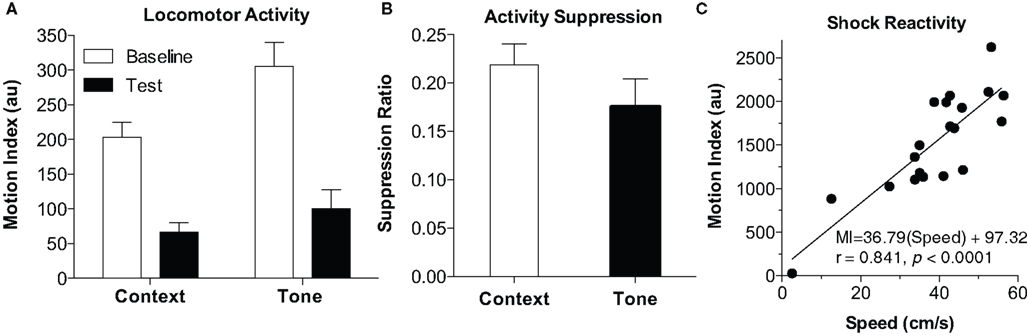
Figure 5. Motion Index. (A) Locomotor activity. The Motion Index can be used to estimate locomotor activity. Activity during the baseline from the training day (Context) and tone test (Tone) is depicted. Activity starts high (baseline, first 2 min) dramatically drops after conditioning (Test, last 3 min). Activity is higher in the NIR-only light during the tone test (Tone Baseline, first two min), and drops when the tone is played (Tone Test, last 3 min). (B) Activity suppression. Activity suppression scores can be used to correct for differences in baseline activity and can be used as an alternative measure of fear. (C) Shock Reactivity. The motion index during the 2-s shock is compared to true mouse speed. Shock reactivity could reliably be measured using the motion index and showed a good linear fit with true speed.
Pavlovian fear conditioning of freezing behavior is of growing importance to a number of fields related to neuroscience and psychology, as a highly efficient way of studying learning and memory (Anagnostaras et al., 2000, 2001; Maren, 2008). In particular, contextual conditioning is a popular model of declarative, hippocampus-dependent memory (Matynia et al., 2008). In both rats and mice, freezing is a robust conditioned fear response with very low baseline behavior – that is, freezing is not a behavior rats or mice typically perform in response to ordinary novel stimuli, giving it a large advantage over many other measures of fear. A primary drawback of freezing behavior has been that it required hand scoring by continuous or time-sampled direct visual observation.
The history of the visual method of scoring freezing is not well-known, and is worthy of review here as more researchers transition to automated scoring. Several references to this behavior as an expression of fear can be found in Darwin’s seminal The Expression of the Emotions (1872), such as the one in the opening paragraph of this paper (which is even quoted in William James’ 1890 Principles of Psychology). Freezing in rats was thought of as an instinctive fear response to cats as early as 1919 (Griffith, 1919; Curti, 1935, 1942). Within experimental psychology, a few references to freezing (and crouching) as a classically conditioned fear response exist at least since the 1950s (Hunt and Otis, 1953; Seward and Raskin, 1960). The modern popularity, however, is attributable to the R.C. Bolles laboratory (where Fanselow, Bouton, and Grossen were students), and the definition of freezing in rats (and mice) today mirrors that of Grossen and Kelley (1972). They closely followed the position of Bolles’ famous 1970 theoretical paper that championed the use of natural species-specific defense reactions (including freezing) as conditioned fear responses (Grossen and Kelley, 1972; Bolles and Riley, 1973; Bolles and Collier, 1976; Fanselow and Bolles, 1979). Grossen and Kelley stated that “Freezing behavior was defined as the rat being immobile without movement of the vibrissa.” This definition is very similar to that used by Bolles and colleagues (which allowed movements required for respiration during freezing), and is in sharp contrast to that used by R.J. and D.C. Blanchard for another defense behavior, crouching, which was time-sampled and defined as the “[rat’s] weight supported by its hindlimbs, which were contracted, with forelimbs extended” (Blanchard and Fial, 1968; Blanchard and Blanchard, 1969). Crouching is no doubt somewhat related to freezing in rats, which often exhibit this posture when scared, but it is not very apparent in mice, hence no longer preferred, and often cited incorrectly as the definition for freezing. Moreover, freezing was initially scored continuously with a stopwatch (i.e., switched “on” whenever an animal froze, and switched “off” whenever the animal started moving) thus generating a total freezing time that could be divided by the total observation time (Bolles and Riley, 1973; Bolles and Collier, 1976; Phillips and LeDoux, 1992). This technique was replaced by time-sampling in the Bolles laboratory around the time of J. Altmann’s (1974) paper on the validity of time-sampling of behavior, in general (Altmann, 1974). Instantaneous or momentary time-sampling of behavior is a highly validated method that is superior in terms of accuracy to other forms of time-sampling, and has been studied extensively (Altmann, 1974; Meyers and Grossen, 1974; Powell et al., 1975, 1977). Instantaneous time-sampling of freezing was used in the work of Curti (1935, 1942) and emerged in the published works of the R.C. Bolles laboratory around 1979–1980 (Fanselow and Bolles, 1979; Bouton and Bolles, 1980; Sigmundi et al., 1980) as an efficient way of estimating continuous observation with a stopwatch. Of course, the task’s popularity today is owed in great extent to the celebrated 1992 findings by J. J. Kim, M. S. Fanselow, R. G. Phillips, and J. E. LeDoux which clearly outlined the respective roles of the amygdala and hippocampus in conditioned freezing (Kim and Fanselow, 1992; Phillips and LeDoux, 1992).
Previously, Anagnostaras et al. (2000) reported a proprietary automated system of scoring that alleviated the burden of hand scoring, but which also had a number of shortcomings, most significantly, the lack of commercial availability. Here, we validate a new fear conditioning system that resolves those problems and offers a number of further refinements. Aside from commercial “turn-key” availability from a well-established and stable supplier, the technical refinements in this system make it truly state of the art: (1) digital video confers high resistance to electrical noise, and ensures that quality compressed videos can be stored indefinitely for later use, (2) the use of LED near-infrared lighting within a sound and light attenuating enclosure ensures lighting conditions viewed by the camera remain similar, even when drastic environmental modifications are made (Figure 1), and allows the same chambers to be used for context and tone testing, saving money and space, and (3) a sophisticated movement detection algorithm allows us to score very small movements needed to make a freezing determination, as well as large movements such as during the activity burst UR. Finally, we tested the ability of the system to score freezing and demonstrated that it produces freezing scores nearly identical to human observers, and can further score the high-speed activity burst UR.
As a final note, we strongly encourage experimenters to stay connected to the measured behavior by viewing at least some of the videos of animals’ during fear conditioning. We also encourage investigators to repeat for themselves the validation described here. Automated systems can detach the experimenter from the behavior, and with the increasing popularity of the conditioned freezing task, more and more researchers are using it as an assay of memory without having knowledge of the rich and long history of this task. However, it is only with deep knowledge and close observation and measurement of the behavior that the paradigm can ultimately be improved and refined.
Med-Associates Inc. supplied, manufactures and sells the equipment (Video Freeze and related components) described herein. Stephan G. Anagnostaras, Suzanne C. Wood, Tristan Shuman, Denise J. Cai, and Jennifer R. Sage report no conflict of interest and were not funded by Med-Associates Inc. Arthur D. LeDuc, Karl R. Zurn, J. Brooks Zurn, and Gerald M. Herrera are employees of Med-Associates Inc. Although publication of this paper will indirectly benefit Med-Associates Inc. and its employees, they were not specifically compensated for this activity.
This research was supported by a Hellman Fellowship (Stephan G. Anagnostaras). Suzanne C. Wood was supported by NSF Fellowship and NIH NRSA (DA026259). Tristan Shuman and Denise J. Cai were supported by Chancellor’s Interdisciplinary Collaboratories Grant. We thank Michael Fanselow, Mark Bouton, Ronald Sigmundi, Stephen Maren, and Neal Grossen for thoughtful historical information.
Anagnostaras, S. G., Craske, M. G., and Fanselow, M. S. (1999a). Anxiety: at the intersection of genes and experience. Nat. Neurosci. 2, 780–782.
Anagnostaras, S. G., Maren, S., and Fanselow, M. S. (1999b). Temporally graded retrograde amnesia of contextual fear after hippocampal damage in rats: within-subjects examination. J. Neurosci. 19, 1106–1114.
Anagnostaras, S. G., Maren, S., Sage, J. R., Goodrich, S., and Fanselow, M. S. (1999c). Scopolamine and Pavlovian fear conditioning in rats: dose-effect analysis. Neuropsychopharmacology 21, 731–744.
Anagnostaras, S. G., Gale, G. D., and Fanselow, M. S. (2001). Hippocampus and contextual fear conditioning: recent controversies and advances. Hippocampus 11, 8–17.
Anagnostaras, S. G., Josselyn, S. A., Frankland, P. W., and Silva, A. J. (2000). Computer-assisted behavioral assessment of Pavlovian fear conditioning in mice. Learn. Mem. 7, 58–72.
Anagnostaras, S. G., Murphy, G. G., Hamilton, S. E., Mitchell, S. L., Rahnama, N. P., Nathanson, N. M., and Silva, A. J. (2003). Selective cognitive dysfunction in acetylcholine M1 muscarinic receptor mutant mice. Nat. Neurosci. 6, 51–58.
Annau, Z., and Kamin, L. J. (1961). The conditioned emotional response as a function of intensity of the US. J. Comp. Physiol. Psychol. 54, 428–432.
Blanchard, R. J., and Blanchard, D. C. (1969). Crouching as an index of fear. J. Comp. Physiol. Psychol. 67, 370–375.
Blanchard, R. J., and Fial, R. A. (1968). Effects of limbic lesions on passive avoidance and reactivity to shock. J. Comp. Physiol. Psychol. 66, 606–612.
Bland, J. M., and Altman, D. G. (1986). Statistical methods for assessing agreement between two methods of clinical measurement. Lancet 1, 307–310.
Bolles, R. C. (1970). Species-specific defense reactions and avoidance learning. Psychol. Rev. 77, 32–48.
Bolles, R. C., and Collier, A. C. (1976). The effects of predictive cues on freezing in rats. Anim. Learn. Behav. 4, 6–8.
Bolles, R. C., and Riley, A. L. (1973). Freezing as an avoidance response: another look at the operant-respondent distinction. Learn.. Motiv. 4, 268–275.
Bourtchuladze, R., Frenguelli, B., Blendy, J., Cioffi, D., Schutz, G., and Silva, A. J. (1994). Deficient long-term memory in mice with a targeted mutation of the cAMP-responsive element-binding protein. Cell 79, 59–68.
Bouton, M. E., and Bolles, R. C. (1979). Role of conditioned contextual stimuli in reinstatement of extinguished fear. J. Exp. Psychol. Anim. Behav. Process. 5, 368–378.
Bouton, M. E., and Bolles, R. C. (1980). Conditioned fear assessed by freezing and by suppression of three different baselines. Anim. Learn. Behav. 8, 429–434.
Cai, D. J., Shuman, T., Gorman, M. R., Sage, J. R., and Anagnostaras, S. G. (2009a). Sleep selectively enhances hippocampus-dependent memory in mice. Behav. Neurosci. 123, 713–719.
Cai, D. J., Shuman, T., Harrison, E. M., Sage, J. R., and Anagnostaras, S. G. (2009b). Sleep deprivation and Pavlovian fear conditioning. Learn. Mem. 16, 595–599.
Clark, A. T., Goldowitz, D., Takahashi, J. S., Vitaterna, M. H., Siepka, S. M., Peters, L. L., Frankel, W. N., Carlson, G. A., Rossant, J., Nadeau, J. H., and Justice, M. J. (2004). Implementing large-scale ENU mutagenesis screens in North America. Genetica 122, 51–64.
Collier, A. C., and Bolles, R. C. (1980). The ontogenesis of defensive reactions to shock in preweanling rats. Dev. Psychobiol. 13, 141–150.
Crabbe, J. C., and Morris, R. G. (2004). Festina lente: late-night thoughts on high-throughput screening of mouse behavior. Nat. Neurosci. 7, 1175–1179.
Curti, M. W. (1935). Native fear responses of white rats in the presence of cats. Psychol. Rev. Monogr. 46, 78–98.
Curti, M. W. (1942). A further report on fear responses of white rats in the presence of cats. J. Comp. Psychol. 34, 51–53.
Davis, R. L. (2005). Olfactory memory formation in Drosophila: from molecular to systems neuroscience. Annu. Rev. Neurosci. 28, 275–302.
DeLorey, T. M., Handforth, A., Anagnostaras, S. G., Homanics, G. E., Minassian, B. A., Asatourian, A., Fanselow, M. S., Delgado-Escueta, A., Ellison, G. D., and Olsen, R. W. (1998). Mice lacking the beta3 subunit of the GABAA receptor have the epilepsy phenotype and many of the behavioral characteristics of Angelman syndrome. J. Neurosci. 18, 8505–8514.
Ehninger, D., and Silva, A. J. (2009). Genetics and neuropsychiatric disorders: treatment during adulthood. Nat. Med. 15, 849–850.
Esclassan, F., Coutureau, E., Di Scala, G., and Marchand, A. R. (2009). Differential contribution of dorsal and ventral hippocampus to trace and delay fear conditioning. Hippocampus 19, 33–44.
Fanselow, M. S. (1980). Conditioned and unconditional components of post-shock freezing. Pavlov. J. Biol. Sci. 15, 177–182.
Fanselow, M. S. (1984). Shock-induced analgesia on the formalin test: effects of shock severity, naloxone, hypophysectomy, and associative variables. Behav. Neurosci. 98, 79–95.
Fanselow, M. S., and Bolles, R. C. (1979). Naloxone and shock-elicited freezing in the rat. J. Comp. Physiol. Psychol. 93, 736–744.
Fendt, M., and Fanselow, M. S. (1999). The neuroanatomical and neurochemical basis of conditioned fear. Neurosci. Biobehav. Rev. 23, 743–760.
Fitch, T., Adams, B., Chaney, S., and Gerlai, R. (2002). Force transducer-based movement detection in fear conditioning in mice: a comparative analysis. Hippocampus 12, 4–17.
Frankland, P. W., Ding, H. K., Takahashi, E., Suzuki, A., Kida, S., and Silva, A. J. (2006). Stability of recent and remote contextual fear memory. Learn. Mem. 13, 451–457.
Frankland, P. W., Josselyn, S. A., Anagnostaras, S. G., Kogan, J. H., Takahashi, E., and Silva, A. J. (2004). Consolidation of CS and US representations in associative fear conditioning. Hippocampus 14, 557–569.
Frankland, P. W., O’Brien, C., Ohno, M., Kirkwood, A., and Silva, A. J. (2001). Alpha-CaMKII-dependent plasticity in the cortex is required for permanent memory. Nature 411, 309–313.
Gale, G. D., Anagnostaras, S. G., Godsil, B. P., Mitchell, S., Nozawa, T., Sage, J. R., Wiltgen, B., and Fanselow, M. S. (2004). Role of the basolateral amygdala in the storage of fear memories across the adult lifetime of rats. J. Neurosci. 24, 3810–3815.
Gale, G. D., Yazdi, R. D., Khan, A. H., Lusis, A. J., Davis, R. C., and Smith, D. J. (2009). A genome-wide panel of congenic mice reveals widespread epistasis of behavior quantitative trait loci. Mol. Psychiatry 14, 631–645.
Gouras, P., and Ekesten, B. (2004). Why do mice have ultra-violet vision? Exp. Eye Res. 79, 887–892.
Griffith, C. R. (1919). A possible case of instinctive behavior in the white rat. Science 50, 166–167.
Grossen, N. E., and Kelley, M. J. (1972). Species-specific behavior and acquisition of avoidance behavior in rats. J. Comp. Physiol. Psychol. 81, 307–310.
Hattar, S., Lucas, R. J., Mrosovsky, N., Thompson, N. S., Douglas, R. H., Hankins, M. W., Lemk, J., Biel, M., F. Hofmann, F., Foster, R. G., and Yau, K. -W. (2003). Melanopsin and rod–cone photoreceptive systems account for all major accessory visual functions in mice. Nature 424, 76–81.
Hunt, H. F., and Otis, L. S. (1953). Conditioned and unconditioned defecation in the rat. J. Comp. Physiol. Psychol. 46, 378–382.
Jacobs, G. H., Neitz, J., and Deegan, J. F. II. (1991). Retinal receptors in rodents maximally sensitive to ultraviolet light. Nature 353, 655–656.
Kida, S., Josselyn, S. A., Pena de Ortiz, S., Kogan, J. H., Chevere, I., Masushige, S., and Silva, A. J. (2002). CREB required for the stability of new and reactivated fear memories. Nat. Neurosci. 5, 348–355.
Kim, J. J., and Fanselow, M. S. (1992). Modality-specific retrograde amnesia of fear. Science 256, 675–677.
Kogan, J. H., Frankland, P. W., Blendy, J. A., Coblentz, J., Marowitz, Z., Schutz, G., and Silva, A. J. (1997). Spaced training induces normal long-term memory in CREB mutant mice. Curr. Biol. 7, 1–11.
Kopec, C. D., Kessels, H. W., Bush, D. E., Cain, C. K., LeDoux, J. E., and Malinow, R. (2007). A robust automated method to analyze rodent motion during fear conditioning. Neuropharmacology 52, 228–233.
Lem, J., Kraspoperova, N. V., Calvert, P. D., Kosaras, B., Cameron, D. A., Nicolo, M., Makino, C. L., and Sidman, R. L. (1999) Morphological, physiological, and biochemical changes in rhodopsin knockout mice. Proc. Natl. Acad. Sci. U.S.A. 96, 736–742.
Marchand, A. R., Luck, D., and DiScala, G. (2003). Evaluation of an improved automated analysis of freezing behaviour in rats and its use in trace fear conditioning. J. Neurosci. Methods 126, 145–153.
Maren, S. (1998). Overtraining does not mitigate contextual fear conditioning deficits produced by neurotoxic lesions of the basolateral amygdala. J. Neurosci. 18, 3088–3097.
Maren, S. (1999). Neurotoxic or electrolytic lesions of the ventral subiculum produce deficits in the acquisition and expression of Pavlovian fear conditioning in rats. Behav. Neurosci. 113, 283–290.
Maren, S. (2001). Is there savings for Pavlovian fear conditioning after neurotoxic basolateral amygdala lesions in rats? Neurobiol. Learn. Mem. 76, 268–283.
Maren, S. (2008). Pavlovian fear conditioning as a behavioral assay for hippocampus and amygdala function: cautions and caveats. Eur. J. Neurosci. 28, 1661–1666.
Maren, S., Anagnostaras, S. G., and Fanselow, M. S. (1998). The startled seahorse: is the hippocampus necessary for contextual fear conditioning. Trends Cogn. Sci. 2, 39–42.
Maren, S., and Holt, W. G. (2004). Hippocampus and Pavlovian fear conditioning in rats: muscimol infusions into the ventral, but not dorsal, hippocampus impair the acquisition of conditional freezing to an auditory conditional stimulus. Behav. Neurosci. 118, 97–110.
Matynia, A., Anagnostaras, S. G., Wiltgen, B. J., Lacuesta, M., Fanselow, M. S., and Silva, A. J. (2008). A high through-put reverse genetic screen identifies two genes involved in remote memory in mice. PLoS ONE 3: e2121. doi:10.1371/journal.pone.0002121.
Meyers, L. S., and Grossen, N. E. (1974). Behavioral Research: Theory, Procedure, and Design. San Francisco: W.H. Freeman.
Milanovic, S., Radulovic, J., Laban, O., Stiedl, O., Henn, F., and Spiess, J. (1998). Production of the Fos protein after contextual fear conditioning of C57BL/6N mice. Brain Res. 784, 37–47.
Miller, S., Yasuda, M., Coats, J. K., Jones, Y., Martone, M. E., and Mayford, M. (2002). Disruption of dendritic translation of CaMKIIalpha impairs stabilization of synaptic plasticity and memory consolidation. Neuron 36, 507–519.
Misane, I., Tovote, P., Meyer, M., Spiess, J., Ogren, S. O., and Stiedl, O. (2005). Time-dependent involvement of the dorsal hippocampus in trace fear conditioning in mice. Hippocampus 15, 418–426.
Nadel, L., and Willner, J. (1980). Context and conditioning – a place for space. Physiol Psychol 8, 218–228.
Nielsen, D. M., and Crnic, L. S. (2002). Automated analysis of foot-shock sensitivity and concurrent freezing behavior in mice. J. Neurosci. Methods 115, 199–209.
Page, D. T., Kuti, O. J., and Sur, M. (2009). Computerized assessment of social approach behavior in mouse. Front. Behav. Neurosci. 3, 48. doi: 10.3389/neuro.08.048.2009.
Pham, J., Cabrera, S. M., Sanchis-Segura, C., and Wood, M. A. (2009). Automated scoring of fear-related behavior using EthoVision software. J. Neurosci. Methods 178, 323–326.
Phillips, R. G., and LeDoux, J. E. (1992). Differential contribution of amygdala and hippocampus to cued and contextual fear conditioning. Behav. Neurosci. 106, 274–285.
Poulos, A. M., Li, V., Sterlace, S. S., Tokushige, F., Ponnusamy, R., and Fanselow, M. S. (2009). Persistence of fear memory across time requires the basolateral amygdala complex. Proc. Natl. Acad. Sci. U.S.A. 106, 11737–11741.
Powell, J., Martindale, A., and Kulp, S. (1975). An evaluation of time-sample measures of behavior. J. Appl. Behav. Anal. 8, 463–469.
Powell, J., Martindale, B., Kulp, S., Martindale, A., and Bauman, R. (1977). Taking a closer look: time sampling and measurement error. J. Appl. Behav. Anal. 10, 325–332.
Quinn, J. J., Wied, H. M., Ma, Q. D., Tinsley, M. R., and Fanselow, M. S. (2008). Dorsal hippocampus involvement in delay fear conditioning depends upon the strength of the tone-footshock association. Hippocampus 18, 640–654.
Reijmers, L. G., Coats, J. K., Pletcher, M. T., Wiltshire, T., Tarantino, L. M., and Mayford, M. (2006). A mutant mouse with a highly specific contextual fear-conditioning deficit found in an N-ethyl-N-nitrosourea (ENU) mutagenesis screen. Learn. Mem. 13, 143–149.
Reijmers, L. G., Perkins, B. L., Matsuo, N., and Mayford, M. (2007). Localization of a stable neural correlate of associative memory. Science 317, 1230–1233.
Rescorla, R. A. (1968). Probability of shock in the presence and absence of CS in fear conditioning. J. Comp. Physiol. Psychol. 66, 1–5.
Restivo, L., Vetere, G., Bontempi, B., and Ammassari-Teule, M. (2009). The formation of recent and remote memory is associated with time-dependent formation of dendritic spines in the hippocampus and anterior cingulate cortex. J. Neurosci. 29, 8206–8214.
Richmond, M. A., Murphy, C. A., Pouzet, B., Schmid, P., Rawlins, J. N., and Feldon, J. (1998). A computer controlled analysis of freezing behaviour. J. Neurosci. Methods 86, 91–99.
Selden, N. R., Everitt, B. J., Jarrard, L. E., and Robbins, T. W. (1991). Complementary roles for the amygdala and hippocampus in aversive conditioning to explicit and contextual cues. Neuroscience 42, 335–350.
Seward, J. P., and Raskin, D. C. (1960). The role of fear in aversive behavior. J. Comp. Physiol. Psychol. 53, 328–335.
Shuman, T., Wood, S. C., and Anagnostaras, S. G. (2009). Modafinil and memory: effects of modafinil on Morris water maze learning and Pavlovian fear conditioning. Behav. Neurosci. 123, 257–266.
Sigmundi, R. A., Bouton, M. E., and Bolles, R. C. (1980). Conditioned freezing in the rat as a function of shock intensity and CS modality. Bull. Psychon. Soc. 15, 254–256.
Stiedl, O., Radulovic, J., Lohmann, R., Birkenfeld, K., Palve, M., Kammermeier, J., Sananbenesi, F., and Spiess, J. (1999). Strain and substrain differences in context- and tone-dependent fear conditioning of inbred mice. Behav. Brain Res. 104, 1–12.
Takahashi, H. (2004). Automated measurement of freezing time to contextual and auditory cues in fear conditioning as a simple screening method to assess learning and memory abilities in rats. J. Toxicol. Sci. 29, 53–61.
Tecott, L. H., and Nestler, E. J. (2004). Neurobehavioral assessment in the information age. Nat. Neurosci. 7, 462–466.
Valentinuzzi, V. S., Kolker, D. E., Vitaterna, M. H., Shimomura, K., Whiteley, A., Low-Zeddies, S., Turek, F. W., Ferrari, E. A., Paylor, R., and Takahashi, J. S. (1998). Automated measurement of mouse freezing behavior and its use for quantitative trait locus analysis of contextual fear conditioning in (BALB/cJ x C57BL/6J)F2 mice. Learn. Mem. 5, 391–403.
Vargas-Irwin, C., and Robles, J. R. (2009). Effect of sampling frequency on automatically-generated activity and freezing scores in a Pavlovian fear-conditioning preparation. Rev. Latinoam. Psicol. 41, 187–195.
Walters, E. T., Carew, T. J., and Kandel, E. R. (1981). Associative Learning in Aplysia: evidence for conditioned fear in an invertebrate. Science 211, 504–506.
Wen, J. Y., Kumar, N., Morrison, G., Rambaldini, G., Runciman, S., Rousseau, J., and van der Kooy, D. (1997). Mutations that prevent associative learning in C. elegans. Behav. Neurosci. 111, 354–368.
Wood, S. C., and Anagnostaras, S. G. (2009). Memory and psychostimulants: modulation of Pavlovian fear conditioning by amphetamine in C57BL/6 mice. Psychopharmacology (Berl.) 202, 197–206.
Wood, S. C., Fay, J., Sage, J. R., and Anagnostaras, S. G. (2007). Cocaine and Pavlovian fear conditioning: dose-effect analysis. Behav. Brain Res. 176, 244–250.
Keywords: fear, classical conditioning, hippocampus, amygdala, phenotyping, memory, anxiety
Citation: Anagnostaras SG, Wood SC, Shuman T, Cai DJ, LeDuc AD, Zurn KR, Zurn JB, Sage JR and Herrera GM (2010) Automated assessment of Pavlovian conditioned freezing and shock reactivity in mice using the VideoFreeze system. Front. Behav. Neurosci. 4:158. doi: 10.3389/fnbeh.2010.00158
Received: 26 October 2009;
Paper pending published: 04 November 2009;
Accepted: 09 August 2010;
Published online: 30 September 2010.
Edited by:
Jeansok J. Kim, University of Washington, USAReviewed by:
Paul W. Frankland, Hospital for Sick Children, CanadaCopyright: © 2010 Anagnostaras, Wood, Shuman, Cai, LeDuc, Zurn, Zurn, Sage and Herrera. This is an open-access article subject to an exclusive license agreement between the authors and the Frontiers Research Foundation, which permits unrestricted use, distribution, and reproduction in any medium, provided the original authors and source are credited.
*Correspondence: Stephan G. Anagnostaras, Department of Psychology, University of California, San Diego, 9500 Gilman Drive MC 0109, La Jolla, CA 92093-0109, USA. e-mail:stephana@ucsd.edu
Disclaimer: All claims expressed in this article are solely those of the authors and do not necessarily represent those of their affiliated organizations, or those of the publisher, the editors and the reviewers. Any product that may be evaluated in this article or claim that may be made by its manufacturer is not guaranteed or endorsed by the publisher.
Research integrity at Frontiers
Learn more about the work of our research integrity team to safeguard the quality of each article we publish.