Adult mouse basal forebrain harbors two distinct cholinergic populations defined by their electrophysiology
- 1Center for Molecular and Behavioral Neuroscience, Rutgers, The State University of New Jersey, Newark, NJ, USA
- 2Federated Department of Biological Sciences, New Jersey Institute of Technology, Newark, NJ, USA
- 3Department of Mathematical Sciences, New Jersey Institute of Technology, Newark, NJ, USA
We performed whole-cell recordings from basal forebrain (BF) cholinergic neurons in transgenic mice expressing enhanced green fluorescent protein (eGFP) under the control of the choline acetyltransferase promoter. BF cholinergic neurons can be differentiated into two electrophysiologically identifiable subtypes: early and late firing neurons. Early firing neurons (∼70%) are more excitable, show prominent spike frequency adaptation and are more susceptible to depolarization blockade, a phenomenon characterized by complete silencing of the neuron following initial action potentials. Late firing neurons (∼30%), albeit being less excitable, could maintain a tonic discharge at low frequencies. In voltage clamp analysis, we have shown that early firing neurons have a higher density of low voltage activated (LVA) calcium currents. These two cholinergic cell populations might be involved in distinct functions: the early firing group being more suitable for phasic changes in cortical acetylcholine release associated with attention while the late firing neurons could support general arousal by maintaining tonic acetylcholine levels.
Introduction
Basal forebrain (BF) areas include the medial septum, vertical, and horizontal limbs of the diagonal band, pallidal regions (ventral pallidum and globus pallidus) and the substantia innominata/extended amygdala. These areas contain a heterogeneous collection of cholinergic, GABAergic, glutamatergic, peptidergic projection neurons, and interneurons (Zaborszky and Duque, 2003; Zaborszky et al., 2012). This brain region is involved in sleep-wake regulation, motivation, learning-memory, and attention (Buzsaki et al., 1988; Saper et al., 2005; Steriade and McCarley, 2005; Datta and Maclean, 2007; Parikh and Sarter, 2008; Goard and Dan, 2009). A prominent feature of the region is the continuous collection of aggregated and non-aggregated, large, cortically projecting neurons that synthesize acetylcholine (ACh) that serves as the primary source of cholinergic input to the cerebral cortex. BF cholinergic neurons are compromised in several diseases, including Alzheimer's disease, schizophrenia, Parkinson's disease, Rett's syndrome, and autism (Bowen, 1976; Perry et al., 1978; Wenk and Mobley, 1996). Anatomically, cholinergic neurons are heterogeneous inasmuch as they have been shown to be variously colocalized with galanin (Melander and Staines, 1986), GABA (Brashear et al., 1986; Kosaka et al., 1988), N-acetyl-aspartyl-glutamate (Forloni et al., 1987), tyrosine hydroxylase (Henderson, 1987), calbindin (Chang and Kuo, 1991), and secretagogin (Gyengesi et al., 2010), among others. In addition to various neuroactive substances, cholinergic neurons are bestowed with various receptors that show differential regional distribution and species differences (for references see Harkany et al., 2003; Zaborszky et al., 2004; Hur et al., 2009; Zaborszky et al., 2012).
Single unit activity of cholinergic neurons using juxtacellular labeling in anesthetized (Duque et al., 2000; Manns et al., 2000) and in head-restrained rats (Lee et al., 2005; Hassani et al., 2009) along with cortical EEG recordings, lend support to earlier ideas suggesting an important role of BF cholinergic neurons in cortical arousal (Detari and Vanderwolf, 1987). However, the heterogeneous firing properties of cholinergic neurons (Bengtson and Osborne, 2000; Duque et al., 2000; Garrido-Sanabria et al., 2007; Hassani et al., 2009), add further complexity to understanding the specific role of cholinergic neurons in the various functions and disease states alluded to above.
Intrinsic membrane properties of cholinergic neurons have been characterized in previous studies using different approaches and species (Griffith, 1988; Markram and Segal, 1990; Alonso et al., 1996; Hedrick and Waters, 2010). To confirm the cholinergic phenotype of the recorded neurons, post-hoc histochemistry for acetylcholine esterase (AChE), the ACh degrading enzyme (Griffith, 1988), immunostaining for choline-acetyltransferase (ChAT), the enzyme that synthesizes ACh (Khateb et al., 1992) and single-cell PCR (Han et al., 2005) have been used. Also, in vivo pre-labeling before electrophysiology has been applied using an antibody against the p75 receptor (Wu et al., 2000). The various technical challenges in identifying a cholinergic phenotype in these studies can be circumvented by using mice genetically engineered to express green fluorescent protein (GFP) under the promoter of ChAT.
Using adult mice, we conducted in vitro patch clamp recordings from cholinergic cells sampled from the entire extent of the BF in transgenic ChAT-eGFP mice with the goal of obtaining a detailed knowledge of the intrinsic physiology of cholinergic neurons. Cholinergic BF neurons could be subdivided into two populations based on their firing delays in response to depolarizing current injections. Hence, we refer to them as early- (EF) and late-firing (LF) neurons. EF neurons discharged at higher frequencies in response to intracellular current injections but this was accompanied by a prominent spike frequency adaptation. In many instances, these neurons stopped firing after an initial discharge. On the other hand, LF neurons were less excitable but could maintain a tonic firing pattern even in response to longer (10 s of seconds) current injections. Our results suggest that this heterogeneity is achieved through the intricate interplay among different voltage-gated calcium and potassium conductances. The mechanisms underlying these differences and their possible functional implications are discussed.
Materials and Methods
Animals
All experiments were performed in accordance with the US Public Health Service Policy on Humane Care and Use of Laboratory Animals, the National Institutes of Health Guidelines for the Care and Use of Animals in Research, and approved by the Rutgers University Institutional Review Board. Adult BAC transgenic mice (30–90 days old) expressing enhanced green fluorescent protein (eGFP) under the promoter of ChAT [B6.Cg-Tg(RP23-268L19-EGFP)2 Mik/J] were used (Jackson Laboratories, Bar Harbor Maine). The animals were anesthetized with i.p. injections of ketamine/xylazine mixture (150 and 30 mg/kg, respectively) and transcardially perfused with an ice cold perfusion solution containing (in mM): 248 sucrose, 2.5 KCl, 7 MgCl2, 23 NaHCO3, 1.2 NaHPO4, and 7 glucose. The brains were removed and a block containing the BF was secured on a vibratome and 250 μm coronal slices were obtained.
Electrophysiological Recordings
The slicing chamber in the vibratome contained the same solution used for perfusion. The slices were kept at room temperature (22–25°C) for at least 1 h in oxygenated artificial cerebrospinal fluid (ACSF) (95% O2 + 5%CO2) containing (in mM): 124 NaCl, 2.5 KCl, 1.2 NaHPO4, 26 NaHCO3, 1.3 MgCl2, 2 CaCl2, 10 glucose. In a subset of experiments measuring whole-cell Ba2+ currents, a modified ACSF (in mM) 79.5 NaCl, 2.5 KCl, 1.2 NaHPO4, 26 NaHCO3, 1.3 MgCl2, 2 CaCl2, 10 glucose, 40 TEA, and 5 BaCl2 was used. 1 μM TTX was also present in the solution to block sodium channels. The slices were visualized with an Olympus BX51WI (Center Valley, PA) microscope, equipped with infrared differential contrast optics and epifluorescence setup, and superfused with oxygenated ACSF (3–5 ml/min) at room temperature. Whole-cell patch-clamp recordings were obtained from GFP+ neurons with glass pipettes (4–8 MΩ tip resistance with recording solutions) pulled with a horizontal puller (P-97, Sutter Instrument, Novato, CA). The intracellular solution (KMeSO4) contained (in mM): 130 KMeSO4, 10 NaCl, 2 MgCl2, 10 HEPES, 3 Na2ATP, 0.3 GTP, 1 EGTA, pH 7.3. For Ba2+ current measurements, a modified CsMeSO4 intracellular containing (in mM): 125 CsMeSO4, 16 K-gluconate, 2 MgCl2, 10 HEPES, 3 Na2ATP, 0.3 Na3GTP, 1 EGTA, and 0.1 CaCl2, pH 7.3 was used (see below). The junction potential was experimentally determined to be 10 ± 2 mV for all solution combinations and was not corrected for. Data acquisition started 10 min after access to the cell to allow sufficient stabilization of the recording. Specific BF subregions targeted are described in the Results.
All recordings used had stable access resistances (<10% change throughout recording) of less than 20 MΩ and were obtained only if a GΩ seal formed before whole-cell access. An Axoclamp 900A amplifier and Digidata 1440A data acquisition device (Molecular Devices, Palo Alto, CA) were used for recordings. Voltage clamp experiments were done in discontinuous mode with a sampling frequency of 10 kHz and filtered at 2 kHz. Voltage-current (V-I) relationships were generated for each neuron using 500 ms current pulses ranging from −100 to +120 pA in 20 pA increments at 0.33 Hz in bridge mode. These pulses were delivered from −70 mV unless otherwise indicated. In some recordings, higher current amplitudes were used if necessary (see electrophysiological parameters tested). Analysis of current clamp recordings was done for data obtained from −70 mV unless otherwise stated. In all voltage clamp recordings the voltage monitor was continuously examined to ascertain sufficient return to baseline of the membrane potential prior to each voltage measurement cycle. Current densities were calculated by dividing the maximal current by whole-cell capacitance. Whole-cell capacitance was determined by injecting 5 mV hyperpolarizing voltage steps from −70 mV and integrating the area of the associated transient. Access resistance was calculated from the linear portion of membrane hyperpolarization in response to a −20 pA current pulse from a holding potential of ∼−70 mV in current clamp mode.
Cells were kept both at −90 and −40 mV and voltage steps of 500 ms duration were applied in 10 mV steps up to +10 mV at 0.33 Hz for the investigation of transient outward currents. In a subset (n = 6) of neurons, 1 second-long voltage steps were presented in −10 mV increments at 0.33 Hz from a holding potential of −40 mV up to −110 mV to study hyperpolarization-activated currents (Ih).
In order to directly compare the firing properties and low voltage activated (LVA) calcium channel function, the neurons were first examined and identified in current clamp experiments carried out using the KMeSO4 intracellular solution. Following the identification of the firing properties, the patch pipette was withdrawn and cells were re-patched using the CsMeSO4 intracellular solution. Initial re-patching was done while the slice was still being perfused with the regular ACSF. Subsequently, we switched to the modified ACSF containing Ba2+. These procedures ensured the blockade of voltage dependent Na+ and K+ currents. In these experiments, the neuron was kept at −80 mV and presented with 2 second-long prepulses ranging from −110 to −50 mV in 10 mV increments followed by a 500 ms step to −40 mV unless otherwise indicated. Bridge balance and pipette capacitance neutralization was done prior to data acquisition.
Data Analysis
Statistical analysis was performed using SPSS.19 (Chicago, IL). Averages are represented as means ± SD and compared with t-Student tests for independent samples. Pearson product-moment correlation coefficients (ρ) were calculated to reveal correlations between different variables. The Kolmogorov–Smirnov test was used to determine the normality of distributions. A repeated measures analysis of variance (RM-ANOVA) was performed for comparing the transient potassium current amplitudes at different command voltages. Additional analysis involving paired t-tests were carried out to compare within-neuron effects. The half-maximal activation of currents was studied by applying a sigmoidal fit to the current-voltage (I-V) curves where current responses were normalized to the maximum recorded current.
See Table 1 for a detailed explanation for some of the physiological parameters being measured.
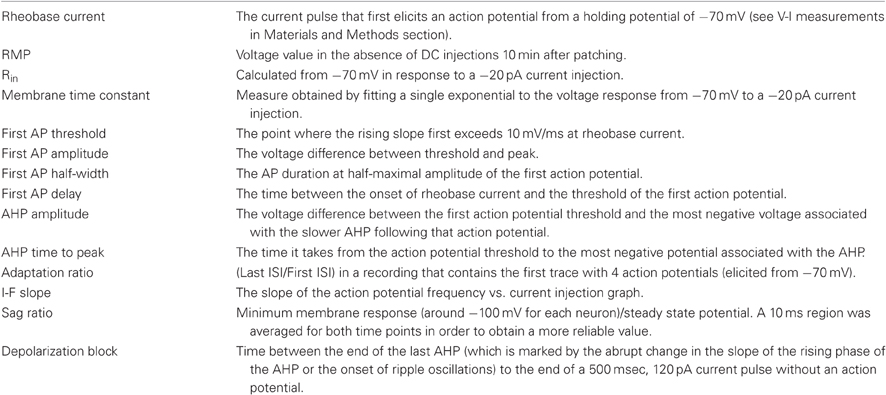
Table 1. Physiological properties examined in this study and their operational definitions.
Chemicals
All ingredients in the ACSF and perfusion solution except CaCl2 (Sigma) were purchased from Fisher Scientific. Ih measurements were done with regular ACSF. Outward currents were measured in the presence of 1 μM tetrodotoxin (TTX) (Tocris) and 350 μM CdCl2 (Sigma) to block contamination of responses by voltage gated sodium and calcium channels, respectively. As alluded to above, Ba2+ currents were measured using a CsMeSO4 intracellular solution in modified ACSF containing 40 mM tetraethyl ammonium (TEA). In a subset of experiments, 100 nM Apamin (Sigma) and 5 μM NiCl2 (Sigma) were used.
Morphology
In some recordings, 0.2% biocytin was included in the pipette for subsequent visualization. Following recordings with biocytin in the pipette, slices were transferred to 4% paraformaldehyde for at least 24 h for fixation. For biocytin imaging, slices were incubated in Cy3-conjugated streptavidin or Texas Red conjugated streptavidin (Invitrogen, Carlsbad, CA) for 20–24 h (1:200, Jackson ImmunoResearch Laboratories, West Grove PA). Slices were then transferred to a slide and mounted with Vectashield wet mounting medium (Vector Labs Inc., Burlingame, CA). For the acquisition of digital images Adobe Photoshop was used with an AxioCam camera attached to a Zeiss microscope.
For ChAT immunocytochemistry, animals (n = 3) were perfused with saline followed by 4% paraformaldehyde. The brain was removed and placed into the same solution for overnight fixation. The next day, the brains were placed into sucrose solution (30%). Three days later, 50 μm thick BF sections were cut using a freezing microtome. Sections were placed into 0.1 M phosphate buffer (PB) for ∼24 h. Every third section was taken for immunocytochemistry in order to obtain a series at 150 μ intervals. Sections were washed 3X in 0.1 M PB and incubated with Goat-anti-ChAT (1:500; Millipore, Temecula, CA) antibody with 1% normal donkey serum and 0.5% Triton-X in 0.1 M PB for overnight incubation at room temperature under dark. The next day, sections were washed 3X in 0.1 M PB and transferred into Donkey-anti-Goat Cy3 IgG (1:100) with 1% normal donkey serum and 0.5% Triton-X in 0.1 M PB for ∼3 h at incubation at room temperature under dark. Following incubation, sections were washed 3X in 0.1 M PB and mounted using Vectashield wet mounting medium.
The GFP+ and ChAT immunopositive somata in BF areas were mapped using the Neurolucida® software (Micro-BrightField, Inc, Williston, VT) from six sections separated 150 μ apart. The analyzed sections were obtained from a single animal (1 out of 3) where fiber systems demarcating BF regions were fully preserved.
Results
Co-Localization of GFP Signal and Chat Immunocytochemistry in BF
In the sections processed for ChAT immunocytochemistry we counted a total of 739 GFP+ neurons, 640 (86%) of which were also immunopositive for the ChAT antibody (Figure 1). We did not observe any ChAT-immunopositive neurons that were negative for GFP. Given the substantial overlap in this prerequisite anatomical analysis, the recorded cells will be referred to as cholinergic cells.
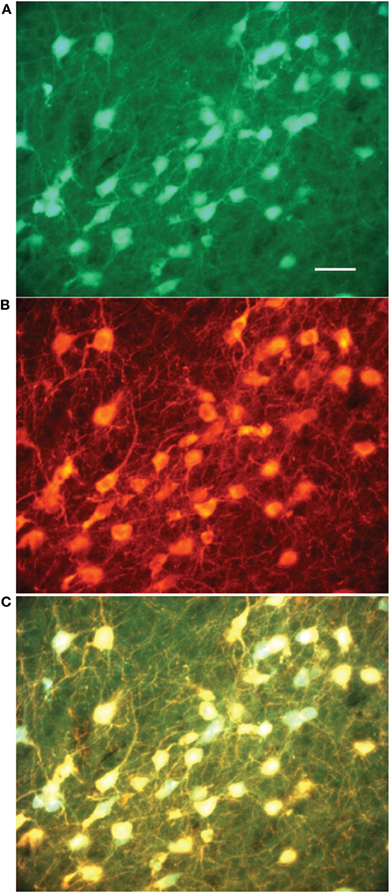
Figure 1. Colocalization of GFP expression and ChAT immunocytochemistry in the substantia innominata. (A) GFP expression, (B) ChAT immunostaining, (C) Overlay of (A) and (B) shows that all GFP expressing cells are stained with an antibody against ChAT. Bar scale: 50 μ.
Distribution of Recorded Neurons
We recorded GFP+ cholinergic neurons from the entire extent of the cholinergic BF as exemplified in (Figure 2). Nineteen neurons were located in the horizontal limb of the diagonal band (HDB). The rest of the neurons were localized in different areas including the lateral hypothalamus (n = 1), ventral pallidum (VP, n = 1), medial septum (n = 1), vertical diagonal band (VDB, n = 1), lateral preoptic area (LPO) (n = 2), substantia innominata (SI, n = 3), and anterior amygdaloid area (n = 1); areas containing the bulk of cholinergic corticopetal neurons. One neuron was localized in the bed nucleus of the stria terminalis (BNST) and two neurons were found in the interstitial nucleus of the anterior commissure, posterior component (IPAC). These latter three neurons shared similar physiological properties with neurons in the aforementioned BF regions. A subset of neurons was found at the border of BNST/VP/LPO (n = 1), hDB/VP border (n = 1), VDB/hDB border (n = 1) hDB/SI border and IPAC/VP border (n = 1). Figure 2A shows the localization (A1–A3) and structure (A4) of the neuron recorded from the medial septum. Figure 2B shows a neuron located in the hDB (B1, B2) and its morphology (B3). Finally, Figure 2C shows the localization (C1–C3) and structure (C4) of a neuron in the medial forebrain bundle (mfb).
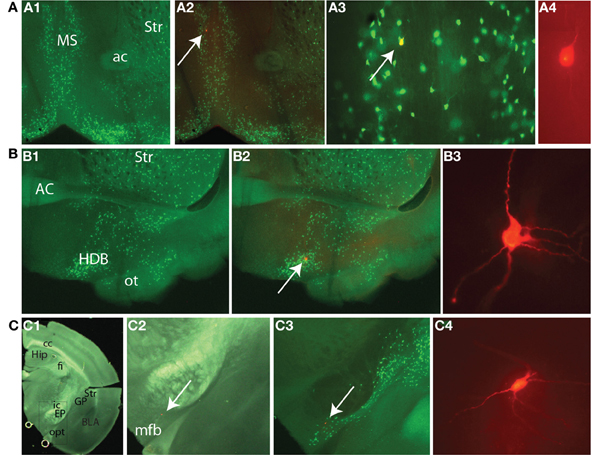
Figure 2. Recordings were obtained from diverse BF subregions. (A) Neuron recorded from the medial septum. (A1) Distribution of GFP+ cells taken at 4× magnification. (A2) Overlay of GFP and Texas Red signal. (A3) Image taken at 20× where GFP and Texas Red signals are overlaid. Arrows here and in (A2) point to the recorded neuron that was filled with biocytin. (A4) Image of the cell taken at 40×. (B) Neurons recorded from horizontal limb of diagonal band (HDB). (B1) Distribution of GFP+ cells at 4×. (B2) Overlay of GFP and Texas Red signals. Arrow points to the recorded neuron. (B3) 40X image of the same cell. (C) Neurons recorded in the vicinity of medial forebrain bundle (mfb) in the most caudal extent of BF. (C1) 1.25× image. (C2) Texas Red signal under dark field illumination taken at 4×. The field corresponds to the box in C1. (C3) Texas red image is overlaid with the intrinsic GFP signal. Arrows here and in C2 point to the recorded neuron, (C4) Recorded cell at 40×. Abbreviations: BLA, basolateral amygdala; cc, corpus callosum; EP, entopeduncular nucleus; fi, fimbria hippocampus; GP, globus pallidus; Hip, hippocampus; ic, internal capsule; opt, optic tract; Str, striatum.
General Physiological Properties of Cholinergic BF Neurons
Cells included (n = 103) in the initial analysis satisfied the following criteria: stable access resistance of less than 20 MΩ, less than 10% change in access resistance throughout recording, and were eGFP+ as visualized online (see Figure 3A). We characterized BF neurons according to several physiological attributes (definitions for each in Table 1). Because no physiological parameter exhibited a significant alteration due to filling with biocytin (not shown) we pooled all the data together. An additional number of neurons (n = 24) were recorded in further experiments (see below). In agreement with previous findings (e.g., Griffith and Matthews, 1986), most cholinergic cells exhibited a time independent anomalous rectification and a prominent after-hyperpolarization (AHP) (Figure 3B), outward rectification (Figure 3C), and wide spikes (Figure 3D, compare solid vs. dashed lines). In addition, many BF neurons exhibited a voltage hump (Figure 3C, arrow) after the onset of a depolarizing pulse. Because this is observed only if the cell is hyperpolarized (−80 mV in this case) it suggests the activation of a transient K current.
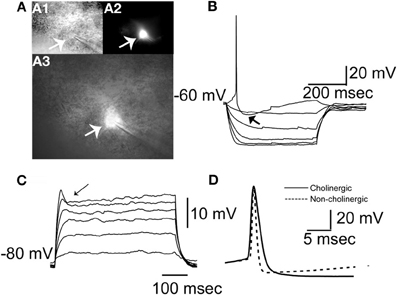
Figure 3. Morphological and physiological identification of GFP expressing neurons in the BF. (A) Morphology of a typical GFP+ neuron. (A1) Image of the neuron taken with DIC. (A2) Same neuron imaged with epifluorescence illumination showing GFP fluorescence. (A3) Overlay of images in A1 and A2. Arrows in A1, A2, and A3 indicate the cell being patched. (B) A cholinergic neuron at rest responding to negative and positive square pulses ranging between −100 and 20 pA in 20 pA increments. Zero pA step not shown. Note the prominent AHP following the single spike (indicated with arrow), and anomalous inward rectification at negative voltages. (C) The same neuron recorded in the presence of 1 μM TTX from a membrane potential of −80 mV in response to positive square current pulses from 20 to 120 pA in 20 pA increments. Note the voltage hump (indicated by arrow) and the outward rectification in the positive direction. (D) A representative cholinergic neuron spike (thick continuous line) and a spike from a non-cholinergic neuron (dashed line). Note the wide spike of the cholinergic neuron.
We found that two groups of BF neurons could clearly be distinguished based on large and significant differences in firing delay at rheobase current injections: LF neurons (LF, Figure 4A, blue trace) and EF neurons (EF, Figure 4A, red trace). LF neurons had a mean firing latency of 343 ± 76 ms (n = 33, range: 240–499 ms, ∼32% of total sample) whereas EF neurons had a mean firing latency of 107 ± 53 ms (n = 70, range: 18–206 ms, ∼68% of total sample) (Table 2). The AP delay distributions are shown in Figure 4B in the form of cumulative probability plots. Each of the distributions was normally distributed within itself (Kolmogorov–Smirnov, LF: p = 0.200, n = 32; EF: p = 0.183, n = 69) while the entire data set differed significantly from a normal distribution [Kolmogorov–Smirnov, (102) 0.155 p = 0.00].
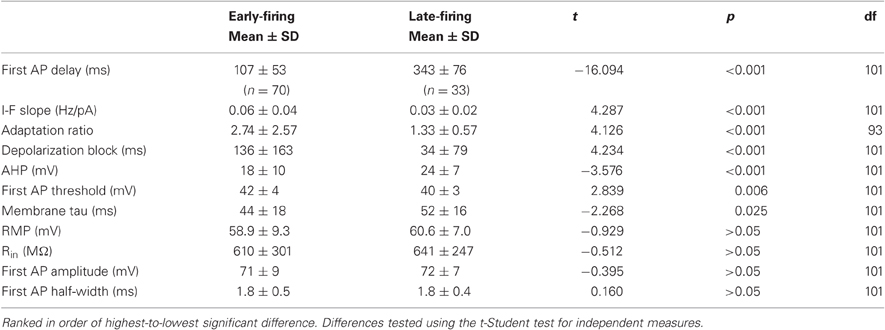
Table 2. Early- (EF) and Late-firing (LF) cell's physiological properties.
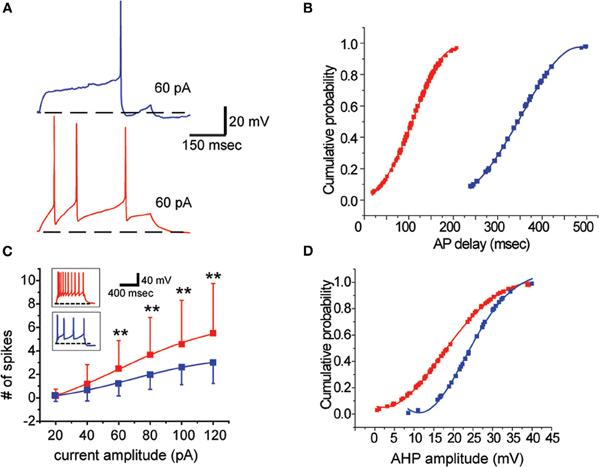
Figure 4. Cholinergic BF neurons can be distinguished based on their firing properties. (A) A late firing (LF) neuron (blue trace, Top) and an early firing (EF) neuron (red trace, Bottom). The traces were obtained in response to a rheobase current injection (+60 pA in both cases). The scale bar applies to both. Dashed line corresponds to −70 mV. (B) Cumulative probability plot depicting the distribution of action potential latencies at rheobase. LF (blue) and EF neurons (red) fall into clearly distinguishable groups. (C) Scatter plot illustrating the current-frequency (I-F) curve of LF (blue) and EF neurons (red). Insets are representative examples of firing behavior in response to 120 pA current injections from −70 mV. Dashed lines correspond to −70 mV and the scale bar applies to both insets. (D) AHP amplitude distributions for LF (blue) and EF neurons (red). Despite some overlap, LF neurons had higher amplitude AHPs.
These neurons could be differentiated further by several attributes of their activity (statistical comparisons are all listed in Table 2): the linear slope of the current-frequency relationship of EF cells is steeper than LF cells (Table 2). This is also reflected by significantly higher firing rates elicited with current injections with 60 pA or higher from −70 mV [ANOVA, F(5, 96) = 2.762, p < 0.05, Figure 4C). Moreover, EF neurons had lower AHP amplitudes (Table 2, Figure 4D).
EF and LF neurons also differ in their spike frequency adaptation properties with EF cells showing significantly more pronounced spike frequency adaptation (Table 2; Figure 5). The solid traces in Figures 5A1 and B1 illustrate the difference in spike frequency adaptation among LF and EF cells when stimulated with a strong depolarizing current pulse, while the dashed traces illustrate the basic action potential onset that characterizes the two cell types at rheobase. In line with the differences in spike frequency adaptation in these neurons, LF neurons could maintain a precise firing pattern when constant current was applied (Figure 5A2), while most EF neurons fired irregularly under similar conditions or became completely silent (4 out of 21) following a train of spikes (Figure 5B2), a phenomenon referred to as depolarization block. Such EF neurons could, however, fire regularly when hyperpolarizing pulses at a fixed frequency were superimposed on a constant depolarizing current possibly through the de-inactivation of voltage-gated sodium currents (Figure 5B2). When measured with a 500 ms, 120 pA square pulse from −70 mV (see Table 1), varying degrees of depolarization block were apparent in many of the EF neurons within 500 ms, accompanied by significant statistical differences between the two populations along this dimension (Table 2). While EF neurons show a predominance and stronger level of spike frequency adaptation compared to LF neurons, LF neurons predominantly displayed a feature that is known as spike frequency acceleration characterized by an increase in frequency towards regular steady state firing after an initial gap (operational definition in Tables 1, 2 and Figure 5C1).
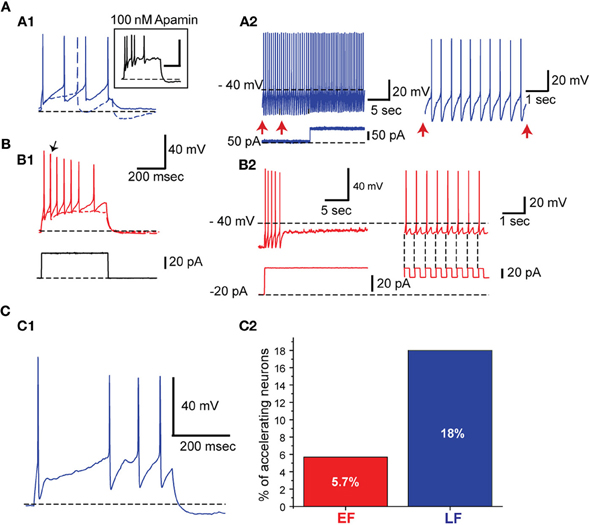
Figure 5. EF neurons show higher spike frequency adaptation than LF neurons. (A) LF neurons. (A1) An LF neuron showing almost no spike frequency adaptation. Apamin application increased the spike frequency adaptation (Inset). The dashed trace indicates response to a rheobase current injection. (A2) The same neuron fires regularly when prolonged background pulse is given. On the right is an expansion of the time indicated with vertical arrows. (B) EF neurons. (B1 and B2) The same arrangement as in A1 and A2. In B1 the arrow points out to the first action potential elicited with a rheobase current injection. The EF neuron fires transiently in response to a sudden positive shift in the injected current. This is followed by irregular low frequency firing and complete silencing. When hyperpolarizing current pulses are superimposed (B2, right side) on the positive background current, the neuron can sustain firing due to post inhibitory rebounds (see the vertical dashed lines at the ends of negative current pulses shown below). (C) Spike frequency acceleration. (C1) Example of an LF neuron exhibiting spike frequency acceleration. (C2) Percentage of neurons with spike frequency acceleration.
Six out of 70 EF neurons expressed a voltage sag, with a sag ratio higher than 1.05, suggestive of an h-current, whereas only 1 LF neuron expressed a voltage sag of this magnitude. Therefore, we did not pursue the h-current as an indicator of the EF vs LF distinction. The largest sag ratio observed was 1.12 and in those cells we could also measure an h-current in voltage clamp (not shown).
Possible Mechanisms Underlying the Differences in Cholinergic Neurons
In order to determine the possible mechanisms underlying the differences between EF and LF neurons we first compared the membrane time constant. EF neurons displayed significantly shorter time constants than LF neurons (Table 2). However, the difference is much smaller than the observed firing delay differences. On the other hand, action potential threshold for EF neurons is slightly, but statistically significantly, lower than for LF neurons (Table 2), which can also only partially explain the shorter delays. Hence, we measured the transient K+ current expressed in these neurons, an A-type current, IA. Figure 6A1 shows the protocol and raw currents used to determine IA-like currents and the net IA-like current obtained after subtraction of non-inactivating currents from those obtained from a low, de-inactivating, voltage (−90 mV, Figure 6A2). Both cell types expressed IA to varying degrees, with LF neurons exhibiting slightly higher current densities than EF neurons, but this did not reach significance [ANOVA, F(7, 24) = 0.426, p = 0.43]. At a voltage of −40 mV, the voltage closest to the spike threshold in these neurons, current densities were 8.9 ± 3.6 pA/pF for LF neurons and 8.3 ± 5.1 pA/pF for EF, which did not reach significance [t(31) = −0.3452, p = 0.73, Figure 6B1]. IA decay time constants measured at −40 mV were 133.9 ± 116 ms for EF and 137.1 ± 65 ms for LF neurons, which was also not significantly different between these two populations [t(31) = 0.0796, p = 0.93, Figure 6B2]. Finally, we determined the half-maximal activation voltages for IA by fitting a sigmoidal function to the conductance vs. voltage relationships of the two cell types. Here again we found no statistically significant difference [−31 ± 7 mV for EF and −28 ± 5 mV for LF neurons; t(31) = −1.109, p = 0.85]. Although no differences between mean values of any of these parameters of IA were found, the delay in action potential firing in individual LF neurons appears to relate to decay time of the IA they express. We observed a clear linear relationship between IA decay time constant (measured as single exponential fits to the decaying portion of IA measured at −40 mV) and action potential firing delays in LF neurons [after subtracting the membrane time constant to remove its small contribution, see Table 2, Figure 6C1, r(9) = 0.77, p = 0.007] but no such relationship for EF neurons was found [Figure 6C2, r(21) = 0.34, p = 0.090]. The general picture emerging from these correlations did not change when the absolute spike delay was considered instead of membrane time constant-subtracted spike delay (not shown). Figure 6D illustrates two LF neurons with different current densities and kinetics and the spiking delay differences in the expected direction.
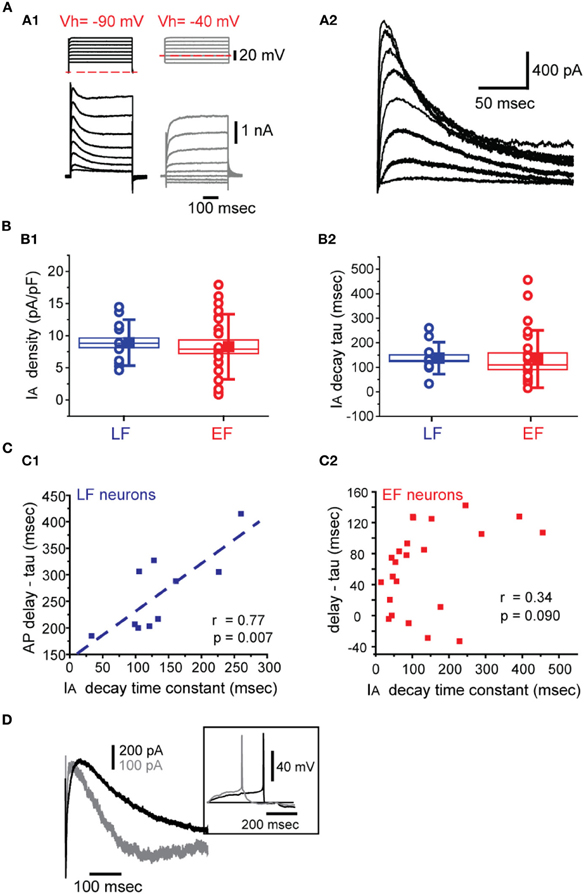
Figure 6. IA properties in BF neurons. (A) Voltage dependence. (A1) Voltage clamp protocols (top left) used to isolate IA. Currents were measured in the presence of 1 μM TTX and 350 μM CdCl2. Examples of current responses to these two protocols are shown below. The currents shown on the right (Vhold = −40 mV, dashed red line, steps: −60 to + 10 mV) were subtracted from the currents shown on the left (Vhold = −90 mV, dashed red line). (A2) The net IA obtained after the subtraction described in A1. (B) IA density (B1) and IA decay at −40 mV (B2). LF and EF neurons shown in blue and red, respectively. The box sizes indicate the standard error of the mean while whiskers indicate standard deviation. Circles indicate individual data points while the filled square shows the group means. (C) Spike onset correlations with IA decay time constants and membrane tau-corrected spike delays in LF (C1) and EF (C2) neurons. (D) Representative IA recordings from two LF neurons along with their current clamp recording of spiking activity (inset). The cell indicated by a darker trace has a slower inactivating IA along with a more pronounced spike delay.
Given the absence of significant differences in IA but a significant relationship between IA decay time constant with spike delay only in LF neurons, we tested the possibility of calcium currents contributing to the earlier spiking in these neurons in separate experiments. For these purposes, we compared LVA mediated Ba2+ currents (ILVA) in EF and LF neurons (see Materials and Methods for details, Figure 7A1) with the prediction that ILVA would be stronger in EF neurons. In line with this hypothesis, ILVA density was significantly higher in EF neurons when tested with pulses from −70 mV to −40 mV [6.4 ± 3.8 pA/pF for EF and 2.3 ± 2.4 pA/pF for LF neurons; t(13) = 2.467, p = 0.03, Figure 7A2]. In order to confirm that these effects are due to the involvement of ILVA we also measured the inward current at −40 mV obtained with different prepulse voltages (Figure 7B1) and confirmed a statistically significant difference in ILVA between EF and LF neurons for all prepulse potential values except −50 mV [ANOVA, F(6, 8) = 2.110, p < 0.05; Figure 7B2]. No statistically significant difference was observed for either the half-maximal activation [−71 ± 12 mV for LF, −63 ± 10 mV for EF; t(13) = −1.327, p = 0.207] and decay time constant [16.7 ± 10.0 ms for LF, 20.9 ± 10.0 ms for EF; t(13) = 0.247, p = 0.808] between the two populations. HVA mediated currents were measured with ramp protocols (Murchison et al., 2009) and yielded no significant differences in EF and LF neurons (data not shown). To confirm these results independently in pharmacological experiments (n = 4 for each group), we investigated potential spike onset changes under control conditions and in the presence of 5 μM Ni2+, a concentration that is close to IC50 values for the blockade of Ca(v) 3.2 channels (Kang et al., 2006), which is the dominant channel isoform in cholinergic BF neurons (Han et al., 2005). In EF neurons, Ni2+ significantly delayed the spike onset [72.8 ± 12.1 ms without Ni2+ and 139.3 ± 31.8 with Ni2+; t(3) = 3.6584, p < 0.0001, paired t-test] suggesting an important contribution of ILVA to AP delay. Contrary to this, Ni2+ application did not produce a change in action potential delay in LF neurons [315.5 ± 89.3 ms without Ni2+ and 315.0 ± 81.9 with Ni2+; t(3) = 0.092, p = 0.932, paired t-test; Figure 7C1]. A representative effect of Ni2+ application on AP delay in EF neurons is shown in Figure 7C2.
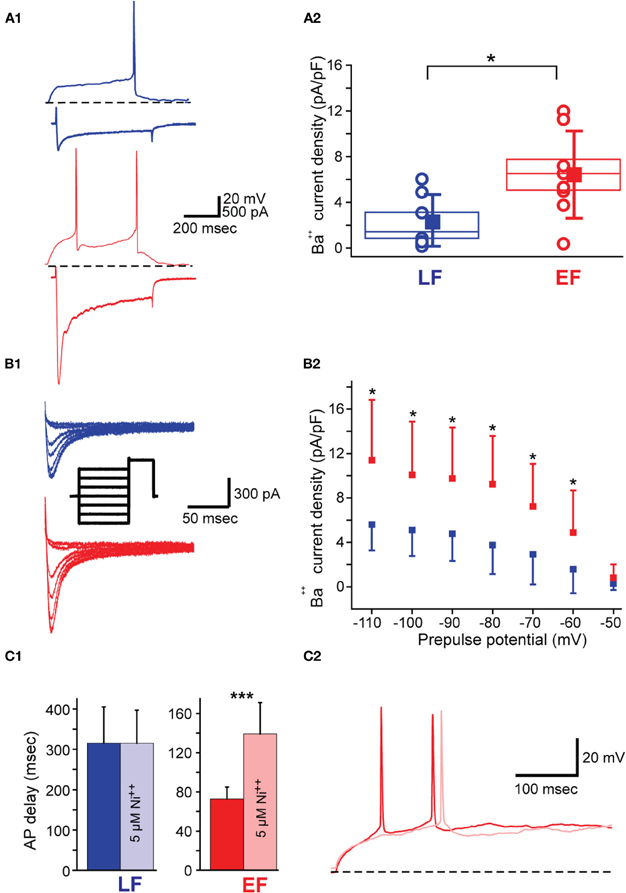
Figure 7. Low voltage activated calcium current (ILVA) properties in BF neurons. (A1) LF neuron (top blue traces) and EF neuron (bottom red traces) in current clamp (top trace in each case) showing the characteristic AP delay in response to a rheobase current injection (60 pA in this case). Bottom trace in each case shows ILVA in response to a voltage clamp step from −70 mV to −40 mV upon re-patching the same cells with Cs-Meth intracellular solution and in Ba2+-containing ACSF (see Materials and Methods). Scale bars apply to both neurons. (A2) Box plot for ILVA densities measured as described in A1. Box size indicates standard error of the mean. Square and whiskers have been displaced for clarity and indicate mean and standard deviation, respectively. Empty circles indicate individual data points (n = 7 LF; n = 8 EF). (B1) ILVA measured at −40mV with a de-inactivation protocol (see inset) for an LF (blue) and EF (red) neuron. Inset shows the protocol used to elicit the currents (2000 ms long prepulses from −100 to −50 mV, and 500 ms long test voltage at −40 mV all from a holding voltage of −80 mV). Scale bars apply to the current traces. (B2) I-V curve for the protocol in B1. (C1) Bar graph illustrating the selective effect of 5 μM nickel on firing delay in EF but not in LF neurons (n = 4 for each group). (C2) demonstrates the effect of Ni++ application (light red trace) on firing delay in an EF neuron.
Spike frequency adaptation in LF neurons was increased when their AHP amplitude was reduced following application of 100 nM apamin, a selective SK channel inhibitor (n = 3; Figure 5A1 inset) suggesting the participation of SK channels in determining the firing adaptation properties of LF neurons.
Finally, we analyzed whether the physiological differences observed had an anatomical correlate in morphologically well preserved sections with biocytin filled neurons. Due to the small number of samples from each area, we made hDB vs. non-hDB comparisons and none of the physiological parameters tested revealed any differences (data not shown) suggesting that cholinergic neurons with putatively different functions are intermixed across different BF regions. No BF area recorded contained bursting cholinergic neurons (see Discussion).
Discussion
Given the significance of the BF cholinergic system in diverse cognitive and physiological functions, characterizing the physiological properties of its constituent neurons is essential for a proper understanding of the mechanisms whereby these neurons exert their effects on cortical processing. Using adult transgenic mice expressing eGFP in cholinergic neurons, sampling from the entire BF and applying systematic physiological criteria, we have obtained evidence for the existence of two electrophysiologically distinct cholinergic cell populations in the mature BF, characterized by more than three-fold difference in spike onset latencies and two-fold difference in spike frequency adaptation rates; with EF cells exhibiting a more excitable and adapting profile. As evidenced by voltage-clamp analysis, the EF neurons exhibited higher expression of LVA calcium currents compared to the LF neurons. The variability of action potential delay in each group seems to be related to different mechanisms: IA-like potassium currents, which have been shown to have important roles in determining spike onset latency in diverse systems (Tierney and Harris-Warrick, 1992; Gerber and Jakobsson, 1993; Tell and Bradley, 1994; Magarinos-Ascone et al., 1999; MacLean et al., 2005), seem to be related to spike delay only in LF neurons. On the other hand, the contribution of IA is masked by LVA calcium current effects in EF neurons.
Previous results on cholinergic cell physiology in different BF subregions [e.g., (Momiyama and Zaborszky, 2006; Hedrick and Waters, 2010)] converge with our observations on some basic principles. In short, cholinergic BF neurons fire at lower frequencies compared to non-cholinergic BF neurons and therefore, they are usually referred to as slow firing BF neurons (Griffith and Matthews, 1986). Moreover, their action potentials are wider and commonly followed by prominent SK channel mediated medium afterhyperpolarizations (mAHPs) (Williams et al., 1997). In addition, anomalous rectification and outward rectification are among the other defining properties of cholinergic BF neurons (Bengtson and Osborne, 2000). However, we were unable to observe burst firing in any of the BF cholinergic neurons in our study compared with reports of bursting in cholinergic neurons of the substantia innominata (Khateb et al., 1992, 1995; Alonso et al., 1996). These discrepancies may arise from differences in the protocols used to record from these cells. Studies reporting bursting behavior were carried out with ACSF containing higher Ca2+ concentration than our study (2.5 mM vs. 2 mM). In our conditions, calcium entry might not have been sufficient to counteract outward currents and generate bursting, a notion suggested before (Gorelova and Reiner, 1996; Sim and Allen, 1998). Finally, in some experiments we observed GFP negative neurons firing spike doublets similar to those reported as bursts in cholinergic neurons [e.g., (Khateb et al., 1992)]. Thus, bursting does not seem to be a universal property of cholinergic neurons in any BF region and cannot be used as an electrophysiological criterion to identify cholinergic neurons in vitro. However, these results do not negate the possibility of burst firing of cholinergic neurons in vivo [e.g., (Nunez, 1996; Manns et al., 2000)] and in vitro under specific experimental conditions or species differences (guinea pig vs. rat/mouse) (Khateb et al., 1997, 1998). For instance, EF neurons, with their strong calcium currents (see below) may correspond to burst firing cholinergic neurons recorded in vivo in the full presence of ascending neuromodulatory influences.
In summary, using direct comparison of current and voltage clamp data in the same cells and sampling from the entire BF, our study suggests the existence of two distinct types of cholinergic neurons. Ectopic expression of GFP might be a potential source of error in studies using transgenic animals. Likewise, we observed a slightly higher number of GFP+ neurons than the number of ChAT-immunoreactive (86% of the neurons were both GFP and immunopositive). However, immunocytochemistry likely has lower sensitivity than GFP expression, which could explain some of these differences. Further, the expression of general electrophysiological characteristics of cholinergic neurons in both EF and LF populations, mitigate against a significant contamination of our analysis by the small percentage of non-cholinergic neurons expressing GFP in a non-specific manner.
Mechanisms Underlying the Differences Between EF and LF Neurons
Transient Potassium Currents
Transient potassium currents activate when neurons are depolarized from hyperpolarized potentials (Coetzee et al., 1999; Birnbaum et al., 2004) and have been shown to delay firing and regulate firing frequency (Storm, 1988; Tierney and Harris-Warrick, 1992; Gerber and Jakobsson, 1993; Tell and Bradley, 1994; Del Negro and Chandler, 1997; Kanold and Manis, 1999; Magarinos-Ascone et al., 1999; MacLean et al., 2005). Previous studies have reported the existence of transient potassium currents in cholinergic neurons in BF cultures but without reference to firing delay and other functional properties (Sim and Allen, 1998; Tkatch et al., 2000) while Eggermann et al. (2001) reported the presence of this current in voltage recordings and defines it as a set criterion for cholinergic BF neurons. The decay time constants of the current we identified resemble the slowly inactivating IA current which is also referred to as the ID current. However, in dissociated culture, IA currents identified in cholinergic neurons had faster inactivation kinetics (Sim and Allen, 1998; Tkatch et al., 2000). A recent study (Garrido-Sanabria et al., 2011) in slices also reported fast inactivating IA currents in slow firing putative cholinergic neurons in BF slices. The differences in the decay kinetics of this current might reflect differences in preparation and/or the age of animals used. Indeed, various potassium channels have been shown to be developmentally regulated in different cell types like cortical parvalbumin neurons (Okaty et al., 2009). Whether such alterations also occur in BF cholinergic neurons and their functional implications remain to be tested. Finally, the preponderance of cholinergic neurons with spike frequency acceleration along with the long decay time constant of the measured currents is suggestive for the presence of a Kv1 mediated ID current (Miller et al., 2008).
To our surprise, EF and LF neurons did not differ with respect to the average transient potassium current density or decay time constant. Interestingly, we observed a decay time constant to spike onset latency correlation, which can help to explain the spike delay variability of LF neurons, but clearly not that of EF neurons. This led us to consider other possibilities. While the shorter membrane time constant of EF neurons could explain the differences in spike latency to some extent, it is likely not an important factor since the transient potassium current decay time constant's relationship to spike onset latency in both groups remained unchanged after the membrane time constant was subtracted from the spike onset delay. Also, the slight but significant differences in spike thresholds between EF and LF neurons constitute another source for spike onset delay. These differences, although potentially important, are however, unlikely to explain differences measured in the order of tens of milliseconds.
Low Voltage Activated Calcium Currents
Voltage-gated ion channels are expressed in different neurons in different proportions, and the interplay between them has been shown to be critical in determining a neuron's behavior. Indeed, compensatory actions of different ion channels have been demonstrated in other systems (Linsdell and Moody, 1994; Pape et al., 1994; Del Negro et al., 2002; MacLean et al., 2003, 2005; Molineux et al., 2005; Hudson and Prinz, 2010). Given these possibilities, we predicted the presence of an inward current in EF neurons that counteract transient potassium currents. Due to their reliable expression profile in these neurons the most plausible candidate in cholinergic BF neurons is the Ca2+ channels that mediate LVA currents (Allen et al., 1993). Indeed, it has been reported that different cholinergic neurons can be distinguished based on their LVA current density (Han et al., 2005). Moreover, interplay between transient potassium currents and LVA currents has been demonstrated to play an important role in determining spike latency in cerebellar stellate neurons (Molineux et al., 2005). Consistent with our predictions, EF neurons exhibited higher LVA current densities than LF neurons and blockade of channels mediating LVA currents in cholinergic neurons with nickel delayed spike onset latency in these neurons. Thus, it appears that the differences in firing delay between EF and LF neurons are probably due to interplay between membrane currents with different polarities. These findings might also explain the lower spike thresholds observed in EF neurons. Unfortunately, accurately measuring Ca2+ and K+ currents in the same neurons to determine their possible functional interactions is not possible given the combinations of blocking agents required and thus, establishing a definitive relationship between these currents remains a challenge.
Various types of voltage-gated ion channels can have different functions depending on their cellular localization (Brew and Forsythe, 1995; Hoffman et al., 1997; Magee, 1998; Migliore et al., 1999; Johnston et al., 2000; Gu et al., 2005; Burkhalter et al., 2006; Kollo et al., 2006, 2008). Our study is limited to the somatic current measurements due to problems associated with voltage clamping dendrites and therefore does not address the degree of involvements of these currents in the electrotonically distal portions of the neurons.
Mechanisms Underlying Differences in Spike Frequency Adaptation
SK channels mediated AHPs have been shown to enhance the uniformity of the inter-spike interval in cholinergic BF neurons (Gorelova and Reiner, 1996) and in other systems, such as the non-cholinergic neurons of the globus pallidus (Deister et al., 2009). Our data are in line with this suggestion where LF neurons are shown to have higher AHP amplitudes and minimal spike frequency adaptation. Thus, SK channel-mediated AHPs may be important in recruiting Na+ channels (via de-inactivation) for action potential generation and contribute to the determination of the electrophysiological properties that distinguish BF neuron cell types. The IA current is also known to facilitate Na+ channel recovery from inactivation (Hess and El Manira, 2001). Therefore, in LF neurons mAHP and IA may in concert help sustain the repetitive firing.
The calcium channel that provides the calcium source for the activation of medium duration AHPs following single spikes show neuronal type-specific differences in many systems. In BF cholinergic neurons, calcium entry through the LVA channels have been shown to determine AHP amplitude (Williams et al., 1997). Curiously, our data show a higher LVA density in EF neurons, which we have shown to exhibit smaller AHP amplitudes. It is possible that EF neurons have lower levels of SK channel expression and/or different localization of this channels compared to LF neurons where they might serve other functions [e.g. (Gu et al., 2005)].
Functional Implications
This study provides evidence for the existence of two subtypes of BF cholinergic neurons based on spike onset latency in the mature BF. EF neurons with their initial high frequency discharge followed by pronounced spike frequency adaptation could lead to a different acetylcholine release profile than that of LF neurons, which show little spike frequency adaptation when depolarized. Recent amperometric studies suggest that acetylcholine release can be tonic (measured in minutes) or phasic (measured in seconds) depending on attentional demands (Parikh et al., 2007; Parikh and Sarter, 2008; Hasselmo and Sarter, 2011), an observation that may relate to the existence of two functionally distinct cholinergic neuronal populations described in our study. Moreover, the delay to spiking, the main feature distinguishing cholinergic BF neurons, may be involved in different aspects of synaptic plasticity given the novel finding regarding the temporal requirements of cholinergic activation for different forms of hippocampal plasticity (Gu and Yakel, 2011).
Another interesting possibility relates to the complex architecture of cholinergic space in the BF. Statistical analysis of anatomical data based on nearest neighbor density determined that cholinergic neurons in rats are either found in dense clusters or diffusely located in the background (Nadasdy et al., 2010). Since the projection target of the clusters and the low density locations are different (Zaborszky et al., unpublished observations) it would be functionally important to test in future studies to what extent EF/LF neurons in mice fit into this anatomical scheme.
Further studies combining circuitry analysis, membrane physiology, and behavior will be instrumental in establishing of how this in vitro functional distinction relates to anatomical subtypes or in vivo behavior of cholinergic BF neurons.
Author Contributions
The work was done in Laszlo Zaborszky laboratory. Cagri T. Unal, Jorge P. Golowasch, and Laszlo Zaborszky conceptualized and designed the experiments. Cagri T. Unal performed all the experiments and analyzed the data. Jorge P. Golowasch and Laszlo Zaborszky assisted in the analysis of the data. Cagri T. Unal, Jorge P. Golowasch, and Laszlo Zaborszky interpreted the data and wrote the paper.
Conflict of Interest Statement
The authors declare that the research was conducted in the absence of any commercial or financial relationships that could be construed as a potential conflict of interest.
Acknowledgments
The authors would like to thank to Erzsebet Rommer and Miranda Johnson for excellent technical help. The authors are also indebted to Bengi Unal, Alon Amir, and Dr. Tibor Koos for valuable discussions during the project. This project was supported by NIH Grant No. 23945 to Laszlo Zaborszky and NIMH grant 64711 to Jorge P. Golowasch.
References
Allen, T. G., Sim, J. A., and Brown, D. A. (1993). The whole-cell calcium current in acutely dissociated magnocellular cholinergic basal forebrain neurones of the rat. J. Physiol. 460, 91–116.
Alonso, A., Khateb, A., Fort, P., Jones, B. E., and Muhlethaler, M. (1996). Differential oscillatory properties of cholinergic and noncholinergic nucleus basalis neurons in guinea pig brain slice. Eur. J. Neurosci. 8, 169–182.
Bengtson, C. P., and Osborne, P. B. (2000). Electrophysiological properties of cholinergic and noncholinergic neurons in the ventral pallidal region of the nucleus basalis in rat brain slices. J. Neurophysiol. 83, 2649–2660.
Birnbaum, S. G., Varga, A. W., Yuan, L. L., Anderson, A. E., Sweatt, J. D., and Schrader, L. A. (2004). Structure and function of Kv4-family transient potassium channels. Physiol. Rev. 84, 803–833.
Bowen, F. P. (1976). Behavioral alterations in patients with basal ganglia lesions. Res. Publ. Assoc. Res. Nerv. Ment. Dis. 55, 169–180.
Brashear, H. R., Zaborszky, L., and Heimer, L. (1986). Distribution of GABAergic and cholinergic neurons in the rat diagonal band. Neuroscience 17, 439–451.
Brew, H. M., and Forsythe, I. D. (1995). Two voltage-dependent K+ conductances with complementary functions in postsynaptic integration at a central auditory synapse. J. Neurosci. 15, 8011–8022.
Burkhalter, A., Gonchar, Y., Mellor, R. L., and Nerbonne, J. M. (2006). Differential expression of I(A) channel subunits Kv4.2 and Kv4.3 in mouse visual cortical neurons and synapses. J. Neurosci. 26, 12274–12282.
Buzsaki, G., Bickford, R. G., Ponomareff, G., Thal, L. J., Mandel, R., and Gage, F. H. (1988). Nucleus basalis and thalamic control of neocortical activity in the freely moving rat. J. Neurosci. 8, 4007–4026.
Chang, H. T., and Kuo, H. (1991). Relationship of calbindin D-28k and cholinergic neurons in the nucleus basalis of Meynert of the monkey and the rat. Brain Res. 549, 141–145.
Coetzee, W. A., Amarillo, Y., Chiu, J., Chow, A., Lau, D., McCormack, T., Moreno, H., Nadal, M. S., Ozaita, A., Pountney, D., Saganich, M., Vega-Saenz de Miera, E., and Rudy, B. (1999). Molecular diversity of K+ channels. Ann. N.Y. Acad. Sci. 868, 233–285.
Datta, S., and Maclean, R. R. (2007). Neurobiological mechanisms for the regulation of mammalian sleep-wake behavior: reinterpretation of historical evidence and inclusion of contemporary cellular and molecular evidence. Neurosci. Biobehav. Rev. 31, 775–824.
Deister, C. A., Chan, C. S., Surmeier, D. J., and Wilson, C. J. (2009). Calcium-activated SK channels influence voltage-gated ion channels to determine the precision of firing in globus pallidus neurons. J. Neurosci. 29, 8452–8461.
Del Negro, C. A., and Chandler, S. H. (1997). Physiological and theoretical analysis of K+ currents controlling discharge in neonatal rat mesencephalic trigeminal neurons. J. Neurophysiol. 77, 537–553.
Del Negro, C. A., Koshiya, N., Butera, R. J. Jr., and Smith, J. C. (2002). Persistent sodium current, membrane properties and bursting behavior of pre-botzinger complex inspiratory neurons in vitro. J. Neurophysiol. 88, 2242–2250.
Detari, L., and Vanderwolf, C. H. (1987). Activity of identified cortically projecting and other basal forebrain neurones during large slow waves and cortical activation in anaesthetized rats. Brain Res. 437, 1–8.
Duque, A., Balatoni, B., Detari, L., and Zaborszky, L. (2000). EEG correlation of the discharge properties of identified neurons in the basal forebrain. J. Neurophysiol. 84, 1627–1635.
Eggermann, E., Serafin, M., Bayer, L., Machard, D., Saint-Mleux, B., Jones, B. E., and Muhlethaler, M. (2001). Orexins/hypocretins excite basal forebrain cholinergic neurones. Neuroscience 108, 177–181.
Forloni, G., Grzanna, R., Blakely, R. D., and Coyle, J. T. (1987). Co-localization of N-acetyl-aspartyl-glutamate in central cholinergic, noradrenergic, and serotonergic neurons. Synapse 1, 455–460.
Garrido-Sanabria, E. R., Perez, M. G., Banuelos, C., Reyna, T., Hernandez, S., Castaneda, M. T., and Colom, L. V. (2007). Electrophysiological and morphological heterogeneity of slow firing neurons in medial septal/diagonal band complex as revealed by cluster analysis. Neuroscience 146, 931–945.
Garrido-Sanabria, E. R., Perez-Cordova, M. G., and Colom, L. V. (2011). Differential expression of voltage-gated K(+) currents in medial septum/diagonal band complex neurons exhibiting distinct firing phenotypes. Neurosci. Res. 70, 361–369.
Gerber, B., and Jakobsson, E. (1993). Functional significance of the A-current. Biol. Cybern. 70, 109–114.
Goard, M., and Dan, Y. (2009). Basal forebrain activation enhances cortical coding of natural scenes. Nat. Neurosci. 12, 1444–1449.
Gorelova, N., and Reiner, P. B. (1996). Role of the afterhyperpolarization in control of discharge properties of septal cholinergic neurons in vitro. J. Neurophysiol. 75, 695–706.
Griffith, W. H. (1988). Membrane properties of cell types within guinea pig basal forebrain nuclei in vitro. J. Neurophysiol. 59, 1590–1612.
Griffith, W. H., and Matthews, R. T. (1986). Electrophysiology of AChE-positive neurons in basal forebrain slices. Neurosci. Lett. 71, 169–174.
Gu, N., Vervaeke, K., Hu, H., and Storm, J. F. (2005). Kv7/KCNQ/M and HCN/h, but not KCa2/SK channels, contribute to the somatic medium after-hyperpolarization and excitability control in CA1 hippocampal pyramidal cells. J. Physiol. 566, 689–715.
Gu, Z., and Yakel, J. L. (2011). Timing-dependent septal cholinergic induction of dynamic hippocampal synaptic plasticity. Neuron 71, 155–165.
Gyengesi, E., Paxinos, G., and Zaborszky, L. (2010). “Distribution of the secretagogin containing neurons in the basal forebrain,” in Vol. 45.6, Society for Neuroscience Abstracts (San Diego, California).
Han, S. H., Murchison, D., and Griffith, W. H. (2005). Low voltage-activated calcium and fast tetrodotoxin-resistant sodium currents define subtypes of cholinergic and noncholinergic neurons in rat basal forebrain. Brain Res. Mol. Brain Res. 134, 226–238.
Harkany, T., Hartig, W., Berghuis, P., Dobszay, M. B., Zilberter, Y., Edwards, R. H., Mackie, K., and Ernfors, P. (2003). Complementary distribution of type 1 cannabinoid receptors and vesicular glutamate transporter 3 in basal forebrain suggests input-specific retrograde signalling by cholinergic neurons. Eur. J. Neurosci. 18, 1979–1992.
Hassani, O. K., Lee, M. G., Henny, P., and Jones, B. E. (2009). Discharge profiles of identified GABAergic in comparison to cholinergic and putative glutamatergic basal forebrain neurons across the sleep-wake cycle. J. Neurosci. 29, 11828–11840.
Hasselmo, M. E., and Sarter, M. (2011). Modes and models of forebrain cholinergic neuromodulation of cognition. Neuropsychopharmacology 36, 52–73.
Hedrick, T., and Waters, J. (2010). Physiological properties of cholinergic and non-cholinergic magnocellular neurons in acute slices from adult mouse nucleus basalis. PLoS One 5:e11046. doi: 10.1371/journal.pone.0011046
Henderson, Z. (1987). A small proportion of cholinergic neurones in the nucleus basalis magnocellularis of ferret appear to stain positively for tyrosine hydroxylase. Brain Res. 412, 363–369.
Hess, D., and El Manira, A. (2001). Characterization of a high-voltage-activated IA current with a role in spike timing and locomotor pattern generation. Proc. Natl. Acad. Sci. U.S.A. 98, 5276–5281.
Hoffman, D. A., Magee, J. C., Colbert, C. M., and Johnston, D. (1997). K+ channel regulation of signal propagation in dendrites of hippocampal pyramidal neurons. Nature 387, 869–875.
Hudson, A. E., and Prinz, A. A. (2010). Conductance ratios and cellular identity. PLoS Comput. Biol. 6:e1000838. doi: 10.1371/journal.pcbi.1000838
Hur, E. E., Edwards, R. H., Rommer, E., and Zaborszky, L. (2009). Vesicular glutamate transporter 1 and vesicular glutamate transporter 2 synapses on cholinergic neurons in the sublenticular gray of the rat basal forebrain: a double-label electron microscopic study. Neuroscience 164, 1721–1731.
Johnston, D., Hoffman, D. A., Magee, J. C., Poolos, N. P., Watanabe, S., Colbert, C. M., and Migliore, M. (2000). Dendritic potassium channels in hippocampal pyramidal neurons. J. Physiol. 525(Pt 1), 75–81.
Kang, H. W., Park, J. Y., Jeong, S. W., Kim, J. A., Moon, H. J., Perez-Reyes, E., and Lee, J. H. (2006). A molecular determinant of nickel inhibition in Cav3.2 T-type calcium channels. J. Biol. Chem. 281, 4823–4830.
Kanold, P. O., and Manis, P. B. (1999). Transient potassium currents regulate the discharge patterns of dorsal cochlear nucleus pyramidal cells. J. Neurosci. 19, 2195–2208.
Khateb, A., Fort, P., Serafin, M., Jones, B. E., and Muhlethaler, M. (1995). Rhythmical bursts induced by NMDA in guinea-pig cholinergic nucleus basalis neurones in vitro. J. Physiol. 487(Pt 3), 623–638.
Khateb, A., Fort, P., Williams, S., Serafin, M., Jones, B. E., and Muhlethaler, M. (1997). Modulation of cholinergic nucleus basalis neurons by acetylcholine and N-methyl-D-aspartate. Neu-roscience 81, 47–55.
Khateb, A., Fort, P., Williams, S., Serafin, M., Muhlethaler, M., and Jones, B. E. (1998). GABAergic input to cholinergic nucleus basalis neurons. Neuroscience 86, 937–947.
Khateb, A., Muhlethaler, M., Alonso, A., Serafin, M., Mainville, L., and Jones, B. E. (1992). Cholinergic nucleus basalis neurons display the capacity for rhythmic bursting activity mediated by low-threshold calcium spikes. Neuroscience 51, 489–494.
Kollo, M., Holderith, N., Antal, M., and Nusser, Z. (2008). Unique clustering of A-type potassium channels on different cell types of the main olfactory bulb. Eur. J. Neurosci. 27, 1686–1699.
Kollo, M., Holderith, N. B., and Nusser, Z. (2006). Novel subcellular distribution pattern of A-type K+ channels on neuronal surface. J. Neurosci. 26, 2684–2691.
Kosaka, T., Tauchi, M., and Dahl, J. L. (1988). Cholinergic neurons containing GABA-like and/or glutamic acid decarboxylase-like immunoreactivities in various brain regions of the rat. Exp. Brain Res. 70, 605–617.
Lee, M. G., Hassani, O. K., Alonso, A., and Jones, B. E. (2005). Cholinergic basal forebrain neurons burst with theta during waking and paradoxical sleep. J. Neurosci. 25, 4365–4369.
Linsdell, P., and Moody, W. J. (1994). Na+ channel mis-expression accelerates K+ channel development in embryonic Xenopus laevis skeletal muscle. J. Physiol. 480(Pt 3), 405–410.
MacLean, J. N., Zhang, Y., Goeritz, M. L., Casey, R., Oliva, R., Guckenheimer, J., and Harris-Warrick, R. M. (2005). Activity-independent coregulation of IA and Ih in rhythmically active neurons. J. Neurophysiol. 94, 3601–3617.
MacLean, J. N., Zhang, Y., Johnson, B. R., and Harris-Warrick, R. M. (2003). Activity-independent homeostasis in rhythmically active neurons. Neuron 37, 109–120.
Magarinos-Ascone, C., Nunez, A., and Delgado-Garcia, J. M. (1999). Different discharge properties of rat facial nucleus motoneurons. Neuroscience 94, 879–886.
Magee, J. C. (1998). Dendritic hyperpolarization-activated currents modify the integrative properties of hippocampal CA1 pyramidal neurons. J. Neurosci. 18, 7613–7624.
Manns, I. D., Alonso, A., and Jones, B. E. (2000). Discharge properties of juxtacellularly labeled and immunohistochemically identified cholinergic basal forebrain neurons recorded in association with the electroencephalogram in anesthetized rats. J. Neurosci. 20, 1505–1518.
Markram, H., and Segal, M. (1990). Electrophysiological characteristics of cholinergic and non-cholinergic neurons in the rat medial septum-diagonal band complex. Brain Res. 513, 171–174.
Melander, T., and Staines, W. A. (1986). A galanin-like peptide coexists in putative cholinergic somata of the septum-basal forebrain complex and in acetylcholinesterase-containing fibers and varicosities within the hippocampus in the owl monkey (Aotus trivirgatus). Neurosci. Lett. 68, 17–22.
Migliore, M., Hoffman, D. A., Magee, J. C., and Johnston, D. (1999). Role of an A-type K+ conductance in the back-propagation of action potentials in the dendrites of hippocampal pyramidal neurons. J. Comput. Neurosci. 7, 5–15.
Miller, M. N., Okaty, B. W., and Nelson, S. B. (2008). Region-specific spike-frequency acceleration in layer 5 pyramidal neurons mediated by Kv1 subunits. J. Neurosci. 28, 13716–13726.
Molineux, M. L., Fernandez, F. R., Mehaffey, W. H., and Turner, R. W. (2005). A-type and T-type currents interact to produce a novel spike latency-voltage relationship in cerebellar stellate cells. J. Neurosci. 25, 10863–10873.
Momiyama, T., and Zaborszky, L. (2006). Somatostatin presynaptically inhibits both GABA and glutamate release onto rat basal forebrain cholinergic neurons. J. Neurophysiol. 96, 686–694.
Murchison, D., McDermott, A. N., Lasarge, C. L., Peebles, K. A., Bizon, J. L., and Griffith, W. H. (2009). Enhanced calcium buffering in F344 rat cholinergic basal forebrain neurons is associated with age-related cognitive impairment. J. Neurophysiol. 102, 2194–2207.
Nadasdy, Z., Varsanyi, P., and Zaborszky, L. (2010). Clustering of large cell populations: method and application to the basal forebrain cholinergic system. J. Neurosci. Methods 194, 46–55.
Nunez, A. (1996). Unit activity of rat basal forebrain neurons: relationship to cortical activity. Neuroscience 72, 757–766.
Okaty, B. W., Miller, M. N., Sugino, K., Hempel, C. M., and Nelson, S. B. (2009). Transcriptional and electrophysiological maturation of neocortical fast-spiking GABAergic interneurons. J. Neurosci. 29, 7040–7052.
Pape, H. C., Budde, T., Mager, R., and Kisvarday, Z. F. (1994). Prevention of Ca(2+)-mediated action potentials in GABAergic local circuit neurones of rat thalamus by a transient K+ current. J. Physiol. 478(Pt 3), 403–422.
Parikh, V., Kozak, R., Martinez, V., and Sarter, M. (2007). Prefrontal acetylcholine release controls cue detection on multiple timescales. Neuron 56, 141–154.
Parikh, V., and Sarter, M. (2008). Cholinergic mediation of attention: contributions of phasic and tonic increases in prefrontal cholinergic activity. Ann. N.Y. Acad. Sci. 1129, 225–235.
Perry, E. K., Tomlinson, B. E., Blessed, G., Bergmann, K., Gibson, P. H., and Perry, R. H. (1978). Correlation of cholinergic abnormalities with senile plaques and mental test scores in senile dementia. Br. Med. J. 2, 1457–1459.
Saper, C. B., Cano, G., and Scammell, T. E. (2005). Homeostatic, circadian, and emotional regulation of sleep. J. Comp. Neurol. 493, 92–98.
Sim, J. A., and Allen, T. G. (1998). Morphological and membrane properties of rat magnocellular basal forebrain neurons maintained in culture. J. Neurophysiol. 80, 1653–1669.
Steriade, M., and McCarley, R. W. (2005). Brainstem Control of Wakefulness and Sleep. New York, NY: Springer.
Storm, J. F. (1988). Temporal integration by a slowly inactivating K+ current in hippocampal neurons. Nature 336, 379–381.
Tell, F., and Bradley, R. M. (1994). Whole-cell analysis of ionic currents underlying the firing pattern of neurons in the gustatory zone of the nucleus tractus solitarii. J. Neurophysiol. 71, 479–492.
Tierney, A. J., and Harris-Warrick, R. M. (1992). Physiological role of the transient potassium current in the pyloric circuit of the lobster stomatogastric ganglion. J. Neurophysiol. 67, 599–609.
Tkatch, T., Baranauskas, G., and Surmeier, D. J. (2000). Kv4.2 mRNA abundance and A-type K(+) current amplitude are linearly related in basal ganglia and basal forebrain neurons. J. Neurosci. 20, 579–588.
Wenk, G. L., and Mobley, S. L. (1996). Choline acetyltransferase activity and vesamicol binding in Rett syndrome and in rats with nucleus basalis lesions. Neuroscience 73, 79–84.
Williams, S., Serafin, M., Muhlethaler, M., and Bernheim, L. (1997). Distinct contributions of high- and low-voltage-activated calcium currents to afterhyperpolarizations in cholinergic nucleus basalis neurons of the guinea pig. J. Neurosci. 17, 7307–7315.
Wu, M., Shanabrough, M., Leranth, C., and Alreja, M. (2000). Cholinergic excitation of septohippocampal GABA but not cholinergic neurons: implications for learning and memory. J. Neurosci. 20, 3900–3908.
Zaborszky, L., and Duque, A. (2003). Sleep-wake mechanisms and basal forebrain circuitry. Front. Biosci. 8, d1146–d1169.
Keywords: spike frequency adaptation, tonic firing, phasic firing, calcium currents, neuromodulation
Citation: Unal CT, Golowasch JP and Zaborszky L (2012) Adult mouse basal forebrain harbors two distinct cholinergic populations defined by their electrophysiology. Front. Behav. Neurosci. 6:21. doi: 10.3389/fnbeh.2012.00021
Received: 31 January 2012; Accepted: 19 April 2012;
Published online: 08 May 2012.
Edited by:
Anita Disney, Salk Institute for Biological Studies, USAReviewed by:
Douglas Nitz, University of California, San Diego, USAEmmanuel Eggermann, Ecole Polytechnique Fédérale de Lausanne, Switzerland
Copyright: © 2012 Unal, Golowasch and Zaborszky. This is an open-access article distributed under the terms of the Creative Commons Attribution Non Commercial License, which permits non-commercial use, distribution, and reproduction in other forums, provided the original authors and source are credited.
*Correspondence: Laszlo Zaborszky, Center for Molecular and Behavioral Neuroscience, Rutgers, The State University of New Jersey, Newark, NJ 07102, USA. e-mail: laszloz@andromeda.rutgers.edu