Bayesian exploration for intelligent identification of textures
- 1 Department of Biomedical Engineering, University of Southern California, Los Angeles, CA, USA
- 2 SynTouch LLC, Los Angeles, CA, USA
In order to endow robots with human-like abilities to characterize and identify objects, they must be provided with tactile sensors and intelligent algorithms to select, control, and interpret data from useful exploratory movements. Humans make informed decisions on the sequence of exploratory movements that would yield the most information for the task, depending on what the object may be and prior knowledge of what to expect from possible exploratory movements. This study is focused on texture discrimination, a subset of a much larger group of exploratory movements and percepts that humans use to discriminate, characterize, and identify objects. Using a testbed equipped with a biologically inspired tactile sensor (the BioTac), we produced sliding movements similar to those that humans make when exploring textures. Measurement of tactile vibrations and reaction forces when exploring textures were used to extract measures of textural properties inspired from psychophysical literature (traction, roughness, and fineness). Different combinations of normal force and velocity were identified to be useful for each of these three properties. A total of 117 textures were explored with these three movements to create a database of prior experience to use for identifying these same textures in future encounters. When exploring a texture, the discrimination algorithm adaptively selects the optimal movement to make and property to measure based on previous experience to differentiate the texture from a set of plausible candidates, a process we call Bayesian exploration. Performance of 99.6% in correctly discriminating pairs of similar textures was found to exceed human capabilities. Absolute classification from the entire set of 117 textures generally required a small number of well-chosen exploratory movements (median = 5) and yielded a 95.4% success rate. The method of Bayesian exploration developed and tested in this paper may generalize well to other cognitive problems.
Introduction
The tactual properties of our surroundings do not chatter at us like their colors; they remain mute until we make them speak… Eye movements do not create color the way finger movements create touch. Katz (1925)
Touch, by necessity, is an interactive sense, unique from the senses of vision and hearing. While we are able to observe the sights and sounds of our environment without any physical interaction, the tactual properties of an object can only be sensed by physical contact. When interacting with an object, humans not only need to interpret the tactile information they sense, they also need to decide which types of movements to make in order to produce these tactual percepts. Artificial systems will require similar strategies (Loeb et al., 2011). Experimental psychologists have identified six general types of exploratory movements that humans make when tactually exploring objects to determine their properties: enclosure to determine global shape and volume, hefting to determine weight, pressure to determine hardness, static contact to determine thermal properties, contour following to determine exact shape, and lateral sliding movements to determine surface texture (Lederman and Klatzky, 1987). Performing all of these movements and their many variants when identifying objects by touch may not be practical or useful. Instead, prior knowledge can be used to intelligently guide the selection of which exploratory movements to make. In this work we present a novel methodology for selecting these optimal exploratory movements called Bayesian exploration. The process works by using prior experience to determine which of the many possible exploratory movements is expected to produce the greatest distinction between the most plausible candidate objects. To simplify the analysis, we reduced the scope of the discrimination task to only texture discrimination, a modality for which human strategies and capabilities have been well-described in the literature.
Early work from David Katz provided some of the first insights into the psychophysics of texture discrimination. In his studies he observed that while coarse textures could be discriminated based on their static contours by simply pressing down on an object, fine textures instead required sliding motion in order to generate vibrations for their discrimination (Katz, 1925). More recent studies have supported that lateral movements and vibrations do, in fact, play a critical role in the perception of fine textures (Hollins and Risner, 2000), for which discrimination is impaired after vibrotactile adaptation (Hollins et al., 2001). The human hand has a wealth of sensory receptors responding to mechanical and thermal stimuli (Jones and Lederman, 2006). Pacinian corpuscles with frequency responses of 60–700 Hz (Mountcastle et al., 1972) are capable of sensing vibrations associated with slip and texture that can be less than a micrometer in amplitude at their characteristic frequency of 200 Hz (Johansson et al., 1982; Brisben et al., 1999), suggesting that highly sensitive transducers will be required if this capability is to be reproduced artificially.
A great body of research has focused on the physical stimuli and perceptual properties that permit the identification and discrimination of textures. The perception of roughness has been one of the most studied of these properties. Early psychophysical experiments attributed this to the friction coefficient between the skin and object for fine textures (Katz, 1925). Other studies using coarser textures (spatial periods greater than 0.5 mm) have proposed that spatial period and contact force, and not friction, are correlated with perceived roughness (Lederman et al., 1982). Smith et al. (2002a) contested these findings, providing additional support for the role of friction and shear force in the perception of these coarse textures. Further studies involving fine textures have indicated that the power of vibrations as sensed by the Pacinian corpuscles could play an integral role in the perception of roughness (Bensmaïa and Hollins, 2005). Early studies into the perceptive dimensionality of surfaces have suggested that sticky/slippery, hard/soft, and rough/smooth represent three independent dimensions of a surface (Hollins et al., 1993). However, these studies only used 17 surfaces and the relevance of these results have been contested by Bergmann Tiest and Kappers (2006) who have explored dimensionality with a total of 125 surfaces. Findings from this expanded database have suggested that there are at least four perceptual dimensions of surfaces (and likely more), although not all could be correlated specifically with named properties. We propose that some of this dimensionality could be attributed to non-textural properties such as compliance and thermal properties that might be obtained without the need for sliding movements. With specific regards to texture and sliding movements, the dimensions of sticky/slippery, rough/smooth, and coarse/fine seem to be the most salient descriptions of properties that make textures distinct, based on both the descriptive words that people use to describe textures and their utility as demonstrated by the experimental literature.
In Katz’s (1925) original work he proposed a duplex theory for texture perception, hypothesizing that coarse textures can be discriminated spatially while fine textures are discriminated dynamically through sensed vibrations. This was prescient, as the structure and function of cutaneous mechanoreceptors was then unknown. We now know that vibrations and static pressure are sensed by separate populations of cutaneous mechanoreceptors (Knibestöl and Vallbo, 1970; Jones and Lederman, 2006). Artificial tactile sensors have developed along similar lines, offering either high spatial resolution or high temporal bandwidth. Reviews of the various tactile sensing technologies over the last 30 years can be found in (Nicholls and Lee, 1989; Howe, 1994; Lee and Nicholls, 1999; Dahiya et al., 2010). For dynamic tactile sensing and texture discrimination, a number of technologies have been introduced implementing accelerometers (Howe and Cutkosky, 1989, 1993), piezoelectric film (Tada et al., 2003) microphones (Edwards et al., 2008), and tri-axial MEMS force sensors (de Boissieu et al., 2009). More recently, many tactile sensors have introduced fingerprint-like ridges (Mukaibo et al., 2005; Oddo et al., 2009; Scheibert et al., 2009), which have been proposed to enhance the correlation of spatial frequency of explored textures with temporal patterns in the sensed vibrations.
The use of tactile sensors for artificial texture discrimination has received a great deal of attention in recent years. Tada et al. (2004) were able to demonstrate that signal variance of two differentpolyvinylidenedifluoride (PVDF) films embedded at different depths in a complaint sensor could be used to distinguish among five different textures. Further development by this group expanded this analysis to an additional sensory dimension using an embedded strain gage (Hosoda et al., 2006). Mukaibo et al. (2005) developed a tactile sensor with fingerprints and embedded strain gages to discriminate surfaces based on roughness and friction. A force sensor with an elastic covering developed by de Boissieu et al. (2009) was used with sliding movements to identify 10 different kinds of paper using two different analytical approaches: the first utilized differences in Fourier coefficients in the recorded vibrations while the second used more direct signal features such as the mean, variance, and kurtosis of the signals as well as spectral properties in a neural network classifier. A similar approach was taken by Giguere and Dudek (2011) using accelerometers on a rigid tactile probe to classify driving surfaces based on their means, variance, and higher-order moments in a neural network. Oddo et al. (2011) used a robotic finger producing a stereotyped sliding movement to discriminate between three fine textured gratings ranging from 400 to 480 μm based on their spectral properties. Jamali and Sammut (2011) analyzed Fourier components of vibrations measured from eight different textures using a novel method of majority voting to classify these textures with a high accuracy of 95%. This study took advantage of multiple exploratory movements, starting with three movements initially and adding movements until 80% or more of these movements indicated a particular texture. With exception to the last study that explored three different sliding velocities, all of these cases considered only a single exploratory movement. It has been demonstrated that multiple exploratory movements as well as multiple features can boost the performance of such a classifier for texture discrimination (Sinapov and Stoytchev, 2010). In a subsequent study by the same group 20 textures were explored with a fingernail-like tactile sensor measuring accelerations at five different exploratory movements. The frequency components from these different movements were used to obtain a classification performance increase from 65% using the best single exploratory movement to 80% for all five exploratory movements (Sinapov et al., 2011).
In all of these cases, the discrimination of textures with these artificial systems is for the most part a “passive” exploratory procedure. Force and speed are preset to some standard values and a fixed movement (or sequence of movements) is executed. Furthermore, the selection of signal processing measures is seemingly arbitrary in many of these studies. Various methods are attempted and those that appear to yield the best performance are used as classifier input. Instead, we propose that findings from psychophysical literature can guide the development of more intuitive and useful signal measures.
As reviewed above, multiple signals, multiple exploratory movements, as well as repeated trials can boost classification performance. However, as the complexity of discrimination tasks increase beyond simply texture discrimination and more movements and signals are added to the repertoire, the feasibility of doing everything (especially for multiple trials) can become highly impractical if not completely infeasible. Instead, the task of discrimination can take advantage of a hypothesis-testing approach that we have proposed humans likely use when exploring objects (Loeb et al., 2011). Each successive exploratory movement can be used to reduce the set of possible candidates; this information can be used to determine the optimal next exploratory movement that would yield the best discrimination among these most likely candidates rather than the entire population. Such an approach would have advantages in reducing the number of exploratory movements needed to classify a texture or in the general case, any object. Here we introduce a novel algorithm where the selection of the exploratory movement becomes a critical process of the identification task. Using a database of prior experience, optimal exploratory movements are selected and executed to aid in the discrimination task.
Materials and Methods
An overview of Bayesian exploration is presented first (see Classification Theory and Strategy) in the context of a texture discrimination task, followed by a description of the BioTac multimodal tactile sensor (see Biomimetic Tactile Sensor) and the experimental apparatus used to control sliding movements when exploring textures (see Experimental Apparatus). The descriptive words humans use when discriminating textures are used to define quantifiable properties of textures (see Analytical Measures of Descriptive Texture Properties), followed by a method for determining the most useful exploratory movements to estimate those properties (see Selection of Set of Exploratory Movements). The final three Sections describe the classifier training over this refined set of movements (see Classifier Training and Data Collection), the methods employed for comparing performance of this classifier to human performance in discriminating pairs of similar textures (see Texture Discrimination and Comparison with Human Performance) and methods for absolute texture discrimination from a broad set of 117 textures (see Absolute Texture Identification).
Classification Theory and Strategy
Classification is a topic of wide interest in artificial intelligence and is a subset of the larger fields of pattern recognition and machine learning. The goal of a classification task is to identify which class or classes best explains a set of observations. Many tools exist involving both supervised and unsupervised training (Jain et al., 2000). In the majority of classification problems, inputs are given and the class with the maximal posterior likelihood determines the classification1. This introduces a fundamental deficiency in the typical approach to classification problems: the decision must be made with the currently available information. To compensate for this deficiency, it is common to collect as much information as possible before the classification is made. The time and effort required to produce each exploratory movement to collect tactile data suggests that this would be highly inefficient. Decisions are first required to determine which exploratory movements to make before any tactile information can be obtained. The selection of these movements would benefit greatly from iterative decision making, in which the observations of previous movements are used to identify the most likely candidates to select the next movement that is most likely to disambiguate them. Here we introduce a novel method of texture discrimination implementing these strategies. This method of Bayesian exploration should be generalizable to any identification task requiring such intelligence.
Bayesian inference for discrimination of textures
Bayesian inference is a widely implemented statistical classification method used to estimate the likely causes of an observation after it has occurred. Considering a set of textures (T) and the observable measurements that they generate (X) when performing an exploratory movement (M), we can estimate the likelihood that a given texture had caused these observations with Bayes’ rule:
Where Ti belongs to a set of textures T, X is a set of observable properties (which are introduced in the later sections), Mm is a particular exploratory movement that gives rise to these sensed properties, and P(Ti) represents the prior probability of texture Ti. P(X, Mm) is the probability of observation X occurring given all known causes from the set T at exploratory movement Mm and can be found by the law of total probability:
Substituting (2) into (1) yields a common formulation of Bayes’ rule:
The probability of a measurement occurring given a known texture and exploratory movement can be estimated from its probability density function. In the absence of other evidence, the central limit theorem suggests that these values should fall within a normally distributed probability density function that can be defined according to a mean (μ) and standard deviation (σ):
It is important to note that the probability density function is not a true probability, but rather a density, and can take on a value greater than unity. However, this measure is proportional to the actual probability; the unknown scaling can be ignored as it is canceled out by the denominator of (3), which has the same scaling factor. The formulas (3) and (4) can be used to update the posterior probability of a texture given observation X from a normally distributed set of expected observations. In practice, as evidenced by human performance, multiple observations, and exploratory movements need to be made to refine this to an acceptable level of confidence before determining the most likely texture.
Adaptive selection of optimal exploratory movements
We have proposed that humans use a careful selection of exploratory movements to test hypotheses when exploring objects by touch (Loeb et al., 2011). Consider a simple example of identifying a brick by touch. Absent prior information about the object, a reasonable first exploratory movement might be an enclosure movement, yielding information about the object’s size and indicating that it is a large rectangular prism. Based on this information, the examiner may then conclude that it is either a brick or a block of wood. Useful subsequent movements to extract the most information between these two objects would probably focus on its mass, such as pushing or hefting the object.
The process of determining which exploratory movement is optimal requires a prediction of the perceived benefit based on prior experiences. A similar methodology has been presented by Rebguns et al. (2011), where movements and sensing actions are selected to reduce Shannon entropy. In that study exploratory movements cease when there is no perceived reduction of this entropy, a feature the authors refer to as “burying its head in the sand” to avoid getting additional information that might increase uncertainty. While the performance of this study was quite impressive, the concept of additional information being undesirable is peculiar. By contrast, our approach is not to infer the reduction of entropy; instead we simply select the movement that would best discriminate between likely objects. The decision to make this next movement or not depends on whether the information and a higher level of confidence is worth the time and energy required to make the exploratory movement.
To estimate which movement would best discriminate among likely objects, we can use prior experience to infer the expected similarity between signals from pairs of objects at each of these movements. Movements that produce the greatest difference in measured signals from different objects would be optimal for the discrimination task, while the movements that produce similar signals would not be useful. One suitable measure of this degree of confusion is the amount of overlap between two probability density functions. An estimation of this is provided by the Bhattacharyya coefficient, defined as:
The Bhattacharyya coefficient varies between 0 and 1 depending on the overlapping region of the two probability density functions. For a given movement, observation, and pair of textures, a low value would indicate no confusion (so this would be a very useful movement to make in order to disambiguate these objects), while a high value would indicate an undesirable movement because substantial ambiguity would remain. For all possible pairs of textures (i and j) we can define an expected confusion probability matrix for each possible exploratory movement (m) as:
For normally distributed populations this reduces to:
We can estimate the expected uncertainty for a particular texture and movement (ui, m) that would remain after making an exploratory movement from this confusion probability matrix:
Equation 8 measures the degree of confusion between a specific texture and all other likely textures, weighted by their priors, divided by the total amount of weighted confusion including between that texture and itself. If no other textures produce overlapping probability distribution curves with this texture, the value then becomes zero, as there would be no expected uncertainty for this texture and movement combination.
The total expected uncertainty for all textures for a given exploratory movement (Um) can be estimated as:
Substituting (8) into (9) yields:
which, given the coefficient Cij,m is equal to 1 when i is equal to j, can be shown to reduce to:
The value from (11) can be used to determine which movement would produce the lowest expected uncertainty. We define the perceived benefit of making an exploratory movement as:
Which depends on parameter α, which we define as inversely proportional to the number of times an exploratory movement has been made previously (n) for the current discrimination task:
To promote diversity in exploratory movements and collect a richer database of information, we need to reduce the benefit of repeated movements that did not yield satisfactory discrimination performance in prior explorations. Because the uncertainty is a value that ranges from 0 to 1, a larger value of n reduces the benefit of a repeated movement. By calculating this benefit for all possible exploratory movements, the movement that produces the maximal benefit can be identified. The iterative selection and execution of these optimal exploratory movements when investigating an object is the process that we call Bayesian exploration.
Biomimetic Tactile Sensor
The BioTac® (SynTouch, Los Angeles, CA, USA; Figure 1) was designed to provide both robustness and sensitivity for multimodal tactile sensing. It consists of a rigid core that contains all sensory transducers, covered by an elastomeric skin. The space between the skin and the core is inflated with an incompressible liquid to give it a compliance that mimics human fingerpads. No transducers or electrical components are contained in the skin, making the design robust to grit, moisture, or other damage that typically plagues tactile sensors. The BioTac consists of three complimentary sensory modalities (force, vibration, and temperature) that have been integrated into a single package. Contact forces distort the elastic skin and underlying conductive liquid, changing impedances of electrodes distributed over the surface of the rigid core (Wettels et al., 2008; Wettels and Loeb, 2011). Vibrations in the skin propagate through the fluid and are detected by the pressure sensor (Fishel et al., 2008). These vibrations can be amplified and filtered to obtain a dynamic (AC) pressure signal with even greater sensitivity than the human fingertip (Fishel and Loeb, 2012). Temperature and heat flow are transduced by a thermistor near the surface of the rigid core (Lin et al., 2009).
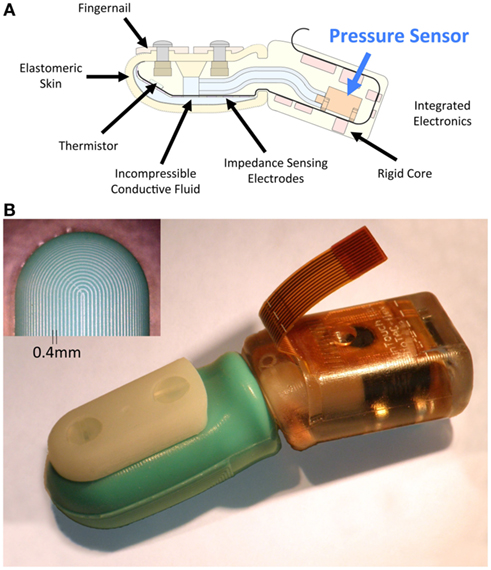
Figure 1. The BioTac. (A) Cross-sectional schematic of the BioTac, the multimodal tactile sensor used for these studies. Vibrations of the skin are induced when sliding over textured surfaces and propagate efficiently through the liquid-filled sensor where they can be sensed by the pressure sensor. (B) Photograph of an assembled BioTac and fingerprint-like ridges (inset). These fingerprint-like ridges that have a biomimetic size (0.4 mm spacing) and have been observed to greatly enhance the vibrations that are detected with the BioTac (Loeb and Fishel, 2009).
The BioTac exhibits high sensitivity to induced vibrations when sliding over textured surfaces (Fishel et al., 2008). More recent quantitative tests with controlled small impacts and applied vibrations demonstrated higher sensitivity than human fingertips (Fishel and Loeb, 2012). In this study it was demonstrated that the BioTac is capable of detecting small vibrations only a few nanometers in amplitude around its peak frequency sensitivity of 330 Hz, nearly two orders of magnitude better than human subjects. To achieve this sensitivity, the BioTac takes advantage of carefully designed signal processing electronics that allow a sensitivity near the theoretical noise floor of the pressure sensor. First the output from the piezoresistive pressure transducer (24PC15SMT, Honeywell) is amplified by a gain of 10 with a low-pass anti-aliasing filter (1040 Hz) obtain a measurement of fluid (DC) pressure (sensitivity: 21.8 mV/kPa). This is then passed through a band-pass filter (10–1040 Hz) and amplified with an additional gain of 99.1 to obtain a sensitivity of 2.16 mV/Pa for dynamic (AC) pressure. The background noise at this stage was found to be only 1.2 mV (0.52 Pa of dynamic pressure). Dynamic (AC) pressure as well as static (DC) pressure were sampled at 2200 Hz and digitized with a resolution of 12 bits in the range of 0–3.3 V (AC Pressure is biased to 1.65 V) through onboard electronics inside the BioTac. Sampling and data transmission are controlled through a serial peripheral interface (SPI) protocol provided with the BioTac.
The compliance, shape and material properties of the liquid-inflated elastomeric skin (Silastic S, Dow Corning) give rise to a natural resonant frequency around 200–350 Hz, which happens to be similar to the peak sensitivity of the Pacinian corpuscles. The surface of the BioTac has a fingerprint-like pattern (cylindrical shaped ridges with a height of 0.2 mm and spacing of 0.4 mm) that has been observed to enhance the amplitude of these vibrations in the BioTac (Loeb and Fishel, 2009). Given its similarities to the mechanical properties and sensitivity of the human fingertip, the BioTac provides an opportunity to test theories of human texture discrimination (Loeb et al., 2011) and to explore if they can be used by artificial systems seeking to achieve similar performance in tactile object identification.
Experimental Apparatus
We hypothesize that humans utilize a variety of lateral sliding movements when exploring textures. The magnitude of contact force and velocity of the sliding movement are the two most obvious parameters that define these movements. Compelling artificial texture percepts can be recreated based on only these two parameters of an exploratory movement (Romano and Kuchenbecker, 2011). The apparatus developed for these experiments is capable of precision control of contact force and sliding velocity while collecting sensory data from the BioTac as it explores a texture. The apparatus makes use of a stepper motor to set contact force and a precision linear stage to control the sliding velocity relative to the textured surface (Figure 2).
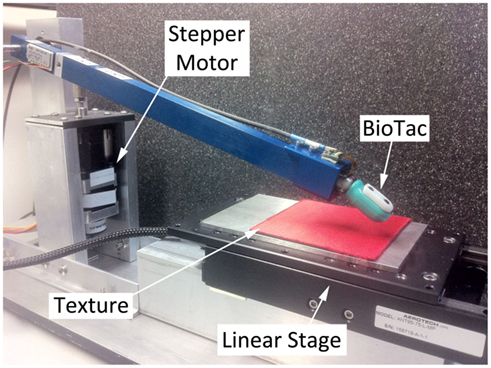
Figure 2. Texture exploration apparatus with the BioTac and texture. A stepper motor (left) is attached to a lever (blue) that can raise or lower the BioTac on textures. Adjusting the vertical position of the stepper motor provides control of contact force. To produce lateral motion, a special vibration-free linear stage is used to slide textures past the BioTac. Textures are adhered to flat, square magnets that can be mounted and dismounted rapidly on a steel plate attached to the linear stage.
Force control with stepper motor
Normal force of the BioTac onto the explored texture is adjusted with a stepper motor (L4118 and SMCI33, Nanotec) that positions a lever with a BioTac on the end (Figure 2). Observations indicated that the change in fluid pressure of the BioTac was linearly correlated with contact force (slope 11.5 mN/bit, R2 = 0.995) at forces less than 2 N (Figure 3). This was verified by pressing down on a force plate (Nano17, ATI) positioned to be at the same height as the textures. At forces greater than 2 N the skin of the BioTac comes into contact with the core and the relationship between contact force and fluid pressure is no longer linear. This relationship in the linear range was used to control the stepper motor in order to achieve the desired contact force prior to an exploratory movement. The BioTac was lowered slowly onto a texture (0.5 mm/s) while monitoring the actual DC pressure. When this value reached the target change in DC pressure, the stepper motor was stopped. The sliding movements and associated shear forces tended to produce modest changes in the DC pressure, but no adjustments were made to the stepper motor position while sliding and collecting vibration data to avoid introducing spurious vibrations.
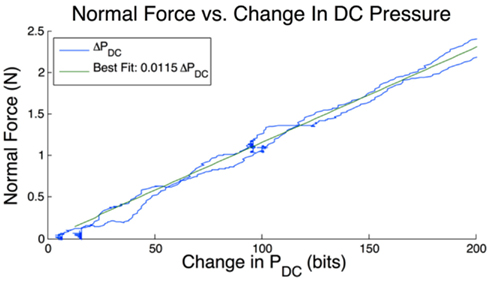
Figure 3. Relationship between normal force and change in DC pressure. A single trial is shown in both loading and unloading (blue) as normal force increases and decreases on the tip of the BioTac. The best fitting line is shown in green and a correlation value of R2 = 0.995 is observed.
Velocity control with linear stage
Sliding velocity of the textures under the BioTac was controlled with a precision, low-vibration linear stage (ANT130, Aerotech). The high-quality cross-roller bearings of the motor produced extremely smooth sliding motions and no mechanical vibrations could be detected even with human touch while the stage was moving. A motion controller (Soloist, Aerotech) controlled sliding velocity and distance based on preset commands. Motor current and sliding velocity were sampled by the motion controller, which could be queried in LabVIEW using built-in software libraries provided by the manufacturer.
Textures
A total of 117 textures were used in these experiments (Table 1). These were selected from a large library of everyday materials found in art supply, fabric, and hardware stores. Using a variety of commonly occurring textures provides a more realistic database of surfaces than have been previously used in other studies of psychophysical and artificial texture discrimination, which tend to use surfaces made from the same material varying along a single parameter such as spatial period. These textures were cut into 75 mm × 75 mm squares and attached to square magnets of the same size with adhesive backing. The magnetically backed textures could be rapidly mounted and dismounted to a steel plate attached to the linear stage.
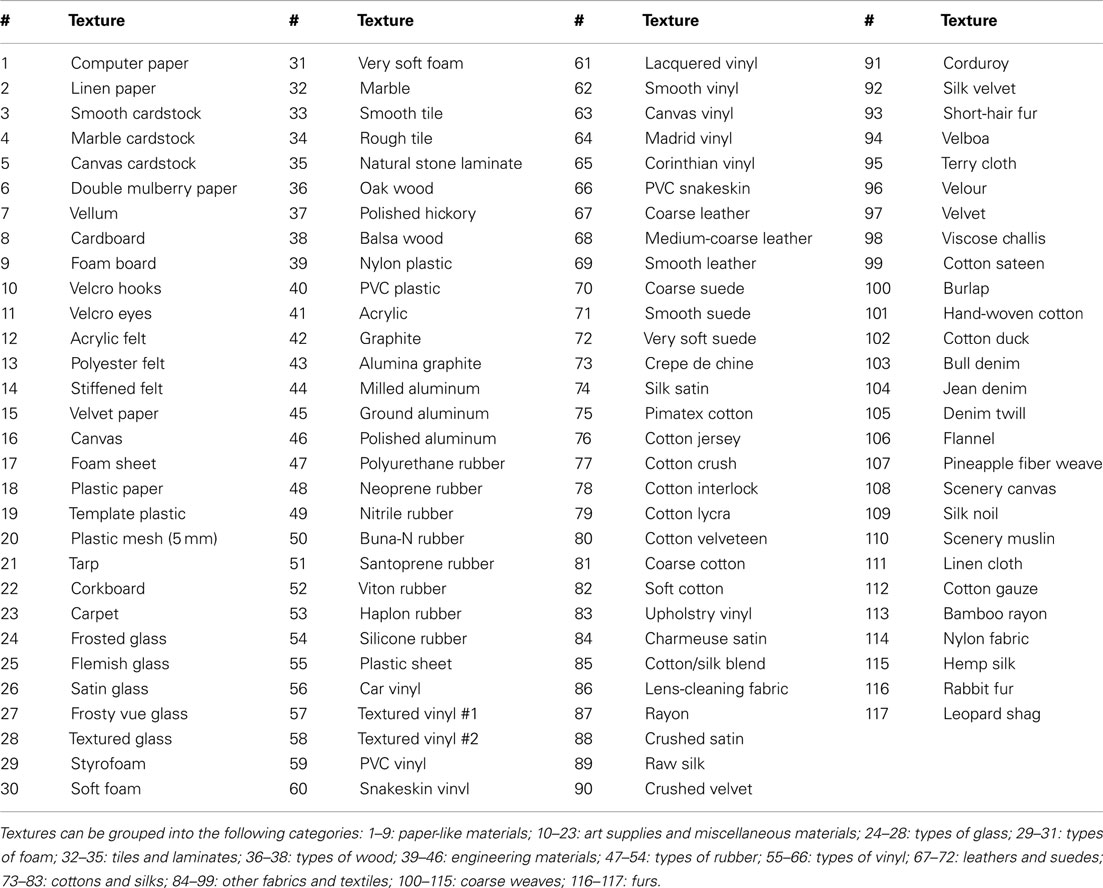
Table 1. List of 117 textures used in this study.
Software
The sampling of the BioTac, control of stepper motor and linear stage were done using LabVIEW (National Instruments). Sampling of the BioTacs was achieved using a USB/SPI adapter (Cheetah SPI, Total Phase) and software libraries developed by and available from SynTouch (Los Angeles, CA, USA). Both DC and AC pressure were sampled at 2200 Hz each. Data was sampled continuously and transmitted back to the computer in batches every 100 ms. The digital controls for the stepper motor were also updated every 100 ms through a DAQ card (NI USB-6218, National Instruments). Control of the linear stage was maintained continuously by the motion controller; the motor current and stage position and velocity were queried every 100 ms through software libraries developed by Aerotech. For each texture, the exploratory process was automated to produce multiple trials at each exploratory movement before proceeding to the next texture. Data were analyzed offline in MATLAB.
Analytical Measures of Descriptive Texture Properties
A system that uses orthogonal measurements as inputs is ideal for a machine classifier problem. Several machine learning algorithms exist to reduce unnecessary dimensionality of inputs, such as principle component analysis and other multidimensional scaling techniques (Jain et al., 2000). Moderate success discriminating a small numbers of textures has been achieved using various statistical measures and signal processing approaches as input to these classifiers. We hypothesized that reasonably orthogonal measures could be obtained by studying the language people use to describe textures. The human brain is a very effective classifier and language has evolved as a tool to describe the percepts associated with texture discrimination. For this study, we selected simple and intuitive measures of descriptive properties frequently used in psychophysical literature exploring texture discrimination, bypassing many of the artificial and convoluted statistical techniques commonly used in classifier methods. Three distinct properties have been identified in literature: traction (sticky/slippery), roughness (rough/smooth), and fineness (coarse/fine).
Traction of texture
Descriptive words such as slippery and sticky2 are commonly used to describe the resistance to movement when sliding over a texture. This dimension has been suggested to be relatively orthogonal to the perceptual dimension of roughness (Hollins et al., 1993). To measure this percept, we chose to use traction or resistance to motion, although other literature has reported that this force is correlated with the perception of roughness (Smith et al., 2002a). In physics, the kinetic coefficient of friction between two objects is typically used to quantify this property. It is important to note that when measuring traction, we are measuring the force required to slide the BioTac skin (Silastic S, Dow Corning) over the texture; the measured traction is a property of these two surface interactions. Amontons’ first and second laws, as well as Coulomb’s law of friction, state that the coefficient of friction multiplied by the normal force is equal to the maximal shear force that two objects will exert on one another when sliding. While this is an idealization that does not address some of the more complex properties of friction (i.e., viscosity), we propose that the measurement of average frictional force between the skin of the BioTac and explored texture while sliding can provide a useful measure in discriminating textures.
In our experimental testbed, the linear stage that produces sliding movement scan be queried for instantaneous motor current. This was found to vary linearly with shear force by placing the stage at a 45° angle and attaching various weights to it. In dynamic sliding it was observed that initially a high amount of current was required to accelerate the stage from rest but only a low amount of current was required to overcome the dynamic friction within the stage in the unloaded state once the stage had reached its target velocity. When the BioTac was pushed against a texture sample on the stage, the motor current required to sustain constant velocity sliding increased linearly with the applied normal force. Given the linearity of this response, the average motor current from the stage while sliding was used to estimate the traction between the BioTac and textures being explored. This was simpler and more accurate than using the force-sensing modality of the BioTac itself, which can extract tangential force from the distributed change in impedance of its impedance sensing electrodes (Wettels and Loeb, 2011).
Examples of this signal and calculations are provided in Figure 4, frame B.
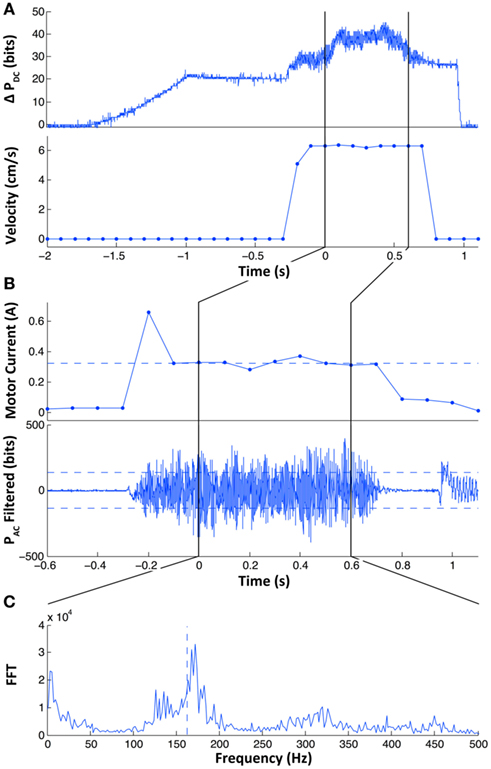
Figure 4. Typical signals that occur during an exploratory movement. In (A) the change in DC pressure (top) and sliding velocity (bottom) are shown over the course of the trial. The loading of DC pressure by the stepper motor occurs between t = −1.5 and −1 s, in this example it is equal to roughly 17 bits or 0.2 N. Once the desired contact force is reached, the position of the stepper motor is held for about 0.5 s before the linear stage is actuated to the controlled sliding velocity (6.31 cm/s in this example). The measurement region of signals indicated as vertical black lines occurs shortly after the sliding and stops before the sliding is completed. In (B) the time axis is zoomed with respect to (A) and motor current and filtered PAC signals are displayed. In the top trace, the motor current of the linear stage before the measurement of signals indicated by the vertical black lines is initially high due to the acceleration of the linear stage. The horizontal dashed line represents the average motor current over the measurement region and is used to estimate the traction between the texture and the BioTac while sliding. In the lower trace filtered PAC signals are presented. The root mean squared (RMS) power is indicated by the dashed lines as upper and lower bounds; the logarithm of the actual power is used as the roughness signal. In (C) the fast Fourier Transform is presented of the unfiltered PAC signal. The spectral centroid is calculated as the weighted average of spectral power components and is presented as the vertical dashed line. This measurement is used to estimate the fineness of the texture.
Roughness of texture
When sliding over surfaces with different roughness properties with the BioTac, we observed that the amplitude of vibration as measured by the dynamic pressure sensor in the BioTac (PAC) was correlated with the perceived roughness of the texture, similar to the observations of (Bensmaïa and Hollins, 2005). In our own findings, smooth surfaces were found to produce virtually no vibrations, while rougher surfaces produced vibrations of much greater amplitudes. To quantify this, we computed the logarithm of signal power after subtracting the background noise with the equation:
AC pressure was filtered with a 20–700 Hz digital band-pass filter (66th order FIR filter) to simulate the frequency response of the Pacinian corpuscles that are thought to mediate texture perception and eliminate low frequency oscillations from contributing to this estimate. An example of the filtered signal is shown in Figure 4, frame B. It was also observed that even when locked in a fixed position, the stepper motor produced some background noise that was not consistent from trial to trial. By measuring this background noise power prior to sliding and subtracting it from the power while sliding we were able to obtain more consistent measurements of the signal power contributed from sliding alone. The logarithm of this signal was found to better reflect a more evenly distributed set of roughness properties with similar variances (as presented later in Figure 5). A similar justification for using the logarithm of surface amplitude in psychophysical discrimination of textures has been proposed by Bergmann Tiest and Kappers (2006).
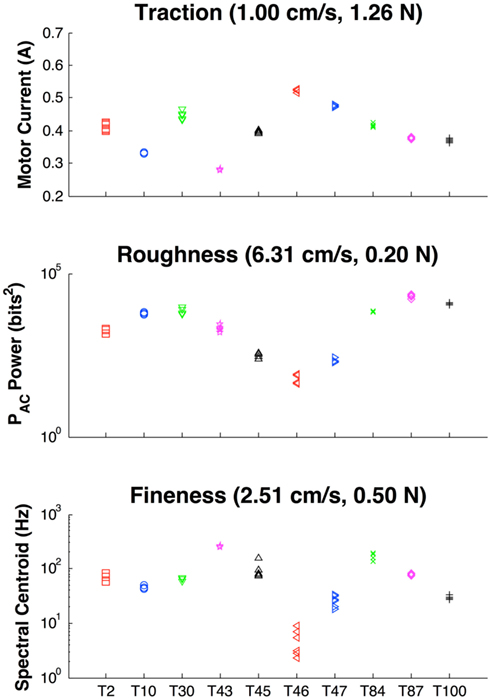
Figure 5. Measures of descriptive texture properties at their optimal exploratory movements. Texture IDs: T2 = Linen Paper, T10 = Velcro Hooks, T30 = Foam, T43 = Graphite, T45 = Milled Aluminum, T46 = Polished Aluminum, T47 = Rubber, T84 = Satin, T87 = Rayon, T100 = Burlap. Top frame: Traction as measured from motor current to overcome sliding friction between the skin of the BioTac and the texture. Middle frame: roughness as measured from vibration power as recorded by the PAC signal from the BioTac. Bottom frame: spectral centroid as measured by weighted spectral power of PAC signal from the BioTac. Six trials are shown for each movement to demonstrate clustering of each signal.
Fineness of texture
The role of spatial periodicity in the perception of textures has been explored in a number of studies. It has been observed that the coarser textures produce lower-frequency vibrations when sliding over an object, while finer textures produce higher-frequency vibrations, suggesting the simple relationship:
with λ equal to the spatial wavelength of the texture or fingerprints and v equal to the velocity of lateral motion. This is the operating principle of many algorithms for texture discrimination in artificial sensors (Mukaibo et al., 2005; Oddo et al., 2009, 2011; Scheibert et al., 2009). Our own findings have indicated that this relationship breaks down for finer textures and higher velocities (as presented later in Figure 6). Although not directly reported, this can be observed in the results from Mukaibo et al. for higher spatial frequencies and from Oddo et al. for higher velocities, in which the estimation of spatial wavelength becomes much more prone to errors when approaching these limits. The experiments of Scheibert et al. were conducted at very low exploratory speeds (0.02 cm/s), two to three orders of magnitude slower than common exploratory movements employed by humans (Dahiya and Gori, 2010), which is clearly not fast enough to observe this dynamic behavior. Furthermore, smoother surfaces have been demonstrated to be free of spectral harmonics, instead generating signals that represent 1/f noise in the frequency domain (Wiertlewski et al., 2011). Measured frequencies do not always relate linearly to the spatial wavelength of the texture, particularly for fine or smooth textures, but the estimation of this frequency can still yield useful information about the relative fineness or coarseness of the texture.
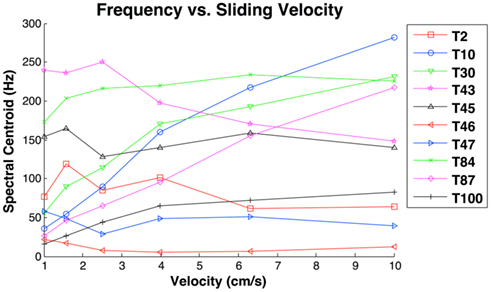
Figure 6. Spectral centroid as a function of sliding velocity at the lightest contact force (0.2 N). Results indicate that only the spectral centroid of coarser textures (T10 = Velcro Hooks, T30 = Foam, T87 = Rayon, and T100 = Burlap) consistently increased as a function of velocity. Finer textures produced idiosyncratic functions of velocity, while the spectral centroid of graphite (T43) decreased as a function of velocity.
We propose a measure of spectral centroid to determine the weighted frequency power of the vibrations recorded by the BioTac. The dynamic pressure is transformed into the frequency domain using the single-sided fast Fourier transform and the spectral centroid is calculated using the weighted average of the frequency power from the following equation:
To smooth the frequency domain response, a sliding window was used to collect the Fourier transform at different sections of the signal, which were averaged and used for the spectral centroid estimation. Examples of this measurement are shown in Figure 4. A logarithmic scale of this measure is used as an input to the texture discrimination model. Note that this method does not attempt to compensate for the rather complex frequency response of the BioTac itself (Fishel and Loeb, 2012).
Normality of signals
The classifier discussed in Section “Classification Theory and Strategy” makes the assumption that signals arise from a normally distributed population. Due to the large number of textures explored, only a small number of trials could be collected for each of the exploratory movements. Therefore, a thorough analysis of the exact probability density function for these signals could not be conducted. We make the assumption that signals are normally distributed for the purposes of this study, however as more samples are collected a clearer understanding of the true probability density function would serve to improve the performance of this classifier. This will be even more important when classifying surfaces that have some heterogeneity in their textures.
The curse of dimensionality
Additional input dimensions will typically improve performance of a classifier if they are well defined. In practice, however, it has been observed that additional dimensions will actually degrade performance of a classifier for a constant sample size, a property that has become known as the curse of dimensionality (Jain et al., 2000). To overcome this, an exponential increase in training data is required for each new dimension. To avoid the need for such a vast amount of training data, our model considers only univariate distributions of a single property at each exploratory movement. Indeed, we have found that our classifier performance was severely degraded when considering all three properties at once for each exploratory movement using multidimensional probability density functions. The result was an algorithm that quickly converged in one or two exploratory movements but frequently to the wrong texture. As additional training is obtained, such a multidimensional approach would be optimal, but this is infeasible for the large number of textures used in this study. To avoid this shortcoming we only considered a single signal during an exploration movement. While this may not appear to take full advantage of all available information, it is actually preferable for a classifier with such limited experience, allowing it to focus solely on the property that it determines to be most relevant for a given exploration.
Selection of Set of Exploratory Movements
While there exist infinite combinations of contact force and sliding velocities that can be used when exploring textures, experimental studies have demonstrated that individual subjects are quite consistent in reproducing exploratory movements in these tasks, although there is a high degree of variability among subjects (Smith et al., 2002b). This suggests that certain combinations of exploratory movement tend to be more efficient and that an individual person discovers and uses such combinations consistently. The internal representation of the objects in the external world could then be based on predictable sensations obtained when well-learned and, hence, dependable exploratory movements are made.
To identify these useful movements, 10 textures were chosen for the pilot study based on their perceived dissimilarity in the multidimensional space of identified texture properties (low/high traction, rough/smooth, coarse/fine; Table 2). Given the diversity of this sample, this was believed to represent most of the perceptual range of the complete set of 117 textures.
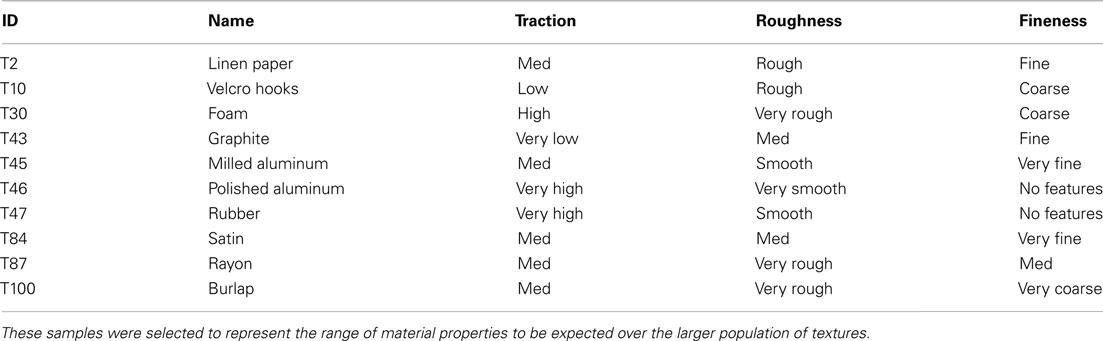
Table 2. Textures used in exploratory movement pilot study and their perceived properties of traction, roughness, and fineness when explored by the human finger.
A total of 36 exploratory movements were chosen based on all combinations of six speeds and six forces. The ranges of these parameters were chosen to mimic the ranges humans typically use when exploring textures (1–10 cm/s, 0.2–2 N). Force (F) and velocity (v) at these six steps were calculated as a geometric series:
Using such a scale permits for comparisons to be made between exploratory movements that had equivalent frictional sliding power. For a given texture interacting with the BioTac skin, sliding power is proportional to the tangential force times sliding velocity. Given the assumptions of Amoltons’ first law of friction, the tangential force would be proportional to the normal force for a given pair of surfaces with a constant coefficient of friction. With this set of parameters, pairs of force and velocity with equal sliding power could be found from the following equation:
Six repetitions of the 36 movements were collected for each of the 10 textures. At each trial the starting location on the texture was randomized to ensure collected signals were properties of the texture itself and not necessarily an isolated feature on a given portion of the texture. Exploratory movements were automated by software and the data were saved to file for post processing. Data were collected for each of the exploratory movements for a particular texture before moving on to the next. The degree of uncertainty for each movement was analyzed for each signal property independently rather than as a multivariate system. This method was chosen to avoid the curse of dimensionality, as discussed in the previous section.
It was observed that high frictional sliding power exploratory movements (combinations of high force and velocity) led to an increase in skin wear and removal of fingerprints, resulting in substantial changes in the vibration signals recorded by the BioTac; these pairs of exploratory movement parameters were avoided. Of the remaining options, we selected three combinations, each of which provided the lowest uncertainty for one of the three properties (see Figure 7). These three most useful movements were used to explore the entire set of 117 texture samples.
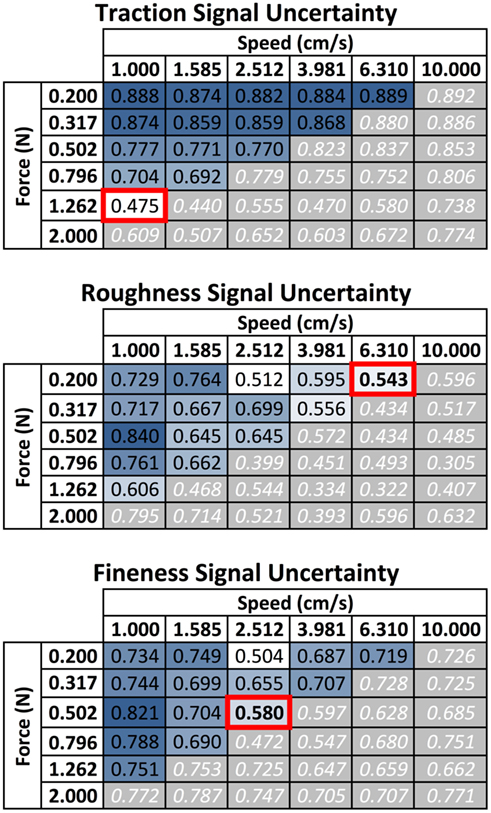
Figure 7. Selection of optimal exploratory movements for pilot study of 10 textures. Tables present the uncertainty calculated for each measurement property for combinations of contact force and sliding velocity. Gray boxes with white numbers in the lower-right half plane represent exploratory movements that were excluded due to the high wear rate high force and velocity combinations had on the skin. Values in the upper left half plane are coded from blue to white to represent decreasing uncertainty with lower values being ideal for discrimination of the 10 textures. From this the three of the most useful movements were selected as 1.26 N and 1 cm/s for discrimination based on traction, 0.2 N and 6.31 cm/s for discrimination based on roughness, and 0.5 N and 2.5 cm/s for discrimination based on fineness. Movements at 0.2 N and 2.5 cm/s were not selected for the roughness or fineness measures because they appeared to be outliers and did not fit the general trend of performance from neighboring movements.
Classifier Training and Data Collection
Five trials were completed at each of the three selected exploratory movements for the entire set of 117 textures. All trials were completed on a single texture before moving to the next. During these trials, the skin was checked regularly to identify if the fingerprints were still intact. It was observed that fingerprint wear had a detrimental effect on the repeatability of data, particularly in the measurement of roughness from vibration power. To compensate for this, the skin of the BioTac was replaced if there were any visible signs of wear. With this approach we were able to avoid any signal drift resulting from wear, which was verified by comparing signals before and after the skin replacement. The skin of the BioTac was replaced two times under these conditions. Data collection for all 117 textures took roughly 20 h and spanned 4 days.
The data from these trials served to build a prior experience database that could be used to identify presented textures and to compute expected benefit of a given exploratory movement. During the course of these tests, three textures were damaged during the higher force exploratory movements. Data for these textures were not used in the sample. Outputs of the various properties at their optimal movements are presented (Figure 8) along with the confusion probability matrices for all combinations of signals and movements (Figure 9). Signal correlation is presented to show the independence of each dimension (Table 3).
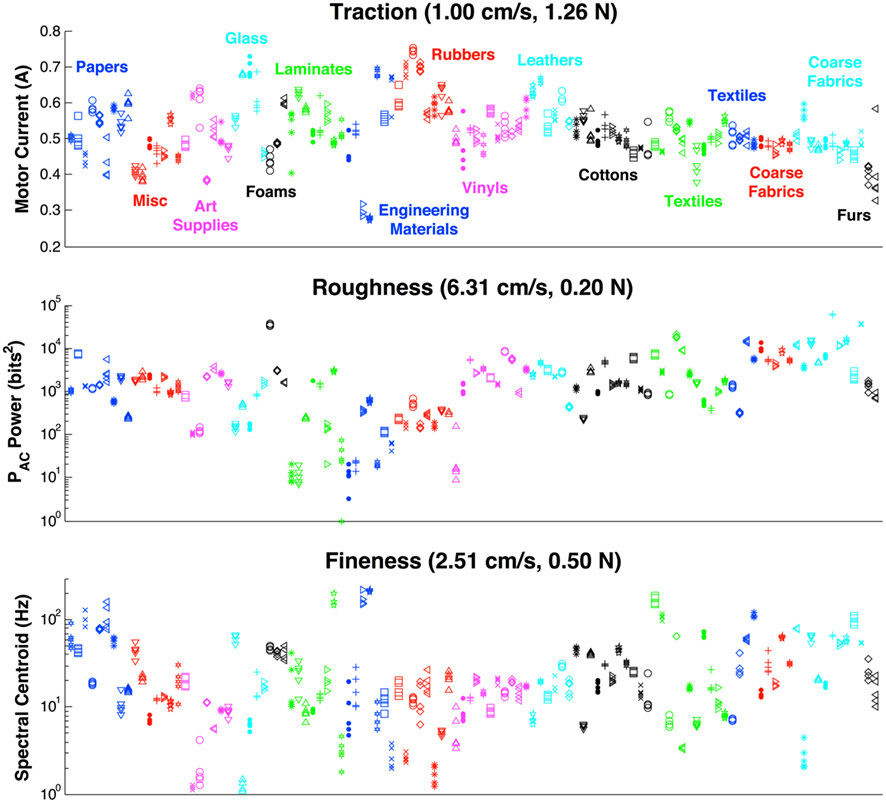
Figure 8. Summary of all texture properties at their most useful movements for entire set of 117 textures. Similar types of materials are grouped by color as shown in the top panel. Five trials are shown for each property and texture to demonstrate the clustering of the measurements. In many cases the clustering is so tight that all five trials appear as a single marker.
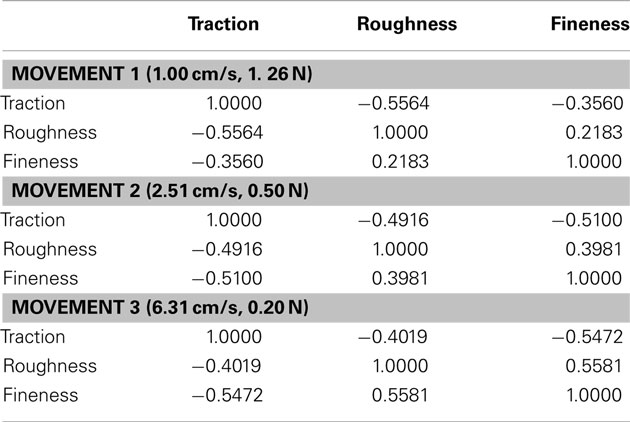
Table 3. Correlation matrix between each texture property at each of the three movements.
Texture Discrimination and Comparison with Human Performance
Analyzing the resulting confusion probability matrices of the large texture dataset yielded surprising findings in the confusion between textures. Many pairs of textures that were perceived as difficult to discriminate by touch were readily distinguishable based on at least one dimension of the three calculated texture properties, while some pairs of textures that appeared simple to discriminate by human touch were determined to be more challenging to the artificial system based on the observed confusion matrices (Figure 9). Eight pairs of textures (16 textures total) were selected for a study of discriminability, including pairs that were perceived to be similar to human observers but not the artificial system, the reverse, or similar to both. Care was taken to select texture pairs that did not have other properties that were readily discriminable by other non-textural mechanisms such as compliance or thermal properties, for which human subjects would have an obvious advantage (the BioTac does provide signals that can be used to estimate both properties (Lin et al., 2009; Su et al., 2012; but these were not used in this study).
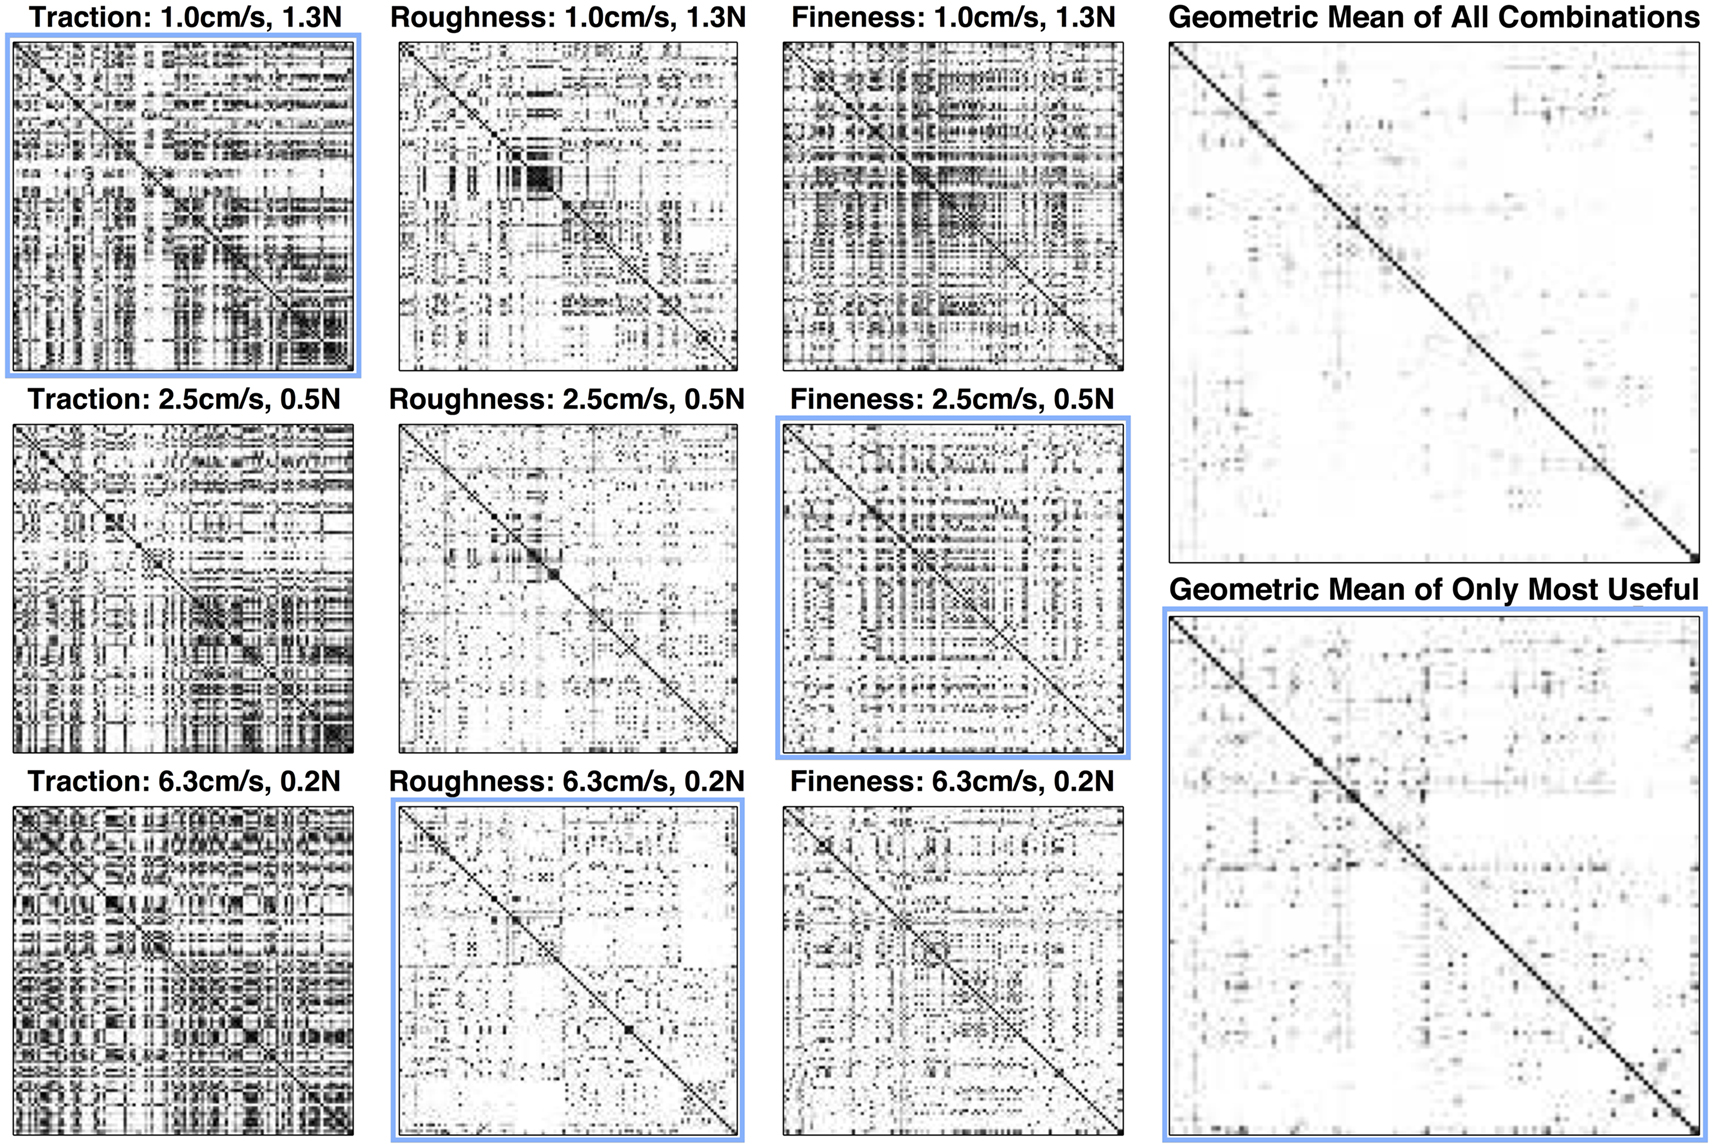
Figure 9. Confusion probability matrices for each combination of exploratory movement and texture property and geometric mean of all signals and only the most useful combinations of signals and movements. Spots are scaled from white to black to represent low to high confusion. Axes in each inset represent the texture indexes. The solid black line on each diagonal indicates the value of unity, as each texture has a 100% chance of being confused with itself at all movements. Blue outlines indicate the optimal movement for each signal. The geometric mean of all confusion probability matrices have very few off-diagonal dark spots, whereas geometric mean of only the most useful exploratory movements for each signal have substantially more dark spots indicating potential confusion between similar textures and the value of multiple movements for each signal. By taking advantage of all combinations of exploratory movements and properties, rather than just the properties at their “optimal” movements, we see an improvement of 60% in the geometric average of the confusion probability matrices and overall uncertainty.
Five human subjects consented to participate in a study to explore biological abilities to discriminate between similar textures. Prior to these experiments, subjects were informed that they would be presented with one of the eight pairs of textures at a time, which they could see and explore by sliding their fingers over them for as long as they desired in order to feel comfortable discriminating between the two textures in the pair. They were informed that after they were finished exploring, they would begin the testing phase and would not be allowed to explore both textures again. No additional guidance was provided on which properties or exploratory movements would be optimal for performing the discrimination task. They were also informed that when ready, they would have their vision occluded and be presented with a random selection of one of the two textures for four trials. Subjects were aware that the selection of the presented texture was predetermined from a random number generator (i.e., it would not always be each texture twice for the four trials, by chance it could even be the same texture four times). The experimenter suggested that the subjects could call these textures A or B, however all subjects preferred to refer to the textures based on their visual properties (i.e., “the blue one”). For the testing phase, which started immediately after the exploratory phase, a small platform was placed in front of the subject where textures were to be placed. The platform was short and unobtrusive, allowing subjects to assume the same posture used in the exploratory phase. The experimenter placed the randomized texture on this platform and the subject held his finger over the texture until an auditory command was given to start exploration. After making exploratory movements (which ranged from two or three to dozens of movements depending on the difficulty the subject was experiencing), subjects notified the experimenter which of the two textures they thought they were touching. This was repeated for four trials for each of the eight pairs of textures. While subjects were eager to know their performance, this was not disclosed to them until the completion of the experiment. Average performance across all five subjects for the eight texture pairs in terms of percentage of correct classifications (chance = 50%) is presented in Table 4.
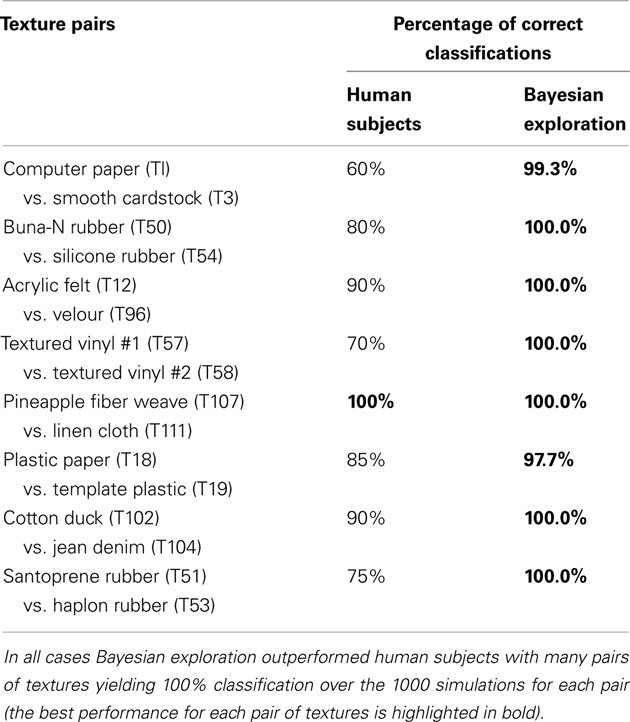
Table 4. Comparison of AB discrimination of similar texture pairs between human subjects and the Bayesian exploration classifier.
Comparison in performance of humans with the artificial system in this discrimination task requires two separate populations of data, one to represent the information obtained in the exploratory phase and the other to represent novel information being encountered in the identification phase. This is commonly referred to in machine classifier problems as a training set and a validation set. The training set consists of data to be used as the previous experience that the Bayesian exploration algorithm refers to when encountering an unknown texture in order to determine optimal exploratory movements and to compute posterior probabilities after these movements. The original set of data obtained in the previous section was used to create this training set. A second set of novel data was collected and used as a validation set for the same textures that were used in the human texture discrimination studies. Similar to the training set, five trials for each of the three exploratory movements were collected for these 16 textures.
The computational speed of computer processors made it attractive to analyze the performance of this artificial discrimination task offline in a virtual texture exploration. When performing a virtual exploratory movement, a randomly selected trial from the unseen validation set of the texture being explored was given to the classifier. Due to the high degree of randomness of these simulations, a total of 1000 simulations as described below for each of the eight pairs of textures were conducted to establish a more accurate measure of performance.
During a texture discrimination task for the artificial system, a pair of textures was selected and their prior probabilities were set equally to 50%. The probability for all other textures in the database was set to zero, effectively eliminating them from the classifier’s decision process. One of the two textures was selected at random as the unknown texture to be identified by the system. The Bayesian exploration algorithm used data in its previous experience (from the training set) to decide which exploratory movement and signal would discriminate optimally between them. The signal from this movement in the validation set was delivered to the classifier and the posterior probabilities of the two textures were updated using Bayesian inference. The process of performing optimal combinations of exploratory movements and properties to measure through Bayesian exploration was repeated until one of the two textures converged to a probability of greater than 99.9%3. Data from these discrimination tasks was not added to the database. Results comparing the performance of human subjects and the Bayesian exploration are presented as the percentage of correct identifications in Table 4.
Absolute Texture Identification
The new validation data from the 16 textures obtained in the previous section were also used against the entire set of 117 textures to evaluate the performance of absolute texture identification. The classifier was not aware of the 16 textures it was being presented and initially set the probabilities for all textures to the same value (1 divided by 117). The same process of Bayesian decision making to determine optimal pairs of exploratory movements and signals for virtual exploratory movements was followed as discussed in the previous section. The performance of this Bayesian exploration approach was compared with two alternative exploratory strategies. In the first, the most useful movements for each of these signals as determined in Section “Selection of Set of Exploratory Movements” were cycled; in the second, exploratory movement and signal combinations were randomly selected. A maximum of 10 exploratory movements were allowed and the classifier was run until any texture converged to greater than 99% probability or until the 10 exploratory movements were conducted. If not converged, the texture with the greatest probability after the 10 exploratory movements was determined to be the most likely candidate. A total of 8000 Monte Carlo simulations over the 16 textures were conducted and performance is presented as percentage of correct classifications (Table 5). Examples of the evolving probabilities of possible textures and the selected exploratory movements for some of these trials are shown in Figure 10.
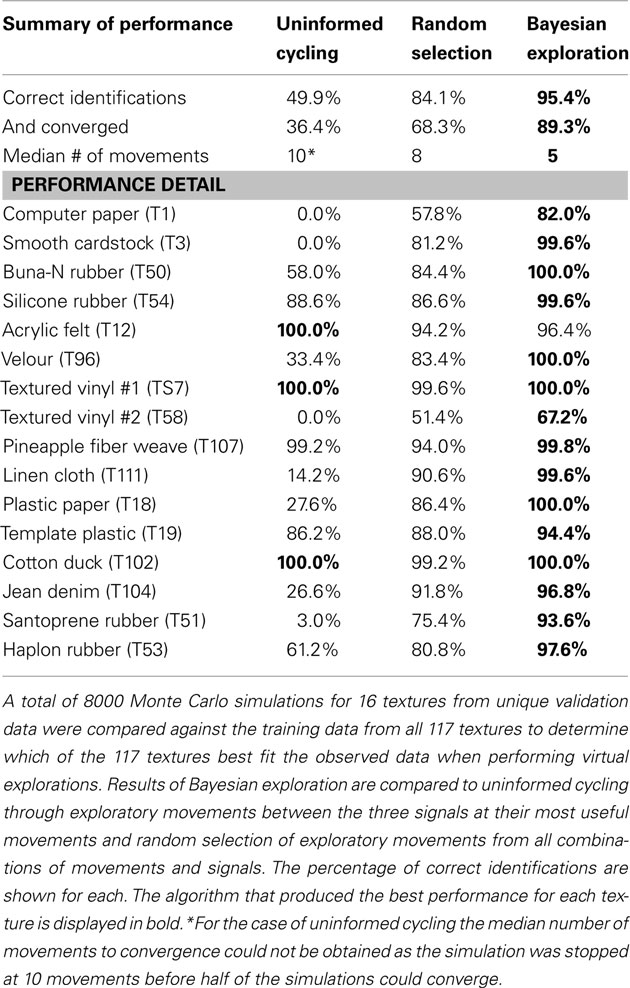
Table 5. Summary of performance for absolute classification task for uninformed cycling, random selection, and Bayesian Exploration.
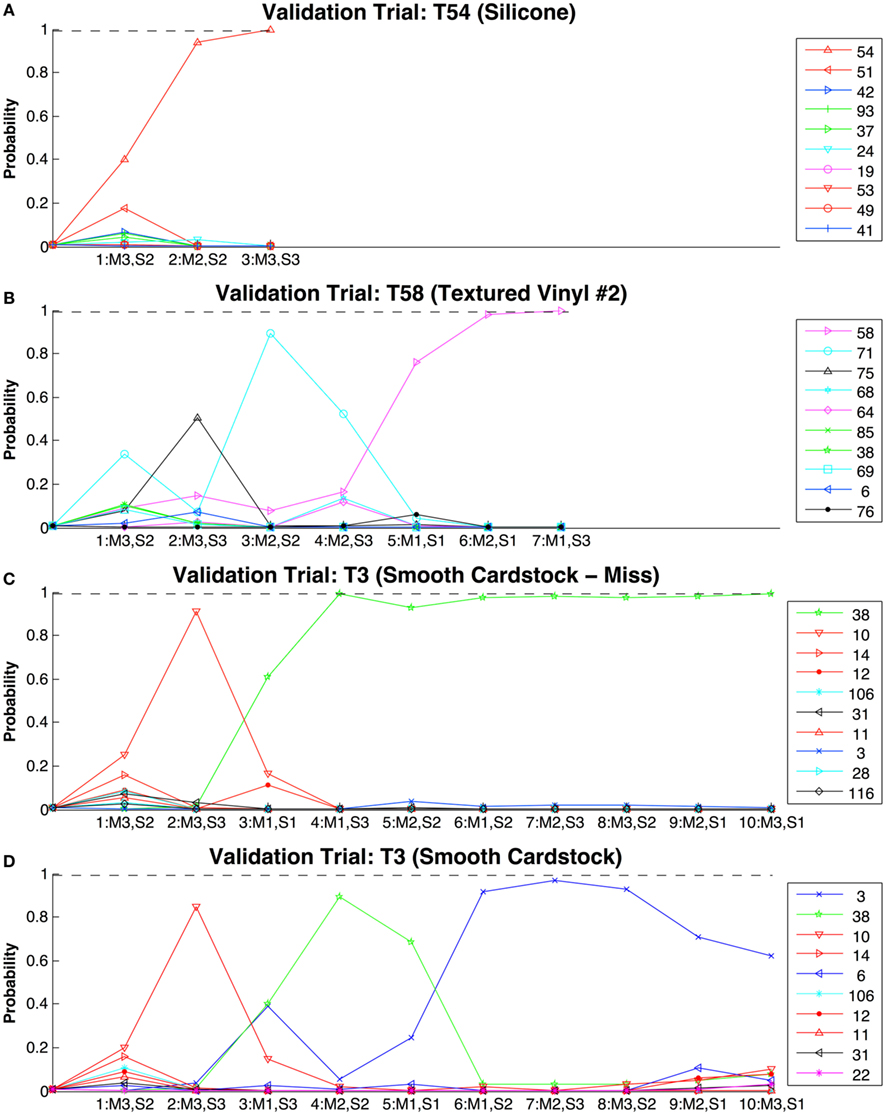
Figure 10. Evolution of estimated probabilities as virtual exploratory movements are made to identify textures from the entire training set of 117 textures. In each of these plots the steps along the x-axis represent discrete exploratory movements, and the y-axis represents the estimated probabilities of likely texture candidates. The movement and signal taken at each step are indicated below the tick marks [Movements (M): 1 = 1.26 N, 1 cm/s; 2 = 0.5 N, 2.5 cm/s; 3 = 0.2 N, 6.31 cm/s. Signals (S): 1 = Traction, 2 = Roughness, 3 = Fineness]. The color-coded key for probability traces shows the numbers of the textures being classified in the validation trial. Dashed line represents the 99% confidence required to end the simulation before all 10 movements are made. In (A) texture 54 (Silicone) was rapidly identified, as was the case for many of the simulations. In (B) texture 58 (Textured Vinyl #2) was eventually identified after a few initially more probable candidates were ruled out. In (C) texture three (smooth cardstock) is shown being misidentified as balsa wood (T38) and in (D) correctly identified, although with only 60% confidence at the end of the simulation. In both cases no texture reached a confidence of above 99% to stop the simulation so it ran for the complete 10 trials.
Results
Analysis of Descriptive Texture Properties
In the pilot study of 10 textures, descriptive properties were found to reflect expected values. For instance, graphite produced the lowest measure for traction between the surface and the skin of the BioTac while polished aluminum and rubber had the highest. Foam, satin, rayon, and burlap produced the highest measures of roughness, while polished aluminum produced the lowest measure of roughness. In calculating the spectral centroid, the finer textures such as graphite and satin produced higher values while the coarser textures such as burlap and velcro produced lower values. Featureless textures such as polished aluminum and rubber tended to produce low spectral centroids as well due to their 1/f noise as discussed in (Wiertlewski et al., 2011). The exploratory movements that produced the most discriminability within the 10-texture dataset as calculated by the minimal uncertainty are presented in Figure 5.
A notable finding of these trials was that the spectral centroid did not scale with sliding velocity for all textures (Figure 6). Such scaling was observed only for certain coarse textures that were also rough (Velcro hooks, foam, rayon, burlap). This constitutes additional evidence that fingerprints do not simply convert sliding velocity and spatial frequency into temporal signals as concluded by (Scheibert et al., 2009).
Identifying the Most Useful Exploratory Movements
The most useful movement for each property was selected from the set of 36 movements (Figure 7). It was observed that combinations of high-power exploratory movements (high force and high velocity) resulted in a high rate of fingerprint wear on the BioTac’s skin. These high wear movements (gray boxes with white text in Figure 7) were eliminated, although some appeared to be useful for discrimination (e.g., 6.31 cm/s and 1.26 N for discriminating roughness). As a general trend, it was observed that the ability to discriminate traction improved at lower velocities and higher forces, while the ability to discriminate roughness improved at higher velocities and lower forces. These findings supported our own intuition on the exploratory movements humans make to extract these properties. We propose that when humans make a movement to determine surface traction, they tend to use a high amount of force while slowly moving their finger. Presumably this is to maximize the amount of shear force sensed in the finger; it is easier to control these forces by moving slowly. Similarly in our experimental testbed, sliding at slower velocities produced more stable sliding forces as measured by the motor current; this resulted in more consistent measurements between multiple trials. To discriminate roughness, we have observed that humans tend to use very light forces while sliding over the surfaces of textures to feel their vibrations. Our observations with the BioTac have demonstrated a possible utility of this strategy. In general, faster velocities tend to produce higher amplitude vibration signals, while greater forces tend to dampen vibrations sensed by the BioTac. The findings of these two exploratory movements as the most useful for these properties in our artificial system provide additional support to these hypotheses about biological exploratory movements for perception of traction and roughness.
While a certain movement may be classified as generally “useful” for a given property, other movements may actually be more useful for discriminating a given pair of materials along this property. Because all properties are collected with each movement, the classification algorithm takes advantage of all nine combinations of available movements and material properties during its decision process of determining the optimal movement and signal to sense.
Training Dataset
The measured properties of the 117 textures were individually tightly clustered for repeated measures but spanned most of the three dimensional property space, an ideal situation for an efficient classifier. The complete set of measured properties for each signal at the most useful movement for that property is shown in Figure 8. In many cases, textures that had similar values for one property tended to be dissimilar along other dimensions, suggesting the utility of well-chosen next exploratory movements.
A graphical representation of confusion probability matrices was generated for each combination of movements and properties (Figure 9). The geometric mean (calculated by multiplying confusion probability matrices and taking the nth root of the result) for all of these movements and properties provides additional insight into which pairs of textures have the most confusion across all exploratory movements and properties. Results indicate that most textures are readily distinguishable with a few exceptions. When the confusion probability matrices are combined for only the optimal movements, there are considerably more off-diagonal dark spots representing textures that are likely to be confused. The identification algorithm chooses the combination of movement and signal type that will be most likely to discriminate among the most probable alternatives at any given point in the identification process.
Correlation between calculated texture properties were analyzed for all 117 textures for each movement and the average values for each movement are provided (Table 3).
An interesting finding was a strong negative correlation between roughness and traction. This can be observed in materials such as rubber and glass, which generally have smooth surfaces, yet produce a high amount of friction against the silicone skin of the BioTac. This contradicts (Smith et al., 2002a), who reported a strong positive correlation between friction and roughness for human fingertips, but did not include such a diverse set of materials.
Texture Discrimination and Comparison with Human Performance
Results of the performance for discriminating between two textures for both humans and our artificial algorithm are provided in Table 4. The performance of the classifier exceeded human performance for all pairs. The average performance of human subjects across all of the texture pairs was found to be 81.3% while the average performance of our classifier was found to be 99.6%. This result was quite unexpected, as human capabilities have previously been thought of as the “gold standard.” Our results in this study demonstrate that our artificial exploratory algorithm can surpass this capability even when the methods were designed to mimic the strategies that humans employ (but see Discussion).
Absolute Texture Classification
The texture classification algorithm was validated by using it to identify the best match from the 117 textures in the database by selecting the most efficient sequence of exploratory movements from a novel set of data. Figure 10 shows a few examples of these simulations, which exhibit a wide range of sequences of exploratory movements and properties, depending on the actual texture being classified and those in the data set with which it might be most easily confused. In all cases the first movement is 0.2 N and 6.31 cm/s to determine texture roughness. This is due to all textures starting with equal probability (1 divided by 117). In this scenario, data from the training set has indicated that this first movement will produce the largest benefit. After information from this first movement is collected, each simulation went through a set of exploratory movements that was optimal for discriminating among the most likely candidates for the particular simulation. This was found to be unique for each texture and even different between simulations of the same texture due to the random presentation of various trials from the validation dataset.
In this study we compared the Bayesian exploration algorithm with alternative algorithms such as cycling through the most useful movements for each signal and randomly selecting combinations of exploratory movements and signals to measure. A summary of performance for the 8000 Monte Carlo simulations of the 16 textures tested is provided (Table 5). Our Bayesian exploration algorithm was found to be superior in both classification accuracy and number of exploratory movements required to converge to 99% confidence. Furthermore the Bayesian exploration strategy was more likely to converge on the correct texture before reaching the maximum of 10 movements. Of the 16 textures explored for global classification among the set of 117 textures in these simulations, Bayesian exploration outperformed uninformed cycling and random selection for all but one of these textures.
Discussion
Summary of Findings
Previous investigations into the psychophysics of textures and their classification from sensory data have looked at a fairly narrow range of coarse textures and exploratory movements. This has resulted in simplistic classifiers based on one or two dimensions of the sensory information that tend to break down when extrapolated beyond their original data. Such circumscription makes study design more tractable but it may foreclose opportunities inherent in considering the larger problem. The large set of textures and large range of movements explored in this study forced us to develop systematic and scalable methods for dealing with a problem whose scale is more similar to that faced by the human nervous system. These methods extend conventional Bayesian decision making to encompass optimal strategies for acquiring the data for such optimal decision making, suggesting the term Bayesian exploration.
For this study we have found the method of Bayesian exploration to be far superior to other methods previously used for discriminating textures: de Boissieu et al. (2009) were able to demonstrate discrimination among 10 different textures with 62% performance classification; Giguere and Dudek (2011) were able to obtain a classification performance of 89.9–94.6% with 10 surfaces; Oddo et al. (2011) demonstrated a classification performance of 97.6% classification across three fine gratings; Jamali and Sammut (2011) demonstrated 95% classification across eight textures; Sinapov et al. (2011) demonstrated a classification performance of 95% across 20 different textures when using multiple exploratory movements. Bayesian exploration yielded a performance of 99.7% when choosing between two difficult textures, surpassing even human capabilities, and 95.4% when choosing from a database of 117 textures. Normally classification accuracy would be expected to decline as the number of possible textures increased.
A guiding principle throughout this study was biomimicry. We used a tactile sensor that shares many mechanical features with the human fingertip and we slid it over textured surfaces with exploratory movements similar to those that humans make when exploring textures. The exploratory movements and properties to measure were also inspired by observations of human behavior and descriptive language humans use to describe textures. The Bayesian exploration algorithm intelligently selects the optimal exploratory movements to make based on current knowledge of what the texture may be and prior experience of which movement would best discriminate the likely possibilities, a method also inspired by theories of biological behavior (Loeb et al., 2011). Gratifyingly, we were able to obtain performance in discriminating texture that surpassed human capabilities for both accuracy and speed of classification.
The use of descriptive properties inspired by human language was probably important. The human brain is an outstanding classifier, so naturally one would expect it understands what makes textures different. Therefore, the language that humans use to describe textures are inherently low-hanging fruit for inspiring analytical measures of texture properties. In this study we implemented relatively simple algorithms for estimating these signal properties (motor current to estimate sliding force, vibration power to estimate roughness, vibration frequency to estimate coarseness). The performance of our classifier, even using this simplified set of inputs, far exceeded our expectations for such a large database of textures. This approach of language-guided signals may be useful for other artificial discrimination tasks.
There are, of course, substantial differences between our machine and a human hand or even other robotic systems. On the plus side, the human fingertip has a much richer set of sensors than the BioTac, which has a similar dynamic range but lacks the spatial resolution of the dynamic Meissner’s receptors in the individual fingerprint ridges (Jones and Lederman, 2006). On the minus side, the movements of the human hand are subject to considerably more motor noise than our electrical motors (Jones et al., 2002; Jones and Lederman, 2006). Apparently these two differences tended to cancel each other in terms of overall performance. This may be a general property of the Bayesian strategy for selection of exploratory movements and interpretation of the resulting sensory data. Noise affecting either the movements or the sensory transduction is represented automatically in the database and biases the process away from choices that provide less useful information for any reason. Extending this algorithm to a complete robotic system working in unstructured environments is expected to degrade the quality of measured signals, which was enhanced by the careful design of a custom-built experimental apparatus. In particular, the actuators in humanoid robots are likely to be considerably noisier than our apparatus, introducing both variability into the exploratory movements and noise into the sensor signals. Additional training to better understand the characteristics of noise and variability is one way to compensate for this. We expect the Bayesian exploration method to be robust to this and evolve to make the most of available information.
Considerations for Improving the Classifier
The results presented in this study implement what is known in machine learning as supervised learning. A set of textures and their properties to measure were given to the classifier and it was told that the textures were unique and therefore belonged to separate classes. In the real world, the existence of discrete entities must be inferred in the first place from the clustering of data points that may arise from the existence of multiple discrete entities, continuous gradations of material properties, or simply noise in the measurement system. Any novel sensory experience might be taken to be a distorted sampling of a previously known entity or a first example of a new entity. Such situations can be accommodated by extending the classification algorithm to continuously refine its experience for known textures as well as to identify when new textures are encountered and a new entity needs to be added to the database. One method to do this would be to calculate the Bhattacharya coefficient between the object currently being explored and the existing database of objects. If the newly observed data are not similar enough to known textures, a new class could be created. In addition to the distributions of the tactile data themselves, the classifier may be able to use other information such as the visual appearance (used by our subjects when first comparing the two similar textures in the discrimination task) or the probability that an entity could have changed or been replaced from one exploration to the next.
In our system, the internal representation of a texture’s properties consists only of a mean value and a standard deviation for each property and each movement that can be made. After successfully identifying a texture, the system would benefit from adding these new data to its library so future encounters with the same texture will be identified more efficiently. Furthermore, as more explorations are made, the true probability density function could be identified, which may in fact deviate from the initially assumed normal distributions. This would serve to improve classifier performance. Adding these results to the system would also increase the amount of training data it has available, eventually enabling multivariate analysis as opposed to the univariate methods used in this study to avoid the curse of dimensionality (Jain et al., 2000). Updating the mean and standard deviation with the new data can accomplish this, but it is not trivial. If all observations are assumed to be equally valid regardless of when they occurred, then updating requires knowledge also of the previous number of experiences with that entity. If a new entity is created, it is possible, even likely, that a substantial number of the previous observations have been misclassified. Creating two new means and standard deviations from one previously learned distribution may not be feasible, in which case the algorithm will need to “forget” much of the old data and explore the two new entities intensively to create new internal representations.
Collecting data sufficient for multivariate analysis was impractical for the large number of textures employed in these experiments, but something like it may be feasible over the life of an organism or robotic system learning progressively about its world. We propose that a strategy of initially focusing only on salient properties for novice systems with little experience is preferable. As more experience is obtained, however, such systems could benefit from the efficiency of multivariate analysis.
Considerations for identifying objects by all available sensory modalities
The strategies used in this study could be generally applied to a more diverse class of problems involving object identification. As discussed in the introduction, texture discrimination is only a small subset of tools that humans employ when discriminating objects by touch, others include: compliance, thermal properties, shape, volume, and weight. The development of biologically inspired exploratory movements and signal measures for these properties would enhance the capabilities and performance of the system. Furthermore, these must be integrated with other exteroceptive modalities such as vision, sound, and smell. Iterative decisions must be made about other exploratory movements of the fingers, the eyes (e.g., saccadic gaze shifts), and other attentive mechanisms. Anthropomorphic robots provide both the need and the ability to implement biomimetic strategies for coping with such high dimensional data. In doing so, they may provide insights into those strategies that are difficult to obtain from studying biological systems alone.
Conflict of Interest Statement
Both authors are equity partners in SynTouch, LLC, which manufactures and sells the BioTac sensors described in this article.
Acknowledgments
The authors would like to thank Raymond Peck for fabrication of the BioTac sensors and apparatus used in these tests and Michelle Willie and Lee Ann Lumilan for preparation of the texture samples. The authors would also like to thank the entire team at the Medical Device Development Facility at the University of Southern California and at SynTouch LLC, particularly Gary Lin, Matthew Borzage, Nicholas Wettels, David Groves, and Tomonori Yamamoto for their advice and assistance on this project. This research was supported by the Department of Defense Advanced Research Projects Agency contract D11PC20121.
Supplementary Material
The Movies S1 and S2 for this article can be found online at http://www.frontiersin.org/Neurorobotics/10.3389/fnbot.2012.00004/abstract
Footnotes
- ^Other methods may use cost functions to reduce the occurrence of Type-I or Type-II errors for particular classes where such errors are detrimental.
- ^The descriptive word sticky is also used to describe adhesive properties. However, even in this context it still refers to resistance to movement, albeit away from the surface.
- ^The 99.9% convergence criterion for texture pairs was higher than the 99% used in the absolute classification task as discussed in the following section. It was found that when discriminating between a smaller number of textures (i.e., two as used in this experiment) the algorithm would quickly converge in only one or two movements and frequently to a wrong decision if the required probability threshold was not set to a high enough value. By increasing the required probability to a higher level, additional exploratory movements would be required, resulting in better overall classification performance. At this level most solutions converged to the correct values with a median of three exploratory movements with satisfactory results.
References
Bensmaïa, S., and Hollins, M. (2005). Pacinian representations of fine surface texture. Percept. Psychophys. 67, 842–854.
Bergmann Tiest, W. M., and Kappers, A. M. L. (2006). Analysis of haptic perception of materials by multidimensional scaling and physical measurements of roughness and compressibility. Acta Psychol. (Amst.) 121, 1–20.
Brisben, A. J., Hsiao, S. S., and Johnson, K. O. (1999). Detection of vibration transmitted through an object grasped in the hand. J. Neurophysiol. 81, 1548–1558.
Dahiya, R. S., Metta, G., Valle, M., and Sandini, G. (2010). Tactile sensing – from humans to humanoids. IEEE Trans. Robot. 26, 1–20.
de Boissieu, F., Godin, C., Guilhamat, B., David, D., Serviere, C., and Baudois, D. (2009). “Tactile texture recognition with a 3-axial force MEMS integrated artificial finger,” in Proceedings of Robotics: Science and Systems, Seattle, 49–56.
Edwards, J., Lawry, J., Rossiter, J., and Melhuish, C. (2008). Extracting textural features from tactile sensors. Bioinspir. Biomim. 3, 1–12.
Fishel, J. A., and Loeb, G. E. (2012). “Sensing tactile microvibrations with the BioTac – comparison with human sensitivity,” in IEEE/RAS-EMBS International Conference on Biomedical Robotics and Biomechatronics, Rome.
Fishel, J. A., Santos, V. J., and Loeb, G. E. (2008). “A robust micro-vibration sensor for biomimetic fingertips,” in IEEE/RAS-EMBS International Conference on Biomedical Robotics and Biomechatronics, Scottsdale, 659–663.
Giguere, P., and Dudek, G. (2011). A simple tactile probe for surface identification by mobile robots. IEEE Trans. Robot. 27, 534–544.
Hollins, M., Bensmaïa, S., and Washburn, S. (2001). Vibrotactile adaptation impairs discrimination of fine, but not coarse, textures. Somatosens. Mot. Res. 18, 253–262.
Hollins, M., Faldowski, R., Rao, S., and Young, F. (1993). Perceptual dimensions of tactile surface texture: a multidimensional scaling analysis. Percept. Psychophys. 54, 697–705.
Hollins, M., and Risner, S. R. (2000). Evidence for the duplex theory of tactile texture perception. Percept. Psychophys. 62, 695–705.
Hosoda, K., Tada, Y., and Asada, M. (2006). Anthropomorphic robotic soft fingertip with randomly distributed receptors. Robot. Auton. Syst. 52, 104–109.
Howe, R. D., and Cutkosky, M. R. (1989). “Sensing skin acceleration for slip and texture perception,” in IEEE International Conference on Robotics and Automation, Scottsdale, 145–150.
Howe, R. D., and Cutkosky, M. R. (1993). Dynamic tactile sensing: perception of fine surface features with stress rate sensing. IEEE Trans. Rob. Autom. 9, 140–151.
Jain, A. K., Duin, R. P. W., and Mao, J. (2000). Statistical pattern recognition: a review. IEEE Trans. Pattern Anal. Mach. Intell. 22, 4–37.
Jamali, N., and Sammut, C. (2011). Majority voting: material classification by tactile sensing using surface texture. IEEE Trans. Robot. 27, 508–521.
Johansson, R. S., Landström, U., and Lundström, R. (1982). Responses of mechanoreceptive afferent units in the glabrous skin of the human hand to sinusoidal skin displacements. Brain Res. 244, 17–25.
Jones, K. E., Hamilton, A. F., and Wolpert, D. M. (2002). Sources of signal-dependent noise during isometric force production. J. Neurophysiol. 88, 1533–1544.
Knibestöl, M., and Vallbo, A. B. (1970). Single unit analysis of mechanoreceptor activity from the human glabrous skin. Acta Physiol. Scand. 80, 178–195.
Lederman, S. J., and Klatzky, R. L. (1987). Hand movements: a window into haptic object recognition. Cogn. Psychol. 19, 342–368.
Lederman, S. J., Loomis, J. M., and Williams, D. A. (1982). The role of vibration in the tactual perception of roughness. Percept. Psychophys. 32, 109–116.
Lee, M. H., and Nicholls, H. R. (1999). Tactile sensing for mechatronics – a state of the art survey. Mechatronics 9, 1–31.
Lin, C. H., Erickson, T. W., Fishel, J. A., Wettels, N., and Loeb, G. E. (2009). “Signal processing and fabrication of a biomimetic tactile sensor array with thermal, force and microvibration modalities,” in IEEE International Conference on Robotics and Biomimetics, Guilin, 129–134.
Loeb, G. E., and Fishel, J. A. (2009). The Role of Fingerprints in Vibrotactile Discrimination. Whitepaper for DoD Physics of Biology, University of Southern California.
Loeb, G. E., Tsianos, G. A., Fishel, J. A., Wettels, N., and Schaal, S. (2011). Understanding haptics by evolving mechatronic systems. Prog. Brain Res. 192, 129–144.
Mountcastle, V. B., LaMotte, R. H., and Carli, G. (1972). Detection thresholds for stimuli in humans and monkeys: comparison with threshold events in mechanoreceptive afferent nerve fibers innervating the monkey hand. J. Neurophysiol. 35, 122–136.
Mukaibo, Y., Shirado, H., Konyo, M., and Maeno, T. (2005). “Development of a texture sensor emulating the tissue structure and perceptual mechanism of human fingers,” in IEEE International Conference on Robotics and Automation, Barcelona, 2565–2570.
Nicholls, H. R., and Lee, M. H. (1989). A survey of robot tactile sensing technology. Int. J. Rob. Res. 8, 3–30.
Oddo, C. M., Beccai, L., Felder, M., Giovacchini, F., and Carrozza, M. C. (2009). Artificial roughness encoding with a bio-inspired MEMS-based tactile sensor array. Sensors 9, 3161–3183.
Oddo, C. M., Controzzi, M., Beccai, L., Cipriani, C., and Carrozza, M. C. (2011). Roughness encoding for discrimination of surfaces in artificial active-touch. IEEE Trans. Robot. 27, 522–533.
Rebguns, A., Ford, D., and Fasel, I. (2011). “InfoMax control for acoustic exploration of objects by a mobile robot,” in AAAI Conference on Artificial Intelligence, San Francisco, 22–28.
Romano, J. M., and Kuchenbecker, K. J. (2011). Creating realistic virtual textures from contact acceleration data. IEEE Trans. Haptics.
Scheibert, J., Leurent, S., Prevost, A., and Debregeas, G. (2009). The role of fingerprints in the coding of tactile information probed with a biomimetic sensor. Science 323, 1503–1506.
Sinapov, J., and Stoytchev, A. (2010). “The boosting effect of exploratory behaviors,” in AAAI Conference on Artificial Intelligence, Atlanta, 1613–1618.
Sinapov, J., Sukhoy, V., Sahai, R., and Stoytchev, A. (2011). Vibrotactile recognition and categorization of surfaces by a humanoid robot. IEEE Trans. Robot. 27, 488–497.
Smith, A. M., Chapman, C. E., Deslandes, M., Langlais, J., and Thibodeau, M. (2002a). Role of friction and tangential force variation in the subjective scaling of tactile roughness. Exp. Brain Res. 114, 211–223.
Smith, A. M., Gosselin, G., and Houde, B. (2002b). Deployment of fingertip forces in tactile exploration. Exp. Brain Res. 147, 209–218.
Su, Z., Fishel, J. A., Yamamoto, T., and Loeb, G. E. (2012). Use of tactile feedback to control exploratory movements to characterize object compliance. Front. Neurorobotics.
Tada, Y., Hosoda, K., and Asada, M. (2004). “Sensing ability of anthropomorphic fingertip with multi-modal sensors,” in IEEE International Conference on Intelligent Robots and Systems, Seattle, 1005–1012.
Tada, Y., Hosoda, K., Yamasaki, Y., and Asada, M. (2003). “Sensing the texture of surfaces by anthropomorphic soft fingertips with multi-modal sensors,” in IEEE International Conference on Intelligent Robots and Systems, Las Vegas, 31–35.
Wettels, N., and Loeb, G. E. (2011). “Haptic feature extraction from a biomimetic tactile sensor: force, contact location and curvature,” in IEEE International Conference on Robotics and Biomimetics, Phuket.
Keywords: texture discrimination, tactile sensor, vibration, fingerprints, exploratory movements, roughness, classification, Bayesian exploration
Citation: Fishel JA and Loeb GE (2012) Bayesian exploration for intelligent identification of textures. Front. Neurorobot. 6:4. doi: 10.3389/fnbot.2012.00004
Received: 20 March 2012; Paper pending published: 10 April 2012;
Accepted: 23 May 2012; Published online: 18 June 2012.
Edited by:
Blythe Towal, California Institute of Technology, USAReviewed by:
Juan Pablo Carbajal, University of Zürich, SwitzerlandMichael Wiertlewski, Université Pierre et Marie Curie, France
Jivko Sinapov, Iowa State University, USA
Copyright: © 2012 Fishel and Loeb. This is an open-access article distributed under the terms of the Creative Commons Attribution Non Commercial License, which permits non-commercial use, distribution, and reproduction in other forums, provided the original authors and source are credited.
*Correspondence: Jeremy A. Fishel, Department of Biomedical Engineering, University of Southern California, 1042 Downey Way, Denny Research Center (DRB 140), Los Angeles, CA 90089-1111, USA. e-mail: jeremy.fishel@syntouchllc.com