Unité de Neurosciences, Infomation et Complexité, Centre National de la Recherche Scientifique, Gif-sur-Yvette, France
Cortical neurons in vivo may operate in high-conductance states, in which the major part of the neuron’s input conductance is due to synaptic activity, sometimes several-fold larger than the resting conductance. We examine here the contribution of inhibition in such high-conductance states. At the level of the absolute conductance values, several studies have shown that cortical neurons in vivo are characterized by strong inhibitory conductances. However, conductances are balanced and spiking activity is mostly determined by fluctuations, but not much is known about excitatory and inhibitory contributions to these fluctuations. Models and dynamic-clamp experiments show that, during high-conductance states, spikes are mainly determined by fluctuations of inhibition, or by inhibitory “noise”. This stands in contrast to low-conductance states, in which excitatory conductances determine spiking activity. To determine these contributions from experimental data, maximum likelihood methods can be designed and applied to intracellular recordings in vivo. Such methods indicate that action potentials are indeed mostly correlated with inhibitory fluctuations in awake animals. These results argue for a determinant role for inhibitory fluctuations in evoking spikes, and do not support feed-forward modes of processing, for which opposite patterns are predicted.
In awake and aroused animals, the cerebral cortex displays low-amplitude and fast electroencephalogram (EEG) activity, which is usually referred to as “desynchronized EEG states” or “activated states”. In such states, it was shown that cortical neurons are characterized by very irregular and asynchronous firing activity, which contrasts with the synchronized and slow oscillatory activities seen during slow-wave sleep (Hubel, 1959
; Evarts, 1964
; Steriade et al., 1974
; Destexhe et al., 1999
). Because it is during this regime that the main computational tasks are performed, understanding this type of stochastic network state is crucial (Destexhe and Contreras, 2006
).
Intracellular measurements in awake animals (Woody and Gruen, 1978
; Matsumura et al., 1988
; Baranyi et al., 1993
; Steriade et al., 2001
; Timofeev et al., 2001
; Rudolph et al., 2007
) have shown that cortical neurons are depolarized (about −60 mV), have a low input resistance and their membrane potential (Vm) is subject to intense fluctuations. These properties were collectively defined as “high-conductance state” (reviewed in Destexhe et al., 2003
; Destexhe, 2007
), due to the fact that the total membrane conductance is several-fold larger than the resting membrane conductance. High-conductance states are important, because they have a very significant impact on several fundamental integrative properties of neurons, such as the summation of inputs, the temporal precision of the integration, the cell excitability and the global “transfer function” of the neuron (Wolfart et al., 2005
; reviewed in Destexhe et al., 2003
; Destexhe, 2007
).
Various studies in behaving or anesthetized animals have demonstrated the presence of high conductances during either spontaneous activity (Paré et al., 1998
; Rudolph et al., 2005
, 2007
) or responses to sensory inputs (Borg-Graham et al., 1998
; Anderson et al., 2000
; Monier et al., 2003
; Wehr and Zador, 2003
; Wilent and Contreras, 2005
). Such conductances are usually decomposed from current–voltage relations, into excitatory and inhibitory components, and it was shown that the temporal interplay of excitation and inhibition is determinant to explain the responses of cortical neurons to sensory inputs as well as their selectivity to features such as orientation or direction (Monier et al., 2003
; Wehr and Zador, 2003
; Wilent and Contreras, 2005
).
In parallel to these investigations, it was also shown that the desynchronized and irregular activity of cortical networks is characterized by a balance of excitation and inhibition. In such “balanced states”, it is not the absolute conductances that determine the spiking activity, but it is the fluctuations of these conductances (van Vreeswijk and Sompolinsky, 1996
; Brunel, 2000
). In such fluctuations-driven states, it is thus important to characterize the fluctuations of excitation and inhibition rather than their absolute (or mean) values. Unfortunately, this aspect remains under- characterized in part because of the lack of appropriate methods to characterize conductance fluctuations.
In the present paper, we focus on the measurement and consequences of conductance fluctuations, and in particular for inhibition. We first review techniques to measure conductance fluctuations and the values measured from intracellular recordings in vivo. Next, using models and dynamic-clamp experiments, we show that fluctuations of inhibition can be particularly impactful on evoking spikes. We finish by providing evidence that, indeed, this “inhibitory noise” is determinant in awake animals.
In contrast to the measurement of mean conductances, for which several methods are possible and were used to measure conductances from experimental data (see Introduction for overview), few methods are available to estimate the conductance fluctuations. Such information can be obtained from the trial-to-trial variability of sensory responses (see Monier et al., 2008
for a discussion), or using direct methods as we review here. A direct method was proposed to estimate the conductance fluctuations from the fluctuations of the Vm activity. This “VmD method” (Rudolph et al., 2004
) consists of measuring the Vm distributions from experiments and fitting these measurements to an analytic expression obtained by a theoretical study in which the Vm is described by stochastic processes (Rudolph and Destexhe, 2003
, 2005
). Several theoretical studies have focused on the subthreshold Vm fluctuations of a neuron subject to fluctuating conductances ge and gi (for excitation and inhibition, respectively). Different analytic approximations have been proposed to describe the steady-state distribution of these Vm fluctuations (Rudolph and Destexhe, 2003
, 2005
; Richardson, 2004
; Lindner and Longtin, 2006
; for a comparative study, see Rudolph and Destexhe, 2006
). One of these expressions is invertible (Rudolph and Destexhe, 2003
, 2005
), which enables one to directly estimate the parameters (ge0, gi0, σe, σi) from experimentally calculated Vm distributions. This constitutes the basis of the VmD method (Rudolph et al., 2004
).
One main assumption behind this method is that the conductances variations are Gaussian-distributed, and thus this distribution can be described by the mean (ge0, gi0) and the standard deviations (σe, σi) for each conductance. Assuming that the Vm fluctuations are also Gaussian-distributed,
where  is the average Vm and σV its standard deviation. This expression provides an excellent approximation of the Vm distributions obtained from models and experiments (Rudolph et al., 2004
), because the Vm distributions obtained experimentally show little asymmetry (for up-states and activated states; for specific examples, see Rudolph et al., 2004
, 2005
, 2007
).
is the average Vm and σV its standard deviation. This expression provides an excellent approximation of the Vm distributions obtained from models and experiments (Rudolph et al., 2004
), because the Vm distributions obtained experimentally show little asymmetry (for up-states and activated states; for specific examples, see Rudolph et al., 2004
, 2005
, 2007
).One main advantage of this Gaussian approximation is that it can be inverted, which leads to expressions of the synaptic noise parameters as a function of the Vm measurements, and σV. To extract the four parameters, means (ge0, gi0) and standard deviations (σe, σi), from the Vm requires to measure two Vm distributions obtained at two different constant levels of injected current. In this case, the Gaussian expression (Eq. 1) of the two distributions gives two mean Vm values,  and
and  , and two standard deviation values, σV1 and σV2. The system can be solved for four unknowns, leading to expressions of ge0, gi0, σe, σi from the values of
  ,
,  , σV1 and σV2 (for details, see Rudolph et al., 2004
).
, σV1 and σV2 (for details, see Rudolph et al., 2004
).
and σV. To extract the four parameters, means (ge0, gi0) and standard deviations (σe, σi), from the Vm requires to measure two Vm distributions obtained at two different constant levels of injected current. In this case, the Gaussian expression (Eq. 1) of the two distributions gives two mean Vm values, and , and two standard deviation values, σV1 and σV2. The system can be solved for four unknowns, leading to expressions of ge0, gi0, σe, σi from the values of , , σV1 and σV2 (for details, see Rudolph et al., 2004
).This method was tested using controlled conductance injection in neurons using the dynamic-clamp technique, and was shown to provide excellent estimates of the excitatory and inhibitory conductances and their associated variances (Rudolph et al., 2004
). It was also applied to intracellular recordings in vivo during anesthetized states (Rudolph et al., 2005
) and in awake animals (Rudolph et al., 2007
), as reviewed here.
In a first study, recordings were performed in cat association cortex under ketamine-xylazine anesthesia, during the slow oscillation typical of this anesthetic and resembling slow-wave-sleep, as well as during prolonged periods of activity, triggered by brain stem (PPT) stimulation, and with activity similar to that of the aroused brain. The VmD method was used to extract synaptic conductance parameters underlying the Vm fluctuations of the up-states of the slow oscillation, as well as those underlying the activated state following PPT stimulation. In both cases, the average estimated inhibitory conductance gi0 was markedly higher than the average estimated excitatory conductance ge0, and similarly the estimated variance of inhibition  was higher than the variance of excitation
  .
.
was higher than the variance of excitation .In a second study, similar results were obtained across the natural wake-sleep cycle of the cat (Figure 1
): for a majority of cells, especially during slow-wave-sleep up-states, inhibition dominated in terms of both mean and variance. At the population level, the ratio of inhibition to excitation was higher during slow-wave-sleep up-states compared to the wake state. In three neurons that were recorded across several states, both average conductances together with their variances decreased in the wake state compared to slow-wave-sleep up-states. In addition, especially during the wake state, some cells displayed comparable excitation and inhibition or even a dominant excitation (2 out of 11 cells in the wake state). This study also reported an important diversity in the absolute values of the estimated conductance parameters.
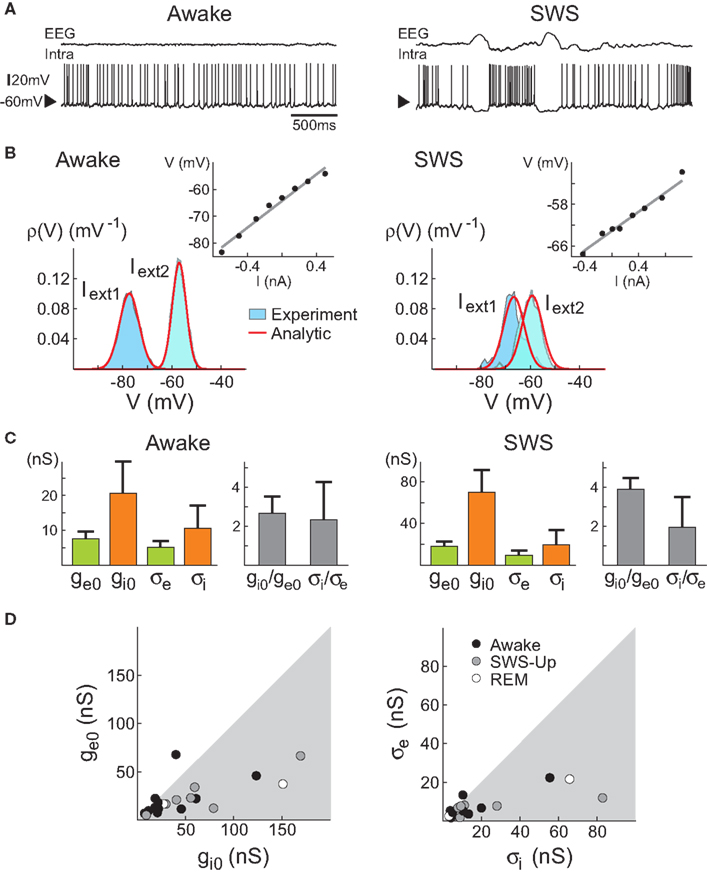
Figure 1. VmD estimation of conductances from intracellular recordings in awake and naturally sleeping cats. (A) Intracellular recordings in awake and naturally sleeping (SWS) cats. Recordings were made in association cortex (area 5–7). (B) Examples of Vm distributions computed during wakefulness (Awake) and slow-wave sleep up-states (SWS). The continuous lines show Gaussian fits of the experimental distributions. Insets: current–voltage relations obtained for these particular neurons. (C) Conductance values estimated using the VmD method. Results for the means (ge0, gi0) and standard deviations (σe, σi) of excitatory and inhibitory conductances, respectively, as well as their ratios are shown (error bars: standard deviations obtained by repeating the analysis using different pairs of injected current levels). (D) Grouped data showing the means and standard deviations of the conductances for different cells across different behavioral states (REM = Rapid Eye Movement sleep). Figure modified from Rudolph et al. (2007)
.
It is important to note that the estimation of conductances for excitation and inhibition relies on a hypothesis about the value of the resting (leak) conductance which can be estimated in various ways (see Discussion in Piwkowska et al., 2008
). However, the variance estimates do not depend on the leak conductance, provided that the total conductance is known, which is usually the case.
The conductance measurements outlined above show that there is a diversity of combinations of ge and gi that underlies the genesis of subthreshold activity in different cells in the association cortex of awake cats. Indeed, an infinite number of combinations of ge and gi can give similar Vm activity. Figure 2
A illustrates two extreme examples out of this continuum using computational models: first a state where both excitatory and inhibitory conductances are of comparable magnitude (Figure 2
A, left; “Equal conductances”). In this state, both conductances are lower than the resting conductance of the cell and the Vm is fluctuating around −60 mV. Second, similar Vm fluctuations can be obtained when both conductances are of larger magnitude, but in this case, inhibition has to be augmented several-fold to maintain the Vm around −60 mV (Figure 2
A, right; “Inhibition-dominated”). Such conductance values are more typical of what is usually measured in vivo (Rudolph et al., 2005
, 2007
; Monier et al., 2008
). Both conductances are larger than the resting conductance, a situation which can be described as a “high-conductance state”.
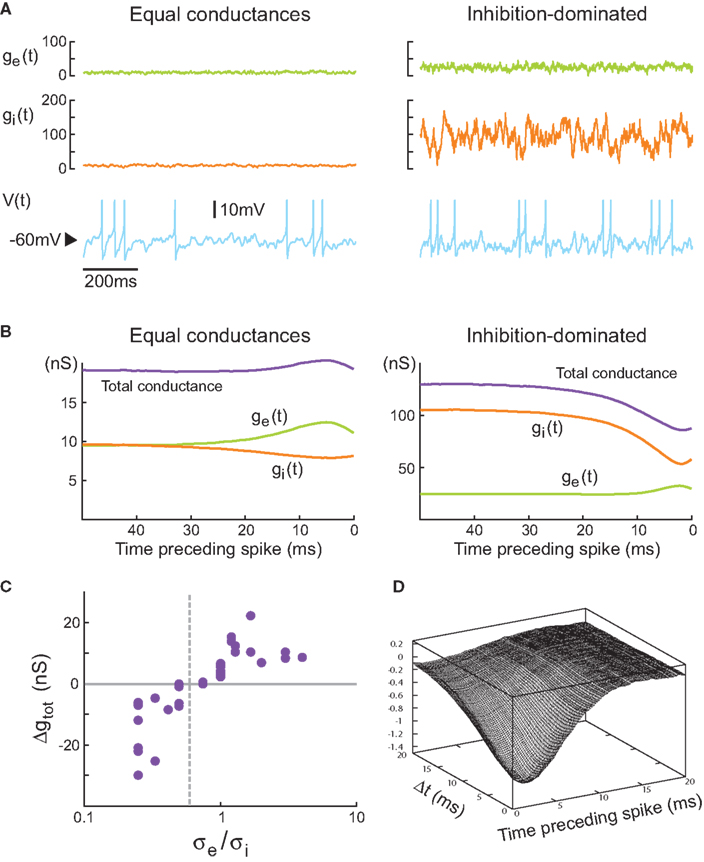
Figure 2. Comparison between equal conductances and inhibition-dominated regimes in models and dynamic-clamp experiments. (A) Model with equal conductance (left; ge0 = gi0 = 10 nS, σe = σi = 2.5 nS) and inhibition-dominated states (right; ge0 = 25 nS, gi0 = 100 nS, σe = 7 nS and σi = 28 nS). Excitatory and inhibitory conductances, and the membrane potential, are shown from top to bottom. Action potentials (truncated here) were described by Hodgkin–Huxley type models (Destexhe et al., 2001
). (B) Average conductance patterns triggering spikes in the model. Spike-triggered averages (STAs) of excitatory, inhibitory and total conductance were computed in a window of 50 ms before the spike. (C) Geometrical prediction tested in dynamic-clamp: grouped data showing the total conductance change preceding spikes as a function of the ratio σe/σi. The dashed line (σe/σi = 0.6) visualizes the predicted value separating total conductance increase cases from total conductance decrease cases. (D) Spike-triggered covariance analysis. The covariance between ge and gi (with delay Δt) is represented as a function of the time preceding spike in a dynamic-clamp experiment with inhibition-dominated state. (A–C) Modified from Piwkowska et al. (2008)
, (D) unpublished.
To determine how these two states differ in their spike selectivity, we evaluated the spike-triggering conductances by averaging the conductance traces collected in 50-ms windows preceding spikes. This spike-triggered average (STA) pattern of conductance variations is shown in Figure 2
B. For equal-conductance states, there is an increase of total conductance preceding spikes (purple curve in Figure 2
B, left), as can be expected from the fact that excitation increases (ge curve in Figure 2
B, left). In contrast, for inhibition-dominated states, the total conductance decreases prior to the spike (purple curve in Figure 2
B, right), and this decrease necessarily comes from a similar decrease of inhibitory conductance, which is, in this case, stronger than the increase of excitatory conductance (gi curve in Figure 2
B, right). Thus, in such states the spike seems primarily caused by a drop of inhibition.
These patterns of conductance variations preceding spikes were also investigated in real neurons by using dynamic-clamp experiments to inject fluctuating conductances in vitro. In this case, performing the same analysis as above revealed similar features: spike-triggered averages (STAs) of the injected conductances displayed either increase or decrease in total conductance, depending on the conductance parameters used (see Piwkowska et al., 2008
). It suggested that these features are independent of the spike generating mechanism but rather are caused by subthreshold Vm dynamics.
Further investigation of this system (Piwkowska et al., 2008
) led to the conclusion that in an integrate-and-fire neuron with threshold Vt, spikes are associated with increases in total conductance when the following condition is met:

where Ee and Ei are the reversal potential for excitation and inhibition, respectively. With the usual values (Vt = −55 mV, Ee = 0 mV, Ei = −75 mV), spikes are associated with increases in total conductance when σe > 0.6σi (Piwkowska et al., 2008
). This inequality is satisfied in the equal conductances regime and not in the inhibition-dominated regime investigated above.
This conclusion was supported by dynamic-clamp experiments in which these two states were compared using conductance injection (Piwkowska et al., 2008
). In eight regular spiking cortical neurons, we scanned different parameter regimes in a total of 36 fluctuating conductance injections. The result of these experiments is displayed in Figure 2
C where the average total conductance change preceding spikes is represented as a function of the ratio σe/σi, for all the 36 injections. The vertical dashed line represents the predicted value of σe/σi = 0.6, which indeed separates all the “conductance drop” configurations from the “conductance increase” configurations. Even though the prediction is based on a simple integrate-and-fire model, the ratio of synaptic variances can predict the sign of the total conductance change triggering spikes in biological cortical neurons subjected to fluctuating excitatory and inhibitory conductances.
Another means of characterization of conductance patterns related to spiking is to calculate the spike-triggered covariance (STC) between ge and gi. This covariance, if significant, would allow one to distinguish whether the spike-related increases of ge and drop of gi need to be correlated. In other words, is the drop of gi preceding the spike sufficient to fire the cell, or must this drop occur in conjunction with an increase of ge. The spike-triggered covariance shows a clear negative correlation between ge and gi preceding spikes (Figure 2
D), suggesting that indeed, the second possibility applies. In contrast, the STC for states with equal conductances did not show significant patterns, suggesting that in this case, the excitation alone is responsible for spiking activity.
In addition, the dynamic-clamp data shows that the average amplitude of change (Δge) of each synaptic conductance preceding a spike is related, in a linear way, to the standard deviation of this conductance (Piwkowska et al., 2008
). This observation is consistent with the idea that in all the cases studied here, the firing of the cell was driven by fluctuations in the Vm, rather than by a high mean Vm value.
The analysis of the preceding section shows that it is not the total conductance that determine the conductance-drop pattern, but the high inhibitory variance – or the high “inhibitory noise” – associated to high-conductance states. This further stresses the need for measuring these features from experimental data.
To estimate the STA of conductances from in vivo recordings, one must design methods to extract this information from the Vm activity. We recently designed such a method (Pospischil et al., 2007
). The STA of the Vm is calculated first, and the method searches for the “most likely” spike-related conductance time courses (ge(t), gi(t)) that are compatible with the observed voltage STA. If the conductances are Gaussian-distributed, and if the values of ge0, gi0, σe and σi are known (as for example following a prior application of the VmD method), then the STA of the Vm can be decomposed into STA of ge and gi using a discretization of the time axis (Pospischil et al., 2007
). This method was also extended to the case of correlated synaptic conductances (Piwkowska et al., 2008
). As for the VmD method, this STA method was successfully tested on models as well as on cortical neurons using dynamic-clamp experiments (see details in Pospischil et al., 2007
).
The conductance STA estimation method was used to determine conductance variations preceding spikes during Vm fluctuations in vivo (Rudolph et al., 2007
). Starting from Vm recordings of spontaneous spiking activity in awake or naturally sleeping cats, we computed the spike-triggered average of the Vm (Figure 3
). Using values of ge0, gi0, σe, σi estimated using the VmD method (see above), we computed the most likely conductance traces yielding the observed Vm averages. Most of these analyses (7 out of 10 cells for awake, 6 out of 6 for slow-wave-sleep, 2 out of 2 for REM) revealed conductance dynamics consistent with states dominated by inhibitory variance: there was a drop of the total conductance preceding spikes, due to a strong decrease of the inhibitory conductance (Figure 3
, right). However, a few cases, in the wake state (3 out of 10 cells), displayed the opposite configuration with the total synaptic conductance increasing before the spike (Figure 3
, left).
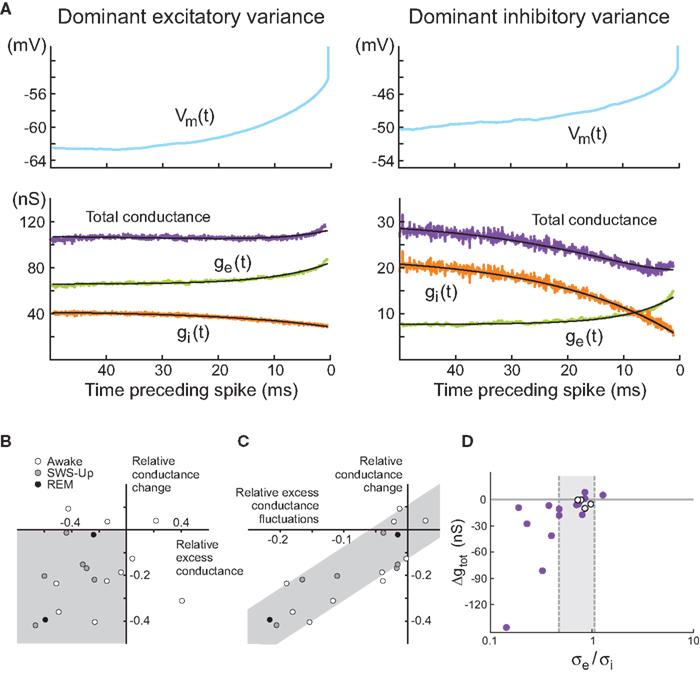
Figure 3. Spike-triggered conductance analysis in vivo. (A) STA conductance analysis from intracellular recordings in awake and sleeping cats. Two example cells are shown during wakefulness, and for each, the Vm STA (top) and the extracted conductance STAs (bottom) are shown. In the first cell (left), the total conductance increases before the spike. In the second example cell (right), the total conductance decreases before the spike (black traces are exponential fits to the extracted STAs). This cell represents the majority of the cases. (B) Relation between total membrane conductance change before the spike, (Δge − Δgi)/(ge0 + gi0) (“relative conductance change”), and the difference of excitatory and inhibitory conductance, (ge0 − Δgi0)/(ge0 + gi0) (“relative excess conductance”), estimated using the VmD method. Most cells are situated in the lower-left quadrant (gray), indicating a relation between inhibitory-dominant states and a drop of membrane conductance prior to the spike. (C) Relation between relative conductance change before the spike and conductance fluctuations, expressed as the difference between excitatory and inhibitory fluctuations, (σe − σi)/(ge0 + gi0) (“relative excess conductance fluctuations”). Here, a clear correlation (gray area) shows that the magnitude of the conductance change before the spike is related to the amplitude of conductance fluctuations. Symbols: wake = open circles, SWS-Up = gray circles, REM = black circles. (D) Total conductance change preceding spikes as a function of the ratio σe/σi. Given the cell-to-cell variability of observed spike thresholds, each cell has a different predicted ratio separating total conductance increase cases from total conductance decrease cases. The two dashed lines (σe/σi = 0.48 and σe/σi = 1.07) visualize the two extreme predicted ratios. Cells in white are the ones not conforming to the prediction. (A–C) Modified from Rudolph et al. (2007)
; (D) modified from Piwkowska et al. (2008)
.
In this paper, we have overviewed recent results emphasizing the importance of inhibitory “noise” in cortical neurons. The measurements of excitatory and inhibitory conductances present in different states in vivo, in particular in awake animals, show strong conductances in general, as well as strong conductance variances. Because in such balanced states it is the fluctuations that determine spiking activity, it is important to determine which of the conductance fluctuations are most effective in controlling spike activity. The main finding emphasized here is that in most cells recorded, it is the inhibitory fluctuations – or inhibitory noise – that most closely determine spiking activity.
The measurement of the conductance variances is not a simple problem, and different methods have been proposed (Rudolph et al., 2004
; Monier et al., 2008
). The method illustrated here, the VmD method, is based on decomposing the Vm fluctuations into their excitatory and inhibitory components (σe and σi) using an analytic expression derived from theoretical work on stochastic processes. The VmD method assumes that the conductances are Gaussian-distributed which seems a reasonable assumption given the large number of inputs involved and the law of large numbers. The VmD analysis reveals that inhibitory noise is generally strong in vivo in both anesthetized (up-states) and in awake cats. There was a large diversity of the values measured, with in general dominant inhibition against excitation, for both conductance mean and variances. It is important to note that, contrary to mean conductances, the estimates of σe and σi do not depend on hypotheses about the leak conductance of the cell.
The role of inhibitory noise was assessed by using spike- triggered averaging methods. Analyses using computational models and dynamic-clamp experiments revealed two different modes of firing according to the conductance patterns involved (Piwkowska et al., 2008
). For equal excitatory and inhibitory conductances, spikes are generally associated with a prior increase of total membrane conductance, which is due to an increase of the excitation. In this rather classic regime, the firing is due to an excess of excitation. Another regime is seen when conductances are large (high- conductance state), in which case spikes are preceded by a drop of total membrane conductance. This drop must necessarily come from inhibition, but it is also correlated with an increase of excitation, as shown by the spike-triggered covariance between ge and gi (Figure 2
D). Thus, in this case, the inhibitory fluctuations mostly drive spiking activity and play a permissive role.
These features were predicted by models and also demonstrated in living neurons using dynamic-clamp injection of fluctuating conductances, but it remained to be seen whether these considerations apply to the functioning cerebral cortex in vivo. This motivated the development of new methods to determine STA of conductances from Vm recordings (Pospischil et al., 2007
). This method uses a maximum likelihood procedure to determine conductance STAs, also based on stochastic processes. The hypothesis is similar to that of the VmD method, the conductance fluctuations are assumed to be Gaussian-distributed. This method was applied to intracellular recordings in awake cats (Rudolph et al., 2007
) and showed evidence that spikes are preceded by a drop of membrane conductance, thus arguing for the second firing mode dominated by inhibitory fluctuations. A prominent role for inhibition is also supported by previous intracellular recordings demonstrating a time locking of inhibitory events with action potentials in awake animals (Timofeev et al., 2001
), and the powerful role of inhibitory fluctuations on spiking in anesthetized states (Hasenstaub et al., 2005
).
Importantly, a point which was not seen by previous studies, is that it is not the total conductance – or mean conductance – that matters for spiking but it is rather the fluctuations around the mean, or the “conductance noise”. The sign of the total conductance change before a spike does not directly depend on the mean synaptic conductances, but is solely determined by the ratio of synaptic conductance variances. It was shown previously that the variance of synaptic conductances is related to the degree of correlation between presynaptic inputs (Destexhe et al., 2001
), suggesting that correlations in network activity are particularly effective to control spiking activity.
It is important to note that the predicted pattern of conductance variations, opposite between excitation and inhibition, is contrary to what is expected from feed-forward inputs. A feed-forward drive would predict an increase of excitation closely associated to an increase of inhibition, as seen in many instances of evoked responses during sensory processing (Borg-Graham et al., 1998
; Monier et al., 2003
; Wehr and Zador, 2003
; Wilent and Contreras, 2005
). There is no way to account for a concerted ge increase and gi drop without invoking recurrent activity, except if the inputs evoked a strong dis-inhibition, but this was so far not observed in conductance measurements. Thus, the present results that inhibitory “noise” is so determinant on firing activity stress the importance of recurrent activity and suggest an unexpected role for inhibitory circuits in information processing.
Future work should address the covariations of conductances in vivo. The spike-triggered covariances shown here were obtained from dynamic-clamp experiments in which the injected conductances are known. To estimate this function from Vm recordings would require to design specific methods. It should be possible to extend the previous method to estimate STAs from Vm activity (Pospischil et al., 2007
) to spike-triggered covariances, under the same Gaussian assumptions. Another possible extension is to clarify why the inhibition drops in relation to the spike, while it increases in response to sensory inputs. A possibility is that the former pattern is a feature of spontaneous activity in high-conductance states, while the second pattern is specific to evoked inputs. To answer this question, conductances and their variances should be measured in spontaneous activity (as done here) and during evoked responses, but in the same cells. Such experiments are under way.
The author declares that the research was conducted in the absence of any commercial or financial relationships that could be construed as a potential conflict of interest.
Thanks to Thierry Bal, Zuzanna Piwkowska and Igor Timofeev for sharing experimental data. Research supported by CNRS, ANR, and the European Community (FACETS grant FP6 15879).
Baranyi, A., Szente, M. B., and Woody, C. D. (1993). Electrophysiological characterization of different types of neurons recorded in vivo in the motor cortex of the cat. II. Membrane parameters, action potentials, current-induced voltage responses and electrotonic structures. J. Neurophysiol. 69, 1865–1879.
Destexhe, A. (2007). High-Conductance State. Scholarpedia 2: 1341. Available at: http://www.scholarpedia.org/article/High-Conductance_State
.