Optophysiological approach to resolve neuronal action potentials with high spatial and temporal resolution in cultured neurons
- 1 Centre de Recherche Université Laval Robert-Giffard, Université Laval, Québec, QC, Canada
- 2 Centre d’Optique, Photonique et Laser, Québec, QC, Canada
- 3 Département de Physique Génie Physique et Optique, Université Laval, Québec, QC, Canada
- 4 Département de Biochimie, Microbiologie et Bio-informatique, Université Laval, Québec, QC, Canada
Cell to cell communication in the central nervous system is encoded into transient and local membrane potential changes (ΔVm). Deciphering the rules that govern synaptic transmission and plasticity entails to be able to perform Vm recordings throughout the entire neuronal arborization. Classical electrophysiology is, in most cases, not able to do so within small and fragile neuronal subcompartments. Thus, optical techniques based on the use of fluorescent voltage-sensitive dyes (VSDs) have been developed. However, reporting spontaneous or small ΔVm from neuronal ramifications has been challenging, in part due to the limited sensitivity and phototoxicity of VSD-based optical measurements. Here we demonstrate the use of water soluble VSD, ANNINE-6plus, with laser-scanning microscopy to optically record ΔVm in cultured neurons. We show that the sensitivity (>10% of fluorescence change for 100 mV depolarization) and time response (sub millisecond) of the dye allows the robust detection of action potentials (APs) even without averaging, allowing the measurement of spontaneous neuronal firing patterns. In addition, we show that back-propagating APs can be recorded, along distinct dendritic sites and within dendritic spines. Importantly, our approach does not induce any detectable phototoxic effect on cultured neurons. This optophysiological approach provides a simple, minimally invasive, and versatile optical method to measure electrical activity in cultured neurons with high temporal (ms) resolution and high spatial (μm) resolution.
Communication between neurons is mediated by local and transient modifications in membrane potential (Vm). These variations in Vm are highly regulated in space, time, and amplitude throughout neuronal arbors. Therefore, understanding the rules governing neuronal communication entails to monitor electrical activity with high spatial and temporal resolution. The task is not simple given the speed and diversity of electrical signaling coupled to the complexity, dimensions, and fragility of neuronal structures. The ideal approach requires millisecond, micrometer, and millivolt resolutions, without inducing damage to cells under investigation. Classical electrophysiological methods provide the necessary temporal and amplitude resolutions, but lack sufficient spatial resolution, due to limited access to small neuronal compartments, such as fine dendrites and synapses. Optical methods based on fluorescent voltage-sensitive dyes (VSDs) are being improved to achieve optimal spatial, temporal, and amplitude resolutions of changes in Vm (ΔVm). However, the generally low sensitivity of available VSDs has limited resolution of fast ΔVm in fine dendrites or dendritic spines. Therefore, optical measurements with VSDs have largely been exploited for monitoring activity at the circuit level (Peterka et al., 2011). To circumvent sensitivity limitations for neuronal resolution of Vm, optical measurements are generally averaged over many trials. This averaging strategy can however exacerbate photodamage, which is already a concern for several VSDs (Grinvald et al., 1981; Antic and Zecevic, 1995; Wu et al., 1999; Zhou et al., 2007). Similarly, second harmonic generation (SHG) microscopy, which has been used to record membrane potentials (Dombeck et al., 2004, 2005) at soma and in spines (Nuriya et al., 2006), has been shown to induce significant photodamage (Sacconi et al., 2006; Jiang and Yuste, 2008).
CCD camera-based approaches are generally ideal for circuit level investigations. For neuronal and synaptic resolution of fast ΔVm, the sufficiently fast cameras sacrifice on the spatial resolution (and vice-versa; Djurisic et al., 2004; Holthoff et al., 2010). Laser-scanning systems are limited in speed for generating a full neuron image, but are ideal, with the line-scanning mode, for sampling small compartments at high speed and minimizing photodamage by illuminating only a tiny fraction of the neuron under investigation. This results in a point-recording technique for which, in contrast to classical electrophysiology, the point can be moved all across the dendritic or axonal arborization of neurons. Optical approaches also ought to be minimally invasive and thus should preferably not depend on intracellular perfusion of VSDs. This can be achieved with genetically encoded Vm sensors, which have been tremendously improved for circuit level measurements (Akemann et al., 2010), but not yet for neuronal resolution of fast ΔVm, such as an action potential (AP). The challenge of optical imaging of ΔVm in brain slices is greater than in cultured neurons, because of light scattering through thicker sample. While dissociated neurons do not provide a good model for specific circuitry, they offer many advantages for linking molecular manipulations with physiological properties of the neurons and synapses. We therefore set out to develop a line-scanning optical approach aimed at measuring spontaneous fast electrical activity at neuronal and spine resolution with minimal invasiveness and photodamage, in cultured hippocampal neurons. We examined the recently synthesized water soluble fluorescent VSD, ANNINE-6plus (Fromherz et al., 2008), as a suitable probe for this application. We show that line-scanning measurements of ANNINE-6plus, passively introduced into neuronal membranes via brief incubation, can readily resolve individual APs in the soma, dendrites, and even spines, without photodamage or any impact on the electrophysiological properties of the investigated neuron. It can resolve low amplitude depolarization (down to 4 mV) with averaging. Importantly, the high signal to noise ratio observed allows APs to be resolved with single measurements (no averaging) in the soma. These critical features allowed us to optically record, for prolonged periods of time, the spontaneous firing patterns of individual neurons before and after pharmacological treatments. Our study thus provides a simple approach to non-invasively study spontaneous ΔVm with high spatial and temporal resolutions in cultured neurons.
Results
ANNINE-6plus Labeling and Imaging
To label dissociated hippocampal neurons with ANNINE-6plus, we incubated a coverslip for only 5 min with 14 μM of the dye, followed by a brief washing period of 10 min. Examples of ANNINE-6plus labeling of hippocampal neurons, obtained by laser-scanning microscopy with a Zeiss LSM510, are presented in Figure 1. Excitation at 458 nm, with low illumination power (∼15 μW at the sample) leads to a strong fluorescent signal (Figure 1A). The insertion of the dye specifically into the plasma membrane results in highly contrasted images with dark cytosols and bright membranes. Two hours after the initial labeling, we did not observe any internalization of the dye (Figure 1B). Thus, this rapid, simple, and robust bath labeling approach is straightforward with dissociated neurons in culture. To resolve better the processes of a single neuron, we tested whether it was possible to label individual neurons. We first tried via patch clamping, with the dye in the patch pipette. Surprisingly, the dye did not penetrate into the cell, even though other dyes, such as Alexa594 filled the neurons normally (not shown). We reasoned that the solubility of the dye in the intracellular solution was not sufficient, leading to small crystals that plugged the patch pipette. We therefore tested “puffing” the dye from a patch pipette (of slightly larger hole, i.e., low resistance of 2–3 MΩ) brought close to the soma. Within seconds after a few puffs, the soma of the neuron was brightly labeled. The lipophilic nature of the dye allowed it to diffuse along the dendritic tree (Figure 1C), revealing fine distal structures including dendritic spines (Figure 1C inset). This single-cell labeling method, which is less invasive than through whole-cell patch pipette, should be advantageous for making measurements in subcellular regions. For the remainder of this study however, we used the bath incubation method, in order to assess the potentials and limits of this dye for optical measurements of ΔVm.
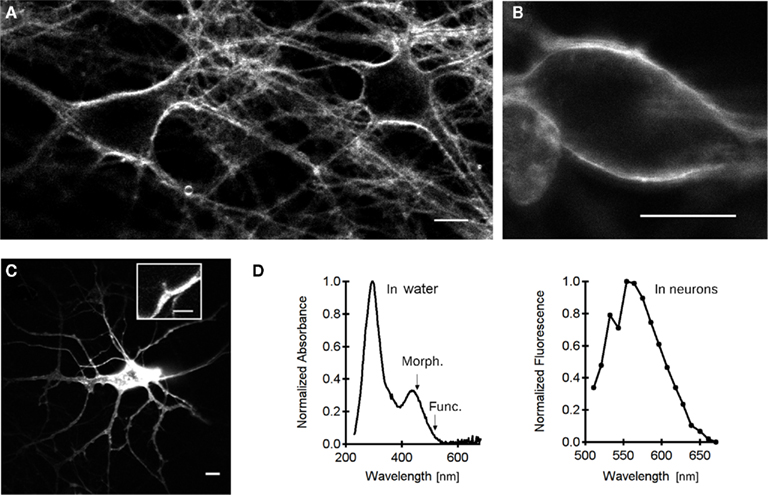
Figure 1. Labeling and imaging ANNINE-6plus voltage-sensitive dye in cultured hippocampal neurons. (A) Extracellular labeling (14 μM ANNINE-6plus in regular extracellular solution for 5 min) leads to a strong fluorescence signal (excitation at 458 nm). Scale bar 10 μm. (B) Two hours after the initial labeling, there is no internalization of the dye allowing performing experiments over long periods of time. Scale bar 10 μm. (C) Unicellular labeling by direct application (puffing from 2 MΩ patch pipette) of ANNINE-6plus dye to the plasma membrane. The lipophilic dye diffuses in the membrane throughout the neuron to label its processes. Image taken 10 min after puffing the dye. Scale bar 10 μm. Inset, the contrast is sufficient to detect a single dendritic spine. Scale bar 2 μm. (D) Normalized absorption spectrum (left) of the dye dissolved in water (1 mM; the arrow points to 458 nm, wavelength used for morphological imaging, while arrowhead points to 514 nm, wavelength used for voltage measurements), and emission spectrum (right) of ANNINE-6plus in neurons. Scale bar 10 μm.
To select the optimal wavelengths for ΔVm measurements, we measured ANNINE-6plus absorbance between 200 and 650 nm in a spectrophotometer in vitro. The normalized absorption spectrum of the dye, measured in water (Figure 1D, left) shows a strong absorption band centered at 295 nm (S0–S2 electronic transition) and a less intense one (intensity ratio 3:1) around 436 nm (S0–S1 transition; Fromherz et al., 2008). We next measured the emission spectrum of the dye in neurons using a META spectral detector on the Zeiss LSM510. The fluorescence intensity peaked around 550–580 nm (Figure 1D right). Kuhn and Fromherz (2003) showed that the voltage sensitivity of the dye is based on a voltage-dependent spectral change (blue shift of absorption and emission spectra upon depolarization) due to molecular Stark effect. In addition, they showed that excitation in the red part of the absorption spectrum results in a dramatic increase in the sensitivity of measurements (Kuhn et al., 2004). Accordingly, the dye was excited at 514 nm for ΔVm measurements, while fluorescence was detected through a long pass emission filter (LP 560). Meanwhile, to generate images of labeled cells, we used a 458-nm laser line for excitation and a LP560 emission filter.
Optical Recording of Membrane Potentials
To test the sensitivity of ANNINE-6plus for ΔVm optical recordings, we imposed membrane potential steps to patch-clamped neurons and recorded synchronously changes in fluorescence (ΔF) along a single line positioned onto the plasma membrane (Figure 2A inset, red line). As illustrated in the upper part of Figure 2A, the stimulation protocol consisted in a ramp of 14 voltage steps ranging from −40 to +100 mV. Each step, of 10 mV increments, lasted 30 ms while the time interval between each step was set to 20 ms. The total duration of a single sweep was 1 s and the line was scanned at a frequency of 2 kHz. A typical image from 20 averaged sweeps is presented in Figure 2A middle. Bright stripes stand for gain in fluorescence due to hyperpolarization of the membrane, while dark stripes represent the loss of ANNINE-6plus fluorescent signal due to induced depolarization. From this image, the fluorescence time profile was extracted (Figure 2A lower part). Traces were not corrected for photobleaching. Figure 2B shows the relationship between the amplitude of ANNINE-6plus fluorescence decrease and the amplitude of imposed membrane potential. The VSD fluorescence intensity decreases exponentially with increasing voltage steps (plain line in Figure 2B). Fitting an exponential function to the sensitivity curve leads to a voltage sensitivity of 10.1% for 100 mV depolarization (n = 5 cells). These results indicate that ANNINE-6plus fluorescence can report rapid ΔVm with sensitivity comparable to the most prevalent VSDs (Dombeck et al., 2005).
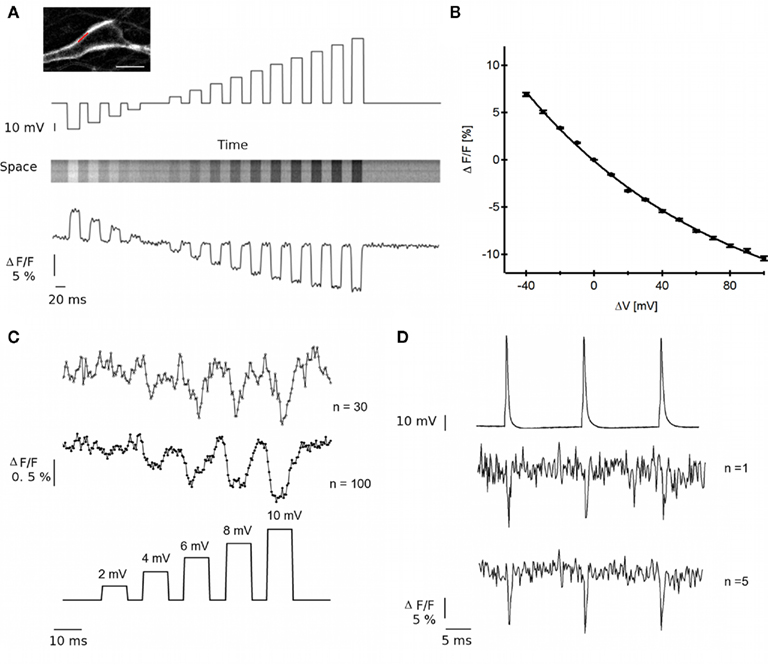
Figure 2. Optical recordings with ANNINE-6plus of action potentials and low amplitude depolarizations. (A) Top Inset a typical line scanned along the soma is illustrated in red. Scale bar 10 μm. Top: The stimulation protocol consists in a ramp of 14 steps (30 ms) ranging from −40 to +100 mV imposed in voltage clamp mode. Middle: Fluorescence detected in line scan mode at the soma synchronously with stimulation protocol. Bottom: From this image, the ANNINE-6plus fluorescent time profile is extracted. (B) ANNINE-6plus fluorescence intensity changes upon amplitude of membrane depolarization. (C) Low amplitude depolarizations (voltage ramps, 5 steps/10 ms, ranging from −60 to −50 mV) optically detected at the soma by averaging 30 (top trace) and 100 (middle trace) single trials. (D) Top: APs induced upon injection of 2 ms pulses of 1 nA in current-clamped neurons. Middle: Optical detection of APs with single trial measurement (S/N ∼3). Bottom: increased S/N (∼5) with averaging of five trials.
To examine whether ANNINE-6plus can report smaller amplitude ΔVm, we generated a ramp of five voltage steps (10 ms duration −2 mV increments) resulting in a depolarization ranging from 2 to 10 mV. Lower trace in Figure 2C illustrates the stimulation protocol while the upper trace is the optical readout (30 and 100 single trials were averaged). The results indicate that the dye can report changes in the range of 4 mV.
We next examined whether the response time in ANNINE-6plus ΔF was sufficiently rapid to resolve an AP. We elicited three APs, separated by 70 ms, via current injection (1 nA, 2 ms) into a current-clamped neuron while scanning a line on the soma. Figure 2D shows that the ANNINE-6plus ΔF followed the electrophysiological profile (upper trace) of ∼100 mV APs, even with single trials (S/N ∼3, middle trace), though the S/N was better (∼5) with averaging of five trials (bottom trace). These results represent one of the few reported examples of single AP resolution with a VSD without averaging.
Evaluating Phototoxicity Induced by ANNINE-6plus-Based ΔVM Optical Measurements
While the results above are very encouraging with respect to the potential of ANNINE-6plus to optically report rapid and small ΔVm with moderate to no need for averaging for AP measurements, it was important to assess whether any phototoxicity could be induced in the process. We therefore monitored several electrophysiological parameters from neurons in which optical measurements were performed. These parameters were the membrane input resistance (Rinput), the pipette access resistance (Raccess), and the membrane resting potential (Vrm). Between each single sweep of the stimulation protocol illustrated in Figure 2A, a test pulse was imposed to the investigated neuron, resulting in a series of 21 test pulses (30 ms, 10 mV) separated by a time interval of 5 s. No distortion in the current dynamics appeared throughout the 21 consecutive stimuli, suggesting that both the electrical properties of the investigated neuron and the quality of the patch did not suffer from repetitive laser illumination (Figure 3A1). To further quantify this observation, we extracted Rinput and Raccess from these current traces as described in (Sakman and Neher, 1995). Raccess and Rinput were averaged over the first and last seven test pulses. Resulting means were averaged over five different experiments and are presented in Figures 3A2,A3 (first third in black, last in gray). Between the first seven traces (first third) and last seven traces (last third), we found no statistically significant differences in the input resistance nor in the pipette access resistance. In addition, we did not observe morphological changes upon Vm optical measurements. Yet, to evaluate the impact of ΔVm imaging on resting membrane potential, we measured this latter parameter throughout the stimulation protocol used in Figure 2D. Cells were patch-clamped in current clamp mode and Vrm was averaged over the first 10 ms of each single sweep (i.e., during resting state). For each cell, the complete stimulation protocol consisted in the repetition of five single sweeps with a 5-s time interval. No change in Vrm time course is a reliable indication of the absence of photodamage during ΔVm optical detection (Figure 3B).
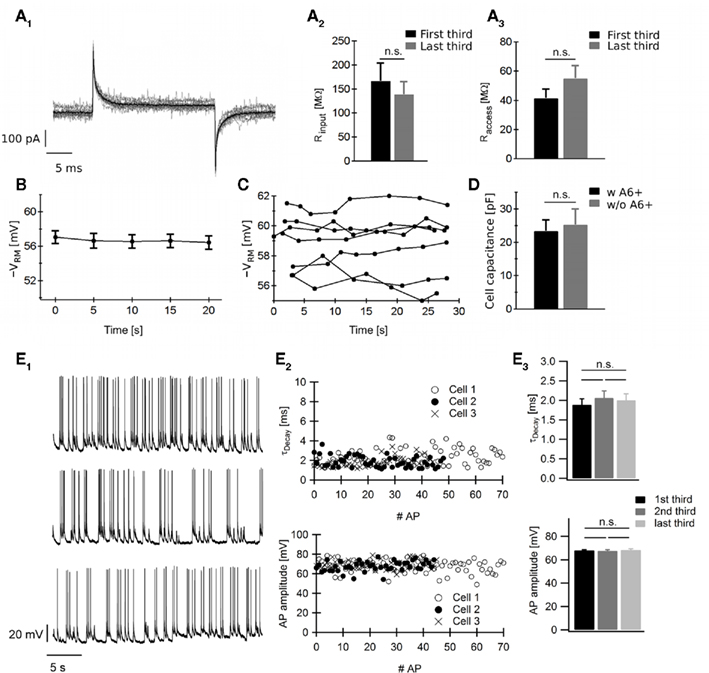
Figure 3. Absence of detectable ANNINE-6plus-induced phototoxicity during optical measurements of ΔVm.(A1) Series of 21 current recordings, evoked by 21 test pulses (30 ms/10 mV) recorded between each single sweep of the stimulation protocol illustrated in Figure 2A. The time interval between each trace is 5 s on average and each line scan lasts for 1 s. (A2) Comparison of Rinput and (A3) Raccess averaged over the first (black) and last (gray) third of the total length of the stimulation protocol (n = 5 cells; Mann Whitney test: p > 0.1 for Rinput and Raccess). (B) Vrm time evolution during optical detection of APs illustrated in Figure 2D (n = 6 cells). (C) Time course of Vrm during 30 s of continuous illumination at 458 nm laser excitation (n = 7 cells). (D) Cell capacitance of cells labeled or not with ANNINE-6plus (n = 10 cells for each group; Mann Whitney test: p > 0.1). Data show mean ± SEM. n.s.: p > 0.1. (E) Characterization of AP time courses and amplitudes during Vm optical measurements. (E1) Examples of electrical recordings of spontaneous activity during Vm optical measurements in line scan mode from three neurons. (E2) Quantification of time constant τDecay (upper panel) and amplitude (lower panel) for each AP detected in (E1). (E3) Decay time constant and amplitude averaged over the first, second, and third third of the total recording time show no statistically significant difference (n = 3 cells and between 50 and 60 APs for each group; ANOVA test: p > 0.1). Data show mean ± SEM. n.s.: p > 0.1. These results indicate no detectable impact of ANNINE-6plus-based Vm optical measurements on the neuronal health.
These results suggest minimal, if any, photodamage during the optical measurements of Vm with ANNINE-6plus. However, we also wanted to verify whether the prior illumination at 458 nm with the laser (for generating images) could cause any photodamage. We thus monitored Vrm while illuminating the neurons continuously for 30 s at 458 nm (Figure 3C; pixel time of 3 μs, image was 512 × 512 pixels). The resting membrane potential remained constant for all neurons indicating no photodamage under these illumination conditions. Then, to evaluate the impact of labeling on neuronal physiology, we compared the cell capacitance of neurons labeled or not with ANNINE-6plus. Figure 3D indicates no statistically significant difference between both groups. Finally, we assessed whether the ANNINE-6plus imaging sessions had any impact on the amplitude and time course of closely spaced APs. Neurons were current-clamped and their electrical activities were monitored during 30 s of continuous line scan imaging. Examples of Vm recordings from three different neurons are presented in Figure 3E1. For each AP detected in Figure 3E1, we extracted the time decay τDecay (Figure 3E2 upper panel) and the amplitude (Figure 3E2 lower panel). In Figure 3E3, we show that τDecay and amplitude averaged over the first, second, and third period of the total recording time show no statistically significant difference. We conclude from these experiments that ANNINE-6plus has remarkably low, if any, phototoxicity, making it a very suitable dye for measuring ΔVm in neurons.
Optical Measurements of Active Back-Propagation of Action Potentials along Dendrites
The superiority of optical techniques over classical electrophysiology for recording membrane potentials lies in their ability to report local Vm transients. As an illustration of this capability, we used ANNINE-6plus to image the back-propagation of APs along dendrites. After labeling, two positions of interest were chosen along a dendrite: position 1 in blue and 2 in red in Figure 4A (100 μm apart in this example). We recorded ΔVm at each position subsequently during the injection of a 100 pA/50 ms pulse followed by a 300 pA/500 ms hyperpolarizing pulse. Figures 4B1,B2, upper panels show the membrane potential recorded via the patch pipette. Each trace is an average of 15 consecutive single trials for which two APs are triggered with a millisecond time scale jitter between them (Figures 4B1,B2 insets). Optical readouts of these stimulations are presented in Figures 4B1,B2 lower panels. Blue traces correspond to recordings from position 1 while red traces are from position 2. As membrane potentials recorded via the patch pipette at the cell body are not dependent on the position of optical recordings, both traces in Figures 4B1,B2 upper panels are similar. By contrast, local optical measurements are different between position 1 and 2 (Figures 4B1,B2 lower panels). Indeed, the difference between the optically measured baseline Vm (empty arrows in Figures 4B1,B2 lower panels) and the Vm at the AP threshold (filled arrows in Figures 4B1,B2 lower panels) as well as the hyperpolarizing pulse amplitude are both attenuated with distance from the soma. To quantify this attenuation, we subtracted the averaged time profile optically detected at the position 2 (Figure 4B2 lower panel) from the one measured at position 1 (Figure 4B1 lower panel) resulting in the gray trace presented in Figure 4C upper panel. By superimposing the optical measurement with the difference between the two (Figure 4C lower panel), it reveals that the AP itself did not attenuate between the two positions (AP is indicated with arrowhead) consistent with an active mode of propagation for the AP, but not for the propagation of the patch pipette imposed potential.
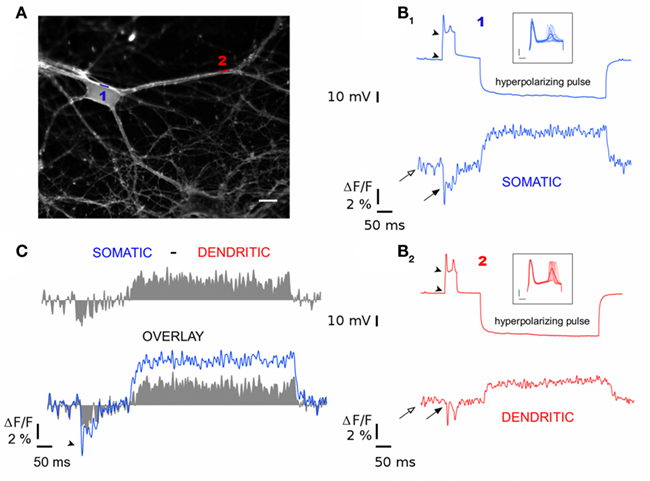
Figure 4. Optical measurements of back-propagating action potentials along a dendrite. (A) Fluorescence image of ANNINE-6plus labeled neuron. Somatic optical recording is performed along line 1 (blue) while dendritic one is performed along the line 2 (red). Scale bar is 10 μm. (B) Electrophysiological (top) and optophysiological (bottom) recordings at the soma (blue) and along a dendrite (red). (B1,B2) Top: Membrane potential time course recorded via patch pipette upon injection of a depolarizing pulse (+100 pA/50 ms) followed by a hyperpolarizing one (−300 pA for 500 ms). Traces result from an average of 15 single trials. The amplitude of potential between arrowheads represents the charge needed to reach the spiking threshold. Inset shows each one of the 15 trials. (B1,B2) bottom: Optical measurement of Vm at positions 1 and 2. Empty arrows indicate the optical readout of the resting membrane potential while filled arrows point to the optical readout of the initial charge of the plasma membrane. (C) Top: Difference time profile in gray obtained from the subtraction of dendritic optical recording [red (B2)] from somatic one [blue (B1)]. Bottom: Difference time profile (gray) superimposed with somatic optical recording (blue).
Optical Measurement of Back-Propagated Action Potentials Invading a Dendritic Spine
Line-scanning with LSM should provide the advantage of measuring ΔVm in small compartments such as dendritic spines. With dissociated neuronal cultures, two labeling methods are possible for spine measurements: (i) the single-cell labeling described in Figure 1 or (ii) the same bath application used in this study, but with the prior transfection of a fluorescent protein highlighting the morphology of the cell. Because the transfection efficiency is very low in cultured neurons, the latter approach permits the discrimination of the entire arborization of single neurons, sparsely distributed in the culture. In Figure 5, we transfected neurons with the cytosolic fluorescent protein Cerulean (Figure 5A). The following day, these neurons were labeled with ANNINE-6plus through bath application as described above. Individual spines detected with Cerulean fluorescence (Figure 5A) could then be scanned at 514 nm to measure ANNINE-6plus ΔF, during a stimulation protocol (two pulses, 1 nA, 2 ms) leading to the invasion of two APs in the spine (Figure 5). The average of 10 single trials were sufficient to report optically the APs invading the spine with S/N of ∼3. One of the advantages of transfecting Cerulean to reveal spines is that it allowed us to ensure that deflections in the fluorescence time profile (blue trace) were indeed caused by transient ΔVm in the spine, by monitoring also Cerulean fluorescence (Figure 5B black trace). These results indicate that optical ΔVm measurements with ANNINE-6plus and line-scanning microscopy can report AP invasion in spines with low averaging.
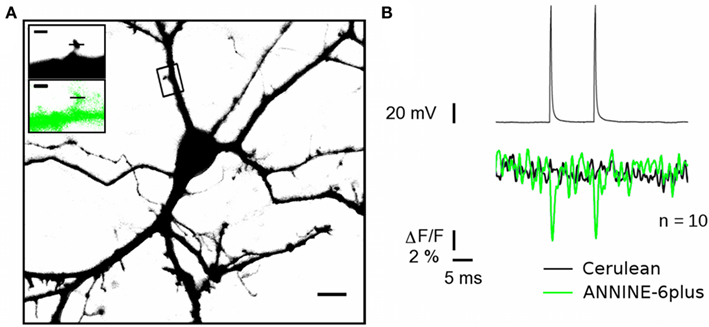
Figure 5. Optical monitoring of back-propagating action potentials invading a dendritic spine. (A) Cultured hippocampal neuron expressing cytosolic Cerulean (black) as a morphological dye and labeled with ANNINE-6plus (green). Scale bar 10 μm. Inset magnified image of the spine labeled with ANNINE-6plus (top) and Cerulean (bottom). Scale bars 1 μm. Lines placed on the spine indicate the position of the line scanned. (B) Top: Two APs elicited by injection of 2 ms 1 nA currents. Bottom optical recordings of the subsequent back-propagated APs in the spine. The green trace is the ANNINE-6plus fluorescence time profile while the black one is for Cerulean. 10 trials were averaged. Representative example from measurements in nine different spines.
Optical Measurements of Spontaneous Action Potentials and Assessment of Firing Patterns upon GABAERGIC Disinhibition
As demonstrated in Figure 2, the sensitivity of our approach is such that a single sweep is sufficient to detect an AP with S/N ratio around 3. This has two major consequences: (1) little or no averaging is needed to monitor ΔVm, preventing phototoxicity, and limiting the duration of the measurements and (2) it should be possible to monitor spontaneous electrical activity of the neurons. To demonstrate the latter advantage, we performed long-lasting line-scanning over the soma of neurons (upper panels in Figures 6A–C shows an example of such measurement) before and after inhibition of GABAergic and glycinergic transmission, with simultaneous patch-clamp recording (lower panels in Figures 6A–C). The optical measurement faithfully reported AP discharges (Figure 6A). Next, neurons were exposed to Ringer supplemented with bicuculline (20 μM) and strychnine (2 μM) triggering disinhibition in the neuronal network and leading to a robust increase of the spiking frequency, which the optical recording could also report (Figure 6B). After 5 min of disinhibition, hippocampal neurons began to fire APs in burst mode (Figure 6C), which are optically reported according to the electrical activity. To quantify the faithfulness of the optical measure, we present two different analyses. The first one is intended to evaluate the proportion of events that are indeed optically detected, using a cumulative probability plot of inter-events intervals for population of events during initial disinhibition (Figure 6B lower panel), recorded either via the patch pipette or optically (Figure 6D, compare “electrophysiology” vs. “optophysiology” traces). A two-sample Kolmogorov–Smirnov statistical test indicates that both populations are similar at a 96% confidence interval suggesting a high reliability of the optical approach to detect spontaneous APs. In the second analysis, we address the reliability of the amplitudes of optically detected events during the initial phase of disinhibition (Figure 6B lower panel) with a correlation plot between event amplitudes detected with light vs. with the pipette (Figure 6E left). The amplitude baseline was determined as the amplitude averaged over 2 ms preceding the event. A linear fitting on the ensemble of points yielded a slope of 12% for 100 mV depolarization (Figure 6E left plain line – Pearson’s coefficient R = 0.47). Interestingly, this parameter is in excellent agreement with the sensitivity measured in a different way and presented in Figure 2B. However, as seen in Figure 6E, the variance of the distribution of amplitudes is large and in order to further characterize the spread of optically detected amplitudes, we plotted, for each point in Figure 6E the residual of the linear fit. The SD of this population of residuals is 1.3% (Figure 6E right). This suggests that this single trial approach is more appropriate for measuring firing frequencies (i.e., to count the number of APs over time) than to resolve precisely AP amplitudes and time courses.
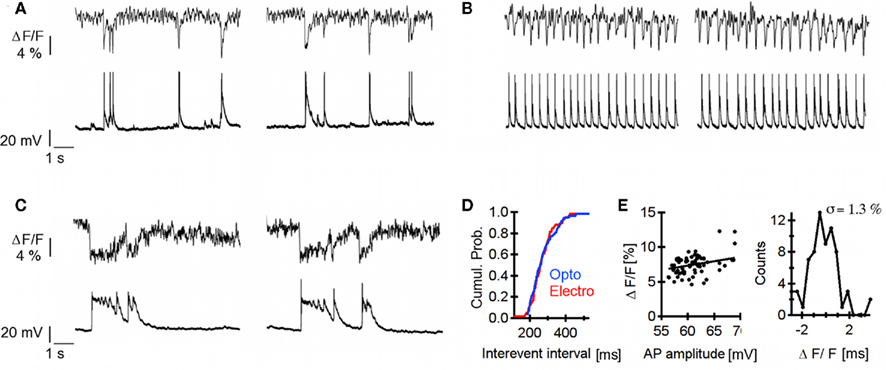
Figure 6. Optical recording of spontaneous neuronal firing patterns. (A–C) Upper traces: optical recordings, lower traces: electrical recordings. (A) Electrical activity under regular extracellular solution (B) after inhibition of inhibitory inputs for 5 min (Bicuculline 10 μM) (C) after inhibition of inhibitory inputs for 15 min. Neuronal discharges are synchronized and show bursting pattern. (D) Cumulative probability plot of inter-events intervals [AP from (B)] detected either optically (optophysiology) or with the patch pipette (electrophysiology). Both populations are equally distributed. (Two-sample Kolmogorov−Smirnov: test p > 0.96). (E) Left Correlation plot between amplitudes of APs from (B) detected via the pipette and corresponding change in ANNINE-6plus fluorescence. A linear function (black trace) is fitted to the ensemble of point and yields a slope of 12.2% for 100 mV depolarization. Right: the distribution of residuals coming from the fit shows a SD of 1.3%.
Discussion
To decipher the rules governing neuronal communication via changes in membrane potentials throughout neuronal arbors, we need a tool capable of measuring ΔVm locally (down to a single dendritic spine), with a millisecond time scale temporal resolution and sufficiently sensitive to monitor spontaneous activity (with no averaging) or low amplitude synaptic potentials. In addition, the capacity to make local ΔVm measurements should ideally be on time scales expanding over three orders of magnitude: millisecond time scale to resolve a single AP and second to minute time scale to record spontaneous activity. Finally, the approach should be minimally invasive. During the last decades, many different optical approaches have been developed to address this issue (for review see Peterka et al., 2011). However, none of these approaches are versatile enough to fulfill all the pre-cited requirements. First, concerning the ability to record membrane potentials in small compartments, there are, to our knowledge, only three studies reporting optical detection of ΔVm in dendritic spines. The first is by Nuriya et al. (2006) using SHG microscopy. This approach is based on two-photon voltage-dependent light scattering properties of an SHG reporter (FM4-64) bound to plasma membrane. This imaging technique involves high intensity two-photon illumination. Although the sensitivity of recordings is relatively high (−10%/100 mV), the efficiency of this non-linear process is weak resulting in a low flux of scattered photons which, in turn, leads to a poor S/N ratio. As a consequence, a large number of single trials are needed to be able to detect a back-propagating AP invading a dendritic spine (160 to 280 single trials need to be averaged). The large number of single trials, the high power of laser illumination (ranging from 10 to 50 mW at the sample) together with the fact that SHG always comes with two-photon absorption makes this technical approach highly phototoxic for investigated cells (Sacconi et al., 2006; Jiang and Yuste, 2008). Palmer and Stuart (2009) reported the optical detection of ΔVm in dendritic spines from brain slice using the fluorescent VSD JPW3028. However, due to the low sensitivity of the dye [1–6%/100 mV (Djurisic et al., 2004)], and the slice configuration, a large number of single trials (>120 per spine) had to be averaged to reach a sufficient S/N ratio for voltage measurements. The fact that many single trials are needed to detect local Vm implies more illumination time that may results in more phototoxic effects. In addition, repetitive stimulations can occasionally induce plasticity, which can complicate measurements that require much averaging. Finally, Holthoff et al. (2010) were able, for the first time, to image a back-propagated APs invading a dendritic spine in a single trial. The high sensitivity of measurements they performed is due to technical improvements of their microscope and to the use of the voltage-sensitive dye JPW3028. Yet, major drawbacks of this technique are the complexity of the imaging setup and the fact that JPW3028 is known to induce phototoxicity when illuminated for more than 50–100 ms (Djurisic et al., 2004), preventing its use for monitoring neuronal spontaneous activity occurring in the second to minute time scale.
Concerning this latter point, many examples of neuronal spontaneous activity optical recordings exist in the literature (Petersen et al., 2003; Kuhn et al., 2008; Brown et al., 2009; Ayzenshtat et al., 2010; Vignali et al., 2010). In these examples, an exogenous fluorescent voltage reporter is used to label the preparation. A different approach, based on the use of voltage-sensitive fluorescent proteins has recently been demonstrated to be able to report faithfully for neuronal activity in vivo (Akemann et al., 2010; Knopfel et al., 2010). Although, all of these approaches have been extremely useful in reporting global activity of neuronal networks, particularly in live animals, none of them afford single-cell resolution together with a sufficiently high temporal resolution to resolve APs.
Here we demonstrated an optical approach based on the use of the fluorescent voltage-sensitive dye ANNINE-6plus that is able to report local (e.g., dendritic spines), fast (millisecond time scale), and low amplitude (few millivolts) membrane potential variations in mammalian cultured neurons without inducing photodamage. The sensitivity of ΔVm optical measurements (−∼10%/100 mV) is amongst the largest reported for VSDs used in mammalian neurons (Fromherz et al., 2008; Bradley et al., 2009). Then, it was possible to record APs in a single trial with a S/N of about 3. In addition, we could monitor optically low amplitude depolarization (ΔVm = 10 mV) without extensive averaging (n = 30; S/N = 3) making this approach potentially suitable for recording physiological post-synaptic potentials. In fact, the low averaging necessary for optical recordings contributes to lower the intensity and duration of laser illumination. As a result, cellular physiological parameters (membrane resistance and resting membrane potential) of cultured neurons, whose ΔVm was measured, did not change significantly during experiments suggesting that no photodamage was induced during the optical recordings. Next, we demonstrated that our optical approach allows for monitoring membrane potentials in small neuronal compartments, i.e., along dendrites and within dendritic spines. Since the pioneering work of Stuart and Sakmann (1994) it is generally accepted that APs can propagate actively along a dendritic tree. This phenomenon, although highly heterogeneous within different neuronal populations and even within a single neuron, is thought to play a central role in spike-timing-dependent plasticity (Caporale and Dan, 2008; Froemke et al., 2010a,b; Grewe et al., 2010; Lisman and Spruston, 2010). The optical detection of back-propagated APs with ANNINE-6plus allowed us to observe such an active propagation, demonstrating the potential of our approach to address physiological questions for which classical electrophysiology is not ideal. In addition, we show that it is possible to record a back-propagated AP invading a spine without extensive averaging (10 trials required to reach a S/N ratio of about 3). This ability to measure a voltage change within a single dendritic spine (micrometer scale) opens the doors to the recording of post-synaptic potentials. Finally, our ability to record APs in a single trial has allowed recording of neuronal spontaneous activity of single cells for minutes with a millisecond time scale resolution. We were able, for the first time to our knowledge, to monitor the modulation of spiking frequency under normal and disinhibiting conditions. It has to be noted that the implementation of this technique in a lab is particularly straightforward, as it only requires a standard laser-scanning microscope, with a 514-nm laser line. It should also be possible to use CCD-based wide-field imaging with ANNINE-6plus, providing a sufficiently fast camera to resolve APs. Our preliminary results (Figure A1 in Appendix) indicate that it is indeed possible, however our lack of a sufficiently fast camera (sampling ≥2 kHz) could not permit AP resolution.
It is important to reiterate that all our experiments have been performed in dissociated cultured neurons, which provides significant advantages over brain slice in term of S/N, thereby reducing the need for averaging and phototoxicity. As we showed, this approach can be easily combined with transfection methods, which can be used to introduce shRNAs, dominant-negative or positive mutations, or CFP-tagged proteins for trafficking assays, thereby affording a useful model to link molecular changes with neuronal function. On the other hand, this preparation suffers from having a meaningful circuitry, as present in brain slice preparation. Could ANNINE-6plus be used in a brain slice? Our results in culture should encourage others to try it. One major limitation is the fact that we have not been able to load it via whole-cell patch pipette, the approach of choice for obtaining contrast in thicker tissue. Single-cell labeling might be possible via the puffing of the dye on exposed somata, as we were able to do in dissociated neurons. A similar approach has been used for DiI/DiO labeling in slices (Gan et al., 2000; O’brien and Lummis, 2006). This approach would have the benefit of not labeling the intracellular membranes (i.e., membranes not implicated in electrical conduction), hence favoring S/N. The next requirement for the slice configuration would be two-photon absorption. Fromherz et al. (2008) in fact showed high voltage sensitivity of ANNINE-6plus under two-photon excitation (Fromherz et al., 2008). Future work is therefore needed to determine whether this label will be usable in brain slice.
The simple optical approach to record membrane potentials in dendritic spines with the VSD ANNINE-6plus in cultured neurons might contribute to address long-standing questions of neuroscience concerning neuronal communication and plasticity with minimal photodamage. It might even allow direct observation of synaptic potentials in dendritic spines. The ease with which spiking frequencies with single AP resolution in single cultured neuron could be measured without the need of a patch pipette should stimulate studies on the cellular and molecular regulation of neuronal excitability. As this new approach is simple to implement, it may become a standard and widely used technique by neuroscientists.
Materials and Methods
Neuronal Cultures and Transfection
Details of the preparation of rat hippocampal cultures have already been described (Hudmon et al., 2005). Briefly, rat hippocampi were dissected out of postnatal day 1 (P1) rats and cells were dissociated both enzymatically and mechanically. After dissociation cells were washed, centrifuged and plated on poly-D-lysine-coated Aclar coverslips at low density (50000 cells/ml). Growth media (1 ml/well) consisted of Neurobasal and B27, supplemented with penicillin/streptomycin (50 U/ml; 50 μg/ml), and 0.5 mM L-glutamax (Invitrogen). Cytosine arabinofuranoside (ARA-C; 5 μM; sigma) was added 48 h after plating to reduce the number of glial cells. After 4 days in culture and twice a week thereon, half of the growth medium was replaced with medium without ARA-C. Neurons were cultured between 11 and 14 DIV before use. For voltage measurements in spines, neurons were transfected with cerulean plasmid using Lipofectamine 2000 (Invitrogen) for 5 h (as described in Hudmon et al., 2005).
ANNINE-6plus Labeling
ANNINE-6plus was purchased from Sensitive Farbstoffe GBR (Münich, Germany). The labeling solution consisted of standard extracellular solution as described thereafter, supplemented with the dye at a final concentration of 14 μM. It was prepared from stock solutions of ANNINE-6plus concentrated at 700 μM in pure water and stocked at −30°C. Labeling was achieved by immersing neurons in the labeling solution for 5 min, followed by a washing period of 10 min, prior to imaging. Labeling and imaging were performed at room temperature.
Electrophysiology
Coverslips were then transferred to the recording chamber and continually superfused with regular extracellular solution containing (in mM):130 NaCl, 10 Na-HEPES, 10 D-Glucose, 1.2 CaCl2, 1 MgCl2, 3 KCl. The pH was adjusted to 7.4 with HCl and the osmolarity was around 260 mOsmol/l. Whole-cell patch-clamp recordings were obtained using an EPC 9 amplifier (HEKA) and 7–8 MΩ pipettes filled with intracellular solution containing (in mM) 130 K-Gluconate, 10 K-HEPES, 3 NaCl, 4 Mg-ATP, 0.4 Na-GTP, 10 phosphocreatine disodium salt. The pH was adjusted to 7.4 with KOH and the osmolarity was around 240 mOsmol/l. The software PULSE from HEKA was used for acquisition.
Measurements of Membrane Potential Variations
Measurements were performed using a Zeiss LSM510 META-Axioskop FS2 Plus confocal microscope using a 63× water immersion objective (Plan-APOCHROMAT 63× W NA = 1 IR) with a working distance of 2.1 mm. Under depolarizing conditions, the absorption and emission spectra of ANNINE-6plus (Kuhn et al., 2004; Zhou et al., 2007; Fromherz et al., 2008) are blue shifted. Thus, to maximize detection of membrane voltage change, we excited the dye with a laser line in the red tail of the absorption spectrum (514 nm, argon laser), where the absorption coefficient is reduced. Because the number of fluorescence photons is low, we collected as much photons as possible using a long pass filter (LP 560 nm) and fully opened the pinhole. In contrast, to generate images of the ANNINE-6plus labeled neurons, we excited the dye at 458 nm (Fromherz et al., 2008). The average power of the excitation beam at the sample either at 458 or 514 nm never exceeded 70 μW. For visualization of the morphological dye Cerulean, excitation was set at 458 nm while fluorescence was collected between 480 and 520 nm. In this spectral window, there is no contamination from ANNINE-6plus fluorescence. Measurements of ANNINE-6plus fluorescence during membrane voltage fluctuations were carried out in line-scanning mode, with a pixel dwell time of 4.5 μs and ∼3 μm long lines, composed of 128 pixels, totaling 0.576 ms of acquisition time per line. Thus, a 500-ms sampling time (single trial) consisted in 800 lines recorded in fly-back mode. Except for Figure 6, each sampling trial was synchronized with a stimulation protocol: either current injection in current clamp mode (1 nA for 2 ms) for AP elicitation or voltage ramp in voltage clamp mode (30 ms steps ranging from −40 to +100 mV with 10 mV increments) for ΔF vs. ΔV quantification. The synchronization was achieved thanks to a TTL pulse triggered from the LSM 510 software to the HEKA amplifier. Each sampling trial was separated by a 5-s interval.
In order to create fluorescence time profile from line scans, the intensity of the 128 pixels forming a single line were averaged resulting in an effective temporal resolution of the experiments around 0.5 ms. Fluorescence time profiles are expressed as the ΔF/F ratio vs. time; where ΔF/F = (F(t)–F)/F, F(t) is the emitted fluorescence at time t while F is the fluorescence under basal conditions (i.e., recorded at Vm = −60 mV). Images were analyzed with ImageJ (National Institutes of Health, Bethesda, MD, USA; http://rsb.info.nih.gov/ij) while data analysis and graphics were performed with Igor Pro (WaveMetrics). Data were filtered using a Savitzky–Golay smoothing filter (Order 5). This filter was preferred to more conventional binomial smoothing because it is known to preserve high frequencies.
Absorption and Fluorescence Spectra
The absorption spectrum of ANNINE-6plus (1 mM in water) was measured in vitro with a spectrophotometer HP model 8452A. Emission spectrum of ANNINE-6plus was measured in hippocampal neurons with the META spectral detector of the Zeiss LSM510 confocal microscope with excitation at 458 nm (detection ranges from 511 to 671 nm with ∼10 nm steps).
Membrane Input Resistance and Pipette Access Resistance Measurements
We imposed a pulse test (30 ms, 10 mV) to voltage-clamped neurons and recorded the induced current time profile. The ratio between the amplitude of the voltage pulse and the recorded peak current gives the access resistance of the patch pipette whereas the ratio between the amplitude of the voltage pulse and the current at the plateau gives the membrane input resistance of the neuron under investigation.
Cell Capacitance Measurements
We imposed a pulse test (10 ms, 10 mV) to voltage-clamped neurons, recorded the induced current time profile and fit a bi-exponential function to it. This allows extracting two time constants (t1 and t2) each one having its own amplitude (A1 and A2). Then we defined an effective time constant τeff as the linear combination of t1 and t2:
Cell capacitance is defined as the ratio of τeff over the input resistance Rin.

Conflict of Interest Statement
The authors declare that the research was conducted in the absence of any commercial or financial relationships that could be construed as a potential conflict of interest.
Acknowledgments
We thank Francine Nault for preparing the neuronal cultures and Hugues Dufour for technical assistance. We also thank Dr. Thomas Knöpfel for helpful discussions. Research was supported by the Canadian Institutes of Health Research (CIHR), the Natural Science and Engineering Research Council of Canada (NSERC), the Canadian Institute for Photonic Innovations (TEN program), and the Canadian research chair program. Stéphane Pagès was supported the NeuroPhysics Training grant (CIHR). Daniel Côté is the holder of a Canada Research Chair in Biophotonics. Paul De Koninck is a CIHR Young Investigator Awardee.
References
Akemann, W., Mutoh, H., Perron, A., Rossier, J., and Knopfel, T. (2010). Imaging brain electric signals with genetically targeted voltage-sensitive fluorescent proteins. Nat. Methods 7, 643–649.
Antic, S., and Zecevic, D. (1995). Optical signals from neurons with internally applied voltage-sensitive dyes. J. Neurosci. 15, 1392–1405.
Ayzenshtat, I., Meirovithz, E., Edelman, H., Werner-Reiss, U., Bienenstock, E., Abeles, M., and Slovin, H. (2010). Precise spatiotemporal patterns among visual cortical areas and their relation to visual stimulus processing. J. Neurosci. 30, 11232–11245.
Bradley, J., Luo, R., Otis, T. S., and Digregorio, D. A. (2009). Submillisecond optical reporting of membrane potential in situ using a neuronal tracer dye. J. Neurosci. 29, 9197–9209.
Brown, C. E., Aminoltejari, K., Erb, H., Winship, I. R., and Murphy, T. H. (2009). In vivo voltage-sensitive dye imaging in adult mice reveals that somatosensory maps lost to stroke are replaced over weeks by new structural and functional circuits with prolonged modes of activation within both the peri-infarct zone and distant sites. J. Neurosci. 29, 1719–1734.
Caporale, N., and Dan, Y. (2008). Spike timing-dependent plasticity: a Hebbian learning rule. Annu. Rev. Neurosci. 31, 25–46.
Djurisic, M., Antic, S., Chen, W. R., and Zecevic, D. (2004). Voltage imaging from dendrites of mitral cells: EPSP attenuation and spike trigger zones. J. Neurosci. 24, 6703–6714.
Dombeck, D. A., Blanchard-Desce, M., and Webb, W. W. (2004). Optical recording of action potentials with second-harmonic generation microscopy. J. Neurosci. 24, 999–1003.
Dombeck, D. A., Sacconi, L., Blanchard-Desce, M., and Webb, W. W. (2005). Optical recording of fast neuronal membrane potential transients in acute mammalian brain slices by second-harmonic generation microscopy. J. Neurophysiol. 94, 3628–3636.
Froemke, R. C., Debanne, D., and Bi, G. Q. (2010a). Temporal modulation of spike-timing-dependent plasticity. Front. Synaptic Neurosci. 2:19. doi: 10.3389/fnsyn.2010.00019
Froemke, R. C., Letzkus, J. J., Kampa, B. M., Hang, G. B., and Stuart, G. J. (2010b). Dendritic synapse location and neocortical spike-timing-dependent plasticity. Front. Synaptic Neurosci. 2:29. doi: 10.3389/fnsyn.2010.00029
Fromherz, P., Hubener, G., Kuhn, B., and Hinner, M. J. (2008). ANNINE-6plus, a voltage-sensitive dye with good solubility, strong membrane binding and high sensitivity. Eur. Biophys. J. 37, 509–514.
Gan, W. B., Grutzendler, J., Wong, W. T., Wong, R. O., and Lichtman, J. W. (2000). Multicolor “DiOlistic” labeling of the nervous system using lipophilic dye combinations. Neuron 27, 219–225.
Grewe, B. F., Bonnan, A., and Frick, A. (2010). Back-propagation of physiological action potential output in dendrites of slender-tufted L5A pyramidal neurons. Front. Cell. Neurosci. 4:13. doi: 10.3389/fncel.2010.00013
Grinvald, A., Ross, W. N., and Farber, I. (1981). Simultaneous optical measurements of electrical activity from multiple sites on processes of cultured neurons. Proc. Natl. Acad. Sci. U.S.A. 78, 3245–3249.
Holthoff, K., Zecevic, D., and Konnerth, A. (2010). Rapid time course of action potentials in spines and remote dendrites of mouse visual cortex neurons. J. Physiol. (Lond.) 588, 1085–1096.
Hudmon, A., Lebel, E., Roy, H., Sik, A., Schulman, H., Waxham, M. N., and De Koninck, P. (2005). A mechanism for Ca2+/calmodulin-dependent protein kinase II clustering at synaptic and nonsynaptic sites based on self-association. J. Neurosci. 25, 6971–6983.
Jiang, J., and Yuste, R. (2008). Second-harmonic generation imaging of membrane potential with photon counting. Microsc. Microanal. 14, 526–531.
Knopfel, T., Lin, M. Z., Levskaya, A., Tian, L., Lin, J. Y., and Boyden, E. S. (2010). Toward the second generation of optogenetic tools. J. Neurosci. 30, 14998–15004.
Kuhn, B., Denk, W., and Bruno, R. M. (2008). In vivo two-photon voltage-sensitive dye imaging reveals top-down control of cortical layers 1 and 2 during wakefulness. Proc. Natl. Acad. Sci. U.S.A. 105, 7588–7593.
Kuhn, B., and Fromherz, P. (2003). Anellated hemicyanine dyes in a neuron membrane: molecular stark effect and optical voltage recording. J. Phys. Chem. B 31, 7903–7913.
Kuhn, B., Fromherz, P., and Denk, W. (2004). High sensitivity of Stark-shift voltage-sensing dyes by one- or two-photon excitation near the red spectral edge. Biophys. J. 87, 631–639.
Lisman, J., and Spruston, N. (2010). Questions about STDP as a general model of synaptic plasticity. Front. Synaptic Neurosci. 2:140. doi: 10.3389/fnsyn.2010.00140
Nuriya, M., Jiang, J., Nemet, B., Eisenthal, K. B., and Yuste, R. (2006). Imaging membrane potential in dendritic spines. Proc. Natl. Acad. Sci. U.S.A. 103, 786–790.
O’brien, J. A., and Lummis, S. C. (2006). Diolistic labeling of neuronal cultures and intact tissue using a hand-held gene gun. Nat. Protoc. 1, 1517–1521.
Palmer, L. M., and Stuart, G. J. (2009). Membrane potential changes in dendritic spines during action potentials and synaptic input. J. Neurosci. 29, 6897–6903.
Petersen, C. C., Grinvald, A., and Sakmann, B. (2003). Spatiotemporal dynamics of sensory responses in layer 2/3 of rat barrel cortex measured in vivo by voltage-sensitive dye imaging combined with whole-cell voltage recordings and neuron reconstructions. J. Neurosci. 23, 1298–1309.
Sacconi, L., Dombeck, D. A., and Webb, W. W. (2006). Overcoming photodamage in second-harmonic generation microscopy: real-time optical recording of neuronal action potentials. Proc. Natl. Acad. Sci. U.S.A. 103, 3124–3129.
Stuart, G. J., and Sakmann, B. (1994). Active propagation of somatic action potentials into neocortical pyramidal cell dendrites. Nature 367, 69–72.
Vignali, S., Peter, N., Ceyhan, G., Demir, I. E., Zeller, F., Senseman, D., Michel, K., and Schemann, M. (2010). Recordings from human myenteric neurons using voltage-sensitive dyes. J. Neurosci. Methods 192, 240–248.
Wu, J. Y., Guan, L., and Tsau, Y. (1999). Propagating activation during oscillations and evoked responses in neocortical slices. J. Neurosci. 19, 5005–5015.
Zhou, W. L., Yan, P., Wuskell, J. P., Loew, L. M., and Antic, S. D. (2007). Intracellular long-wavelength voltage-sensitive dyes for studying the dynamics of action potentials in axons and thin dendrites. J. Neurosci. Methods 164, 225–239.
Appendix
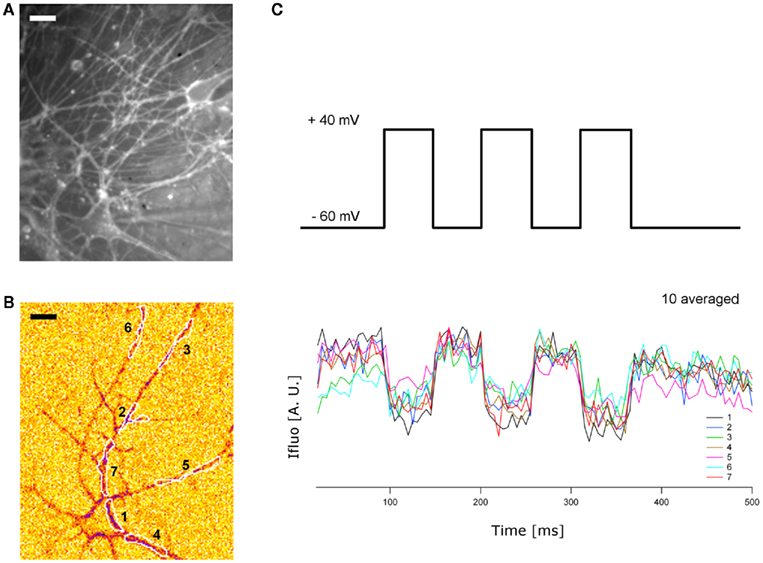
Figure A1. Wide-field imaging of ANNINE-6plus labeled neurons. (A) Cultured hippocampal neurons labeled with ANNINE-6plus and captured with CCD camera (Photometrics, Cascade 512B, Roper Scientific) on a Zeiss Axioskop FS2 Plus microscope using a 63× water immersion objective (Plan-APOCHROMAT 63× W NA = 1 IR) with a working distance of 2.1 mm (excitation filter: band pass BP460/50, dichroic: FT510, emission filter: long pass LP515) (B) Patch-clamped neuron from field in (A) imaged during a 100 mV depolarizing pulse (band pass excitation filter: FF02-510/10-25; dichroic filter: FF520-Di02-25 × 36; emission filter: BLP01-532R-25, SEMROCK), yielding a decrease of ANNINE-6plus fluorescence on the neuronal membranes. Seven ROIs are drawn [see plots in (C)]. Scale bars 10 μm. (C) Top: Stimulation protocol of three pulses (50 ms, 100 mV) imposed in voltage clamp configuration. Bottom: ANNINE-6plus fluorescence intensity changes over time, measured in seven different ROIs identified in (B). The integration time for each image was 5 ms with up to 100 consecutive frames and a 2 × 2 binning. Time series of images were synchronized with electrophysiology setup through a TTL pulse.
Keywords: ANNINE-6plus, voltage-sensitive dye, optical recording, dendritic spine, membrane potential
Citation: Pagès S, Côté D and De Koninck P (2011) Optophysiological approach to resolve neuronal action potentials with high spatial and temporal resolution in cultured neurons. Front. Cell. Neurosci. 5:20. doi: 10.3389/fncel.2011.00020
Received: 07 June 2011;
Accepted: 15 September 2011;
Published online: 10 October 2011.
Edited by:
Andreas Frick, INSERM, FranceReviewed by:
Knut Holthoff, Universitätsklinikum Jena, GermanySrdjan D. Antic, University of Connecticut Health Center, USA
Copyright: © 2011 Pagès, Côté and De Koninck. This is an open-access article subject to a non-exclusive license between the authors and Frontiers Media SA, which permits use, distribution and reproduction in other forums, provided the original authors and source are credited and other Frontiers conditions are complied with.
*Correspondence: Paul De Koninck, Centre de Recherche Université Laval Robert-Giffard, 2601 de la Canardière, Québec, QC, Canada G1J 2G3. e-mail: paul.dekoninck@crulrg. ulaval.ca