Visualizing leukocyte trafficking in the living brain with 2-photon intravital microscopy
- 1Immune Imaging Program, The Centenary Institute, Newtown, NSW, Australia
- 2Sydney Medical School, University of Sydney, Sydney, NSW, Australia
- 3Department of Medicine, Centre for Inflammatory Diseases, Monash University, Melbourne, VIC, Australia
- 4Cytometry and Imaging, The Centenary Institute, Newtown, NSW, Australia
- 5Discipline of Dermatology, University of Sydney, Sydney, NSW, Australia
- 6Department of Dermatology, Royal Prince Alfred Hospital, Camperdown, NSW, Australia
Intravital imaging of the superficial brain tissue in mice represents a powerful tool for the dissection of the cellular and molecular cues underlying inflammatory and infectious central nervous system (CNS) diseases. We present here a step-by-step protocol that will enable a non-specialist to set up a two-photon brain-imaging model. The protocol offers a two-part approach that is specifically optimized for imaging leukocytes but can be easily adapted to answer varied CNS-related biological questions. The protocol enables simultaneous visualization of fluorescently labeled immune cells, the pial microvasculature and extracellular structures such as collagen fibers at high spatial and temporal resolution. Intracranial structures are exposed through a cranial window, and physiologic conditions are maintained during extended imaging sessions via continuous superfusion of the brain surface with artificial cerebrospinal fluid (aCSF). Experiments typically require 1–2 h of preparation, which is followed by variable periods of immune cell tracking. Our methodology converges the experience of two laboratories over the past 10 years in diseased animal models such as cerebral ischemia, lupus, cerebral malaria, and toxoplasmosis. We exemplify the utility of this protocol by tracking leukocytes in transgenic mice in the pial vessels under steady-state conditions.
Introduction
Background
The immune system is a highly complex and dynamic network of immune cells that travel throughout the body under both normal and inflammatory conditions (Matzinger, 1994; Kunkel and Butcher, 2003; Germain et al., 2006; Cahalan and Parker, 2008; Littman and Rudensky, 2010; Randolph, 2011; Ousman and Kubes, 2012; Victora and Nussenzweig, 2012). It is therefore important to understand how immune cells are recruited to organs and how they behave after their extravasation into specific tissue microenvironments, including the brain (Cahalan et al., 2002; Ransohoff et al., 2003; Mrass and Weninger, 2006; Hickey and Kubes, 2009; Mrass et al., 2010; Wilson et al., 2010; Ousman and Kubes, 2012; Ransohoff and Engelhardt, 2012; Sallusto et al., 2012). While epifluorescence microscopy based approaches have been used for a long time to study leukocyte-endothelial interactions (von Andrian, 1996; Engelhardt and Wolburg, 2004; Sumen et al., 2004; Engelhardt and Ransohoff, 2005; Teixeira et al., 2010), newer techniques of optical imaging such as 2-photon intravital microscopy (2P-IVM) has recently expanded the scope for studying activities of immune cells such as leukocytes within the central nervous system (CNS) (Helmchen and Denk, 2005; Mrass and Weninger, 2006; Bartholomaus et al., 2009; Padmanabhan et al., 2010; Wilson et al., 2010; Harris et al., 2012). Analysis of not only how cells are recruited to the CNS but also how they navigate through the brain parenchyma and interact with other cells, stromal and neuronal structures as well as pathogens has provided a whole new vista of information for immunologists, neuroscientists, and clinicians alike (Mrass and Weninger, 2006; Bartholomaus et al., 2009; Coombes and Robey, 2010; Kawakami and Flugel, 2010; Wilson et al., 2010; Amornphimoltham et al., 2011; McGavern and Kang, 2011).
Due to easier accessibility to 2-photon imaging systems in recent times, intravital imaging of the CNS is fast becoming the preferred modality for in vivo analysis of brain and spine tissue (Siffrin et al., 2010; Herz et al., 2011) fuelling a demand for simple and reliable descriptive imaging protocols as well as affordable equipment for mouse preparation. In this paper, we provide a 2P-IVM-based intravital brain-imaging (2P-IBI) model that addresses some of these requirements. The protocol primarily aims to provide a practical guide for investigators new to the brain-imaging field. It is optimized for tracking the behavior of leukocytes within the vasculature of the brain but can be easily adapted however to address varied CNS-related biological questions in the living brain.
Description of the Model
Our 2P-IBI model uses a cranial window preparation that is best suited for short imaging sessions of up to 1.5 h. Preparatory time for a routine session will take 70 min, with data acquisition of approximately 6 mm of surface area of the cerebral cortex taking ~1.5 h. Where imaging must be extended beyond 1.5 h, 2P-IBI can be tailored for longer sessions of up to 6 h. For this we provide add-on steps in the protocol, involving the installation of a superfusion chamber that continuously pumps artificial cerebrospinal fluid (aCSF) over the exposed brain tissue and simulates the normal brain microenvironment (James et al., 2003; Lister and Hickey, 2006; Norman et al., 2008; Wong et al., 2008; Nie et al., 2009). An hour needs to be allocated for the functional operation of the superfusion chamber thus taking the total preparatory time to approximately 2 h. The design and dimensions of the equipment used in 2P-IBI are suited for mice but can be adapted for other rodents such as rats. The protocol provides a comprehensive list of equipment, reagents, and procedures required for setting up a similar model so that a non-specialist can acquire this capability simply by implementing this report. It also guides in the identification and management of potential trouble spots that arise throughout the procedure.
Advantages of the Model
The stereotaxic frame used in 2P-IBI for conducting surgical procedures in mice has custom-built designs that render it user-friendly and cost-effective. This excludes having to purchase and modify potentially bulky commercial stereotaxic frames offered by most manufacturers. We provide the design and dimensions for building such a frame. The frame is designed to fit within the small area typically available between the nose of the dipping objective and the stage of the microscope. Although the technique is optimized for leukocyte imaging, 2P-IBI can find varied applicability including for the study of the microenvironment of solid tumors (Yuan et al., 1994), microglial function (Davalos et al., 2005), and amyloid plaque deposition in Alzheimer disease (Robbins et al., 2006). 2P-IBI does not require extensive surgical preparation for absolute sterility as it is performed on anesthetized non-recovery animals. The short preparation time of ~70 min is a particularly useful feature for studying diseased animal models where manifestation of clinical symptoms within a very narrow time “window” can impose rigid time limits for data acquisition. The cranial window preparation used in 2P-IBI however requires removal of the skull, rendering the brain susceptible to pressure and temperature changes over time, hastening the decline of the animal and reducing recording time (Yoder, 2002). More importantly, even a small drop in body temperature is sufficient to reduce leukocyte motility and behavior resulting in confounding artifacts in acquired data (Li et al., 2012). Therefore where imaging is expected to extend longer than 1.5 h, we recommend installation of our superfusion chamber wherein the dura is excised while the brain is maintained under a continuous intracranial pressure (ICP) of 5–8 mm Hg. Thus 2P-IBI serves the requirements of both short and long recording sessions.
The quality of the cranial window preparation in 2P-IBI enables the resolution simultaneously of several different fluorescently labeled components within the CNS, including the pial and cerebral microvasculature, fluorescently labeled red blood cells, platelets and leukocytes as well as non-labeled structures such as collagen fibers using second harmonic generation (SHG) signals. Penetrance of ~250–300 μm into the cerebral cortex allows these structures to be visualized within the deeper regions of the brain. The protocol is particularly useful for (1) characterization of leukocyte migration, behavior and cross-talk and the molecular mechanisms that underlie such processes (Bartholomaus et al., 2009) (2) dissection of immune-surveillance mechanisms in healthy brain tissue (Nimmerjahn et al., 2005) (3) in-depth analysis of pathogen-leukocyte interaction and identifying the precise time point when immune responses are initiated in vivo (Hickman et al., 2009; Coombes and Robey, 2010) (4) study of immune-evasion mechanisms of pathogens (Kamerkar and Davis, 2012) and last but not the least (5) understanding the impact of the stromal and neural components of the brain microenvironment on the host immune response (Constantin et al., 2009; Wake et al., 2009).
Limitations of the Model
During inflammation, leukocytes roll along the endothelial wall of the blood vessel up to 20–50 μm/sec (Carvalho-Tavares et al., 2000; Pai et al., unpublished observations). The limited scan speed of a point line scanner as used in our microscope setup can be restrictive while tracking these rolling cells. Tracking of rolling cells can be achieved however by scanning a single Z plane. While this strategy is useful, loss of information from adjoining Z planes can undermine an important advantage 2P-IBI offers—generation of high-resolution four dimensional (x,y,z,t) images. Further, collecting brain images from a single Z plane can augment the effect of “bobbing,” a ripple effect of respiration-induced movements on the brain (Belluscio, 2005). The movement can create drift in the image where it is difficult to reproducibly scan the same Z plane at each time interval. To circumvent some of these limitations, a trigger box system that times the image acquisition to the pulse of the animal can be used. Another way around this problem is to use high-speed acquisition modalities offered by some 2-Photon manufacturers such as LaVision BioTec's Trimscope series. This system provides greater scan speed by parallelization of the excitation process through the use of reflective mirrors to split the laser beam into a line of up to 64 beamlets (http://dx.crossref.org/10.1529%2Fbiophysj.106.102459).
Comparison with Other Methods
There are primarily two types of cranial window preparations used for live brain imaging: (1) A thinned skull window preparation generally used for imaging large structures such as the cortex, amyloid plaques, and blood vessels that can also be used for imaging leukocytes (Fabene et al., 2008; Yang et al., 2010; Grutzendler et al., 2011) and (2) A closed cranial window preparation suited for imaging neuronal structures as well as for imaging leukocytes (Mostany and Portera-Cailliau, 2008; Cabrales and Carvalho, 2010). 2P-IBI uses a closed cranial window preparation that circumvents the main limitation of using thinned skull preparations-spherical aberration, reduction in 2-photon excitation or distortion in fluorescence emissions due to non-uniformity in the thinned skull (Yang et al., 2010). However a closed cranial window preparation has its own disadvantages—(1) removal of the skull rendering the brain susceptible to pressure and temperature changes over time leading to confounding artifacts (Yoder, 2002) and (2) induction of significant inflammation requiring the use of anti-inflammatories/antibiotics or a waiting period post-surgery before experiments can be initiated (Pan and Gan, 2008; Holtmaat et al., 2009; Yang et al., 2010). 2P-IBI overcomes these disadvantages by using a two-part approach—a closed cranial window preparation is used while imaging for short periods of <1.5 h and a superfusion chamber is installed as an add-on step while imaging for extended periods for up to 6 h. The chamber simulates the brain microenvironment and prevents activation of leukocytes despite the exclusion of anti-inflammatory agents. This model has been collated together based on our experience in studying immune responses in vivo within the skull bone marrow (Cavanagh et al., 2005) and CNS (Mrass and Weninger, 2006; John et al., 2009, 2010, 2011; Wilson et al., 2009, 2010; Harris et al., 2012) as well as in the study of disease models such as cerebral ischemia (Wong et al., 2008), lupus (James et al., 2003; Lister and Hickey, 2006; Norman et al., 2008), toxoplasmosis (John et al., 2009; Wilson et al., 2009, 2010), and leishmaniasis (Ng et al., 2008) among others.
Experimental Setup—Points to Consider
Fluorophores
Generally, existing guidelines for confocal microscopy suffice when selecting fluorophores for 2P-IBI (for guidelines refer to Hibbs, 2004). It is important to evaluate whether the excitation wavelength of the fluorophore is within the tunable range of the laser. Enhanced green fluorescent protein (GFP) is one of the most effective fluorophores followed by its yellow (YFP) and cyan (CFP) variants. Where multiple cell types need to be detected choose a combination of fluorophores that can be simultaneously excited with minimal spectral emission overlap. The mouse dural membrane, unlike rats, is transparent and permeable to signals emitted from most fluorophores including GFP (Sigler and Murphy, 2010). For fluorophores to which the dura is impermeable such as voltage sensitive fluorescent dyes (VSDI) (Grinvald and Hildesheim, 2004), we recommend installation of our superfusion chamber wherein the dura can be excised. Visualizing endogenously fluorescent cells in transgenic reporter mice is the most attractive approach for visualizing the trafficking of cells in vivo (Mempel et al., 2006). Alternately, cells can be purified, labeled with permeable dyes such as CMTMR [5-(and-6)-(((4-Chloromethyl)Benzoyl)Amino)Tetramethylrhodamine], rhodamine 6G, CFSE (Carboxyfluorescein diacetate succinimidyl ester) or with antibody conjugated to dyes such as the Alexa-Fluor series and transferred into recipient mice for visualization (Ng et al., 2011).
Leukocyte-Mediated Inflammation
Immune cells such as dendritic cells (DC), neutrophils, macrophages, and monocytes form the first line of defense against pathogens (Auffray et al., 2007). These innate cell types are the first to be recruited and/or activated (in a timespan of minutes) at the site of inflammation, infection or injury (Ng et al., 2008, 2011). Any study of leukocytes that involves an invasive surgical procedure therefore must consider the risk of non-specifically recruiting the very immune cells that are the subject of investigation. Trauma-induced recruitment of immune cells to the surgical site can potentially compromise data interpretation and jeopardize the study. Similarly, a small drop in body temperature is sufficient to reduce leukocyte motility and behavior (Li et al., 2012) resulting in confounding artifacts in acquired data. In our experience, approximately 5% of the animals have to be excluded from further experimentation/analysis due to inflammation induced from the surgical procedure. The normal brain and CNS vasculature does not support rolling and firm adherence of leukocytes (Carvalho-Tavares et al., 2000). As such, induction of rolling and adhesion in the pial microvasculature serves as an internal control in our studies for the induction of inflammation due to animal preparation. As an additional quality control, we have analyzed leukocyte recruitment post-surgery using confocal microscopy. Under optimal conditions, we found no evidence of leukocyte recruitment in either the operated or non-operated hemispheres of formalin-fixed whole mount sections of the brain (data not shown).
Brain Tissue Homeostasis
The brain tissue is highly sensitive to subtle changes in its microenvironment. Studies have reported that the mere opening of the dura and exposure of the brain to atmospheric pressure can result in swelling and protrusion of the brain through the window (Kawamura et al., 1990). Further, the CSF has a “sink action” by which the products of brain metabolism such as CO2, lactate and hydrogen ions are removed as CSF gets absorbed into the blood stream (Ropper et al., 2005). Even the slightest retention of CO2 therefore raises the blood PCO2 and correspondingly causes a decrease in the pH of CSF resulting in potent vasodilation, increased cerebral blood flow and intracranial pressure (ICP) (Ropper et al., 2005). Conversely an increase in the pH of CSF can cause a decrease in ICP. In the technique described herein, the integrity of the dura is retained for short imaging sessions of up to 1.5 h. Retaining the dura helps minimize alteration in vascular dynamics or brain tissue homeostasis (Kawamura et al., 1990; Holtmaat et al., 2009). In line with this, the diameter of 28 pial arterioles and venules (0.14 mm2 total area) studied remained virtually unchanged throughout the observation period post-surgery (Pai et al., unpublished observations). We do not have enough data to provide information on the stability of this preparation for imaging sessions longer than 1.5 h duration. Where imaging sessions are expected to last longer than 1.5 h, we install the superfusion chamber. In this approach, the dura is excised and the aCSF circulating through the chamber is used to maintain the brain under a continuous ICP of 5–8 mm Hg. The chamber also maintains optimum pH and gas tension by constant bubbling of 12% O2, 5% CO2, and 83% N2 through aCSF where imaging sessions will extend up to 6 h (James et al., 2003; Lister and Hickey, 2006; Norman et al., 2008; Wong et al., 2008; Nie et al., 2009).
Breach in BBB
The blood–brain barrier (BBB) is a neurological unit that maintains the “immune privilege” status of the brain by restricting the passage of solutes as well as the extravasation of cells and pathogens from the blood vessel into the parenchyma (Streilein, 1993; Mrass and Weninger, 2006; Engelhardt and Coisne, 2011; Engelhardt and Ransohoff, 2012; Masocha and Kristensson, 2012; Takeshita and Ransohoff, 2012). In line with this, leakage of dextran rhodamine was not observed from blood vessels of healthy C57BL/6 mice that underwent our 2P-IBI procedure (Saria and Lundberg, 1983 and data not shown; Kawamura et al., 1990). However in diseased animal models of the CNS such as experimental autoimmune encephalitis (EAE) or experimental cerebral malaria (ECM) (Renia et al., 2012), a breach in the BBB was associated with leakage of vascular probes into the parenchyma. Where the clinical disease is associated with a breach in BBB, low molecular weight vascular probes such as Evans blue (which binds to albumin following intravenous administration) or Na+–fluorescein are suboptimal as their low molecular weight facilitates their extravasation (Saria and Lundberg, 1983; Kawamura et al., 1990; Renia et al., 2012). We use high molecular weight dextran in the inflamed brain (MW 2,000,000), as they are lower sensitivity indicators of barrier damage. Vascular probes must always be administered intravenously (i.v) after all surgical procedures and associated bleeding has come to a complete stop as persistent bleeding will allow vascular probes to leak out and obscure the cortical structures.
Movement
There are several sources of movement that can impact on the quality of the brain image during data acquisition. A regular small amplitude pulsatile movement ranging from 2–5 Hz (cycles/second) that is synchronized to the heartbeat can reflect in the image (Belluscio, 2005; Holtmaat et al., 2009; Yang et al., 2010). Large amplitude respiration-induced movements caused by chest motion during breathing can also cause drifts in the image. Our studies have determined that there are primarily two parameters that influence these movements: (1) state of anesthesia of the experimental mice and (2) effective head restraint. (Note: Descriptive procedures and a troubleshooting guide are provided herein on how to avoid these movement artifacts).
Materials
Reagents
- Artificial cerebrospinal fluid (132 mM NaCl, 2.95 mM KCl, 1.71 mM CaCl2.2H20, 1.4 mM MgSO4, 6.7 mM Urea, 24.6 mM NaHCO3, 3.71 mM Glucose, pH 7.4) (aCSF must be pre-warmed to 37°C)
- Dental glue (Vertex, Cat No. XY244L01)
- Bone wax (Lukens, Cat No. 2009-05)
- Accelerant (Loctite 406, Cat No. 40633)
- Dextran rhodamine (Invitrogen, Cat No. D7139)
- Normal saline (Baxter Healthcare, Cat No. F8B123)
- Hydrogen peroxide (Merck, Cat No. 10366)
- High vacuum silicone grease (Sigma, Cat No. MKBD 9670)
- Gelfoam (Pfizer, Cat No. 09-0891-04-015)
- PBS (potassium phosphate monobasic 0.2 g per liter, potassium chloride 0.2 g per liter, sodium chloride 8.0 g per liter, sodium phosphate dibasic (anhydrous) 1.15 g per liter)
- Ketamine (Cenvet, Cat. No. K1000)
- Xylazine (Cenvet, Cat. No. X5010)
- Buprenorphine (Cenvet, Cat. No. T9840)
Mice
Procure 6–8-week old mice. Mice strains tested for this protocol includes ROSA26 (Muzumdar et al., 2007), DPE-GFP (Mempel et al., 2006), CD11c-YFP (Lindquist et al., 2004), and Macgreen (Sasmono et al., 2003) all on a C57BL/6 background. All procedures described here were approved either by the University of Sydney Animal Ethics Committee or the Monash Medical Centre Animal Ethics Committee.
WARNING! All experimental work involving live animals requires official approval from the institutional and/or regional animal ethics committee.
Reagent Set-Up
Ketamine, Xylazine, and Buprenorphine
Administer Ketamine at 100 mg/kg of body weight and Xylazine at 10 mg/kg of body weight. A freshly prepared mixture of Ketamine and Xylazine provides effective anesthesia and analgesia for 20–30 min. Administering a single dose of Buprenorphine, a non-steroidal opiate at 100 μg/kg of body weight provides lasting pain relief with minimal side effects. To check its anesthetic state, the experimental mouse must be monitored regularly every 5 min for awareness signs such as whisker twitching, palpebral (blink) reflex, pedal withdrawal reflex and respiration rate. Surgical procedures must begin only after the animal enters a deep state of anesthesia. Booster doses of Ketamine at 30 mg/kg of bodyweight and Xylazine at 3 mg/kg of body weight can be administered as required.
WARNING! Ketamine and Buprenorphine are narcotic drugs that must be handled according to institutional and local safety regulations.
Equipment
- Cover glass (HD Scientific, Cat No. HD LD2222 1.01P0)
- Cotton balls (Johnson & Johnson)
- Curved splinter forceps (WPI-World Precision Instruments, Cat No. 14187)
- Scissors (WPI, Cat No. 14393)
- Scalpel (WPI, Cat No. 500236)
- Scalpel blade (Allgaier Instrumente, Cat No. 02-040-015)
- Animal heat pad (Fine Science Tools, Cat No. 21060-00)
- Rectal probe (Fine Science Tools, Cat No. 21060-01)
- Ear Bars (WPI, Cat No. 502056)
- Peristaltic pump (John Morris Scientific, Cat No. F155001, F117604)
- Thermostat TR-200 (Fine Science Tools, Cat No. 21052-00)
- Polyethylene tubing (BD, Cat No. 427420)
- Cotton tipped applicators (Puritan Medical Products company, Cat No. 427420)
- Omni drill 35 (WPI, Cat No. 503599)
- Burs & Bits (WPI, Cat No. 503599)
- Phillips head screwdriver (JBS, Cat No. 6768098)
- Tape (Hystick)
- Blotting paper (Whatman, Cat No. 3030917) (cut into 2″ × 2″ pieces)
- Insulin syringe needle (BD, Cat No. 326105)
- Transfer pipettes (Biologix Research Company, Cat. No. 30-0135)
- Dissection microscope (Leica M80, Leica)
- Petridish (BD, Cat. No. 353002)
- Compressed gas, Oxidising NOS (BOC)
- Kimwipes (Kimtech Science, cat. no. 34155)
- Heavy crepe bandage (ACCO Australia, 105109) (6″ pieces serve as cotton blanket)
- 30 G needle (BD, Cat. No. 304000)
- 18 G needle (BD, Cat. No. 305211)
- 5 ml syringe (Terumo, Cat. No. SS05S)
- Heating block (RATEK instruments, Cat. No. DBH10)
Microscope
- Optional: TriMScope II single-beam 2-photon microscope (LaVision BioTec)
- Optional: Tunable (680–1080 nm) MaiTai HP lasers (Spectra Physics) (≥3.3 W at 800 nm; pulse length of 140 fs, 80 MHz repetition rate)
- Water-dipping objectives (20×, NA = 0.95; XLUMPLFLN 20 × W) (Olympus)
IMPORTANT! Clean with lens cleaning wipes after every use. - Photomultiplier module blue (quantum efficiency = 17% at 400 nm; Hamamatsu, Cat. no. H 6780-01)
- Photomultiplier module green/red (QE = 15% at 630 nm; Hamamatsu, Cat. no. H 6780-20)
- High-sensitivity photomultiplier module (QE = 40% at 550 nm; Hamamatsu, Cat. no. H 7422-40)
- AHS LAMP 12 V/100 W halogen lamp for wide-field epifluorescence
- Optical table (Newport Corporation)
Microscope Filter and Mirror Sets
Set A: 495 long-pass (LP; Chroma, cat. no. T495LPXR), 560 LP (Chroma, Cat. no. T560LPXR), 475/42 band-pass (BP; Semrock, cat. no. FF01-475/42-25), 525/50 BP (Chroma, Cat. no. ET525/50m), and 665/40 BP (Chroma, Cat. no. NC028647). This filter set is used for imaging GFP, SHG, and TRITC. A Maitai laser of 900 nm wavelength is used for exciting GFP and TRITC.
Set B: 520 LP (Semrock, Cat. no. FF520-Di02-25×36), 650 LP (Chroma, Cat. no. 640 DCLP), 475/42 BP, 593/40 BP (Semrock, Cat. no. FF01-579/ 34-25), and 665/40 BP. This filter set is used for imaging tdTomato and SHG. A Chameleon laser of 800 nm wavelength is used for SHG and OPO 1080 nm is used for exciting tdTomato.
Set C: 495 LP, 520 LP, 560 LP, 475/42 BP, 525/50 BP, and 665/40 BP. This filter set is used for imaging YFP, SHG, and TRITC. A Maitai laser of 960 nm wavelength is used for exciting YFP and a Chameleon laser of 880 nm is used for exciting TRITC.
Equipment Set-Up
Stereotaxic frame
The custom-designed stereotaxic frame used in this protocol consists of a heavy aluminium base plate, “U” frame and 2 ear bar clamps and is most suited for 6–8-week old mice (Figures 1, 2). The bulky base helps to provide stability for operator use. The “U” frame is bolted to the base plate via 6 CSK screws fitted from beneath. The clamps are then fitted in place using M4 CSK screws. Ear bars with 18° or 45° points may be used. The 18° ear bars provide good head restraint but can cause internal ear hematoma and acute inflammation (Prestwich et al., 2008). We use the non-rupture wide angle 45° points that provide adequate head restraint and carry minimal risk of injury or inflammation. Mount ear bars into the mounting groove. Once assembled, the contraption can be stored in this configuration. A tooth bar and nose clamp did not provide additional stability for head restraint in our experiments.
IMPORTANT! Measure the distance between the nose of the dipping objective and the stage of the microscope. The stereotaxic frame must fit within the measured distance.
IMPORTANT! The frame and ear bars form a crucial contraption for restraining the head and will ultimately determine the quality of the brain images. This step requires surgical practice.
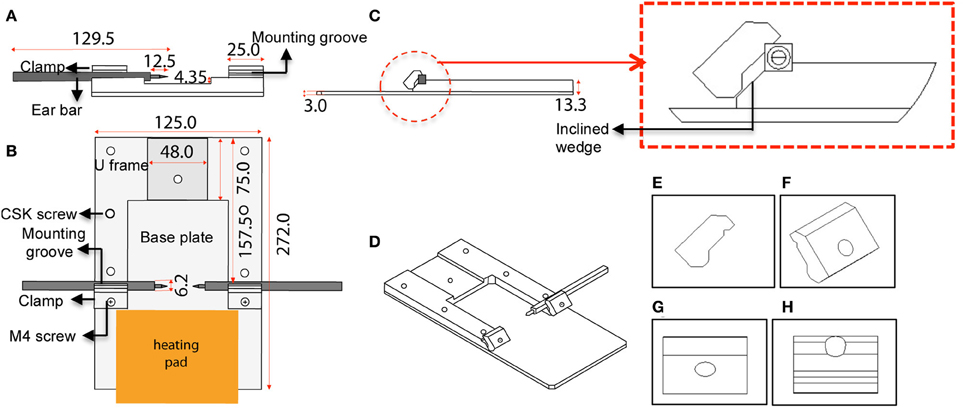
Figure 1. Schematic diagram and dimensions of the custom-designed stereotaxic frame used in the 2P-IBI model. (A) Section view. Cross section view shows the mounting groove engaged with an ear bar. (B) Top view. Position of the heavy base plate, U frame, 2 clamps, 6 CSK screws as well as the 2 M4 screws are shown. Position of the heating pad is depicted. (C) Side view. Thickness of the base plate and U frame are shown. Red circle shows a clamp gripping an ear bar. Red box shows a magnified view of the clamp and the inclined wedge gripping the ear bar. Note the notch of the ear bar slips into a groove in the underbelly of the clamp. (D) 3-dimensional view of the frame. (E–H) Angle views of the clamp. (E) Side view with grooves in the underbelly, (F) 3-dimensional view with a hole for fitting the M4 screw, (G) Top view, (H) Ridges carved on the inclined wedge to grip the ear bar.
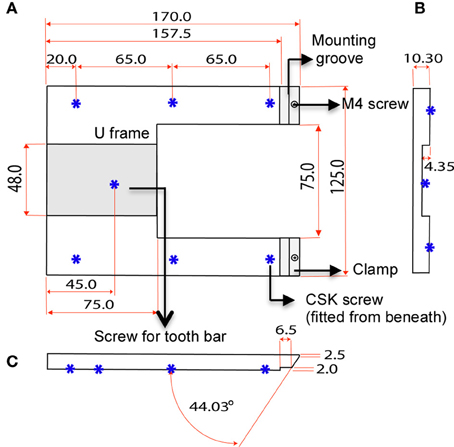
Figure 2. Dimensions of U frame. (A) Top view shows the position of the clamps and 6 CSK screws fitted from beneath. The screws bolt the “U” frame to the base plate. (B) Section view shows the concavity of the U frame that makes provision for a tooth bar. (C) Side view shows the angle of the clamp in relation the U frame.
Electronically regulated heating pad
To maintain core body temperature, place the mouse on a heating pad that is maintained at a constant of 37°C. Use a feedback rectal probe to record the body temperature and regulate the heating pad at 37°C. Set the thermostat at 37°C.
Circulating superfusion chamber
The circulating superfusion chamber unit consists of a cap-like reservoir, PVC tubing, pump-operated circulating water bath, N2/CO2/O2 cylinder, and a beaker containing aCSF (Figure 3). The custom designed stainless steel cap-like reservoir is 2 mm high with an internal diameter of 7 mm. It has an outer rim 0.4 mm wide and 15 mm in diameter extending horizontally from the chamber. It is modified to include a concavity 8 mm in radius that will mold to the shape of the mouse skull. The chamber contains two ports, one for attachment of inlet polyethylene tubing for superfusing the brain surface with aCSF and the other for attachment of outlet polyethylene tubing that will collect aCSF after superfusion. The outlet tubing is positioned at an elevation of 10 cm above the mouse brain to maintain intracranial pressure at 5–8 mm Hg throughout the session. To begin, freshly prepared aCSF is decanted into a small beaker and placed in a peristaltic pump-operated warm circulating water bath and pre-warmed to 37°C. The operational speed of the peristaltic pump is adjusted to maintain aCSF infusion at 0.3 ml/min. The aCSF is continuously bubbled with a mixture of 12% O2, 5% CO2, and 83% N2.
IMPORTANT! Assemble the unit and keep it ready to save on operational time.
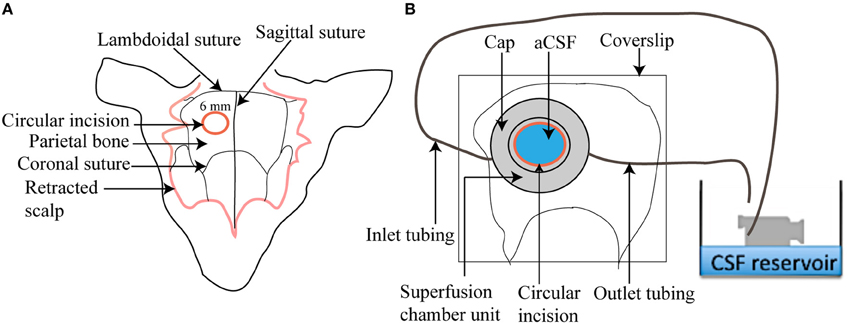
Figure 3. Illustration of a superfusion chamber. (A) A circular incision of 6 mm is made in the parietal bone after scalp retraction to form a cranial window (B) A magnified view of a superfusion chamber that has been glued to the cranial window. An inlet and outlet tubing is connected to the chamber to circulate warm aCSF over the cranial window.
Procedure
For troubleshooting guide see Table 1 below.
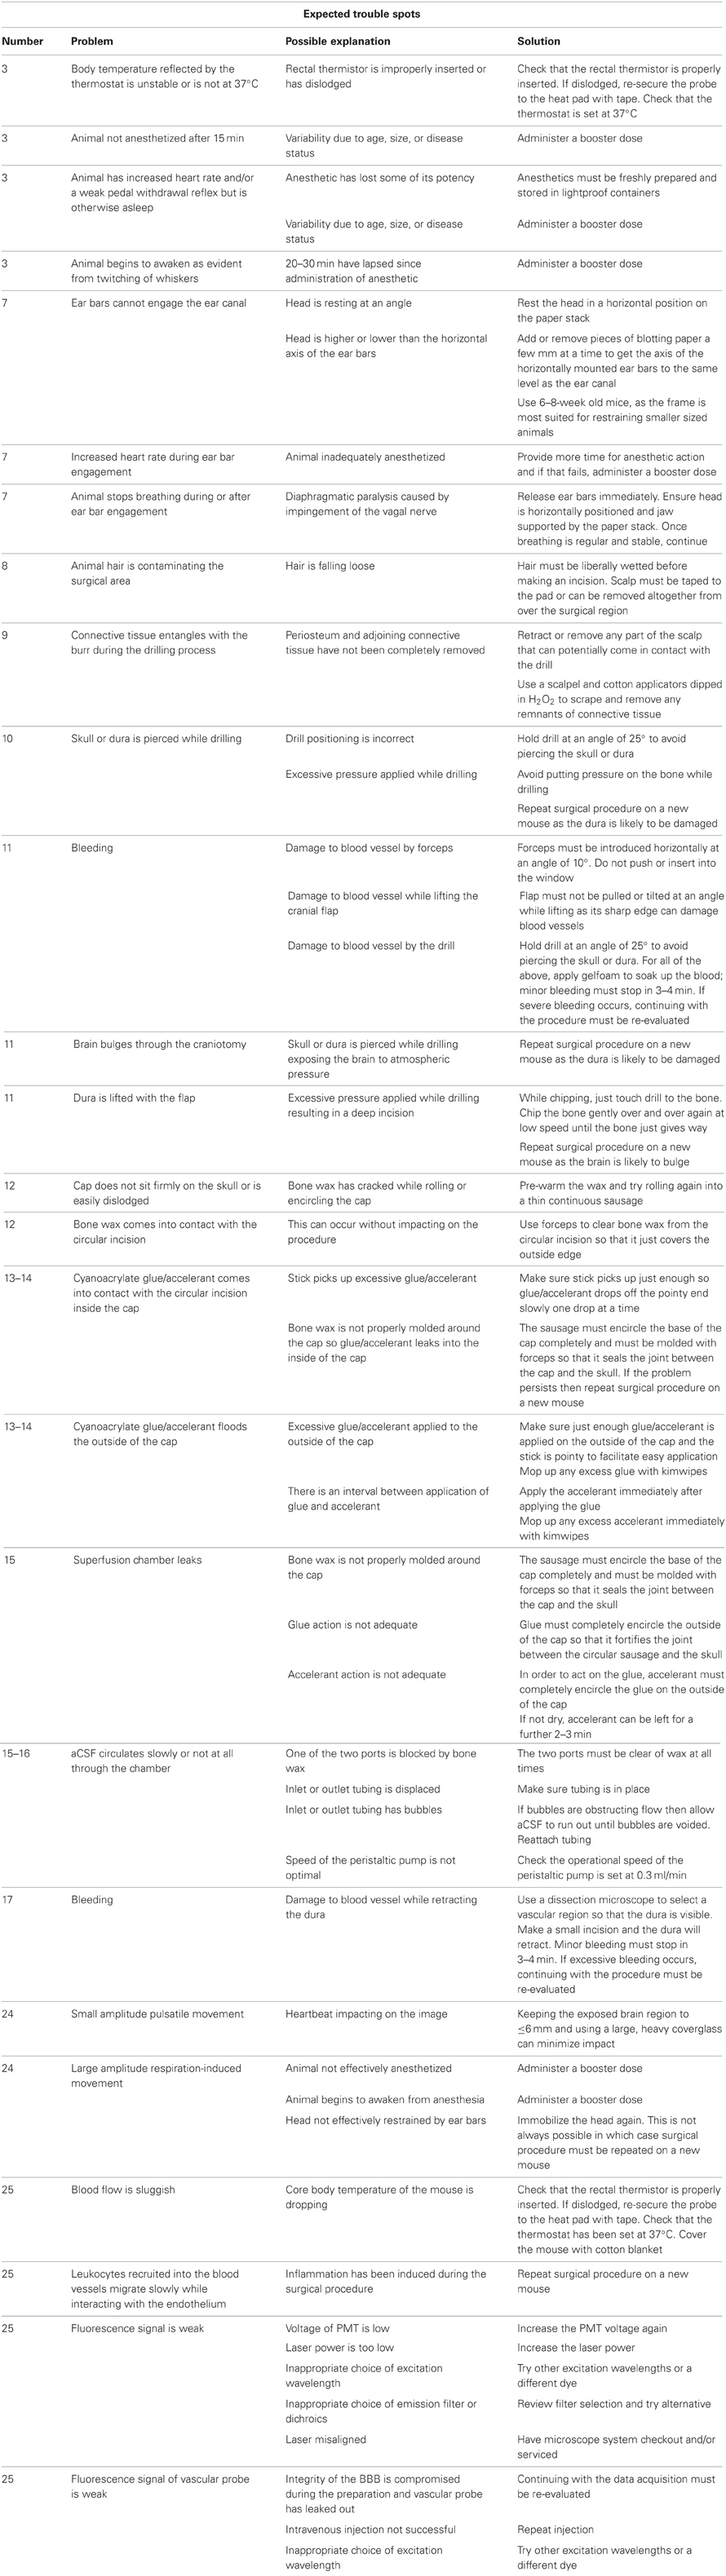
Table 1. A troubleshooting guide to manage potential trouble areas.
Presurgical Preparation • 25 Min
1. Transfer cells/leukocytes i.v through the tail vein. Administer bacteria, parasites, or other agents if any by the preferred route.
IMPORTANT! i.v injections may require pre-warming of mice to dilate the tail vein. It is difficult to pre-warm mice once the surgical procedure is initiated. Administration of cells via the i.v route must therefore be completed before proceeding to the next stage.
IMPORTANT! Mice pre-warmed for procedures such as i.v injections are prone to surgery-induced bleeding. Unless hypothermic pre-warmed mice must be allowed to recover at room temperature prior to surgery.
2. Stick the electronically regulated animal-heating pad on to the stereotaxic frame securely with tape. Connect the leads and turn on the thermostat. The pad will take 5′ to stabilize to 37°C.
3. Weigh the animal and administer Ketamine/Xylazine mixture intraperitoneally (i.p) to anesthetize the mouse. Administer Buprenorphine i.p for pain relief. Position the mouse centrally on the heating pad. Record reflexes every 5′ to determine depth of anesthesia. Proceed to the next step only after the mouse shows a sustained loss of reflexes for 5′ accompanied by regular and stable heart rate. A pulse oximeter can be used to monitor pulse rate and blood oxygenation levels. Once mouse is anesthetized, insert the rectal probe and securely tape it to the pad.
IMPORTANT! An improperly inserted or dislodged probe will result in overheating of the mouse.
IMPORTANT! Anesthetics can drop body temperature. During surgery and throughout the imaging procedure, care must be taken to ensure that the core body temperature of the mouse is regulated at 37°C through the heating pad.
IMPORTANT! Inducing a deep state of anesthesia in the mouse is crucial for acquiring quality images. Monitor the mouse every 5 min until it reaches a deep state of anesthesia.
Head Restraint • 10 Min
4. Create a stack of blotting paper that just reaches the lower flat edge of the mounted ear bars. Add 3 drops of saline to the center of the stack to create a slight depression. The saline will keep the surgical site moist during surgery.
5. Raise the head of the mouse and slide the paper stack under the jaw. The head must rest horizontally on the slight depression in the stack. Tap the head gently with the forefinger. The head must feel as if resting firmly on the stack.
IMPORTANT! If the head rests at an angle, it will be difficult to engage the ear bars. Resting the head in a horizontal position makes a larger surface area of the cranial window available for imaging.
6. Get the points of the horizontally mounted ear bars to the same level as that of the ear canal (or external auditory meatus). To achieve this, add or remove pieces of blotting paper to adjust the height of the head a few mm at a time. The points must barely touch the ears at this stage.
7. To engage an ear bar, partially unwind one of the screws and slide the ear bar gently into the ear canal a few mm at a time until the point resists. Do not force or push the ear bar. Tighten the screw. Once configured into this position, this ear bar need not be adjusted for any future imaging sessions if using the same age of mice. Follow the same process for the other ear bar. When done correctly, the head must be rested horizontally on the paper stack and feel firmly immobilized between the two ear bars.
IMPORTANT! An increased heart rate (>300 beats per minute or >5 Hz if using an oximeter) during ear bar fixation is indicative of pain. Release ear bars, provide more time for anesthetic action and if that fails, administer a booster dose of anesthetic.
IMPORTANT! An inadequately restrained head will cause “bobbing” of the image due to “respiration-induced movements.”
Cranial Window Preparation • 25 Min
8. Use cotton balls soaked in saline to liberally wet hair and skin. Make an incision in the midline of the scalp between the eyes past the ears. The scalp can be retracted using forceps and taped down to the pad or can be removed altogether as this is a non-survival procedure.
9. Dip cotton applicators in diluted 3% H2O2 and apply over the exposed skull to dislodge connective tissue. Use a scalpel to gently scrape out the periosteum and adjoining connective tissue. Sutures will appear as faint, red lines due to softening of cartilage and must be used as a guide for making incisions. Wipe away all residues of H2O2 using cotton applicators dipped in saline.
WARNING! Connective tissue can cause the skin to entangle with the burr during the drilling process. This has the potential to dislodge the mouse from the restraint and cause injury to the mouse and/or the drill operator.
10. Make a circular incision of 6 mm diameter using a pneumatic dental drill between the lambdoidal suture, the sagittal suture, and the coronal suture. Hold the drill at an angle of 25° while chipping the bone. Use a round-headed 0.55″ diameter carbide drill bit [WPI, Cat. No. 501856 (#4)] to define a circular window. Begin by chipping the bone at a speed of 2500 rpm, just touching drill on the bone. Then move to a smaller, round-headed 0.47″ diameter carbide drill bit [WPI, Cat. No. 501855 (#3)] to make the incision. Gradually increase speed to a maximum of 4000 rpm to chip the bone gently over and over again until the bone just gives way or a translucent layer of dura is visible. Remove bone dust by wiping several times with kimwipes soaked in saline. Check the mouse for adequate depth of anesthesia. Administer booster doses if required.
WARNING! Safety glasses must be worn by the drill operator at all times to avoid eye injury.
WARNING! A P2 grade mask must be worn by the drill operator at all times to avoid inhalation of fine bone dust.
IMPORTANT! Take care not to push the bone down toward the brain as minor injuries to the dura or disruption of vasculature in the cortex can provoke inflammation leading to accumulation of leukocytes. If this happens, procedural steps must be reviewed. This step requires significant surgical practice.
IMPORTANT! Drilling generates fine bone dust that can deposit on the window and cloud the image. Remove dust by wiping several times with kimwipes soaked in saline.
11. For longer imaging sessions of >1.5 h duration go to step 12. Otherwise continue with step 11.
Place a drop of saline on the window. The saline helps in separating the dura from the cranial bone while lifting the flap. Introduce the tip of a sharp, curved forceps horizontally at an angle of 10° to the edge of the bone flap. Grip the edge of the flap with the forceps. Do not push or insert the tip of the forceps into the window. Gently tug the flap and lift upwards taking care to keep the flap horizontal at all times. Next, go to step 19.
Superfusion Chamber Installation • 35 Min
12. Soften bone wax by warming between hands. Roll into a thin sausage. Under high magnification of a dissection microscope, place cap around circular incision and encircle the thin sausage completely around the base of the cap (Figure 3). Use the opposite end of forceps to gently mold the bone wax so that it seals the joint between the cap and the skull. The circular incision may be covered in wax at this stage. Use forceps to clear bone wax from the circular incision so that it just surrounds its outside edge.
IMPORTANT! The circular incision must be kept clear from wax at all times.
13. Snap a cotton-tipped applicator into half so that its ends are pointy. Dip pointy ends into glue and allow glue to drop off the pointy end onto the outside of the cap, one drop at a time so that it completely encircles the outside of the cap and fortifies the joint between the wax and skull.
IMPORTANT! Avoid putting glue on or inside the cap. The stick must pick just enough glue so they drop off the pointy end slowly one drop at a time. Too much glue can flood the cap.
14. Use another pointy swab stick to similarly apply accelerant around the outside of the cap. Accelerant reduces time for glue action. Wait 2–3 min to dry.
IMPORTANT! Ensure cap is attached to the skull surface by gently pressing one of its sides down with forceps. The cap should feel firm and not get dislodged.
15. Attach the inlet and outlet polyethylene tubing to the cap. Connect the tubing to the pump-operated superfusion chamber. Adjust the operational speed of the peristaltic pump to maintain aCSF infusion at 0.3 ml/min. The cap-like reservoir should bathe in circulating aCSF.
IMPORTANT! Make sure tubing is clear from wax.
16. Position the outlet tubing at an elevation of 10 cm above the mouse brain to maintain intracranial pressure at 5–8 mm Hg.
17. Under high magnification of a dissection microscope, gently puncture the thin edge of the circular incision with curved forceps, insert and lift to retract the bone flap. Clear away dura using a 30G needle. Select a section that is vascular so that dura is visible. Bleeding may occur but must cease in 2–3 min.
IMPORTANT! Do not use Epinephrine or any other chemical agents to stop bleeding as chemical irritants can induce inflammation. If heavy bleeding occurs then continuing with the experiment must be re-evaluated.
18. Seal the superfusion chamber with a cover glass held in place with vacuum grease. Transfer the mouse to the microscope stage while ensuring tubing is not displaced. Now go to step 21.
Post-Surgical Recovery • 5 Min
19. Place 1–2 gelfoam pieces pre-moistened in saline upon the exposed brain. Remove bits that are soaked with blood, replenish with new bits. Bleeding must cease in 2–3 min.
20. Attach an 18G needle to a 5 ml syringe filled with vacuum grease. Lay a very thin circular ring of vacuum grease about 5 mm from the outer edge of the window. Remove all gelfoam bits. Place 25 μl of warm aCSF on to the exposed surface of the brain. Seal the window with a cover glass. Transfer the mouse to the microscope stage.
Preimaging Preparation • 5 Min
21. To label blood plasma or study vessel permeability, administer 100 ug of dextran rhodamine (w/v) in saline intravenously.
IMPORTANT! Dextran must be administered only after all bleeding has ceased. Dextran leaking out from blood vessels can coat the cerebral cortex and obstruct visualization of cortical structures.
22. Check the mouse for adequate depth of anesthesia. Administer booster doses if required.
23. Cover the body of the mouse with several pieces of heavy crepe bandage. The bandage acts as a cotton blanket. Check the core body temperature of the mouse. Position the mouse under the nose of the objective. Place a drop of water on the cover glass if using a dipping objective.
Data Acquisition • 1.5–4 H
24. Perform mouse brain imaging according to manufacturer's instructions. Mice must be monitored every 15 min for adequate depth of anesthesia. Administer booster doses as and when required. Using a fluorescence microscope, choose a region of interest (ROI). We typically use 10–20 mW of laser power for the sample with full scan field dimension (500 × 500 μm). Minor drifts during acquisition can be corrected using softwares such as Volocity.
IMPORTANT! Time required for warming lasers must be taken into account before beginning an experiment. Ensure the laser is ready for use when the mouse is transferred to the stage.
Termination of Experiment • 5 Min
25. As the experiments are performed on anesthetized non-recovery animals, euthanize the mouse as per institutional and/or regional animal ethics committee guidelines.
Procedural overview
- Presurgical preparation: 25 min
- Head restraint: 10 min
- Cranial window preparation: 25 min
- Superfusion chamber installation: 35 min
- Post-surgical recovery: 5 min
- Preimaging preparation: 5 min
- Data acquisition: 1.5–4 h
- Termination of experiment: 5 min
Results
We applied the 2P-IBI protocol to dissect the spatio-temporal patterns of locomotion and behavior of GFP expressing leukocytes in wildtype Macgreen mice (Sasmono et al., 2003). x-y-t data were collected every 1 s and sometimes combined with 3-dimensional z stacks to create x-y-z-t time lapse images. Post-acquisition image analysis was carried out using the Volocity (Perkin Elmer) software. During analysis, firstly a unique identity code was allocated for each blood vessel within a ROI. The area of the blood vessel was derived by measuring length and breadth. The direction of blood flow within the tributaries of the blood vessel was carefully assessed. Diverging vessels with outflow of blood were classified as arteries and converging vessels with inflow of blood were classified as veins. Based on its breadth, the blood vessel was classified as a microcapillary (6–8 μm), a small (8–20 μm), or large blood vessel (>20 μm). Leukocytes were tracked as they entered the ROI and over its entire observation period. Rolling cells were defined as GFP+ single, round-shaped cells moving in the direction of the blood flow at a lower speed than free flowing cells. Adherent cells were defined as GFP+ single cells that remained stationary for 30 s or longer. The recording shows blood flowing within a pial artery (Supplementary Movie S1). Consistent with previous studies, leukocytes exhibited very little rolling or adherence to vessel wall (Carvalho-Tavares et al., 2000). Leukocytes appeared as “streaks” within the artery and escaped tracking due to their rapid speed. A single GFP+ adherent leukocyte seen here is a rare event. GFP+ macrophages associated with the microvasculature and meninges lining the blood vessels were also observed, as reported previously (Sasmono et al., 2003).
Conflict of Interest Statement
The authors declare that the research was conducted in the absence of any commercial or financial relationships that could be construed as a potential conflict of interest.
Acknowledgments
We are grateful to Dr. Maria Wynne, A/Prof. Lars Ittner, and Dr. Michael Kuligowski for helpful discussion.
Supplementary Material
The Supplementary Material for this article can be found online at http://www.frontiersin.org/Cellular_Neuroscience/10.3389/fncel.2012.00067/abstract
Movie S1 | Two-photon imaging of leukocytes within the pial vasculature of a living mouse brain. x-y-t time-lapse sequence of a 500 × 500 μm scanfield depicts migratory patterns of leukocytes inside dextran rhodamine-labeled blood vessels. Flowing GFP+ cells appear as “streaks” due to their rapid speed in the blood stream. GFP (green, leukocytes), SHG (Blue, collagen), and dextran rhodamine (Red, blood vessels) were excited at 950 nm using a tunable MaiTai HP laser (Spectra Physics). Scale bar: 55 μm. All experiments dealing with live animals were performed in accordance with the relevant animal use and care guidelines and regulations.
References
Amornphimoltham, P., Masedunskas, A., and Weigert, R. (2011). Intravital microscopy as a tool to study drug delivery in preclinical studies. Adv. Drug Deliv. Rev. 63, 119–128.
Auffray, C., Fogg, D., Garfa, M., Elain, G., Join-Lambert, O., Kayal, S., et al. (2007). Monitoring of blood vessels and tissues by a population of monocytes with patrolling behavior. Science 317, 666–670.
Bartholomaus, I., Kawakami, N., Odoardi, F., Schlager, C., Miljkovic, D., Ellwart, J. W., et al. (2009). Effector T cell interactions with meningeal vascular structures in nascent autoimmune CNS lesions. Nature 462, 94–98.
Belluscio, L. (2005). Two-photon imaging in live rodents. Curr. Protoc. Neurosci. Chapter 2:Unit 2.9. doi: 10.1002/0471142301.ns0209s32
Cabrales, P., and Carvalho, L. J. (2010). Intravital microscopy of the mouse brain microcirculation using a closed cranial window. J. Vis. Exp. pii: 2184. doi: 10.3791/2184
Cahalan, M. D., and Parker, I. (2008). Choreography of cell motility and interaction dynamics imaged by two-photon microscopy in lymphoid organs. Annu. Rev. Immunol. 26, 585–626.
Cahalan, M. D., Parker, I., Wei, S. H., and Miller, M. J. (2002). Two-photon tissue imaging: seeing the immune system in a fresh light. Nat. Rev. Immunol. 2, 872–880.
Carvalho-Tavares, J., Hickey, M. J., Hutchison, J., Michaud, J., Sutcliffe, I. T., and Kubes, P. (2000). A role for platelets and endothelial selectins in tumor necrosis factor-alpha-induced leukocyte recruitment in the brain microvasculature. Circ. Res. 87, 1141–1148.
Cavanagh, L. L., Bonasio, R., Mazo, I. B., Halin, C., Cheng, G., van der Velden, A. W., et al. (2005). Activation of bone marrow-resident memory T cells by circulating, antigen-bearing dendritic cells. Nat. Immunol. 6, 1029–1037.
Constantin, G., Marconi, S., Rossi, B., Angiari, S., Calderan, L., Anghileri, E., et al. (2009). Adipose-derived mesenchymal stem cells ameliorate chronic experimental autoimmune encephalomyelitis. Stem Cells 27, 2624–2635.
Coombes, J. L., and Robey, E. A. (2010). Dynamic imaging of host-pathogen interactions in vivo. Nat. Rev. Immunol. 10, 353–364.
Davalos, D., Grutzendler, J., Yang, G., Kim, J. V., Zuo, Y., Jung, S., et al. (2005). ATP mediates rapid microglial response to local brain injury in vivo. Nat. Neurosci. 8, 752–758.
Engelhardt, B., and Coisne, C. (2011). Fluids and barriers of the CNS establish immune privilege by confining immune surveillance to a two-walled castle moat surrounding the CNS castle. Fluids Barriers CNS 8:4. doi: 10.1186/2045-8118-8-4
Engelhardt, B., and Ransohoff, R. M. (2005). The ins and outs of T-lymphocyte trafficking to the CNS: anatomical sites and molecular mechanisms. Trends Immunol. 26, 485–495.
Engelhardt, B., and Ransohoff, R. M. (2012). Capture, crawl, cross: the T cell code to breach the blood-brain barriers. Trends Immunol. 33, 579–589.
Engelhardt, B., and Wolburg, H. (2004). Mini-review: transendothelial migration of leukocytes: through the front door or around the side of the house? Eur. J. Immunol. 34, 2955–2963.
Fabene, P. F., Navarro Mora, G., Martinello, M., Rossi, B., Merigo, F., Ottoboni, L., et al. (2008). A role for leukocyte-endothelial adhesion mechanisms in epilepsy. Nat. Med. 14, 1377–1383.
Germain, R. N., Miller, M. J., Dustin, M. L., and Nussenzweig, M. C. (2006). Dynamic imaging of the immune system: progress, pitfalls and promise. Nat. Rev. Immunol. 6, 497–507.
Grinvald, A., and Hildesheim, R. (2004). VSDI: a new era in functional imaging of cortical dynamics. Nat. Rev. Neurosci. 5, 874–885.
Grutzendler, J., Yang, G., Pan, F., Parkhurst, C. N., and Gan, W. B. (2011). Transcranial two-photon imaging of the living mouse brain. Cold Spring Harb. Protoc. 2011, 1080–1088.
Harris, T. H., Banigan, E. J., Christian, D. A., Konradt, C., Tait Wojno, E. D., Norose, K., et al. (2012). Generalized Levy walks and the role of chemokines in migration of effector CD8+ T cells. Nature 486, 545–548.
Herz, J., Paterka, M., Niesner, R. A., Brandt, A. U., Siffrin, V., Leuenberger, T., et al. (2011). In vivo imaging of lymphocytes in the CNS reveals different behaviour of naive T cells in health and autoimmunity. J. Neuroinflammation 8:131. doi: 10.1186/1742-2094-8-131
Hibbs, A. R. (2004). Fluorescent Probes. Confocal Microscopy for Biologists. U. S. A.: Springer-Verlag.
Hickey, M. J., and Kubes, P. (2009). Intravascular immunity: the host-pathogen encounter in blood vessels. Nat. Rev. Immunol. 9, 364–375.
Hickman, H. D., Bennink, J. R., and Yewdell, J. W. (2009). Caught in the act: intravital multiphoton microscopy of host-pathogen interactions. Cell Host Microbe 5, 13–21.
Holtmaat, A., Bonhoeffer, T., Chow, D. K., Chuckowree, J., De Paola, V., Hofer, S. B., et al. (2009). Long-term, high-resolution imaging in the mouse neocortex through a chronic cranial window. Nat. Protoc. 4, 1128–1144.
James, W. G., Bullard, D. C., and Hickey, M. J. (2003). Critical role of the alpha 4 integrin/VCAM-1 pathway in cerebral leukocyte trafficking in lupus-prone MRL/fas(lpr) mice. J. Immunol. 170, 520–527.
John, B., Harris, T. H., Tait, E. D., Wilson, E. H., Gregg, B., Ng, L. G., et al. (2009). Dynamic Imaging of CD8(+) T cells and dendritic cells during infection with Toxoplasma gondii. PLoS Pathog. 5:e1000505. doi: 10.1371/journal.ppat.1000505
John, B., Ricart, B., Tait Wojno, E. D., Harris, T. H., Randall, L. M., Christian, D. A., et al. (2011). Analysis of behavior and trafficking of dendritic cells within the brain during toxoplasmic encephalitis. PLoS Pathog. 7:e1002246. doi: 10.1371/journal.ppat.1002246
John, B., Weninger, W., and Hunter, C. A. (2010). Advances in imaging the innate and adaptive immune response to Toxoplasma gondii. Future Microbiol. 5, 1321–1328.
Kamerkar, S., and Davis, P. H. (2012). Toxoplasma on the brain: understanding host-pathogen interactions in chronic CNS infection. J. Parasitol. Res. 2012, 589295.
Kawakami, N., and Flugel, A. (2010). Knocking at the brain's door: intravital two-photon imaging of autoreactive T cell interactions with CNS structures. Semin. Immunopathol. 32, 275–287.
Kawamura, S., Schurer, L., Goetz, A., Kempski, O., Schmucker, B., and Baethmann, A. (1990). An improved closed cranial window technique for investigation of blood-brain barrier function and cerebral vasomotor control in the rat. Int. J. Microcirc. Clin. Exp. 9, 369–383.
Li, J. L., Goh, C. C., Keeble, J. L., Qin, J. S., Roediger, B., Jain, R., et al. (2012). Intravital multiphoton imaging of immune responses in the mouse ear skin. Nat. Protoc. 7, 221–234.
Lindquist, R. L., Shakhar, G., Dudziak, D., Wardemann, H., Eisenreich, T., Dustin, M. L., et al. (2004). Visualizing dendritic cell networks in vivo. Nat. Immunol. 5, 1243–1250.
Lister, K. J., and Hickey, M. J. (2006). Immune complexes alter cerebral microvessel permeability: roles of complement and leukocyte adhesion. Am. J. Physiol. Heart Circ. Physiol. 291, H694–H704.
Littman, D. R., and Rudensky, A. Y. (2010). Th17 and regulatory T cells in mediating and restraining inflammation. Cell 140, 845–858.
Masocha, W., and Kristensson, K. (2012). Passage of parasites across the blood-brain barrier. Virulence 3, 202–212.
McGavern, D. B., and Kang, S. S. (2011). Illuminating viral infections in the nervous system. Nat. Rev. Immunol. 11, 318–329.
Mempel, T. R., Pittet, M. J., Khazaie, K., Weninger, W., Weissleder, R., von Boehmer, H., et al. (2006). Regulatory T cells reversibly suppress cytotoxic T cell function independent of effector differentiation. Immunity 25, 129–141.
Mostany, R., and Portera-Cailliau, C. (2008). A craniotomy surgery procedure for chronic brain imaging. J. Vis. Exp. pii: 680. doi: 10.3791/680
Mrass, P., Petravic, J., Davenport, M. P., and Weninger, W. (2010). Cell-autonomous and environmental contributions to the interstitial migration of T cells. Semin. Immunopathol. 32, 257–274.
Mrass, P., and Weninger, W. (2006). Immune cell migration as a means to control immune privilege: lessons from the CNS and tumors. Immunol. Rev. 213, 195–212.
Muzumdar, M. D., Tasic, B., Miyamichi, K., Li, L., and Luo, L. (2007). A global double-fluorescent Cre reporter mouse. Genesis 45, 593–605.
Ng, L. G., Hsu, A., Mandell, M. A., Roediger, B., Hoeller, C., Mrass, P., et al. (2008). Migratory dermal dendritic cells act as rapid sensors of protozoan parasites. PLoS Pathog. 4:e1000222. doi: 10.1371/journal.ppat.1000222
Ng, L. G., Qin, J. S., Roediger, B., Wang, Y., Jain, R., Cavanagh, L. L., et al. (2011). Visualizing the neutrophil response to sterile tissue injury in mouse dermis reveals a three-phase cascade of events. J. Invest. Dermatol. 131, 2058–2068.
Nie, C. Q., Bernard, N. J., Norman, M. U., Amante, F. H., Lundie, R. J., Crabb, B. S., et al. (2009). IP-10-mediated T cell homing promotes cerebral inflammation over splenic immunity to malaria infection. PLoS Pathog. 5:e1000369. doi: 10.1371/journal.ppat.1000369
Nimmerjahn, A., Kirchhoff, F., and Helmchen, F. (2005). Resting microglial cells are highly dynamic surveillants of brain parenchyma in vivo. Science 308, 1314–1318.
Norman, M. U., James, W. G., and Hickey, M. J. (2008). Differential roles of ICAM-1 and VCAM-1 in leukocyte-endothelial cell interactions in skin and brain of MRL/faslpr mice. J. Leukoc. Biol. 84, 68–76.
Ousman, S. S., and Kubes, P. (2012). Immune surveillance in the central nervous system. Nat. Neurosci. 15, 1096–1101.
Padmanabhan, K., Andrews, S. E., and Fitzpatrick, J. A. (2010). Multi-photon imaging. Curr. Protoc. Cytom. Chapter 2:Unit2.9. doi: 10.1002/0471142956.cy0209s54
Pan, F., and Gan, W. B. (2008). Two-photon imaging of dendritic spine development in the mouse cortex. Dev. Neurobiol. 68, 771–778.
Prestwich, A. H., Li, J., Eriksson, P. O., Ny, T., Berggren, D., and Hellstrom, S. (2008). Lack of plasminogen does not alter the early inflammatory response following a tympanic membrane perforation: a study in plasminogen-deficient mice. Acta Otolaryngol. 128, 1294–1302.
Ransohoff, R. M., and Engelhardt, B. (2012). The anatomical and cellular basis of immune surveillance in the central nervous system. Nat. Rev. Immunol. 12, 623–635.
Ransohoff, R. M., Kivisakk, P., and Kidd, G. (2003). Three or more routes for leukocyte migration into the central nervous system. Nat. Rev. Immunol. 3, 569–581.
Renia, L., Wu Howland, S., Claser, C., Charlotte Gruner, A., Suwanarusk, R., Hui Teo, T., et al. (2012). Cerebral malaria: mysteries at the blood-brain barrier. Virulence 3, 193–201.
Robbins, E. M., Betensky, R. A., Domnitz, S. B., Purcell, S. M., Garcia-Alloza, M., Greenberg, C., et al. (2006). Kinetics of cerebral amyloid angiopathy progression in a transgenic mouse model of Alzheimer disease. J. Neurosci. 26, 365–371.
Ropper, A. H., Adams, R., Victor, M., and Brown, R. (2005). “The neurology of aging,” in Adams and Victor's Principles of Nuerology, 8th Edn, Chapter 30, Accession Number: 138333, (U. S. A.: The McGraw-Hill Companies, Inc.), 529–539.
Sallusto, F., Impellizzieri, D., Basso, C., Laroni, A., Uccelli, A., Lanzavecchia, A., et al. (2012). T-cell trafficking in the central nervous system. Immunol. Rev. 248, 216–227.
Saria, A., and Lundberg, J. M. (1983). Evans blue fluorescence: quantitative and morphological evaluation of vascular permeability in animal tissues. J. Neurosci. Methods 8, 41–49.
Sasmono, R. T., Oceandy, D., Pollard, J. W., Tong, W., Pavli, P., Wainwright, B. J., et al. (2003). A macrophage colony-stimulating factor receptor-green fluorescent protein transgene is expressed throughout the mononuclear phagocyte system of the mouse. Blood 101, 1155–1163.
Siffrin, V., Radbruch, H., Glumm, R., Niesner, R., Paterka, M., Herz, J., et al. (2010). In vivo imaging of partially reversible th17 cell-induced neuronal dysfunction in the course of encephalomyelitis. Immunity 33, 424–436.
Sigler, A., and Murphy, T. H. (2010). In vivo 2-photon imaging of fine structure in the rodent brain: before, during, and after stroke. Stroke 41, S117–S123.
Streilein, J. W. (1993). Immune privilege as the result of local tissue barriers and immunosuppressive microenvironments. Curr. Opin. Immunol. 5, 428–432.
Sumen, C., Mempel, T. R., Mazo, I. B., and von Andrian, U. H. (2004). Intravital microscopy: visualizing immunity in context. Immunity 21, 315–329.
Takeshita, Y., and Ransohoff, R. M. (2012). Inflammatory cell trafficking across the blood-brain barrier: chemokine regulation and in vitro models. Immunol. Rev. 248, 228–239.
Teixeira, M. M., Vilela, M. C., Soriani, F. M., Rodrigues, D. H., and Teixeira, A. L. (2010). Using intravital microscopy to study the role of chemokines during infection and inflammation in the central nervous system. J. Neuroimmunol. 224, 62–65.
von Andrian, U. H. (1996). Intravital microscopy of the peripheral lymph node microcirculation in mice. Microcirculation 3, 287–300.
Wake, H., Moorhouse, A. J., Jinno, S., Kohsaka, S., and Nabekura, J. (2009). Resting microglia directly monitor the functional state of synapses in vivo and determine the fate of ischemic terminals. J. Neurosci. 29, 3974–3980.
Wilson, E. H., Harris, T. H., Mrass, P., John, B., Tait, E. D., Wu, G. F., et al. (2009). Behavior of parasite-specific effector CD8+ T cells in the brain and visualization of a kinesis-associated system of reticular fibers. Immunity 30, 300–311.
Wilson, E. H., Weninger, W., and Hunter, C. A. (2010). Trafficking of immune cells in the central nervous system. J. Clin. Invest. 120, 1368–1379.
Wong, C. H., Bozinovski, S., Hertzog, P. J., Hickey, M. J., and Crack, P. J. (2008). Absence of glutathione peroxidase-1 exacerbates cerebral ischemia-reperfusion injury by reducing post-ischemic microvascular perfusion. J. Neurochem. 107, 241–252.
Yang, G., Pan, F., Parkhurst, C. N., Grutzendler, J., and Gan, W. B. (2010). Thinned-skull cranial window technique for long-term imaging of the cortex in live mice. Nat. Protoc. 5, 201–208.
Yoder, E. J. (2002). In vivo microscopy of the mouse brain using multiphoton laser scanning techniques. Proc. Soc. Photo Opt. Instrum. Eng. 4620, 14–29.
Keywords: inflammation, leukocytes, brain, vasculature, microscopy, trafficking, in vivo
Citation: Pai S, Danne KJ, Qin J, Cavanagh LL, Smith A, Hickey MJ and Weninger W (2013) Visualizing leukocyte trafficking in the living brain with 2-photon intravital microscopy. Front. Cell. Neurosci. 6:67. doi: 10.3389/fncel.2012.00067
Received: 24 November 2012; Paper pending published: 14 December 2012;
Accepted: 18 December 2012; Published online: 08 January 2013.
Edited by:
Eran Meshorer, The Hebrew University of Jerusalem, IsraelReviewed by:
Takumi Takizawa, Gunma University, JapanDaniel Kaganovich, The Hebrew University of Jerusalem, Israel
Copyright © 2013 Pai, Danne, Qin, Cavanagh, Smith, Hickey and Weninger. This is an open-access article distributed under the terms of the Creative Commons Attribution License, which permits use, distribution and reproduction in other forums, provided the original authors and source are credited and subject to any copyright notices concerning any third-party graphics etc.
*Correspondence: Saparna Pai and Wolfgang Weninger, Immune Imaging Program, The Centenary Institute, Locked Bag No. 6, Newtown, NSW 2042, Australia. e-mail: s.pai@centenary.org.au; w.weninger@centenary.org.au