Elevated mRNA-levels of distinct mitochondrial and plasma membrane Ca2+ transporters in individual hypoglossal motor neurons of endstage SOD1 transgenic mice
 Tobias Mühling1†
  Jochen H. Weishaupt
 Birgit Liss
- 1Department of Applied Physiology, Institute of Applied Physiology, Ulm University, Ulm, Germany
- 2Department of Neurology, Ulm University, Ulm, Germany
Disturbances in Ca2+ homeostasis and mitochondrial dysfunction have emerged as major pathogenic features in familial and sporadic forms of Amyotrophic Lateral Sclerosis (ALS), a fatal degenerative motor neuron disease. However, the distinct molecular ALS-pathology remains unclear. Recently, an activity-dependent Ca2+ homeostasis deficit, selectively in highly vulnerable cholinergic motor neurons in the hypoglossal nucleus (hMNs) from a common ALS mouse model, the endstage superoxide dismutase SOD1G93A transgenic mouse, was described. This functional deficit was defined by a reduced hMN mitochondrial Ca2+ uptake capacity and elevated Ca2+ extrusion across the plasma membrane. To address the underlying molecular mechanisms, here we quantified mRNA-levels of respective potential mitochondrial and plasma membrane Ca2+ transporters in individual, choline-acetyltransferase (ChAT) positive hMNs from wildtype (WT) and endstage SOD1G93A mice, by combining UV laser microdissection with RT-qPCR techniques, and specific data normalization. As ChAT cDNA levels as well as cDNA and genomic DNA levels of the mitochondrially encoded NADH dehydrogenase ND1 were not different between hMNs from WT and endstage SOD1G93A mice, these genes were used to normalize hMN-specific mRNA-levels of plasma membrane and mitochondrial Ca2+ transporters, respectively. We detected about 2-fold higher levels of the mitochondrial Ca2+ transporters MCU/MICU1, Letm1, and UCP2 in remaining hMNs from endstage SOD1G93A mice. These higher expression-levels of mitochondrial Ca2+ transporters in individual hMNs were not associated with a respective increase in number of mitochondrial genomes, as evident from hMN specific ND1 DNA quantification. Normalized mRNA-levels for the plasma membrane Na+/Ca2+ exchanger NCX1 were also about 2-fold higher in hMNs from SOD1G93A mice. Thus, pharmacological stimulation of Ca2+ transporters in highly vulnerable hMNs might offer a neuroprotective strategy for ALS.
Introduction
Amyotrophic Lateral Sclerosis (ALS) is the most common motor neuron (MN) degenerative disease, with an adult onset and an annual incidence of 1–3 cases per 100,000 people worldwide (Ludolph et al., 2012; Valori et al., 2014). Typical histopathological hallmark of ALS is the loss of upper and lower motor neurons, which is accompanied by reactive gliosis (Valori et al., 2014). Although first described in 1869 (Charcot and Joffroy, 1869), the causes of ALS remain largely unknown and, as effective long-term treatment strategies are not available, most patients die 3–5 years after symptom-onset (Hardiman et al., 2011; Vucic et al., 2014). There is a family history in around 10% of ALS patients, that can be attributed to several gene defects (Renton et al., 2013). Most common is an abnormal hexanucleotide expansion of the chromosome 9 open reading frame 72 gene (C9ORF72), present in many familial as well as some sporadic ALS cases (DeJesus-Hernandez et al., 2011; Renton et al., 2011; Haeusler et al., 2014). However, causes for neurodegeneration in most sporadic ALS patients still remain mostly unresolved (Vucic et al., 2014). Disease mechanisms of both, sporadic and familial ALS, share common pathogenetic features, in particular glutamate excitotoxicity, calcium (Ca2+) overload, mitochondrial dysfunction, oxidative stress and protein dysfunction and/or aggregation, e.g., particularly of the 43-kDa trans-activating response region binding protein (TDP-43) or cytoplasmic Cu2+/Zn2+-superoxide dismutase 1 (SOD1) (Neumann et al., 2006; Ilieva et al., 2009; Ferraiuolo et al., 2011; Lee et al., 2012; Matus et al., 2013; Rotunno and Bosco, 2013; Muyderman and Chen, 2014; Tadic et al., 2014). There is also strong evidence for a crucial role of astroglia cells for MN degeneration in ALS (Valori et al., 2014). In both, ALS patients and its transgenic animal models, there is evidence of ubiquitinated protein inclusions in MNs as well as in glial cells (Bruijn et al., 1997; Pasinelli et al., 2000; Mendonça et al., 2006).
Independent of the cause of ALS, one neuro-pathological hallmark of the disease is the differential vulnerability of MN populations to neurodegenerative triggers, e.g., MNs in spinal cord or hypoglossal nucleus are particularly vulnerable to ALS-trigger factors, while other MN populations, e.g., in particular in the oculomotor nucleus, remain relatively spared (Cleveland and Rothstein, 2001; Kanning et al., 2010; Kaplan et al., 2014). Vulnerable MNs display low endogenous Ca2+ buffering capacity due to a lack of cytosolic Ca2+ binding proteins (like calbindind28k or parvalbumin) (von Lewinski and Keller, 2005), accompanied by expression of AMPA glutamate receptor subtypes that are highly permeable to Ca2+ (Van Den Bosch et al., 2000; Grosskreutz et al., 2010). Thus, these vulnerable MNs depend particularly on mitochondrial Ca2+ uptake to recover from transient Ca2+ increase during electrical activity (Grosskreutz et al., 2007; Jaiswal and Keller, 2009). However, mitochondria in highly vulnerable MNs show substantial functional and morphological changes in ALS animal models and human patients (Kawamata and Manfredi, 2010; Barrett et al., 2011; Martin, 2011; Cozzolino and Carrì, 2012; Vehviläinen et al., 2014). In particular, increased cytosolic Ca2+ transients and significantly reduced mitochondrial Ca2+ uptake have been described in ALS mouse models (Jaiswal and Keller, 2009; Coussee et al., 2011). The mitochondrial membrane potential, the driving force for mitochondrial Ca2+ uptake, has been described to be depolarized, and/or Ca2+ induced depolarization was increased (Carrì et al., 1997; Damiano et al., 2006; Jaiswal and Keller, 2009; Nguyen et al., 2009). By functional comparison of MNs from the hypoglossal (hMN) and from the oculomotor nucleus (oMN) in the most commonly utilized mouse model of ALS that express a human disease causing G93A SOD1 mutation (SOD1G93A mice), we recently identified a Ca2+ homeostasis deficit, selectively in highly vulnerable hMNs at disease endstage (Fuchs et al., 2013). More precisely, in response to elevated electrical activity, a reduced mitochondrial Ca2+ uptake, and an enhanced Ca2+ extrusion across the plasma membrane was observed in hMNs but not oMNs (Fuchs et al., 2013).
The main assumed uptake route of Ca2+ into mitochondria is the mitochondrial Ca2+ uniporter (mCU), driven by the mitochondrial membrane potential (Drago et al., 2011). It consists of a pore-forming subunit, named mitochondrial Ca2+ uniporter (MCU) and at least two regulatory subunits, mitochondrial Ca2+ uptake 1 (MICU1) and mitochondrial Ca2+ uniporter regulator 1 (MCUR1) (Perocchi et al., 2010; Baughman et al., 2011; de Stefani et al., 2011; Mallilankaraman et al., 2012a; Marchi and Pinton, 2014). mCU has a relatively low Ca2+ sensitivity, and probably achieves mitochondrial Ca2+ import mainly at endoplasmic reticulum (ER) mitochondria microdomains, where Ca2+ concentrations are high enough (Drago et al., 2011). The mitochondrial uncoupling proteins UCP2 and UCP3 can also contribute to the mitochondrial Ca2+ uptake machinery. First reported to be a component of the uniporter itself (Trenker et al., 2007), they were later supposed to operate independently of other Ca2+ uptake pathways, particularly when Ca2+ is released from the ER (Waldeck-Weiermair et al., 2011). In addition, the high Ca2+ affine leucine zipper EF-hand containing transmembrane protein 1 (Letm1) is supposed to function as mitochondrial Ca2+/H+ exchanger at the relatively low cytosolic concentration increases across the plasma membrane that follow Ca2+ depletion of the ER (store operated calcium entry, SOCE) (Jiang et al., 2009; Waldeck-Weiermair et al., 2011; Nowikovsky et al., 2012). The mitochondrial Na+/Ca2+exchanger (MNCX) achieves Ca2+ efflux from mitochondria under physiological conditions (Palty et al., 2010; de Marchi et al., 2014) but might revert its operation mode when mitochondria undergo pathological de- or hyperpolarization (Kim and Matsuoka, 2008; Chinopoulos and Adam-Vizi, 2010). Apart from mitochondrial Ca2+ uptake, the sarco-endoplasmic reticulum Ca2+ ATPases (SERCA) are transporting Ca2+ into the ER, and thus provide additional Ca2+ clearance capacity (Hovnanian, 2007; Chaudhari et al., 2014; Hajnóczky et al., 2014). Furthermore, Ca2+ clearance via the plasma membrane is present and mediated by the plasma membrane Ca2+ ATPases (PMCA1-4) (Strehler, 2013) and the Na+/Ca2+ exchangers (NCX1-3) (Sharma and O'Halloran, 2014). While NCX1-3 mediate extrusion of steep Ca2+ increases after cell stimulation via the plasma membrane, PMCA isoforms are regarded as “fine tuners” of cytosolic Ca2+ extrusion (Brini and Carafoli, 2011).
To molecularly define the described complex altered functional Ca2+ clearance phenotype in hMNs of endstage SOD1G93A mice (Fuchs et al., 2013), here we examined mRNA-levels of all described potential mitochondrial (MCU/MICU1/MCUR1, Letm1, UCP2/3, MNCX) and plasma-membrane (PMCA1-4, NCX1-3) Ca2+ transport proteins in choline-acetyltransferase (ChAT) positive hMNs of endstage SOD1G93A and wildtype (WT) mice, by combining UV laser microdissection (UV-LMD) with quantitative RT-PCR analysis. To assess if a possible cell-specific transcriptional Ca2+ transporter dysregulation is associated with an altered number of mitochondria/mitochondrial genomes in SOD1G93A mice (Keeney and Bennett, 2010), we quantified mitochondrial genomic DNA in individual hMNs via quantification of the mitochondrially encoded NADH dehydrogenase subunit 1 (ND1) gene (He et al., 2002; Bender et al., 2006; Krishnan et al., 2007). As cDNA levels for ChAT as well as cDNA and genomic DNA levels for ND1 were not altered in hMNs from SOD1G93A mice compared to WT, we utilized these genes for normalization of respective qPCR expression-data for plasma membrane and mitochondrial Ca2+ transporters. With this stratified analysis, we detected a selective transcriptional up-regulation of the mitochondrial MCU/MICU1 complex, similar as previously described (Fuchs et al., 2013), as well as of Letm1, UCP2, and the plasma membrane transporter NCX1. These findings point to an activity-dependent increased need of Ca2+ clearance capacity in hMNs of endstage SOD1G93A mice that is only partly met by an increased expression of mitochondrial Ca2+ transporters. Accordingly, Ca2+ extrusion via the plasma-membrane is elevated in hMNs of endstage SOD1G93A mice—not only functionally (Fuchs et al., 2013), but also at the molecular level, via elevated NCX1 expression. Thus, pharmacological stimulation of Ca2+ transporters might offer a novel neuroprotective strategy for highly vulnerable MNs in ALS.
Materials and Methods
Ethical Approval
All animal procedures were approved by Regierungspräsidium Tübingen, Germany (AZ 35/9185.81-3 TV No. 1090, and O-147), and conducted according to the guidelines of the German Tierschutzgesetz.
Mice
For all experiments, male transgenic mice of the strain B6SJL-TgN(SOD1-G93A) (Jackson Laboratory, Bar Harbor, US) and wildtype (WT) littermates of the same genetic background were used (Gurney et al., 1994). Mice were bred in Ulm in respective in-house breeding facility and genotyped according to the protocol recommended by Jackson Laboratory. For analyses, SOD1G93A mice between P115 and P145 were used after they were no longer able to pass a paw grip endurance test (clinical score 4, referred to as endstage) (Solomon et al., 2011). Data were derived from six individual SOD1G93A and six respective age-matched WT mice.
Tissue Preparation, UV Laser Microdissection (UV-LMD) and Reverse Transcription (RT)
Carried out essentially as described (Fuchs et al., 2013; Schlaudraff et al., 2014). Briefly, SOD1G93A and WT mice were deeply anesthetized with isoflurane (Abbott, Wiesbaden, Germany) and decapitated. Coronal tissue blocks containing hypoglossal nuclei were separated. The blocks were mounted on a specimen disk and immediately frozen by insertion into the snap-freeze holder (−35°C) of a cryostat (Leica CM 1850). Twelve μm serial coronal brainstem sections (for exact location see Figure 1A) were cut using a microtome blade (type R35, Feather, Osaka, Japan), and mounted on 2 mm PEN-membrane slides (Microdissect, Herborn, Germany), fixed with an ascending ethanol series, stained with cresyl violet, dried and stored at −80°C. UV-LMD of individual hMNs was performed using a Leica LMD7000 setup. 10 pools of 15 hMNs each were laser microdissected from each endstage SOD1G93A and age-matched WT mouse. After cell-lysis and reverse transcription (RT) with random hexamer primers, cDNA was ethanol precipitated as described (Liss, 2002), resolved in 17 μl molecular biology grade water and stored at −20°C until PCR amplification. Note that hMNs of SOD1G93A mice were about 5% larger than hMNs of WT control mice, according to area-quantifications after UV-LMD.
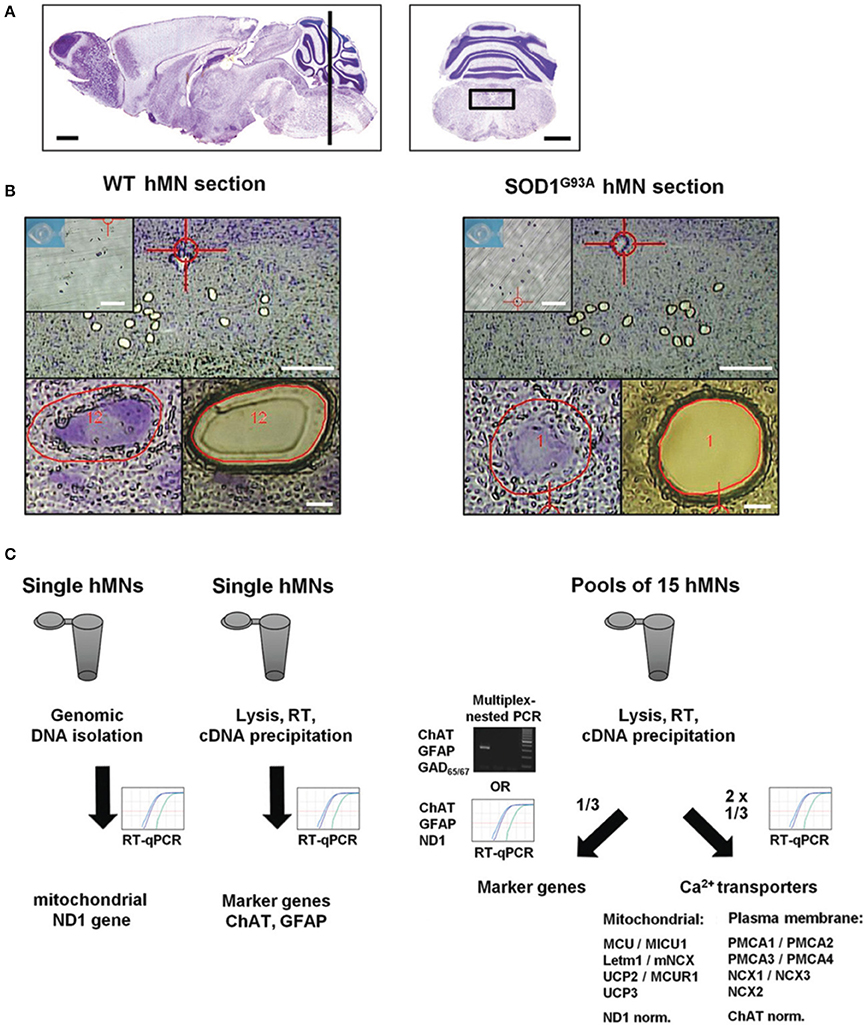
Figure 1. Scheme of UV-LMD and RT-qPCR protocol for quantitative expression analysis of Ca2+ transporters in individual hypoglossal motor neurons from endstage SOD1G93A and WT mice. (A) Nissl-stained sagittal (left) adult mouse brain section. The black bar indicates the zone (6–7 mm posterior to the Bregma) within the brainstem, where coronal sections (right) containing hypoglossal motor neurons (hMNs) (black box) were cut for UV-LMD. Scale bars: 1 mm. Pictures taken from Paxinos and Franklin (2001). (B) Upper: Overview of a WT (left) and endstage SOD1G93A mouse (right) coronal brainstem section after UV-LMD of 15 individual hMNs each. Scale bars: 250 μm. Inserts: photograph of the reaction tube cap for inspection of proper collection of all 15 neurons after UV-LMD, prior to cell lysis and reverse transcription (RT). Scale bars: 500 μm. Lower: individual hMNs before and after UV-LMD. Scale bars: 10 μm. (C) Workflow after UV-LMD. Left: genomic ND1 DNA-copy number of single hMNs was determined via qPCR with using genomic DNA as template, after genomic DNA isolation. ChAT and GFAP cDNA levels were determined for single hMNs after cell-lysis via individual RT-qPCR reactions with 50% of single cell cDNA each as templates. Right: For quantification of Ca2+ transporter expression-levels, cDNA derived from pools of 15 hMNs each were splitted, and 1/3 was used for marker gene expression profiling (either multiplex-nested PCR for ChAT, GFAP, and GAD65/67, or alternatively individual qPCRs for ChAT, GFAP, and ND1), and 2/3 was used for RT-qPCRs for quantification of Ca2+ transporter mRNA levels. For details, please see methods.
Qualitative and Quantitative PCR
Qualitative and quantitative PCR was carried out, essentially as described (Gründemann et al., 2011; Dragicevic et al., 2014; Schlaudraff et al., 2014). Quantitative PCR (qPCR) was carried out using TaqMan assays and a GeneAmp 7900HTqPCR cycler (Applied Biosystems, Darmstadt, Germany). All qPCR assay details and assay-specific standard curve parameters are given in Table 1. Standard curves were generated using serial dilutions of cDNA (stock concentration: 750 ng/μl, RNA integrity number (RIN): 9.8; derived from brainstem mRNA of an age-matched C57Bl/6 mouse). Five μl of standard cDNA or of the purified hMN cDNA was used as a template for each qPCR in a final volume of 20 μl, using QuantiTect Probe PCR Master Mix (Qiagen, Hilden, Germany), 1 μl TaqMan assay, and the following cycling conditions: 60°C 2 min, 95°C 15 min, (94°C 15 s, 60°C 1 min) 50 cycles.
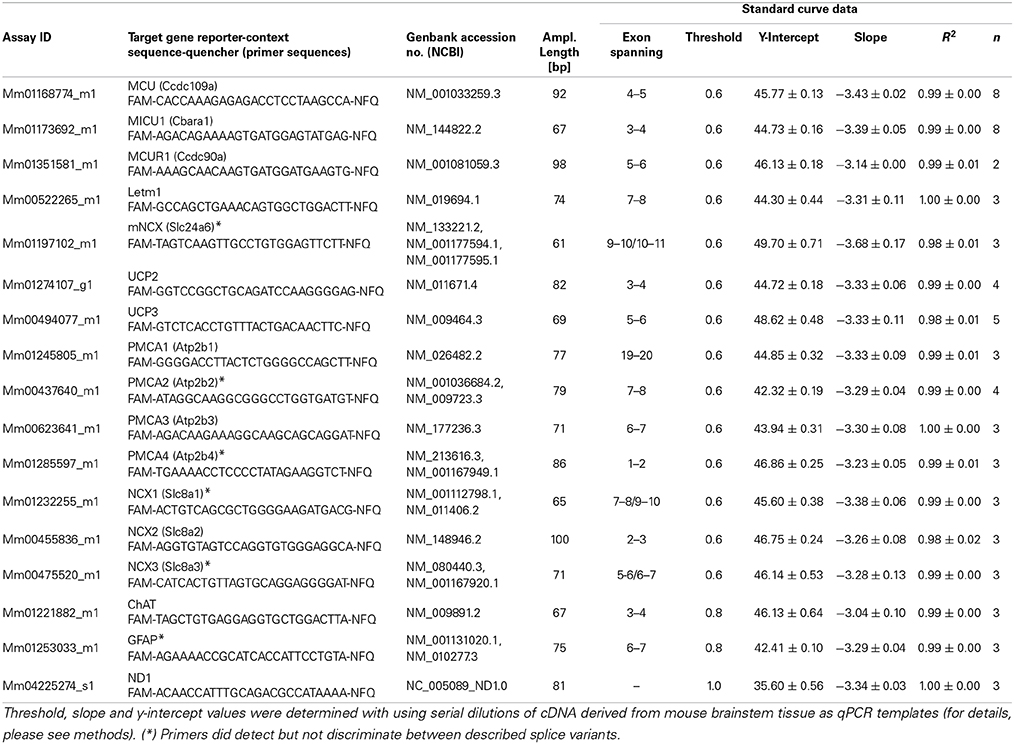
Table 1. Mouse TaqMan quantitative PCR assay information.
To test for absence of contaminations in harvested hMN pools, 5 μl of purified hMN cDNA was subjected to either multiplex-nested PCR for qualitative (essentially as described, Dragicevic et al., 2014) or to qPCR for quantitative analysis of marker gene expression: We chose choline-acetyltransferase (ChAT) as marker for motor neurons, L-glutamate decarboxylase (GAD65/67) as marker for GABAergic cells, and glial fibrillary acidic protein (GFAP) as marker for astroglia cells. In addition, we used NADH dehydrogenase subunit 1 (ND1) as marker for mitochondrial genomic DNA copies. Only ChAT positive and GAD65/67 negative pools were further processed for Ca2+ transporter mRNA quantification. Please note that we detected in pools (~50–100%) as well as in individual hMN (100%) from SOD1G93A but not from WT mice (0 and 11% respectively) consistently robust GFAP signals (compare Figure 2A and Table 2A). As GFAP positive and GFAP negative hMN pools from SOD1G93A showed however no significant differences in MCU/MICU1 Ca2+ transporters expression levels, GFAP positive hMN pools were included into the analysis. Figure 1 illustrates the UV-LMD and RT-PCR workflow.
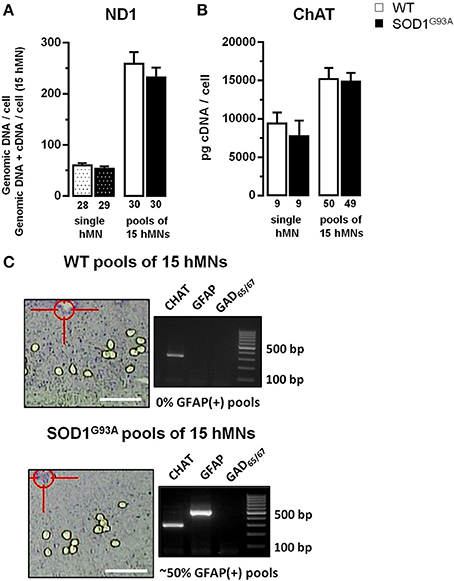
Figure 2. Evaluation of ND1 and ChAT expression, used for normalization of cell-specific hypoglossal motor neurons qPCR data. (A) qPCR data for mitochondrially coded NADH dehydrogenase ND1, using genomic DNA from individual hMNs as templates, indicate similar numbers of mitochondrial genomic DNA molecules in hMNs from WT and from endstage SOD1G93A mice. Note that combined mitochondrial genomic DNA and cDNA levels for ND1, determined via RT-qPCR of pools of 15 hMNs each, are also not different between WT and SOD1G93A mice, a prerequisite for using ND1 DNA-levels for normalization of respective mitochondrial Ca2+ transporter RT-qPCR results. (B) RT-qPCR data for choline-acetyltransferase (ChAT), derived either from single hMNs or from pools of 15 hMNs each, are similar in WT and SOD1G93A mice, a prerequisite for using ChAT cDNA-levels for normalization of respective plasma membrane Ca2+ transporter RT-qPCR results. (C) WT and SOD1G93A coronal brainstem section after UV-LMD of 15 individual hMNs and agarose gel products of multiplex-nested RT-PCR of the marker genes ChAT, GFAP (glial fibrillary acidic protein), and GAD65/67(L-glutamate decarboxylase). Note that most WT pools (or individual hMNs) were GFAP-negative while GFAP was robustly detected in ~50% of SOD1G93A pools (or via qPCR in 100% of individual hMNs or pools from SOD1G93A, compare Table 2A). Scale bars: 250 μm.
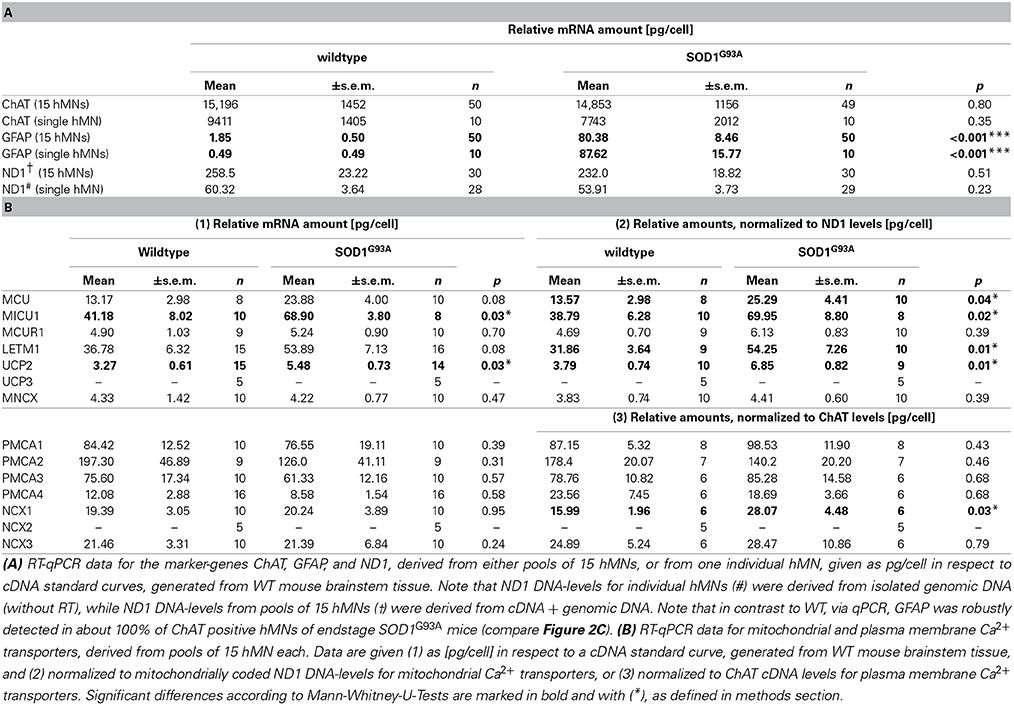
Table 2. Marker gene and Ca2+ transporter mRNA-levels in individual, laser microdissected hMNs from WT and endstage SOD1G93A mice.
Determination of Mitochondrial Genome Copy Number
For quantification of mitochondrial genome copy number, single hMNs were laser microdissected and DNA isolation was performed with the QiaAmp DNA Micro Kit (Qiagen) according to the manufacturer protocol with the following adaptations: 0.1 μg/μl polyA carrier-RNA (included in kit) was added to each reaction, and all mixing steps were performed by pipetting with cell saver tips (Kisker, Steinfurt, Germany) to minimize sheering stress. DNA was eluted in 30 μl of molecular biology grade water and stored at 4°C until PCR amplification. For determination of mitochondrial DNA copy numbers, the mitochondrially coded ND1 gene was quantified, that is almost never affected by genomic deletion (He et al., 2002; Bender et al., 2006; Krishnan et al., 2007). Five μl of the eluted genomic DNA was used in a 20 μl reaction with QuantiTect Probe PCR Master Mix (Applied Biosystems), 1 μl ND1 TaqMan Primer Probe Mix, and 4 μl H2O for qPCR amplification in duplicate reactions in a GeneAmp 7900HT using the following cycling conditions: 60°C 2 min, 95°C 15 min, (94°C 15 s, 60°C 1 min) 50 cycles. ND1 qPCR assay details, and assay-specific standard curve parameters are given in Table 1.
Data Analysis
Data analysis, graphical representations, correlation and linear regression analysis were performed with SDS2.3 software (Applied Biosystems) and GraphPad Prism 6 (GraphPad Software Inc., San Diego, US). The cDNA amount per neuron in relation to the utilized standard was calculated as described (Gründemann et al., 2011; Schlaudraff et al., 2014) according to:
With S = serial dilution factor of the standard curve (i.e., 10), Nocells = number of harvested neurons per UV-LMD sample (i.e., 15), cDNA fraction = fraction of the UV-LMD cDNA-reaction sample used as template in the individual qPCR reactions (pools of 15 hMNs: 5/17 for Ca2+ transporters, and 1/9 for marker genes ChAT, GFAP, and ND1; single hMN: 1/2 for marker genes ChAT and GFAP, and 1/6 for genomic ND1). The Yintercept unit-magnitude corresponds to the respective standard utilized (i.e., pg equivalents of standard cDNA, derived from brainstem tissue mRNA). Single cell cDNA amounts were calculated with a Yintercept of 42 for all Ca2+ transporter genes, and with Yintercept from respective standard curves for ChAT, GFAP and ND1. Relative expression data are given as mean ± s.e.m., without and with normalization to ND1 and ChAT DNA/cDNA levels, respectively. Normalization was carried out by dividing respective Ca2+ transporter expression values to respective relative ChAT or ND1 expression values (relative to the WT mean values for ChAT and ND1), for each individual hMN pool. For statistical comparison Mann-Whitney-U-Tests were used. Significant differences are indicated by asterisks (*p < 0.05, **p < 0.01, and ***p < 0.001).
Results
To analyze expression levels of mitochondrial as well as plasma membrane Ca2+ transporters in individual hMNs from WT and endstage SOD1G93A mice with best possible stratification, we further optimized our established single cell UV-LMD RT-qPCR protocol (Gründemann et al., 2011; Fuchs et al., 2013; Schlaudraff et al., 2014). Figure 1 summarizes the general work flow.
For cell-specific normalization and stratification of mitochondrial Ca2+ transporter mRNA expression-levels, we utilized the NADH dehydrogenase ND1 gene, that is encoded by mitochondrial genomic DNA, and is almost never affected by genomic DNA-degradation (He et al., 2002; Bender et al., 2006). Quantifying ND1 DNA copies in parallel with mitochondrial Ca2+ transporter mRNAs in individual hMNs allows the normalization of mitochondrial Ca2+ transporter expression levels to the number of mitochondria/mitochondrial genomes in the respective analyzed hMN pools. To probe if the number of mitochondrial genomes is altered in individual hMNs from WT and SOD1G93A mice, we first quantified ND1 genomic DNA copy numbers after isolation of genomic DNA from individual hMNs. We detected no significant difference in ND1 genomic DNA levels in individual hMNs from WT and SOD1G93A mice (Figure 2A and Table 2A). To probe if this is also the case, when analyzing (intronless) genomic ND1 levels without a distinct genomic DNA isolation step by using our established UV-LMD RT-qPCR protocol (a prerequisite for using this gene and this approach for RT-qPCR data normalization), we quantified ND1 DNA levels (genomic DNA + cDNA) in respective pools of 15 hMNs from WT and SOD1G93A mice. Again, we detected no difference between hMNs from WT and SOD1G93A mice, but as expected, about 4-fold higher ND1 DNA levels (genomic DNA + cDNA) per cell (WT: 4.28; SOD1G93A: 4.30) (Figure 2A and Table 2A).
For normalization and stratification of plasma membrane Ca2+ transporter expression levels, we utilized the cytoplasmic key enzyme for acetylcholine synthesis, the choline-acetyltransferase (ChAT). Again, as a prerequisite for using ChAT for cell-specific normalization of hMN expression data, we determined ChAT mRNA-levels of individual hMNs as well as of pools of hMNs in WT and endstage SOD1G93A mice. Similar, as for ND1, we detected no difference in ChAT mRNA-levels in single or pooled individual hMNs from WT and SOD1G93A mice (Figure 2B and Table 2A). However, as expected, we detected a strong correlation of ChAT mRNA-levels with individual hMN cell sizes (WT: R2 = 0.45; p < 0.001; n = 50; SOD1G93A: R2 = 0.48; p < 0.001; n = 49), further indicating the suitability of ChAT for normalization of plasma membrane Ca2+ transporter expression data from individual hMNs.
To ensure homogeneity of laser microdissected hMN pools, we analyzed for all hMN cDNA pools from WT and endstage SOD1G93A mice (n = 32 and 55, respectively) a respective marker-gene expression profile. We utilized either qualitative RT-multiplex nested PCR for ChAT, the astroglia-marker GFAP (glial fibrilaric acidic protein) and the GABAergic neuron markers GAD65 and GAD67(L-glutamate-decarboxylase) (Figures 1C, 2C), or qPCR for ChAT and GFAP (Figure 1C and Table 2A). Only ChAT positive and GAD65/67 negative hMN pools were further analyzed. All ChAT positive hMN pools from WT or SOD1G93A mice were negative for GAD65/67. However, as illustrated in Figure 2C, while WT pools showed no signal for GFAP, we obtained positive GFAP RT-PCR signals in about 50% of multiplex-nested PCRs of hMN cDNA pools from SOD1G93A mice. To further address this unexpected finding, we quantified GFAP expression levels in pools of 15 hMNs as well as in individual hMN of WT and SOD1G93A mice after UV-LMD. Again, we almost never detected any robust signal for GFAP in individual WT hMNs (n = 1 of 9 neurons), but in all 9 tested individual hMNs from SOD1G93A mice, and in 100% (n = 50) of hMN pools (GFAP qPCR expression levels are given in Table 2A). Given these results, it is very unlikely that GFAP positive hMNs, selectively in SOD1G93A mice are caused artificially due to technical issues. We next compared MCU and MICU1 mRNA-levels between GFAP positive and GFAP negative hMN pools of SOD1G93A mice, and detected no significant difference (SOD1G93A, relative expression; MCU: GFAP pos. 1.71 ± 0.19, n = 16; GFAP neg. 1.65 ± 0.16, n = 23; p = 0.96; MICU1: GFAP pos. 1.98 ± 0.22, n = 16; GFAP neg. 1.78 ± 0.15, n = 23; p = 0.51). Thus, we did not exclude GFAP positive hMN pools from further PCR analysis of Ca2+ transporter expression.
Next, via RT-qPCR, we analyzed qualitative mRNA expression of the main described potential mitochondrial and plasma membrane Ca2+ transporters (Figure 3A) in pools of 15 hMNs from WT and SOD1G93A mice. As illustrated in Figure 3B, mRNAs for all tested mitochondrial Ca2+ transporters (MCU/MICU1/MCUR1, Letm1, UCP2, MNCX) but UCP3, and for all plasma membrane Ca2+ transporters (PMCA1-4, NCX1, NCX3) but NCX2, were detected in ChAT and ND1 positive hMNs (n = 3 pools of 15 neurons each) from WT and SOD1G93A mice. Accordingly, we quantified mRNA-levels for all these mitochondrial and plasma membrane Ca2+ transporters via qPCR in hMNs from WT and endstage SOD1G93A mice. Results are given in Figure 4 and Table 2B. Without cell-specific normalization, we detected significantly higher mRNA levels of only MICU1 and UCP2 in hMNs from SOD1G93A mice (each about 1.7-fold higher compared to WT; Figure 4A left and Table 2B). All other Ca2+ transporter mRNA-levels were not significantly altered (although trends were observed in particular for MCU and Letm1, compare Figure 4A and Table 2B). Accordingly, cell-specific normalization of hMN qPCR data for mitochondrial Ca2+ transporters to mitochondrially coded ND1 DNA-levels (and thus to respective hMN mitochondrial genome numbers) revealed significantly higher mRNA levels of not only MICU1 and UCP2, but also of MCU and Letm1 in hMNs from SOD1G93A mice (each about 1.8-fold higher compared to WT), while levels of MCUR1 and MNCX were not altered (Figure 4B left and Table 2B). In addition, by cell-specific normalization of hMN qPCR data for all analyzed plasma membrane Ca2+ transporters to relative ChAT levels (and thus to respective hMN cell-sizes), we detected about 1.7-fold higher mRNA-levels, selectively of NCX1 in hMNs from SOD1G93A mice compared to WT (Figure 4B right and Table 2B). All other tested plasma membrane Ca2+ transporters (PMCA1-4 and NCX3) were not altered in hMNs from SOD1G93A mice compared to those of WT.
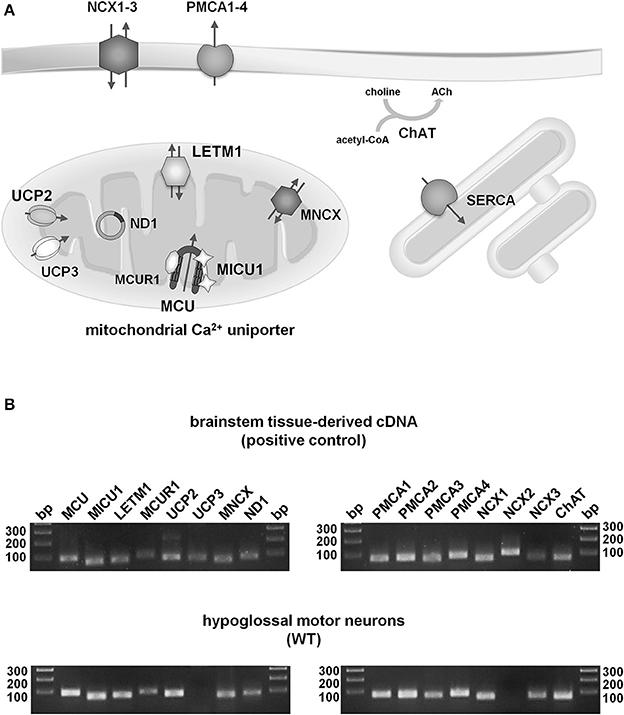
Figure 3. Qualitative expression profiling of putative mitochondrial and plasma membrane Ca2+ transporters in individual hypoglossal motor neurons from WT and endstage SOD1G93A mice. (A) Illustration of proteins for main putative mitochondrial (MCU/MICU1/MICUR1, Letm1, UCP2/3, MNCX), plasma membrane (PMCA1-4, NCX1-3) and ER (SERCA) Ca2+ transporters in cholinergic (ChAT) hMNs. For details and abbreviations, please see text. (B) Upper: Agarose gel (2%) electrophoresis of RT-qPCR products indicates that all putative mitochondrial and plasma membrane Ca2+ transporters, as well as ChAT and ND1, are expressed in cDNA, derived from mouse brainstem tissue (positive control). Lower: Agarose gel electrophoresis of RT-qPCR products shows that all putative mitochondrial and plasma membrane Ca2+ transporters, but UCP3 and NCX2, are expressed in ChAT and ND1 positive hMNs from WT mice (as well as from SOD1G93A mice, not shown) (bp: base pairs, DNA ladder).
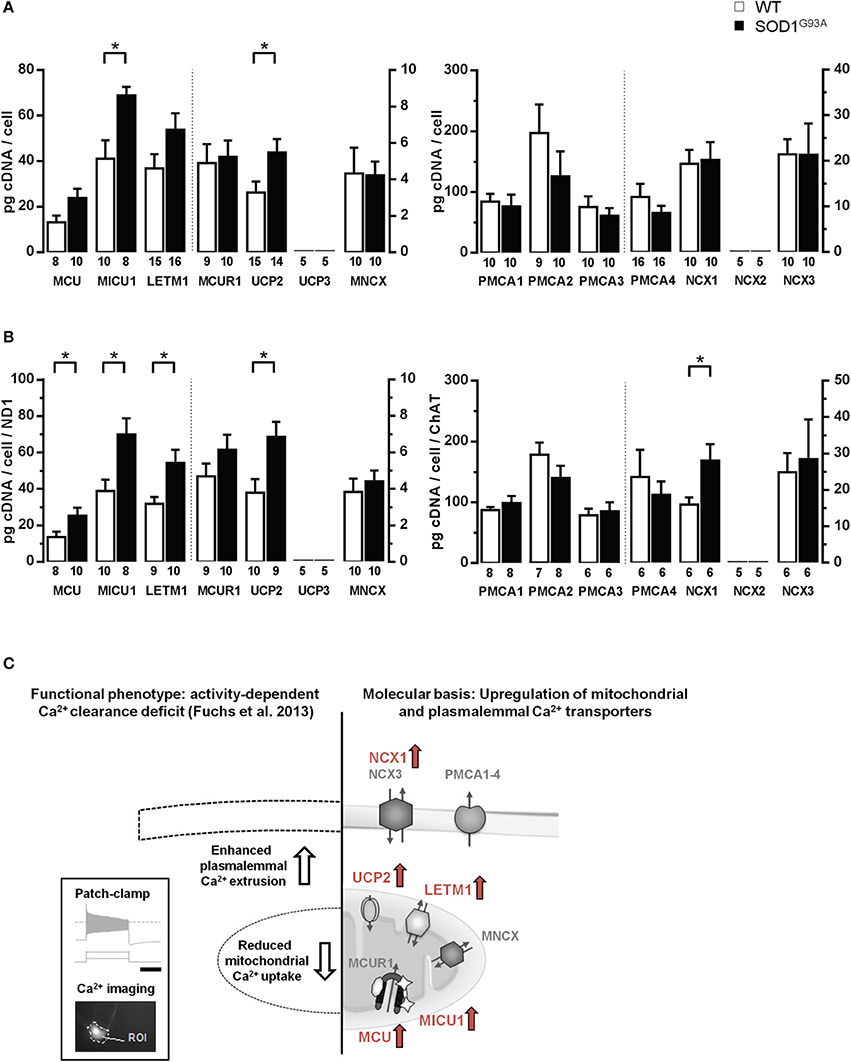
Figure 4. Elevated mRNA-levels of distinct Ca2+ transporters in individual hypoglossal motor neurons from SOD1G93A mice compared to WT. (A) Cell-specific RT-qPCR data for mitochondrial and plasma membrane Ca2+ transporters, derived from pools of 15 hMNs each from SOD1G93A mice and WT. Data are given as [pg/cell] in respect to a cDNA standard curve, generated from WT mouse brainstem tissue. (B) Data from (A), normalized to mitochondrially coded ND1 DNA-levels for mitochondrial Ca2+ transporters, and to ChAT cDNA levels for plasma membrane Ca2+ transporters. Significant differences according to Mann-Whitney-U-Tests are marked with (*), as defined in methods section. Note that data in (A,B) for the respective genes refer to two different axes, as indicated by the dashed line. (C) Right: Overview of concerted elevated Ca2+ transporter expression in individual hMN from SOD1G93A mice compared to WT (marked in red: MCU/MICU1, Letm1, UCP2, and NCX1). Left: These findings can provide a molecular basis for the recently described, selective functional, activity-dependent Ca2+ homeostasis deficit in hMN from endstage SOD1G93A mice. Insert shows stimulation protocol and resulting electrophysiological recordings (scale bar: 1 s), combined with calcium imaging (for details please see text and Fuchs et al., 2013).
In summary (Figure 4C), we detected at the mRNA-level a concerted up-regulation of three distinct putative mitochondrial Ca2+ transporters, MCU/MICU1, Letm1 and UCP2, in individual hMNs from endstage SOD1G93A mice compared to WT, likely causing altered Ca2+ uptake of diseased mitochondria in hMN from SOD1G93A mice. The elevated expression of the plasma membrane Ca2+ transporter NCX1 provides a molecular explanation for the described functionally enhanced activity dependent intracellular Ca2+ extrusion via the plasma membrane in hMNs from SOD1G93A mice (Fuchs et al., 2013).
Discussion
Here we provide a cell-specific quantitative analysis of mitochondrial and plasma membrane Ca2+ transporter mRNA expression in highly vulnerable cholinergic hypoglossal motor neurons from SOD1G93A transgenic mice compared to WT. We identified a selective up-regulation of the mitochondrial Ca2+ transporters MCU/MICU1, Letm1 and UCP2 as well as of the plasma membrane Na+/Ca2+ exchanger NCX1 in remaining hMNs in endstage SOD1G93A mice, while cDNA and genomic DNA levels for the mitochondrially coded ND1 gene, as well as cDNA levels for ChAT, the key enzyme for acetylcholine-synthesis, were not altered.
SOD1G93A transgenic mice are still the most widely used and most extensively characterized mouse-model for ALS (Vinsant et al., 2013a,b). These mice express a high copy number of the human G93A mutant SOD1, and recapitulate many key features of the human ALS phenotype, like adult disease onset, selective motor neuron degeneration and axonal loss (Gurney et al., 1994; Chiu et al., 1995; Fuchs et al., 2010). The limited clinical efficacy of compounds tested on SOD1 mice (Vucic et al., 2014), as well as the notion that SOD1 mutations account only for a small number (~2%) of sporadic ALS cases (Renton et al., 2013) prompted the generation of new rodent ALS-models, like mice with mutated or overexpressed TDP-43 or fused in sarcoma (FUS) (Da Cruz and Cleveland, 2011; Van Den Bosch, 2011; Wegorzewska and Baloh, 2011; McGoldrick et al., 2013). However, given our previous functional analysis of activity dependent Ca2+ homeostasis in hMNs from SOD1G93A mice (Fuchs et al., 2013) and the fact that none of the recently generated models was shown to recapitulate most aspects of human ALS as convincing as the SOD1 mutant mouse, we continued to focus on the analysis of SOD1G93A mice in this complementary study.
Although mitochondrial dysfunction is present in MNs in human ALS as well as in SOD1G93A mice (Barrett et al., 2011; Martin, 2011), and macroscopic and functional alterations of mitochondria have been characterized extensively (Kawamata and Manfredi, 2010; Cozzolino and Carrì, 2012; Vehviläinen et al., 2014), the number of mitochondria/mitochondrial genomes in highly vulnerable MNs to our knowledge has not yet been addressed. Our cell-specific ND1 data (Figure 2A) argue against significant changes in number of mitochondria or mitochondrial genomes (at least in the cell soma) in hMNs from endstage SOD1G93A mice, compared to WT. In accordance with our findings, ND2 genomic DNA levels in human postmortem spinal cord motor neurons of ALS patients were also not altered compared to controls, whereas mitochondrial genomic DNA-levels for mitochondrially coded cytochrome oxidase and ND4 were significantly lower in ALS (Keeney and Bennett, 2010)—probably due to mitochondrial DNA deletions that occur preferentially in the ND4 gene (He et al., 2002). These deletions or mutations are likely to occur more frequently in ALS, as DNA repair enzymes in mitochondria have been shown to be impaired (Murakami et al., 2007).
In addition, our cell-specific data identified mitochondrially coded ND1 as a well-suited gene for normalization and further stratification of RT-qPCR data from hMNs. This is particularly useful when analyzing cell-specific expression-levels of targets with gene-products located in mitochondria (like MCU/MICU1/MICUR1, Letm1, UCP2, and MNCX). Furthermore, we identified ChAT as a well-suited gene for normalization of RT-qPCR data for target-genes expressed in the cytoplasm or in the plasma membranes of hMNs (like PMCA1-4 and NCX1/3). Our data show, that this cell- and transporter-class-specific normalization approach allows stratification of single cell hMN expression data, and thus reduces the number of neurons or neuronal pools that need to be analyzed for detection of significant differences (compare Figures 4A,B, Table 2B and Fuchs et al., 2013); MCU here: n = 8 and 8; in Fuchs et al. without normalization n = 21 and 39 for WT and SOD1G93A hMN pools, respectively).
GFAP Co-Expression in ChAT-Positive hMNs Selectively from SOD1G93A but not from WT Mice?
Surprisingly, with multiplex-nested PCR, as well as with more sensitive qPCR, we detected GFAP co-expression in about 50 or 100% respectively, of analyzed ChAT positive hMN cDNA pools from SOD1G93A mice but not in WT (Figure 2B and Table 2A). How to interpret these findings? As we can exclude general technical issues (i.e., contaminations), we provide two explanations for the detected GFAP signals selectively in hMNs from SOD1G93A but not WT mice. Either SOD1G93A hMNs might de-differentiate or reprogram their neuronal phenotype due to the disease process, as described for other cell types (Sarthy et al., 1991; Hol et al., 2003; Arendt, 2008; Puri and Hebrok, 2012; Qiang et al., 2013; Gao et al., 2014), and due to this process co-express GFAP. Or alternatively, the well-described reactive atsroglia cell activation and proliferation, present in ALS and other neurodegenerative diseases (Guan et al., 2007; Chen et al., 2012; Parpura et al., 2012; Forsberg et al., 2011; Bi et al., 2013), might change the morphological astroglia—neuron interaction, and thus, dendrites of astroglial cells might reside more closely to hMNs from SOD1G93A compared to WT, and might have been partly laser microdissected together with the hMN cell bodies. However, it is important to note that we gained no morphological evidence for this latter GFAP contamination explanation in our UV-LMD samples from SOD1G93A brains. Furthermore, we never detected respective GFAP co-expression in individual dopamine neurons from, e.g., Parkinson's disease brains, where a respective reactive gliosis also has been described ('Episcopo et al., 2013), or from respective Parkinson's disease mouse models, in over 15 years of UV-LMD RT-qPCR analysis of individual dopamine neurons (Ramirez et al., 2006; Gründemann et al., 2008, 2011; Schiemann et al., 2012; Schlaudraff et al., 2014). Thus, while we can rule out general methodological issues, we cannot for sure conclude that the detected GFAP signal of hMNs selectively from SOD1G93A but not from WT mice is genuinely derived from hMNs, and further immunohistological studies are necessary to address this point and its possible implication for ALS. However, this surprising finding further highlights the emerging crucial role of astroglia cells in ALS and its animal models (Valori et al., 2014). Indeed mutant SOD1 expression has been shown to greatly affect the astroglial functional phenotype, turning astrocytes into neurotoxic cells, more prone to cell death, and altering their vital MN-supportive functions (Valori et al., 2014).
Elevated mRNA Levels of the Mitochondrial Ca2+ Transporters MCU/MICU1, Letm1 and UCP2 and the Plasma Membrane Na+/Ca2+ Exchanger NCX1 in hMNs of SOD1G93A Mice
The present study was motivated by our recent finding of an activity-dependent Ca2+ clearance deficit selectively in individual hMNs, at the endstage of disease in SOD1G93A mice (Fuchs et al., 2013). More precisely, by combining patch-clamp analysis with fura-2 calcium imaging and selective pharmacology (e.g., the MCU-inhibitor RU-360) of individual, highly vulnerable hypoglossal and mostly resistant oculomotor MNs, we identified a remodeling of activity-dependent, intracellular Ca2+ clearance, selectively in hMNs in SOD1G93A mice at disease endstage, that was characterized by a reduction of mCU-mediated mitochondrial Ca2+ uptake, and an enhanced Ca2+ extrusion across the plasma membrane, under high-Ca2+ loading conditions (Fuchs et al., 2013). Our preliminary molecular analysis pointed to a complex underlying mechanism, as mRNA-levels of the mCU core components MCU and MICU1 were about 1.7-fold higher in hMNs from SOD1G93A mice (Fuchs et al., 2013). With an improved UV-LMD RT-qPCR protocol (Figures 1, 2), we could reproduce these findings in an independent cohort of mice (Figures 4A,B; Table 1B). Increased MCU/MICU1 expression might enforce metabolic coupling, as mitochondrial Ca2+ activates, e.g., enzymes of the tricarboxylic acid cycle (McCormack and Denton, 1990; Wiederkehr et al., 2011). On the other hand, MICU1 does also act as gatekeeper of mCU that sets a threshold for maximal Ca2+ uptake. Thus, a MICU1 up-regulation provides a protective mechanism against mitochondrial calcium overload due to increased cytosolic Ca2+ levels (Mallilankaraman et al., 2012b), preventing excessive ROS generation and apoptosis (de Stefani et al., 2011). This mCU repressor-function of elevated MICU1 could explain the described functionally reduced mitochondrial Ca2+ uptake, while MICU1 and MCU mRNA levels are elevated. The finding that mRNA-levels of another regulatory mCU subunit MCUR1 (Mallilankaraman et al., 2012a) were not altered in hMNs from SOD1G93A mice, further supports the idea that the stoichiometry and thus general function of mCU might indeed be altered in hMNs from SOD1G93A mice. Additional mCU components have recently been identified (Marchi and Pinton, 2014), like EMRE and MICU2, which regulate MCU/MICU1 activity (Ahuja and Muallem, 2014; Kamer and Mootha, 2014; Kevin Foskett and Madesh, 2014), that need to be analyzed in further studies.
In addition to elevated MCU/MICU1 levels, we detected similarly elevated levels for Letm1 as well as for UCP2 mRNA in hMNs from SOD1G93A mice, while UCP3 mRNA was neither detected in hMNs from WT nor from transgenes (Figures 4A,B; Table 1B). Letm1 is regarded as a highly Ca2+ sensitive mitochondrial Ca2+/H+ exchanger, operating mainly at cytosolic Ca2+ levels below 1 μM (Jiang et al., 2009; Waldeck-Weiermair et al., 2011). As significant mitochondrial Ca2+ uptake via the mCU becomes apparent particularly at cytosolic Ca2+ concentrations not below 5–10 μm (Rizzuto and Pozzan, 2006; Marchi and Pinton, 2014), a concerted up-regulation of mCU and Letm1 migth counteract pathophysiological activity dependent, altered cytosolic Ca2+ levels in SOD1G93A mice, and thereby promote hMN survival. This complex view is further supported by the detected elevated levels of UCP2 in hMNs from SOD1G93A mice. In addition to the proposed mediated direct mitochondrial Ca2+ uptake, UCP2 acts as mitochondrial uncoupling protein, and thus decreases the amount of reactive oxygen species produced by a steep proton gradient of the respiratory chain (Donadelli et al., 2014). This mild uncoupling has been shown to be neuroprotective in highly vulnerable dopamine neurons in mouse models of Parkinson's disease (Liss et al., 2005; Guzman et al., 2010). However, overexpression of human UCP2 in SOD1G93A mice paradoxically accelerated disease progression and further reduced mitochondrial Ca2+ uptake capacity (Peixoto et al., 2013). The authors conclude, that in bio-energetically defective mitochondria of SOD1G93A mice, UCP2 might have adverse effects, possibly by enhancing sensitivity to Ca2+ induced depolarization of mitochondria and/or interacting with other Ca2+ uptake pathways.
Mitochondrial Ca2+ uptake and Ca2+ transporter activity is closely related to ER Ca2+ uptake, predominantly mediated by SERCA (Hovnanian, 2007; Chaudhari et al., 2014; Hajnóczky et al., 2014). We did however not analyze mRNA expression levels of SERCA-isoforms, as our previous functional and pharmacological (thapsigargin) analysis gave no hint for altered ER Ca2+ uptake in hMNs of endstage SOD1G93A mice, but for enhanced plasma membrane Ca2+extrusion (compare Figure 4C and Fuchs et al., 2013). In accordance with this functional phenotype, we detected an about 1.7-fold higher mRNA-level of the plasma membrane Na+/Ca2+ exchanger NCX1 in hMNs from SOD1G93A mice, while NCX2 was not expressed, and NCX3 as well as PMCX1-4 mRNA-levels were not altered (Figure 4 and Table 2B). The lack of NCX2 mRNA detection in hMNs from WT as well as from SOD1G93A mice is somewhat surprising, since this isoform was attributed a key role in neuronal Ca2+ homeostasis (Brini and Carafoli, 2011). The low-affinity/high-capacity Ca2+ transporter NCX is believed to mediate the bulk of plasma membrane Ca2+ export after stimulation, rather than the PMCAs (Brini and Carafoli, 2011; Sharma and O'Halloran, 2014). Moreover, NCXs are controlled by cytosolic concentrations of Na+ and Ca2+ (Brini and Carafoli, 2011), thus the observed increased functional plasma membrane Ca2+-extrusion is likely caused by an enhanced NCX1 expression, accompanied by an enhanced functional NCX transport capacity, due to pathologically elevated cytosolic Ca2+ and a reduced mitochondrial Ca2+ uptake capacity in hMNs from endstage SOD1G93A mice. Vice versa, overexpression of NCX1 has been shown to reduce not only cytosolic but also mitochondrial Ca2+ transients, providing an additional feedback loop to protect mitochondria from an extensive Ca2+ overload (Brini et al., 2002). An up-regulation of NCX1 in neurons has been demonstrated to be neuroprotective in other pathologic conditions, e.g., ischemic events (Pignataro et al., 2012). However, PMCAs are also stimulated by Ca2+ via calmodulin or phosphorylation (Strehler, 2013; Lopreiato et al., 2014). As specific PMCA splice variants differ, e.g., in their affinity and reaction upon calmodulin binding (Brini et al., 2013; Strehler, 2013), an pathologic shift in PMCA splice variants might also contribute to enhanced plasma membrane Ca2+ extrusion in hMNs from SOD1G93A mice. It is noteworthy in this context, that our PMCA TaqMan assays are detecting but not discriminating distinct PMCA splice variants. To date, functional studies of plasma membrane Ca2+ transporters are hampered by lack of specific pharmacology which makes it difficult to address the distinct contributions of individual NCX- or PMCA-isoforms (Strehler, 2013).
In conclusion, this study provides novel molecular and cell-specific insights into the complex nature of cytosolic Ca2+ dysregulation and mitochondrial dysfunction in highly vulnerable hMNs in the most common ALS mouse model, the endstage SOD1G93A mice. The detected concerted up-regulation of distinct mitochondrial and plasma membrane Ca2+ transporters with different locations as well as transport kinetics (mCU, Letm1, UCP2, NCX1) might serve as a complex compensatory response to the disease trigger and to the altered Ca2+ homeostasis, and protect hMNs in SOD1G93A mice from mitochondrial Ca2+ overload and degeneration. However, as we analyzed endstage SOD1G93A mice, where already about 30% of hMNs are lost (Haenggeli and Kato, 2002), we do not know, if the molecular up-regulation of distinct Ca2+ transporters did indeed protect those remaining hMNs from degeneration.
Author Contributions
TM and JD carried out all experiments and performed data analysis, TM, JD and BL designed the study and wrote the manuscript. JHW and ACL bred and provided SOD1G93A and WT mice and revised the manuscript.
Conflict of Interest Statement
The authors declare that the research was conducted in the absence of any commercial or financial relationships that could be construed as a potential conflict of interest.
Acknowledgments
We thank Andrea Fuchs for initial training in preparation of hypoglossal nuclei in SOD1G93A and WT mice, Andreas Bender for advice concerning genomic ND1 quantification, and Dietmar Thal and Bernhard Keller for general discussion. We thank Stefanie Schulz, Desiree Spaich and Tanja Wipp for excellent technical support. This work was supported by the BMBF (NGFN 01GS08134), by the DFG (SFB497 ans Li1745), the Austrian Science Fund (FWF SFB F4412), and the Alfried Krupp prize (all to BL), as well as by the German network for ALS research (MND-NET), the Charcot Foundation for ALS Research and the virtual Helmholtz Institute (to ACL and JHW). TM and JD were supported by the MD and PhD programs for Experimental and Molecular Medicine and the Research Training Group CEMMA (DFG) of Ulm University.
References
Ahuja, M., and Muallem, S. (2014). The gatekeepers of mitochondrial calcium influx: MICU1 and MICU2. EMBO Rep. 15, 205–206. doi: 10.1002/embr.201438446
Pubmed Abstract | Pubmed Full Text | CrossRef Full Text | Google Scholar
Arendt, T. (2008). “Differentiation and de-differentiation—neuronal cell-cycle regulation during development and age-related neurodegenerative disorders,” in Handbook of Neurochemistry and Molecular Neurobiology, eds A. Lajtha, J. R. Perez-Polo, and S. Rossner (Boston, MA: Springer US), 157–213.
Barrett, E. F., Barrett, J. N., and David, G. (2011). Mitochondria in motor nerve terminals: function in health and in mutant superoxide dismutase 1 mouse models of familial ALS. J. Bioenerg. Biomembr. 43, 581–586. doi: 10.1007/s10863-011-9392-1
Pubmed Abstract | Pubmed Full Text | CrossRef Full Text | Google Scholar
Baughman, J. M., Perocchi, F., Girgis, H. S., Plovanich, M., Belcher-Timme, C. A., Sancak, Y., et al. (2011). Integrative genomics identifies MCU as an essential component of the mitochondrial calcium uniporter. Nature 476, 341–345. doi: 10.1038/nature10234
Pubmed Abstract | Pubmed Full Text | CrossRef Full Text | Google Scholar
Bender, A., Krishnan, K. J., Morris, C. M., Taylor, G. A., Reeve, A. K., Perry, R. H., et al. (2006). High levels of mitochondrial DNA deletions in substantia nigra neurons in aging and Parkinson disease. Nat. Genet. 38, 515–517. doi: 10.1038/ng1769
Pubmed Abstract | Pubmed Full Text | CrossRef Full Text | Google Scholar
Bi, F., Huang, C., Tong, J., Qiu, G., Huang, B., Wu, Q., et al. (2013). Reactive astrocytes secrete lcn2 to promote neuron death. Proc. Natl. Acad. Sci. U.S.A. 110, 4069–4074. doi: 10.1073/pnas.1218497110
Pubmed Abstract | Pubmed Full Text | CrossRef Full Text | Google Scholar
Brini, M., Calì, T., Ottolini, D., and Carafoli, E. (2013). The plasma membrane calcium pump in health and disease. FEBS J. 280, 5385–5397. doi: 10.1111/febs.12193
Pubmed Abstract | Pubmed Full Text | CrossRef Full Text | Google Scholar
Brini, M., and Carafoli, E. (2011). The plasma membrane Ca2+ ATPase and the plasma membrane sodium calcium exchanger cooperate in the regulation of cell calcium. Cold Spring Harb. Perspect. Biol. 3:a004168. doi: 10.1101/cshperspect.a004168
Pubmed Abstract | Pubmed Full Text | CrossRef Full Text | Google Scholar
Brini, M., Manni, S., and Carafoli, E. (2002). A study of the activity of the plasma membrane Na/Ca exchanger in the cellular environment. Ann. N.Y. Acad. Sci. 976, 376–381. doi: 10.1111/j.1749-6632.2002.tb04764.x
Pubmed Abstract | Pubmed Full Text | CrossRef Full Text | Google Scholar
Bruijn, L. I., Becher, M. W., Lee, M. K., Anderson, K. L., Jenkins, N. A., Copeland, N. G., et al. (1997). ALS-linked SOD1 mutant G85R mediates damage to astrocytes and promotes rapidly progressive disease with SOD1-containing inclusions. Neuron 18, 327–338. doi: 10.1016/S0896-6273(00)80272-X
Pubmed Abstract | Pubmed Full Text | CrossRef Full Text | Google Scholar
Carrì, M. T., Ferri, A., Battistoni, A., Famhy, L., Gabbianelli, R., Poccia, F., et al. (1997). Expression of a Cu,Zn superoxide dismutase typical of familial amyotrophic lateral sclerosis induces mitochondrial alteration and increase of cytosolic Ca2+ concentration in transfected neuroblastoma SH-SY5Y cells. FEBS Lett. 414, 365–368. doi: 10.1016/S0014-5793(97)01051-X
Pubmed Abstract | Pubmed Full Text | CrossRef Full Text | Google Scholar
Charcot, J., and Joffroy, A. (1869). Deux cas d'atrophie musculaire progressive avec lésions de la substance grise et des faisceaux antéro-latéraux de la moelle épiniére. Arch. Physiol. Neurol Path. 2, 744–750.
Chaudhari, N., Talwar, P., Parimisetty, A., Lefebvre d'Hellencourt, C., and Ravanan, P. (2014). A molecular web: endoplasmic reticulum stress, inflammation, and oxidative stress. Front. Cell. Neurosci. 8:213. doi: 10.3389/fncel.2014.00213
Pubmed Abstract | Pubmed Full Text | CrossRef Full Text | Google Scholar
Chen, Y., Guan, Y., Liu, H., Wu, X., Yu, L., Wang, S., et al. (2012). Activation of the Wnt/β-catenin signaling pathway is associated with glial proliferation in the adult spinal cord of ALS transgenic mice. Biochem. Biophys. Res. Commun. 420, 397–403. doi: 10.1016/j.bbrc.2012.03.006
Pubmed Abstract | Pubmed Full Text | CrossRef Full Text | Google Scholar
Chinopoulos, C., and Adam-Vizi, V. (2010). Mitochondrial Ca2+ sequestration and precipitation revisited. FEBS J. 277, 3637–3651. doi: 10.1111/j.1742-4658.2010.07755.x
Pubmed Abstract | Pubmed Full Text | CrossRef Full Text | Google Scholar
Chiu, A. Y., Zhai, P., Dal Canto, M. C., Peters, T. M., Kwon, Y. W., Prattis, S. M., et al. (1995). Age-dependent penetrance of disease in a transgenic mouse model of familial amyotrophic lateral sclerosis. Mol. Cell. Neurosci. 6, 349–362. doi: 10.1006/mcne.1995.1027
Pubmed Abstract | Pubmed Full Text | CrossRef Full Text | Google Scholar
Cleveland, D. W., and Rothstein, J. D. (2001). From Charcot to Lou Gehrig: deciphering selective motor neuron death in ALS. Nat. Rev. Neurosci. 2, 806–819. doi: 10.1038/35097565
Pubmed Abstract | Pubmed Full Text | CrossRef Full Text | Google Scholar
Coussee, E., de Smet, P., Bogaert, E., Elens, I., van Damme, P., Willems, P., et al. (2011). G37R SOD1 mutant alters mitochondrial complex I activity, Ca2+ uptake and ATP production. Cell Calcium 49, 217–225. doi: 10.1016/j.ceca.2011.02.004
Pubmed Abstract | Pubmed Full Text | CrossRef Full Text | Google Scholar
Cozzolino, M., and Carrì, M. T. (2012). Mitochondrial dysfunction in ALS. Prog. Neurobiol. 97, 54–66. doi: 10.1016/j.pneurobio.2011.06.003
Pubmed Abstract | Pubmed Full Text | CrossRef Full Text | Google Scholar
Da Cruz, S., and Cleveland, D. W. (2011). Understanding the role of TDP-43 and FUS/TLS in ALS and beyond. Curr. Opin. Neurobiol. 21, 904–919. doi: 10.1016/j.conb.2011.05.029
Pubmed Abstract | Pubmed Full Text | CrossRef Full Text | Google Scholar
Damiano, M., Starkov, A. A., Petri, S., Kipiani, K., Kiaei, M., Mattiazzi, M., et al. (2006). Neural mitochondrial Ca2+ capacity impairment precedes the onset of motor symptoms in G93A Cu/Zn-superoxide dismutase mutant mice. J. Neurochem. 96, 1349–1361. doi: 10.1111/j.1471-4159.2006.03619.x
Pubmed Abstract | Pubmed Full Text | CrossRef Full Text | Google Scholar
DeJesus-Hernandez, M., Mackenzie, I. R., Boeve, B. F., Boxer, A. L., Baker, M., Rutherford, N. J., et al. (2011). Expanded GGGGCC hexanucleotide repeat in noncoding region of C9ORF72 causes chromosome 9p-linked FTD and ALS. Neuron 72, 245–256. doi: 10.1016/j.neuron.2011.09.011
Pubmed Abstract | Pubmed Full Text | CrossRef Full Text | Google Scholar
de Marchi, U., Santo-Domingo, J., Castelbou, C., Sekler, I., Wiederkehr, A., and Demaurex, N. (2014). NCLX protein, but not LETM1, mediates mitochondrial Ca2+ extrusion, thereby limiting Ca2+-induced NAD(P)H production and modulating matrix redox state. J. Biol. Chem. 289, 20377–20385. doi: 10.1074/jbc.M113.540898
Pubmed Abstract | Pubmed Full Text | CrossRef Full Text | Google Scholar
de Stefani, D., Raffaello, A., Teardo, E., Szabò, I., and Rizzuto, R. (2011). A forty-kilodalton protein of the inner membrane is the mitochondrial calcium uniporter. Nature 476, 336–340. doi: 10.1038/nature10230
Pubmed Abstract | Pubmed Full Text | CrossRef Full Text | Google Scholar
Donadelli, M., Dando, I., Fiorini, C., and Palmieri, M. (2014). UCP2, a mitochondrial protein regulated at multiple levels. Cell. Mol. Life Sci. 71, 1171–1190. doi: 10.1007/s00018-013-1407-0
Pubmed Abstract | Pubmed Full Text | CrossRef Full Text | Google Scholar
Dragicevic, E., Poetschke, C., Duda, J., Schlaudraff, F., Lammel, S., Schiemann, J., et al. (2014). Cav1.3 channels control D2-autoreceptor responses via NCS-1 in substantia nigra dopamine neurons. Brain 137(Pt 8), 2287–2302. doi: 10.1093/brain/awu131
Pubmed Abstract | Pubmed Full Text | CrossRef Full Text | Google Scholar
Drago, I., Pizzo, P., and Pozzan, T. (2011). After half a century mitochondrial calcium in- and efflux machineries reveal themselves. EMBO J. 30, 4119–4125. doi: 10.1038/emboj.2011.337
Pubmed Abstract | Pubmed Full Text | CrossRef Full Text | Google Scholar
'Episcopo, F. L., Tirolo, C., Testa, N., Caniglia, S., Morale, M. C., and Marchetti, B. (2013). Reactive astrocytes are key players in nigrostriatal dopaminergic neurorepair in the MPTP mouse model of Parkinson's disease: focus on endogenous neurorestoration. Curr. Aging Sci. 6, 45–55. doi: 10.2174/1874609811306010007
Pubmed Abstract | Pubmed Full Text | CrossRef Full Text | Google Scholar
Ferraiuolo, L., Kirby, J., Grierson, A. J., Sendtner, M., and Shaw, P. J. (2011). Molecular pathways of motor neuron injury in amyotrophic lateral sclerosis. Nat. Rev. Neurol. 7, 616–630. doi: 10.1038/nrneurol.2011.152
Pubmed Abstract | Pubmed Full Text | CrossRef Full Text | Google Scholar
Forsberg, K., Andersen, P. M., Marklund, S. L., and Brännström, T. (2011). Glial nuclear aggregates of superoxide dismutase-1 are regularly present in patients with amyotrophic lateral sclerosis. Acta Neuropathol. 121, 623–634. doi: 10.1007/s00401-011-0805-3
Pubmed Abstract | Pubmed Full Text | CrossRef Full Text | Google Scholar
Fuchs, A., Kutterer, S., Mühling, T., Duda, J., Schütz, B., Liss, B., et al. (2013). Selective mitochondrial Ca2+ uptake deficit in disease endstage vulnerable motoneurons of the SOD1G93A mouse model of amyotrophic lateral sclerosis. J. Physiol. (Lond.) 591(Pt 10), 2723–2745. doi: 10.1113/jphysiol.2012.247981
Pubmed Abstract | Pubmed Full Text | CrossRef Full Text | Google Scholar
Fuchs, A., Ringer, C., Bilkei-Gorzo, A., Weihe, E., Roeper, J., and Schütz, B. (2010). Downregulation of the potassium chloride cotransporter KCC2 in vulnerable motoneurons in the SOD1-G93A mouse model of amyotrophic lateral sclerosis. J. Neuropathol. Exp. Neurol. 69, 1057–1070. doi: 10.1097/NEN.0b013e3181f4dcef
Pubmed Abstract | Pubmed Full Text | CrossRef Full Text | Google Scholar
Gao, T., McKenna, B., Li, C., Reichert, M., Nguyen, J., Singh, T., et al. (2014). Pdx1 maintains β cell identity and function by repressing an α cell program. Cell Metab. 19, 259–271. doi: 10.1016/j.cmet.2013.12.002
Pubmed Abstract | Pubmed Full Text | CrossRef Full Text | Google Scholar
Grosskreutz, J., Haastert, K., Dewil, M., van Damme, P., Callewaert, G., Robberecht, W., et al. (2007). Role of mitochondria in kainate-induced fast Ca2+ transients in cultured spinal motor neurons. Cell Calcium 42, 59–69. doi: 10.1016/j.ceca.2006.11.010
Pubmed Abstract | Pubmed Full Text | CrossRef Full Text | Google Scholar
Grosskreutz, J., Van Den Bosch, L., and Keller, B. U. (2010). Calcium dysregulation in amyotrophic lateral sclerosis. Cell Calcium 47, 165–174. doi: 10.1016/j.ceca.2009.12.002
Pubmed Abstract | Pubmed Full Text | CrossRef Full Text | Google Scholar
Gründemann, J., Schlaudraff, F., Haeckel, O., and Liss, B. (2008). Elevated alpha-synuclein mRNA levels in individual UV-laser-microdissected dopaminergic substantia nigra neurons in idiopathic Parkinson's disease. Nucleic Acids Res. 36, e38. doi: 10.1093/nar/gkn084
Pubmed Abstract | Pubmed Full Text | CrossRef Full Text | Google Scholar
Gründemann, J., Schlaudraff, F., and Liss, B. (2011). UV-laser microdissection and mRNA expression analysis of individual neurons from postmortem Parkinson's disease brains. Methods Mol. Biol. 755, 363–374. doi: 10.1007/978-1-61779-163-5_30
Pubmed Abstract | Pubmed Full Text | CrossRef Full Text | Google Scholar
Guan, Y. J., Wang, X., Wang, H. Y., Kawagishi, K., Ryu, H., Huo, C. F., et al. (2007). Increased stem cell proliferation in the spinal cord of adult amyotrophic lateral sclerosis transgenic mice. J. Neurochem. 102, 1125–1138. doi: 10.1111/j.1471-4159.2007.04610.x
Pubmed Abstract | Pubmed Full Text | CrossRef Full Text | Google Scholar
Gurney, M. E., Pu, H., Chiu, A. Y., Dal Canto, M. C., Polchow, C. Y., Alexander, D. D., et al. (1994). Motor neuron degeneration in mice that express a human Cu,Zn superoxide dismutase mutation. Science 264, 1772–1775. doi: 10.1126/science.8209258
Pubmed Abstract | Pubmed Full Text | CrossRef Full Text | Google Scholar
Guzman, J. N., Sanchez-Padilla, J., Wokosin, D., Kondapalli, J., Ilijic, E., Schumacker, P. T., et al. (2010). Oxidant stress evoked by pacemaking in dopaminergic neurons is attenuated by DJ-1. Nature 468, 696–700. doi: 10.1038/nature09536
Pubmed Abstract | Pubmed Full Text | CrossRef Full Text | Google Scholar
Haenggeli, C., and Kato, A. C. (2002). Differential vulnerability of cranial motoneurons in mouse models with motor neuron degeneration. Neurosci. Lett. 335, 39–43. doi: 10.1016/S0304-3940(02)01140-0
Pubmed Abstract | Pubmed Full Text | CrossRef Full Text | Google Scholar
Haeusler, A. R., Donnelly, C. J., Periz, G., Simko, E. A. J., Shaw, P. G., Kim, M.-S., et al. (2014). C9orf72 nucleotide repeat structures initiate molecular cascades of disease. Nature 507, 195–200. doi: 10.1038/nature13124
Pubmed Abstract | Pubmed Full Text | CrossRef Full Text | Google Scholar
Hajnóczky, G., Booth, D., Csordás, G., Debattisti, V., Golenár, T., Naghdi, S., et al. (2014). Reliance of ER-mitochondrial calcium signaling on mitochondrial EF-hand Ca(2+) binding proteins: miros, MICUs, LETM1 and solute carriers. Curr. Opin. Cell Biol. 29C, 133–141. doi: 10.1016/j.ceb.2014.06.002
Pubmed Abstract | Pubmed Full Text | CrossRef Full Text | Google Scholar
Hardiman, O., van den Berg, L. H., and Kiernan, M. C. (2011). Clinical diagnosis and management of amyotrophic lateral sclerosis. Nat. Rev. Neurol. 7, 639–649. doi: 10.1038/nrneurol.2011.153
Pubmed Abstract | Pubmed Full Text | CrossRef Full Text | Google Scholar
He, L., Chinnery, P. F., Durham, S. E., Blakely, E. L., Wardell, T. M., Borthwick, G. M., et al. (2002). Detection and quantification of mitochondrial DNA deletions in individual cells by real-time PCR. Nucleic Acids Res. 30, e68. doi: 10.1093/nar/gnf067
Pubmed Abstract | Pubmed Full Text | CrossRef Full Text | Google Scholar
Hol, E. M., Roelofs, R. F., Moraal, E., Sonnemans, M. A. F., Sluijs, J. A., Proper, E. A., et al. (2003). Neuronal expression of GFAP in patients with Alzheimer pathology and identification of novel GFAP splice forms. Mol. Psychiatry 8, 786–796. doi: 10.1038/sj.mp.4001379
Pubmed Abstract | Pubmed Full Text | CrossRef Full Text | Google Scholar
Hovnanian, A. (2007). SERCA pumps and human diseases. Subcell. Biochem. 45, 337–363. doi: 10.1007/978-1-4020-6191-2_12
Pubmed Abstract | Pubmed Full Text | CrossRef Full Text | Google Scholar
Ilieva, H., Polymenidou, M., and Cleveland, D. W. (2009). Non-cell autonomous toxicity in neurodegenerative disorders: ALS and beyond. J. Cell Biol. 187, 761–772. doi: 10.1083/jcb.200908164
Pubmed Abstract | Pubmed Full Text | CrossRef Full Text | Google Scholar
Jaiswal, M. K., and Keller, B. U. (2009). Cu/Zn superoxide dismutase typical for familial amyotrophic lateral sclerosis increases the vulnerability of mitochondria and perturbs Ca2+ homeostasis in SOD1G93A mice. Mol. Pharmacol. 75, 478–489. doi: 10.1124/mol.108.050831
Pubmed Abstract | Pubmed Full Text | CrossRef Full Text | Google Scholar
Jiang, D., Zhao, L., and Clapham, D. E. (2009). Genome-wide RNAi screen identifies Letm1 as a mitochondrial Ca2+/H+ antiporter. Science 326, 144–147. doi: 10.1126/science.1175145
Pubmed Abstract | Pubmed Full Text | CrossRef Full Text | Google Scholar
Kamer, K. J., and Mootha, V. K. (2014). MICU1 and MICU2 play nonredundant roles in the regulation of the mitochondrial calcium uniporter. EMBO Rep. 15, 299–307. doi: 10.1002/embr.201337946
Pubmed Abstract | Pubmed Full Text | CrossRef Full Text | Google Scholar
Kanning, K. C., Kaplan, A., and Henderson, C. E. (2010). Motor neuron diversity in development and disease. Annu. Rev. Neurosci. 33, 409–440. doi: 10.1146/annurev.neuro.051508.135722
Pubmed Abstract | Pubmed Full Text | CrossRef Full Text | Google Scholar
Kaplan, A., Spiller, K. J., Towne, C., Kanning, K. C., Choe, G. T., Geber, A., et al. (2014). Neuronal matrix metalloproteinase-9 is a determinant of selective neurodegeneration. Neuron 81, 333–348. doi: 10.1016/j.neuron.2013.12.009
Pubmed Abstract | Pubmed Full Text | CrossRef Full Text | Google Scholar
Kawamata, H., and Manfredi, G. (2010). Mitochondrial dysfunction and intracellular calcium dysregulation in ALS. Mech. Ageing Dev. 131, 517–526. doi: 10.1016/j.mad.2010.05.003
Pubmed Abstract | Pubmed Full Text | CrossRef Full Text | Google Scholar
Keeney, P. M., and Bennett, J. P. (2010). ALS spinal neurons show varied and reduced mtDNA gene copy numbers and increased mtDNA gene deletions. Mol. Neurodegener 5:21. doi: 10.1186/1750-1326-5-21
Pubmed Abstract | Pubmed Full Text | CrossRef Full Text | Google Scholar
Kevin Foskett, J., and Madesh, M. (2014). Regulation of the mitochondrial Ca(2+) uniporter by MICU1 and MICU2. Biochem. Biophys. Res. Commun. 449, 377–383. doi: 10.1016/j.bbrc.2014.04.146
Pubmed Abstract | Pubmed Full Text | CrossRef Full Text | Google Scholar
Kim, B., and Matsuoka, S. (2008). Cytoplasmic Na+-dependent modulation of mitochondrial Ca2+ via electrogenic mitochondrial Na+-Ca2+ exchange. J. Physiol. 586, 1683–1697. doi: 10.1113/jphysiol.2007.148726
Pubmed Abstract | Pubmed Full Text | CrossRef Full Text | Google Scholar
Krishnan, K. J., Bender, A., Taylor, R. W., and Turnbull, D. M. (2007). A multiplex real-time PCR method to detect and quantify mitochondrial DNA deletions in individual cells. Anal. Biochem. 370, 127–129. doi: 10.1016/j.ab.2007.06.024
Lee, E. B., Lee, V. M.-Y., and Trojanowski, J. Q. (2012). Gains or losses: molecular mechanisms of TDP43-mediated neurodegeneration. Nat. Rev. Neurosci. 13, 38–50. doi: 10.1038/nrn3121
Pubmed Abstract | Pubmed Full Text | CrossRef Full Text | Google Scholar
Liss, B. (2002). Improved quantitative real-time RT-PCR for expression profiling of individual cells. Nucleic Acids Res. 30, e89. doi: 10.1093/nar/gnf088
Pubmed Abstract | Pubmed Full Text | CrossRef Full Text | Google Scholar
Liss, B., Haeckel, O., Wildmann, J., Miki, T., Seino, S., and Roeper, J. (2005). K-ATP channels promote the differential degeneration of dopaminergic midbrain neurons. Nat. Neurosci. 8, 1742–1751. doi: 10.1038/nn1570
Pubmed Abstract | Pubmed Full Text | CrossRef Full Text | Google Scholar
Lopreiato, R., Giacomello, M., and Carafoli, E. (2014). The plasma membrane calcium pump: new ways to look at an old enzyme. J. Biol. Chem. 289, 10261–10268. doi: 10.1074/jbc.O114.555565
Pubmed Abstract | Pubmed Full Text | CrossRef Full Text | Google Scholar
Ludolph, A. C., Brettschneider, J., and Weishaupt, J. H. (2012). Amyotrophic lateral sclerosis. Curr. Opin. Neurol. 25, 530–535. doi: 10.1097/WCO.0b013e328356d328
Pubmed Abstract | Pubmed Full Text | CrossRef Full Text | Google Scholar
Mallilankaraman, K., Cárdenas, C., Doonan, P. J., Chandramoorthy, H. C., Irrinki, K. M., Golenár, T., et al. (2012a). MCUR1 is an essential component of mitochondrial Ca2+ uptake that regulates cellular metabolism. Nat. Cell Biol. 14, 1336–1343. doi: 10.1038/ncb2622
Pubmed Abstract | Pubmed Full Text | CrossRef Full Text | Google Scholar
Mallilankaraman, K., Doonan, P., Cárdenas, C., Chandramoorthy, H. C., Müller, M., Miller, R., et al. (2012b). MICU1 is an essential gatekeeper for MCU-mediated mitochondrial Ca(2+) uptake that regulates cell survival. Cell 151, 630–644. doi: 10.1016/j.cell.2012.10.011
Pubmed Abstract | Pubmed Full Text | CrossRef Full Text | Google Scholar
Marchi, S., and Pinton, P. (2014). The mitochondrial calcium uniporter complex: molecular components, structure and physiopathological implications. J. Physiol. 592(Pt 5), 829–839. doi: 10.1113/jphysiol.2013.268235
Pubmed Abstract | Pubmed Full Text | CrossRef Full Text | Google Scholar
Martin, L. J. (2011). Mitochondrial pathobiology in ALS. J. Bioenerg. Biomembr. 43, 569–579. doi: 10.1007/s10863-011-9395-y
Pubmed Abstract | Pubmed Full Text | CrossRef Full Text | Google Scholar
Matus, S., Valenzuela, V., Medinas, D.B., and Hetz, C. (2013). ER dysfunction and protein folding stress in ALS. Int. J. Cell Biol. 2013:674751. doi: 10.1155/2013/674751
Pubmed Abstract | Pubmed Full Text | CrossRef Full Text | Google Scholar
McCormack, J. G., and Denton, R. M. (1990). The role of mitochondrial Ca2+ transport and matrix Ca2+ in signal transduction in mammalian tissues. Biochim. Biophys. Acta 1018, 287–291. doi: 10.1016/0005-2728(90)90269-A
Pubmed Abstract | Pubmed Full Text | CrossRef Full Text | Google Scholar
McGoldrick, P., Joyce, P. I., Fisher, E. M. C., and Greensmith, L. (2013). Rodent models of amyotrophic lateral sclerosis. Biochim. Biophys. Acta 1832, 1421–1436. doi: 10.1016/j.bbadis.2013.03.012
Pubmed Abstract | Pubmed Full Text | CrossRef Full Text | Google Scholar
Mendonça, D. M. F., Chimelli, L., and Martinez, A. M. B. (2006). Expression of ubiquitin and proteasome in motorneurons and astrocytes of spinal cords from patients with amyotrophic lateral sclerosis. Neurosci. Lett. 404, 315–319. doi: 10.1016/j.neulet.2006.06.009
Pubmed Abstract | Pubmed Full Text | CrossRef Full Text | Google Scholar
Murakami, T., Nagai, M., Miyazaki, K., Morimoto, N., Ohta, Y., Kurata, T., et al. (2007). Early decrease of mitochondrial DNA repair enzymes in spinal motor neurons of presymptomatic transgenic mice carrying a mutant SOD1 gene. Brain Res. 1150, 182–189. doi: 10.1016/j.brainres.2007.02.057
Pubmed Abstract | Pubmed Full Text | CrossRef Full Text | Google Scholar
Muyderman, H., and Chen, T. (2014). Mitochondrial dysfunction in amyotrophic lateral sclerosis—a valid pharmacological target? Br. J. Pharmacol. 171, 2191–2205. doi: 10.1111/bph.12476
Pubmed Abstract | Pubmed Full Text | CrossRef Full Text | Google Scholar
Neumann, M., Sampathu, D. M., Kwong, L. K., Truax, A. C., Micsenyi, M. C., Chou, T. T., et al. (2006). Ubiquitinated TDP-43 in frontotemporal lobar degeneration and amyotrophic lateral sclerosis. Science 314, 130–133. doi: 10.1126/science.1134108
Pubmed Abstract | Pubmed Full Text | CrossRef Full Text | Google Scholar
Nguyen, K. T., García-Chacón, L. E., Barrett, J. N., Barrett, E. F., and David, G. (2009). The Psi(m) depolarization that accompanies mitochondrial Ca2+ uptake is greater in mutant SOD1 than in wild-type mouse motor terminals. Proc. Natl. Acad. Sci. U.S.A. 106, 2007–2011. doi: 10.1073/pnas.0810934106
Pubmed Abstract | Pubmed Full Text | CrossRef Full Text | Google Scholar
Nowikovsky, K., Pozzan, T., Rizzuto, R., Scorrano, L., and Bernardi, P. (2012). Perspectives on: SGP symposium on mitochondrial physiology and medicine: the pathophysiology of LETM1. J. Gen. Physiol. 139, 445–454. doi: 10.1085/jgp.201110757
Pubmed Abstract | Pubmed Full Text | CrossRef Full Text | Google Scholar
Palty, R., Silverman, W. F., Hershfinkel, M., Caporale, T., Sensi, S. L., Parnis, J., et al. (2010). NCLX is an essential component of mitochondrial Na+/Ca2+ exchange. Proc. Natl. Acad. Sci. U.S.A. 107, 436–441. doi: 10.1073/pnas.0908099107
Pubmed Abstract | Pubmed Full Text | CrossRef Full Text | Google Scholar
Parpura, V., Heneka, M. T., Montana, V., Oliet, S. H. R., Schousboe, A., Haydon, P. G., et al. (2012). Glial cells in (patho)physiology. J. Neurochem. 121, 4–27. doi: 10.1111/j.1471-4159.2012.07664.x
Pubmed Abstract | Pubmed Full Text | CrossRef Full Text | Google Scholar
Pasinelli, P., Houseweart, M. K., Brown, R. H., and Cleveland, D. W. (2000). Caspase-1 and -3 are sequentially activated in motor neuron death in Cu,Zn superoxide dismutase-mediated familial amyotrophic lateral sclerosis. Proc. Natl. Acad. Sci. U.S.A. 97, 13901–13906. doi: 10.1073/pnas.240305897
Pubmed Abstract | Pubmed Full Text | CrossRef Full Text | Google Scholar
Paxinos, G., and Franklin, K. B. (2001). The Mouse Brain in Stereotaxic Coordinates, 2nd Edn. San Diego: Academic Press.
Peixoto, P. M., Kim, H.-J., Sider, B., Starkov, A., Horvath, T. L., and Manfredi, G. (2013). UCP2 overexpression worsens mitochondrial dysfunction and accelerates disease progression in a mouse model of amyotrophic lateral sclerosis. Mol. Cell. Neurosci. 57, 104–110. doi: 10.1016/j.mcn.2013.10.002
Pubmed Abstract | Pubmed Full Text | CrossRef Full Text | Google Scholar
Perocchi, F., Gohil, V. M., Girgis, H. S., Bao, X. R., McCombs, J. E., Palmer, A. E., et al. (2010). MICU1 encodes a mitochondrial EF hand protein required for Ca2+ uptake. Nature 467, 291–296. doi: 10.1038/nature09358
Pubmed Abstract | Pubmed Full Text | CrossRef Full Text | Google Scholar
Pignataro, G., Boscia, F., Esposito, E., Sirabella, R., Cuomo, O., Vinciguerra, A., et al. (2012). NCX1 and NCX3: two new effectors of delayed preconditioning in brain ischemia. Neurobiol. Dis. 45, 616–623. doi: 10.1016/j.nbd.2011.10.007
Pubmed Abstract | Pubmed Full Text | CrossRef Full Text | Google Scholar
Puri, S., and Hebrok, M. (2012). Diabetic β cells: to be or not to be? Cell 150, 1103–1104. doi: 10.1016/j.cell.2012.08.021
Pubmed Abstract | Pubmed Full Text | CrossRef Full Text | Google Scholar
Qiang, L., Fujita, R., and Abeliovich, A. (2013). Remodeling neurodegeneration: somatic cell reprogramming-based models of adult neurological disorders. Neuron 78, 957–969. doi: 10.1016/j.neuron.2013.06.002
Pubmed Abstract | Pubmed Full Text | CrossRef Full Text | Google Scholar
Ramirez, A., Heimbach, A., Gründemann, J., Stiller, B., Hampshire, D., Cid, L. P., et al. (2006). Hereditary parkinsonism with dementia is caused by mutations in ATP13A2, encoding a lysosomal type 5 P-type ATPase. Nat. Genet. 38, 1184–1191. doi: 10.1038/ng1884
Pubmed Abstract | Pubmed Full Text | CrossRef Full Text | Google Scholar
Renton, A. E., Chiò, A., and Traynor, B. J. (2013). State of play in amyotrophic lateral sclerosis genetics. Nat. Neurosci. 17, 17–23. doi: 10.1038/nn.3584
Pubmed Abstract | Pubmed Full Text | CrossRef Full Text | Google Scholar
Renton, A. E., Majounie, E., Waite, A., Simón-Sánchez, J., Rollinson, S., Gibbs, J. R., et al. (2011). A hexanucleotide repeat expansion in C9ORF72 is the cause of chromosome 9p21-linked ALS-FTD. Neuron 72, 257–268. doi: 10.1016/j.neuron.2011.09.010
Pubmed Abstract | Pubmed Full Text | CrossRef Full Text | Google Scholar
Rizzuto, R., and Pozzan, T. (2006). Microdomains of intracellular Ca2+: molecular determinants and functional consequences. Physiol. Rev. 86, 369–408. doi: 10.1152/physrev.00004.2005
Pubmed Abstract | Pubmed Full Text | CrossRef Full Text | Google Scholar
Rotunno, M. S., and Bosco, D. A. (2013). An emerging role for misfolded wild-type SOD1 in sporadic ALS pathogenesis. Front. Cell. Neurosci. 7:253. doi: 10.3389/fncel.2013.00253
Pubmed Abstract | Pubmed Full Text | CrossRef Full Text | Google Scholar
Sarthy, P. V., Fu, M., and Huang, J. (1991). Developmental expression of the glial fibrillary acidic protein (GFAP) gene in the mouse retina. Cell. Mol. Neurobiol. 11, 623–637. doi: 10.1007/BF00741450
Pubmed Abstract | Pubmed Full Text | CrossRef Full Text | Google Scholar
Schiemann, J., Schlaudraff, F., Klose, V., Bingmer, M., Seino, S., Magill, P. J., et al. (2012). K-ATP channels in dopamine substantia nigra neurons control bursting and novelty-induced exploration. Nat. Neurosci. 15, 1272–1280. doi: 10.1038/nn.3185
Pubmed Abstract | Pubmed Full Text | CrossRef Full Text | Google Scholar
Schlaudraff, F., Gründemann, J., Fauler, M., Dragicevic, E., Hardy, J., and Liss, B. (2014). Orchestrated increase of dopamine and PARK mRNAs but not miR-133b in dopamine neurons in Parkinson's disease. Neurobiol. Aging 35, 2302–2315. doi: 10.1016/j.neurobiolaging.2014.03.016
Pubmed Abstract | Pubmed Full Text | CrossRef Full Text | Google Scholar
Sharma, V., and O'Halloran, D. M. (2014). Recent structural and functional insights into the family of sodium calcium exchangers. Genesis 52, 93–109. doi: 10.1002/dvg.22735
Pubmed Abstract | Pubmed Full Text | CrossRef Full Text | Google Scholar
Solomon, J. A., Tarnopolsky, M. A., Hamadeh, M. J., and Dawson, T. M. (2011). One Universal Common endpoint in mouse models of amyotrophic lateral sclerosis. PLoS ONE 6:e20582. doi: 10.1371/journal.pone.0020582
Pubmed Abstract | Pubmed Full Text | CrossRef Full Text | Google Scholar
Strehler, E. E. (2013). Plasma membrane calcium ATPases as novel candidates for therapeutic agent development. J. Pharm. Pharm. Sci. 16, 190–206.
Tadic, V., Prell, T., Lautenschlaeger, J., and Grosskreutz, J. (2014). The ER mitochondria calcium cycle and ER stress response as therapeutic targets in amyotrophic lateral sclerosis. Front. Cell. Neurosci. 8:147. doi: 10.3389/fncel.2014.00147
Pubmed Abstract | Pubmed Full Text | CrossRef Full Text | Google Scholar
Trenker, M., Malli, R., Fertschai, I., Levak-Frank, S., and Graier, W. F. (2007). Uncoupling proteins 2 and 3 are fundamental for mitochondrial Ca2+ uniport. Nat. Cell Biol. 9, 445–452. doi: 10.1038/ncb1556
Pubmed Abstract | Pubmed Full Text | CrossRef Full Text | Google Scholar
Valori, C. F., Brambilla, L., Martorana, F., and Rossi, D. (2014). The multifaceted role of glial cells in amyotrophic lateral sclerosis. Cell. Mol. Life Sci. 71, 287–297. doi: 10.1007/s00018-013-1429-7
Pubmed Abstract | Pubmed Full Text | CrossRef Full Text | Google Scholar
Van Den Bosch, L. (2011). Genetic rodent models of amyotrophic lateral sclerosis. J. Biomed. Biotechnol. 2011:348765. doi: 10.1155/2011/348765
Pubmed Abstract | Pubmed Full Text | CrossRef Full Text | Google Scholar
Van Den Bosch, L., Vandenberghe, W., Klaassen, H., van Houtte, E., and Robberecht, W. (2000). Ca(2+)-permeable AMPA receptors and selective vulnerability of motor neurons. J. Neurol. Sci. 180, 29–34. doi: 10.1016/S0022-510X(00)00414-7
Pubmed Abstract | Pubmed Full Text | CrossRef Full Text | Google Scholar
Vehviläinen, P., Koistinaho, J., and Gundars, G. (2014). Mechanisms of mutant SOD1 induced mitochondrial toxicity in amyotrophic lateral sclerosis. Front. Cell Neurosci. 8:126. doi: 10.3389/fncel.2014.00126
Pubmed Abstract | Pubmed Full Text | CrossRef Full Text | Google Scholar
Vinsant, S., Mansfield, C., Jimenez-Moreno, R., Del Gaizo Moore, V., Yoshikawa, M., Hampton, T. G., et al. (2013a). Characterization of early pathogenesis in the SOD1(G93A) mouse model of ALS: part I, background and methods. Brain Behav. 3, 335–350. doi: 10.1002/brb3.143
Pubmed Abstract | Pubmed Full Text | CrossRef Full Text | Google Scholar
Vinsant, S., Mansfield, C., Jimenez-Moreno, R., Del Gaizo Moore, V., Yoshikawa, M., Hampton, T. G., et al. (2013b). Characterization of early pathogenesis in the SOD1(G93A) mouse model of ALS: part II, results and discussion. Brain Behav. 3, 431–457. doi: 10.1002/brb3.142
Pubmed Abstract | Pubmed Full Text | CrossRef Full Text | Google Scholar
von Lewinski, F., and Keller, B. U. (2005). Ca2+, mitochondria and selective motoneuron vulnerability: implications for ALS. Trends Neurosci. 28, 494–500. doi: 10.1016/j.tins.2005.07.001
Pubmed Abstract | Pubmed Full Text | CrossRef Full Text | Google Scholar
Vucic, S., Rothstein, J. D., and Kiernan, M. C. (2014). Advances in treating amyotrophic lateral sclerosis: insights from pathophysiological studies. Trends Neurosci. 37, 433–442. doi: 10.1016/j.tins.2014.05.006
Pubmed Abstract | Pubmed Full Text | CrossRef Full Text | Google Scholar
Waldeck-Weiermair, M., Jean-Quartier, C., Rost, R., Khan, M. J., Vishnu, N., Bondarenko, A. I., et al. (2011). Leucine zipper EF hand-containing transmembrane protein 1 (Letm1) and uncoupling proteins 2 and 3 (UCP2/3) contribute to two distinct mitochondrial Ca2+ uptake pathways. J. Biol. Chem. 286, 28444–28455. doi: 10.1074/jbc.M111.244517
Pubmed Abstract | Pubmed Full Text | CrossRef Full Text | Google Scholar
Wegorzewska, I., and Baloh, R. H. (2011). TDP-43-based animal models of neurodegeneration: new insights into ALS pathology and pathophysiology. Neurodegener. Dis. 8, 262–274. doi: 10.1159/000321547
Wiederkehr, A., Szanda, G., Akhmedov, D., Mataki, C., Heizmann, C. W., Schoonjans, K., et al. (2011). Mitochondrial matrix calcium is an activating signal for hormone secretion. Cell Metab. 13, 601–611. doi: 10.1016/j.cmet.2011.03.015
Pubmed Abstract | Pubmed Full Text | CrossRef Full Text | Google Scholar
Keywords: mCU, choline acetyltransferase ChAT, UCP2, Letm1, NCX1, mitochondrial DNA, ND1, GFAP
Citation: Mühling T, Duda J, Weishaupt JH, Ludolph AC and Liss B (2014) Elevated mRNA-levels of distinct mitochondrial and plasma membrane Ca2+ transporters in individual hypoglossal motor neurons of endstage SOD1 transgenic mice. Front. Cell. Neurosci. 8:353. doi: 10.3389/fncel.2014.00353
Received: 01 August 2014; Paper pending published: 29 September 2014;
Accepted: 08 October 2014; Published online: 14 November 2014.
Edited by:
Pier Giorgio Mastroberardino, Erasmus MC University Medical Center Rotterdam, NetherlandsReviewed by:
Wolfgang F. Graier, Medical University of Graz, AustriaJoerg Striessnig, University of Innsbruck, Austria
Tobias Frank, University Goettingen, Germany
Copyright © 2014 Mühling, Duda, Weishaupt, Ludolph and Liss. This is an open-access article distributed under the terms of the Creative Commons Attribution License (CC BY). The use, distribution or reproduction in other forums is permitted, provided the original author(s) or licensor are credited and that the original publication in this journal is cited, in accordance with accepted academic practice. No use, distribution or reproduction is permitted which does not comply with these terms.
*Correspondence: Birgit Liss, Institute of Applied Physiology, Ulm University, Albert-Einsteinallee 11, 89081 Ulm, Germany e-mail: birgit.liss@uni-ulm.de
†These authors have contributed equally to this work.