Calcium current homeostasis and synaptic deficits in hippocampal neurons from Kelch-like 1 knockout mice
 Paula P. Perissinotti1
  Elizabeth A. Ethington1
  Erik Almazan1
  Elizabeth Martínez-Hernández1 Jennifer Kalil1 Michael D. Koob2
  Erika S. Piedras-Rentería1,3*
- 1Department of Cell and Molecular Physiology, Loyola University Chicago, Stritch School of Medicine, Maywood, IL, USA
- 2Department of Laboratory Medicine and Pathology, Institute for Translational Neuroscience, University of Minnesota, Minneapolis, MN, USA
- 3Neuroscience Institute, Loyola University Chicago, Stritch School of Medicine, Maywood, IL, USA
Kelch-like 1 (KLHL1) is a neuronal actin-binding protein that modulates voltage-gated CaV2.1 (P/Q-type) and CaV3.2 (α1H T-type) calcium channels; KLHL1 knockdown experiments (KD) cause down-regulation of both channel types and altered synaptic properties in cultured rat hippocampal neurons (Perissinotti et al., 2014). Here, we studied the effect of ablation of KLHL1 on calcium channel function and synaptic properties in cultured hippocampal neurons from KLHL1 knockout (KO) mice. Western blot data showed the P/Q-type channel α1A subunit was less abundant in KO hippocampus compared to wildtype (WT); and P/Q-type calcium currents were smaller in KO neurons than WT during early days in vitro, although this decrease was compensated for at late stages by increases in L-type calcium current. In contrast, T-type currents did not change in culture. However, biophysical properties and western blot analysis revealed a differential contribution of T-type channel isoforms in the KO, with CaV3.2 α1H subunit being down-regulated and CaV3.1 α1G up-regulated. Synapsin I levels were also reduced in the KO hippocampus and cultured neurons displayed a concomitant reduction in synapsin I puncta and decreased miniature excitatory postsynaptic current (mEPSC) frequency. In summary, genetic ablation of the calcium channel modulator resulted in compensatory mechanisms to maintain calcium current homeostasis in hippocampal KO neurons; however, synaptic alterations resulted in a reduction of excitatory synapse number, causing an imbalance of the excitatory-inhibitory synaptic input ratio favoring inhibition.
Introduction
The actin-binding protein KLHL1 is expressed in the cytosol, axons and dendrites of neurons and in glia in the nervous system (Prag and Adams, 2003; Jiang et al., 2007; Chen et al., 2008). He and collaborators confirmed KLHL1’s physiological role in cerebellar function using targeted deletion of KLHL1 in Purkinje neurons, which resulted in dendritic deficits, mild cerebellar atrophy, abnormal gait and progressive loss of motor coordination in mice (He et al., 2006). The KLHL1 gene locus lies near genes implicated in Spinocerebellar ataxia type 8 (SCA8; Ikeda et al., 2007), a rare and slowly progressive neurological disease characterized by the presence of trinucleotide expansions in two genes: ataxin 8 (ATXN8) and ATXN8 opposite strand (ATXN8OS). Mutations in ATXN8 and ATXN8OS genes cause disruptions in multiple cellular pathways; it has been proposed that the characteristic SCA pathogenesis does not begin until calcium signaling pathways are disrupted, and calcium blockers and stabilizers have been suggested as potential treatment in the disease (Kasumu and Bezprozvanny, 2012). The 5’region of the KLHL1 gene overlaps with the 5’ end of ATXN8OS (Koob et al., 1999; Nemes et al., 2000; Ikeda et al., 2007). The expression pattern of the KLHL1 antisense strand suggests a regulatory role of KLHL1, and trans-RNA interference assays support that ATXN8OS may function as an endogenous negative regulator of KLHL1 (Nemes et al., 2000; Lin et al., 2007; Chen et al., 2008). Therefore, understanding the physiological functions of KLHL1 will help frame our understanding of the regulatory role of its antisense.
KLHL1 functions as a modulator of neurite outgrowth and process elongation, and it is also a modulator of ion channel activity (Seng et al., 2006; Aromolaran et al., 2007, 2009, 2010; Jiang et al., 2007). KLHL1 positively modulates CaV2.1 (P/Q-type, α1A) and 3.2 (T-type α1H) voltage-gated calcium channel function, but it does not affect CaV3.1 (T-type α1G) or 3.3 (T-type α1I) channels, nor CaV1.2, 1.3, or 2.2 (Perissinotti et al., 2014). In vitro studies demonstrated that KLHL1 interacts with the polymerized actin cytoskeleton and with the pore-forming subunit of the CaV3.2 channel. This interaction increases its recycling via the recycling endosome, increasing the number of active channels at the plasma membrane thus up-regulating T-type calcium current density (Aromolaran et al., 2010). Adenoviral delivery of shRNA against KLHL1 down-regulates KLHL1, which in turn decreases expression levels and current density of CaV3.2 and CaV2.1 channels in cultured rat hippocampal neurons; KLHL1 also reduces synapsin I levels, miniature excitatory postsynaptic current (mEPSC) frequency and the number of excitatory and inhibitory synapses (Perissinotti et al., 2014).
To corroborate the effects of endogenous KLHL1 we assessed the status of voltage-gated calcium currents and synaptic properties in cultured hippocampal neurons from the KLHL1 KO mouse model (He et al., 2006). We found a homeostatic up-regulation of α1C (CaV1.2) and α1G (CaV3.1) concomitant to decreased expression of α1A and α1H subunits in the KO mice, confirming the role of KLHL1 in the positive modulation of P/Q- and T-type calcium currents. Calcium current homeostasis resulted in maintenance of total somatic calcium current levels in KO hippocampal neurons. However, the synaptic deficit could not be compensated for, resulting in decreased ratio of excitatory/inhibitory synaptic inputs onto KLHL1 KO neurons, confirming a presynaptic function of KLHL1 most likely due to its effects on synapsin I, presynaptic P/Q-type channels and T-type channels.
Materials and Methods
The animal protocols used in this study were reviewed and approved by an independent Institutional Animal Care and Use Committee (IACUC).
Mouse Model
KLHL1-knockout mice were generated in the Laboratory Medicine and Pathology from the University of Minnesota (He et al., 2006).
Cell Culture
Hippocampal cultures were obtained as described (Piedras-Rentería et al., 2004). In brief, whole hippocampi were dissected from newborn rats in Hanks’ Balanced Salts Solution (HBSS) (Sigma, St. Louis, MO) supplemented with 20% of Fetal Bovine Serum (Cellgro, Herndon, VA) (20% FBS-HBSS). Hippocampi were washed with 20% FBS-HBSS and HBSS and incubated for 10 min at 37°C with trypsin type XI (3.4 mg/ml) (Sigma, St. Louis, MO) plus DNAse type I (600 U/ml) (Calbiochem, Billerica, MA). After digestion, the tissue was washed with 20% FBS-HBSS and HBSS and mechanically dissociated in HBSS supplemented with 600 U/ml DNAse I and 12 mM MgSO4. Cells were plated onto matrigel-coated coverslips (12 mm, Carolina Biological Supply, NC) at a density of 25,000–35,000 and kept in a 5% CO2 humidified atmosphere at 37°C. The media was supplemented with thymidine -β-D-arabinofuranoside (4 μM) after the second day in culture (2 DIV, days in vitro).
Biochemistry
Crude membrane fractions were extracted from WT or KLHL1 KO hippocampus following standard methods (Florio et al., 1992). Samples were extracted in lysis buffer containing 50 mM Tris·HCl pH 8.0, 150 mM NaCl, 5 mM EDTA, 0.5% sodium deoxycholate, 1% Nonidet P-40 (NP-40) and 0.1% SDS supplemented with protease inhibitor cocktail (Roche, Palo Alto, CA). Protein quantification was performed using bicinchoninic acid (BCA) colorimetric assays (Pierce, Rockford, IL). Equal protein concentrations were separated by SDS-PAGE electrophoresis (5 or 8%, at 105 V for 75 min) and transferred to nitrocellulose membranes for processing (Millipore, Billerica, MA). Membranes were blocked in Tris-buffered saline (TBS) + Tween (TBST; 0.05% Tween 20) + 5% milk at room temperature, and incubated at 4°C overnight with primary antibodies against α1A, α1B, α1I (CaV2.1, 2.2, 3.3; 1:500–1000; Alomone, Israel), α1C, α1D (CaV1.2, 1.3; 1:1000; NeuroMab UCDavis), α1G (CaV3.1; 1:1000; Millipore, CA), α1H (CaV3.2; 1:2,000; Sta. Cruz Biotechnology, CA), synapsin I (1:1000, Millipore, CA); GAPDH levels (1:3000; Enzo Life Science, NY) were used as internal reference to normalize for protein loading. Blot membranes were cut in three portions prior to incubation with antibodies; the upper part of the membrane (110–260 kD) was processed sequentially for ion channel α1 subunit detection, membranes were stripped with Restore Western Blot Stripping Buffer (Pierce, IL) before re-probing. The middle membrane was processed for synapsin I (77 and 80 kD) and the lower portion of the membrane (<55 kD) was processed for GAPDH. Membranes were washed with TBST and incubated with horseradish peroxidase (HRP)-conjugated secondary antibodies (1:10,000; Pierce, IL) at room temperature for 1 h before developing with Supersignal Femto or West Dura (Pierce, IL) before analysis with a UVP Bioimaging Epichemi3 system (Upland, CA). Protein levels were quantified and always normalized to levels of GAPDH.
Immunocytochemistry
Cultured WT or KLHL1-KO hippocampal neurons were fixed at 11 DIV with 4% paraformaldehyde (Electron Microscopy Sciences, Hatfield, PA) following standard methods (Perissinotti et al., 2014). Primary antibodies were diluted in blocking solution containing 2% goat serum (Jackson ImmunoResearch Laboratories, West Grove, PA) plus 0.4% saponin in PBS and incubated overnight at 4°C (MAP2, 1:1000, EnCor Biotechnology, FL; synapsin I, 1:1000, Millipore, CA; gephyrin, 1:500, SySy, Germany; GAD67 1:500, Thermo Scientific; PSD-95, 1:1000, NeuroMab; VGlut-1, 1:1000, SySy; synapsin I, 1:1000, Millipore, CA). Samples were incubated in alexa fluor-conjugated secondary antibodies (1:2,000; Life Technologies) for 1 h at room temperature. Coverslips were mounted on slides with Citiflour (Ted Pella, Redding, CA) and stored at −20°C for subsequent detection (Multiphoton Leica TCS SP5). Data was analyzed with ImageJ freeware (NIH) (Rasband, 1997–2006). Images were thresholded using the Otsu plugin. Synaptic puncta number was measured in n sample areas = 246 μm2 each. The JACoP plugin was used to calculate Mander’s correlation coefficients (co-localization percentages), which provides a good quantification of signal co-localization between samples of different intensities (Otsu, 1979; Bolte and Cordelières, 2006).
Electrophysiology
Calcium currents and spontaneous miniature postsynaptic currents (mPSCs) were recorded by whole cell patch-clamp using an Axopatch 200B amplifier (Axon instruments, Union City, CA) at room temperature. Data were acquired at 1 kHz and digitized at 20 kHz using a Digidata 1322A analog-to-digital converter. Calcium currents were recorded in an external solution containing (in mM) 5 CaCl2, 140 TEA-Cl, 10 HEPES and 10 glucose (pH 7.4, 300 mosmol/kgH2O). mPSCs were recorded in an external solution containing (in mM) 135 NaCl, 5 KCl, 2 CaCl2, 1 MgCl2, 10 HEPES, 10 glucose (pH 7.4, 300 mosmol/kgH2O). Pipettes pulled from borosilicate glass (Warner Instruments, Hamden, CT) had resistances of 3.5–4.5 MΩ when filled with intracellular solution containing (in mM) 108 CsMeSO3, 4 MgCl2, 10 Cs-EGTA, 9 HEPES, 5 ATP-Mg, 1 GTP-Li and 15 phosphocreatine-Tris (pH 7.4, 290 mosmol/kgH2O). Cell capacitance was measured from a transient current evoked by a 5 mV depolarizing step from a holding potential of −90 mV.
Cells with series resistance (Rs) <20 MΩ were used; Rs was compensated on line (>80%). Data were acquired with Clampex 10 and analyzed with Clampfit 10 software (Molecular Devices). Voltage control was enhanced by increasing cell impedance using extracellular TEA and intracellular cesium to block K+ conductances. I-V curve properties such as its negative slope and reversal potential were monitored for appropriate voltage control. For the study of calcium current properties, we avoided recording from neurons older than 10 DIV because the possibility of space-clamp problems.
Current-voltage relationships (I-V curves)
Currents were elicited from a holding potential (VH) = −90 mV or −50 mV and depolarized for 150 ms to a test potential (VT) = −70 to + 60 mV, in 10 mV increments. The low voltage activated (LVA) current component contribution was determined by the subtraction method (Bean, 1985): average high voltage activated (HVA) currents obtained at VH = −50 mV were subtracted from those obtained at VH = −90 mV at each test potential.
Calcium influx
Calcium influx was determined by the current integral evoked by an action potential waveform (APW; influx normalization by capacitance was not necessary as it produced similar results as the integral values reported). The LVA component was isolated by the subtraction method. The APW consisted of a digitized hippocampal action potential with a resting potential of −70 mV, an upstroke of 116 mV/ms to a peak voltage of + 50 mV, followed by a repolarizing downstroke at −65 mV/ms to a hyperpolarizing potential of −90 mV. The repolarization from after-hyperpolarization slope was 0.78 mV/ms to resting conditions (Aromolaran et al., 2012). This protocol was applied from VH of −50 or −90 mV prior to clamping the voltage at −70 mV for 10 ms before the triggering of the AP, so no changes in the driving force should be expected.
Current kinetics
Current activation and inactivation were assessed by stepping the neuron from VH = −90 mV to VT = −50 to −20 mV for 150 ms. The rate of activation was estimated from the current rise time from 10% to 90% of its maximum value (rise time 10–90%); these measurements were favored over the calculation of the time constant of activation (τon) to minimize the contribution of the inactivation process on the activation rate value. Time constant of inactivation (τoff) was obtained from mono-exponential fits. The time constant of deactivation (τdeactivation) was measured by fitting with a mono-exponential function the decaying phase of tail currents elicited from VH = −90 mV to VT = −30 mV and back to VT = −60 to −140 mV.
Steady-state analysis
Steady-state activation (SSA) was analyzed with protocols stepping from VH = −90 (or −50) mV to VT up to 0 mV (ΔV = 10 mV) for 12 ms followed by repolarization to −100 mV to evoke inward tail currents. Data were fitted by a single Boltzmann function of the form, Imax/[1+exp(V50–V)/k] + m, where Imax is maximal current, V50 is half-voltage of activation, k is slope factor, and m is baseline. Steady-state inactivation (SSI) was determined by stepping the membrane potential to various pre-pulse voltage levels (Vpre = −110 to 0 mV, ΔV = 10 mV) for 1 s before depolarization to a fixed test level (−30 mV) to evoke channel opening. The resulting data were also fitted to a Boltzmann function.
Calcium channel pharmacology
Peak calcium current amplitude was measured at 10 mV (VH = −50 mV). Test pulses were elicited every 8 s. Calcium channel blockers were applied in a sequential manner, 1 μM nifedipine (L-type currents; Sigma, St. Louis, MO), 200 nM ω-Agatoxin IVA (P/Q-type currents; Alomone Labs, Jerusalem, Israel) and 2 μM ω-Conotoxin GVIA (N-type currents; Tocris, Bristol, UK). Each blocker was applied and monitored until the currents reached a new steady-state value upon inhibition (~5 min).
Miniature postsynaptic currents (mPSCs)
mPSCs were recorded from neurons at 10–12 DIV. Miniature excitatory postsynaptic currents (mEPSCs) were recorded at a holding potential of −60 mV for 2 min in the presence of tetrodotoxin (TTX, 1 μM; Calbiochem, Billerica, MA) and 20 μM bicuculline (Bic, Sigma, St. Louis, MO). Miniature inhibitory postsynaptic currents (mIPSCs) were recorded at a holding potential of 0 mV for 2 min in the presence of TTX (1 μM), 10 μM NBQX (2,3-Dioxo-6-nitro-1,2,3,4-tetrahydrobenzo[f]quinoxaline-7-sulfonamide, TOCRIS, Bristol UK) and 10 μM APV (D(−)-2-Amino-5-phosphonopentanoic acid, Sigma, St. Louis, MO).
Statistics
Results are presented as mean ± SEM. Statistical analysis was performed with the Sigma Plot 11 Software. Statistical significance was determined by P < 0.05 using Student’s t-test, unless otherwise noted. Analysis of Variance with post-hoc Duncan’s Method (ANOVA) was performed when more than 2 data sets were compared. Portions of the results reported here have been presented in abstracts at national meetings. Experimental number size (n) is always reported in order for WT and KO (n = WT, KO) in the figure legends, except for Figure 2 which is reported in the text.
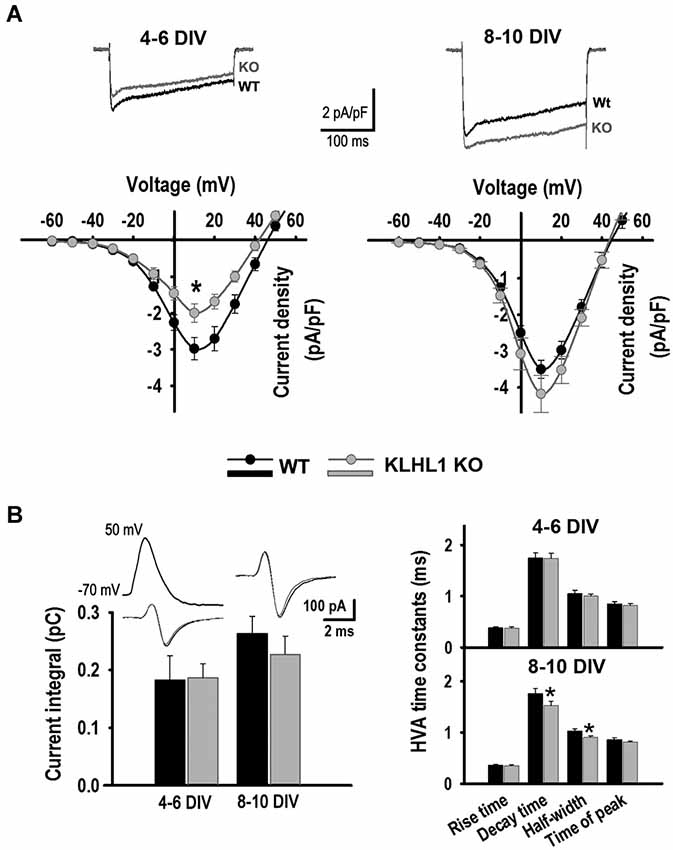
Figure 1. HVA calcium currents. (A) Current density I-V curves of HVA currents at 4–6 DIV and 8–10 DIV, VH = −50 mV. Average traces from VT = −60 to +10 mV are shown (4–6 DIV: n = 22, 18; 8–10 DIV: n = 15, 13). (B) Calcium current elicited by APW (n = 22, 34 and 21, 23); time constant values are shown to the right. *p < 0.05, Student’s t-test.
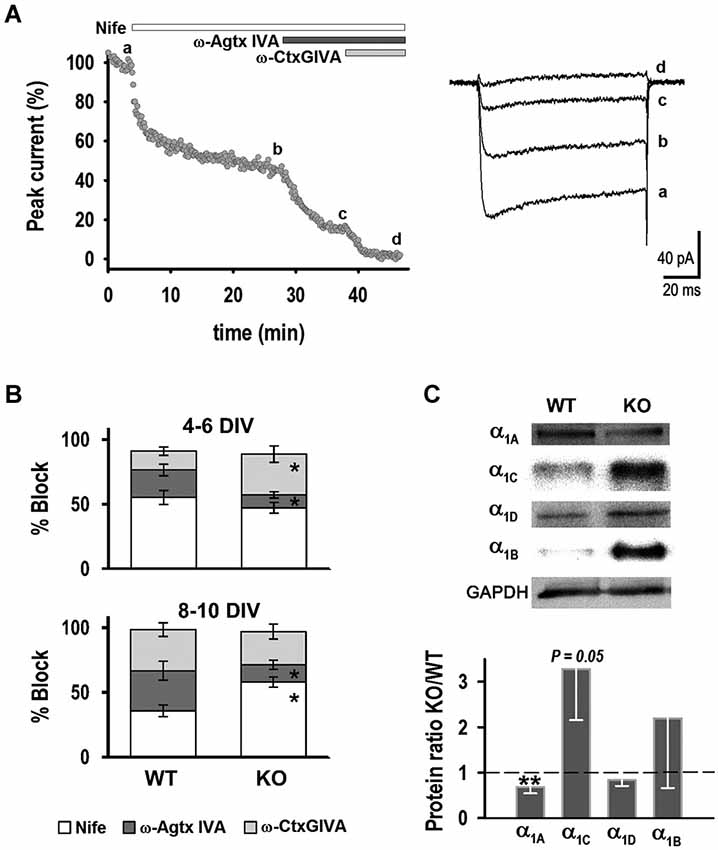
Figure 2. Characterization of HVA currents. (A) Example time course response of a neuron exposed to: nifedipine (1 μM), ω-Agatoxin IVA (400 nM) and ω-Conotoxin GVIA (2 μM). Right: Current traces obtained before (a) and after addition of the drugs (b–d) (VT = +10 mV, VH = −50 mV). (B) Percentage block of HVA current by antagonists in WT and KO neurons. (C) Western blot analysis of HVA channel subunits. Top: Examples of protein levels of HVA channel subunits in WT and KO hippocampus. Bottom: Quantification of α1A, α1C, α1D, α1B protein ratios (KO/WT). *p < 0.05, Student’s t-test, **p < 0.05, paired Student’s t-test.
Results
Homeostatic Regulation of Voltage Dependent Calcium Current in KLHL1 KO Hippocampal Neurons
We measured calcium current density from WT and KO neurons during early and late stages in culture (4–6 DIV and 8–10 DIV, respectively), using established electrophysiological protocols to assess the HVA and LVA current components (Methods).
HVA calcium current
The I-V curves in Figure 1A show that the HVA peak current density at 4–6 DIV was 33% smaller in KO than in WT neurons, but this difference was no longer detected at 8–10 DIV. In contrast, there were no differences in the calcium influx evoked by an APW between WT and KO at any stage in culture. However, the decay time and half-width of the APW-induced currents were smaller in KO neurons at 8–10 DIV than in WT (Figure 1B), suggesting that different HVA channels were contributing to the total HVA current during the development of KO and WT hippocampal neurons.
Sequential application of calcium channel blockers was used to identify individual HVA current components. Figure 2A shows an example where peak current was plotted vs. time during drug application, along with representative current traces before (a) and after application of: (b) 1 μM nifedipine; (c) 200 nM ω-agatoxin IVA; and (d) 2 μM ω-conotoxin GVIA. Figure 2B shows the fraction of current blocked by each of these antagonists at 4–6 DIV: 55 ± 5% for nifedipine (n = 11), 21 ± 5% for ω-agatoxin IVA (n = 6) and 15 ± 3% for ω-conotoxin GVIA (n = 5) for WT neurons. The fraction of current blocked by nifedipine was not significantly different in KO neurons (47 ± 4%, n = 8), whereas ω-agatoxin IVA and ω-conotoxin GVIA blocked 10 ± 3% (n = 6) and 32 ± 6% (n = 5), respectively; these fractions were significantly different from WT. In contrast, at 8–10 DIV the fraction of current blocked by nifedipine was higher in KO neurons (58 ± 4%, n = 16) compared to WT (36 ± 5%, n = 12), whereas ω-agatoxin IVA blocked a smaller fraction of current in the KLHL1-KO (13 ± 3%, n = 6) than in WT (31 ± 7%, n = 7). No differences between genotypes were observed for ω-conotoxin GVIA at 8–10 DIV (32 ± 5% and 26 ± 6% for WT and KO, n = 9 for each genotype). These results show that decreased levels in P/Q-type channels in KLHL1-KO neurons observed at 4–6 and 8–10 DIV were compensated for by the functional increases of N-type and L-type channels at each stage, respectively.
The expression levels of L-type α1C (CaV1.2) and α1D (CaV1.3), P/Q-type α1A (CaV2.1), and N-type α1B (CaV2.2) pore-forming subunits were determined in whole adult hippocampus by western blot (Figure 2C). KO hippocampus had lower expression of α1A subunit (n = 6), and α1C subunit levels showed a statistical tendency to higher expression compared to WT (n = 5, P = 0.05), supporting the electrophysiology data. Neither expression levels of α1B (n = 3) subunit or α1D (n = 4) changed in the KO.
LVA calcium current
Figure 3A shows I-V curves at early and late stages of culture. Both HVA and LVA current components can be detected in this experiment, the HVA peak component at +10 mV and the LVA peak at ~−30 mV. LVA peak current density (Ipeak) did not change during the time of culture, nor between genotypes. The LVA peak voltage (Vpeak) changed from −25 mV at 4–6 DIV to ~−32 mV at 8–10 DIV in WT neurons, but it remained unchanged in the KO. Thus, this ~7 mV left shift in the peak voltage suggests that the reported developmental change in expression of LVA channel isoforms occurred in WT but not in KO neurons (McRory et al., 2001).
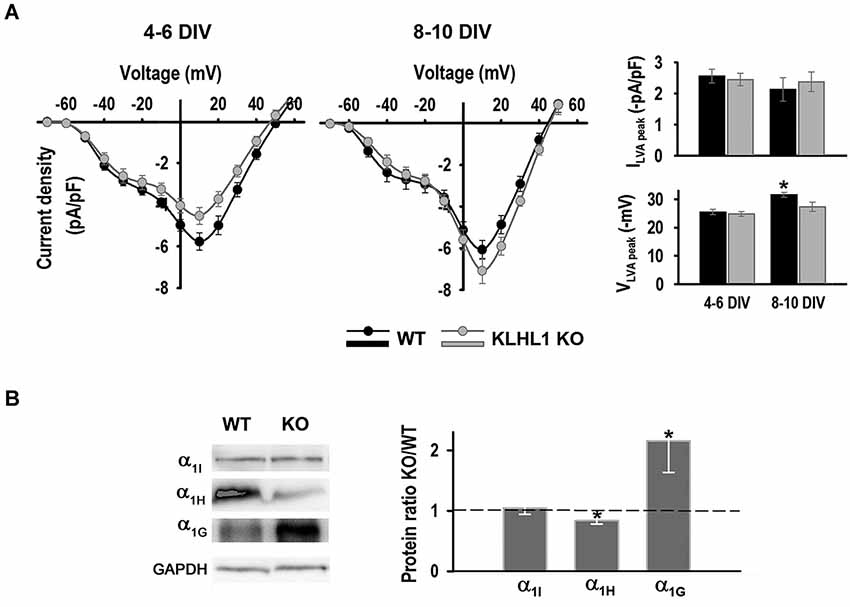
Figure 3. LVA calcium currents. (A) LVA and HVA current density I-V curves at 4–6 DIV and 8–10 DIV, VH = −90 mV. Right panel: Top, LVA current density at 4–6 DIV (n = 22, 18) and 8–10 DIV (n = 15, 13). Bottom, LVA peak voltage. *p < 0.05, ANOVA. (B) Left panel: Examples of α subunit levels protein of CaV3.1, 3.2 and 3.3. Right panel: Quantification of protein ratios (KO/WT). *p < 0.05, paired Student’s t-test (n = 7, 3, 5, from left to right).
Western blot analysis of whole hippocampus confirmed that the KO exhibits down-regulation of the CaV3.2 α1H isoform and a concomitant homeostatic increment in CaV3.1 α1G expression (Figure 3B); CaV3.3 α1I protein levels remained constant.
LVA current kinetics and steady-state properties were also analyzed to assess the T-type isoform expression changes (Cain and Snutch, 2010; Figure 4). Current activation (rise time 10–90%) did not change between genotypes or during the time of culture (Figure 4A). τoff was similar between genotypes and stage in culture, except for the value at −40 mV for WT at 8–10 DIV (Figure 4B). In contrast, τdeactivation values were significantly slower in KO neurons compared to WT at 4–6 DIV (5.3 ± 0.3 vs. 4.1 ± 0.2 ms at −60 mV), but not at later stages of culture where both genotypes displayed slower τdeactivation, similar to those seen in KO neurons at early stages (6.1 ± 0.7 for WT and 5.7 ± 0.3 for KO) (Figure 4C). Steady-state activation (SSA) and inactivation (SSI) V50 properties did not change between genotypes at 4–6 DIV; however WT V50 values significantly shifted to negative potentials at later stages of culture (Figure 4D).
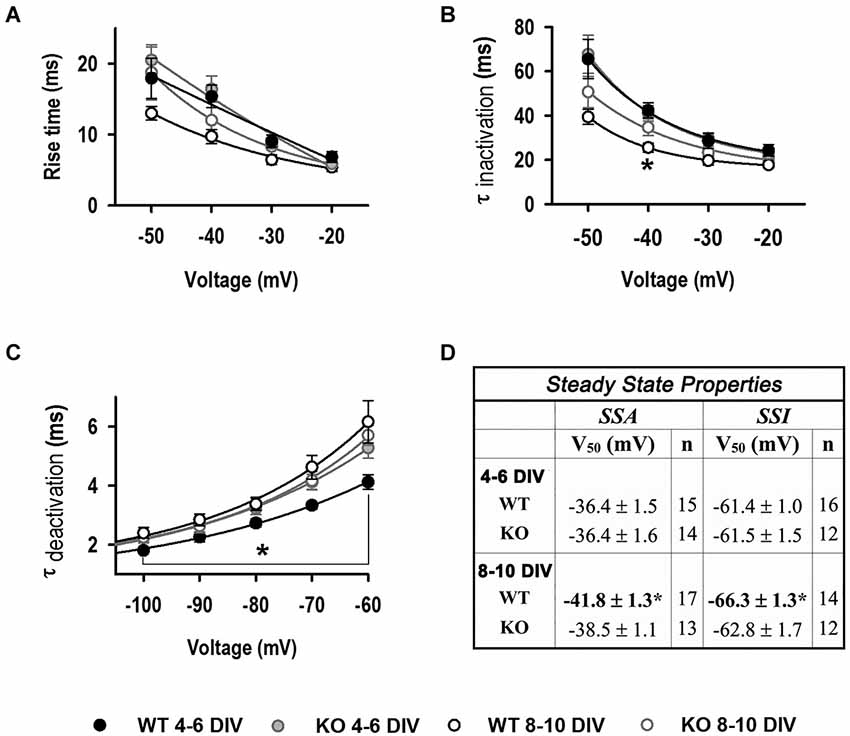
Figure 4. Biophysical properties of LVA currents. (A) Rise time (10–90%) values as function of voltage. (B) τinactivation as function of voltage. 4–6 DIV (n = 19, 22); 8–10 DIV (n = 10, 10) for A, B. (C) τdeactivation as function of voltage (4–6 DIV: n = 14, 19; 8–10 DIV: n = 20, 13). *Significantly different from other conditions, p < 0.05, ANOVA. (D) Steady-state inactivation (SSI) and Steady-state activation (SSA) V50 values. *Significantly different from WT and KO at 4–6 DIV, p < 0.05, ANOVA.
Calcium influx was assessed using APWs (Figure 5). Calcium influx via LVA channels was 34% smaller at 4–6 DIV in the KO compared to WT neurons, but this difference was no longer detected at 8–10 DIV. Furthermore, whereas the time constants of APW-induced LVA currents (rise time, decay time, half-width and time to peak) were slower in KO neurons at 4–6 DIV compared to WT, no differences in these constants were observed at 8–10 DIV.
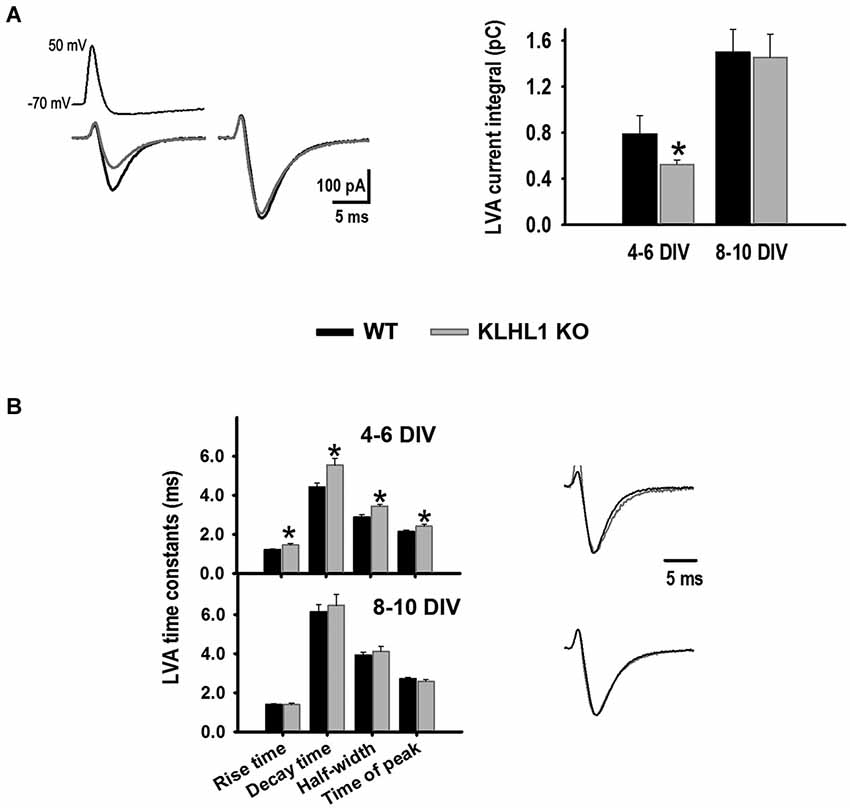
Figure 5. LVA calcium currents elicited by action potential waveforms (APWs). (A) Average trace examples during early (4–6 DIV) (left) and late (8–10 DIV) (right) stages of culture for WT (black line) and KO (gray line); average current integral values are shown to the right (n = 22, 34). (B) LVA current time constants (left) and normalized traces (right). *p < 0.05, Student’s t-test.
Altered Synapse Number in KLHL1 KO Hippocampal Neurons
shRNA-induced KLHL1 KD in rat hippocampal neurons results in reduction of the number of synaptic puncta, synapsin I protein levels and decreased mPSC frequency (Perissinotti et al., 2014); thus we tested the impact of the genetic ablation of KLHL1 on these synaptic properties in mice neurons.
Analysis of the number of synaptic puncta per area was performed at 11 DIV. KLHL1 KO cultures exhibited significantly fewer puncta compared to WT (P < 0.05). The example shown in Figure 6A depicts neurons stained for synapsin I (red) merged with the neuronal marker MAP2 (blue). Synaptic contacts decreased from 1661.2 ± 493.1 puncta per frame in WT to 809.2 ± 94.6 in KO neurons. In a separate line of experiments, quantification of synapsin I by western blot showed that protein levels were ~25% lower in the adult KO hippocampus (0.73 ± 0.126) (Figure 6B). In line with these results, mPSC properties in the absence of blockers showed lower frequency in KO neurons (0.25 ± 0.03 Hz) compared to WT (0.63 ± 0.16) (Figure 6C), confirming a decrease of synapse number in the KO. mPSC amplitude was not altered (WT: −12.0 ± 1.9 pA, KO: −12.1 ± 1.8 pA).
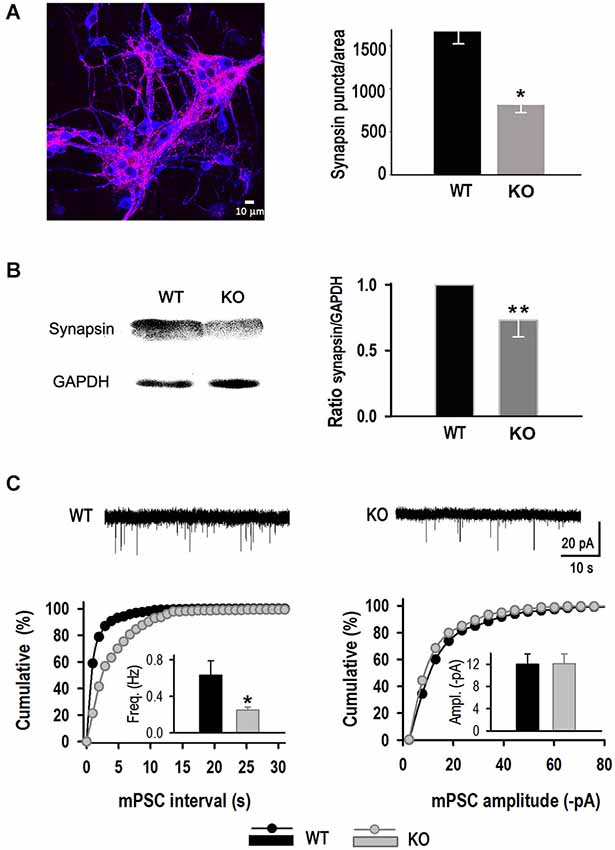
Figure 6. Reduced synapse number in KLHL1 KO neurons. (A) Quantification of synaptic puncta. Right, merged image of hippocampal neurons stained for synapsin I (red) and MAP2 (blue) (11 DIV). Left, Number of synaptic puncta per area (n = 11, 12). (B) Synapsin I quantification by Western Blot. Left, example blot. Right, data summary (n = 5, 5). (C) Miniature postsynaptic current (mPSC) analysis. Top, miniature PSCs example traces. Bottom left, mPSC frequency distribution. Inset, mean frequency values (Hz). Bottom right, mPSC amplitude distribution. Inset, mean amplitude value for each population (pA) (n = 10, 9). *p < 0.05, Student’s t-test; **p < 0.05, paired Student’s t-test.
To identify if the decrease in synapse number was type-specific we characterized excitatory synapses by co-localization of synapsin I (Syn I; Figure 7A), or the presynaptic glutamate vesicle transporter 1 VGlut-1 (Figure 7B) with the postsynaptic scaffolding protein PSD-95 (Woods and Bryant, 1993; Gomperts, 1996). Mander’s correlation coefficient analysis showed KO neurons exhibited less co-localization between pre- and post-synaptic excitatory markers. WT neurons exhibited 35.9 ± 2.9% co-localization of Syn I with PSD95 compared to 28.4 ± 2.0% in the KO; and 54.3 ± 6.3% co-localization of VGlut-1 with PSD-95 in WT compared to 38.3 ± 5.8% in the KO. Inhibitory synapses were identified by the presence of synapsin I (Figure 7C) or the presynaptic enzyme glutamic acid decarboxylase (GAD67, Figure 7D) and the postsynaptic scaffolding protein gephyrin (Köhler and Chan-Palay, 1983; Danglot et al., 2003). There were no differences in colocalization of Syn I with gephyrin, however signal co-localization between GAD67 and gephyrin was significantly higher in the KO (36.9 ± 3.8%) compared to WT (26.6 ± 3.0%).
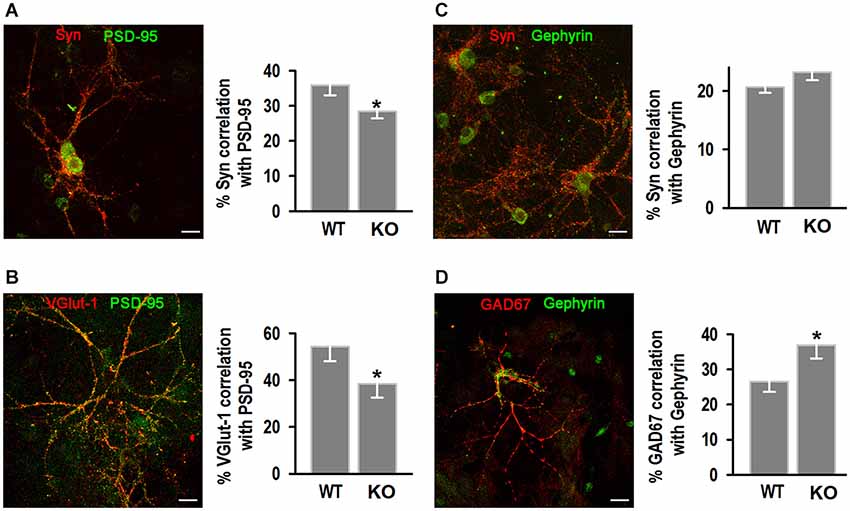
Figure 7. Analysis of excitatory and inhibitory hippocampal synapses. (A,B) Examples of excitatory synapses, identified by synapsin I (Syn) and PSD-95 antibodies (A) and VGlut-1 and PSD95 antibodies (B); left, quantification of the % co-localization of Syn I with PSD95 (n = 20, 20) or VGlut-1 with PSD95 (n = 15, 14). (C,D) Inhibitory synapses, identified by Syn I and gephyrin (C) and GAD67 and gephyrin (D) antibodies; left, quantification of the % co-localization of Syn I with gephyrin (n = 27, 29) or GAD67 with gephyrin (n = 9, 11) for WT and KO. *p < 0.05, Student’s t-test. Scale bars = 20 μm.
Excitatory and inhibitory activities were then studied in isolation using specific inhibitors (Figures 8A–D). Excitatory signals recorded in the presence of 20 μM Bic were in accordance with the co-localization experiments; excitatory activity was much lower in the KO (17% of WT), with a mEPSC frequency of 0.20 ± 0.05 Hz (n = 7) compared to 1.21 ± 0.43 Hz in the WT, confirming a decrease in excitatory synapse number (Figures 8A,B). Again, no changes in mEPSC amplitude were detected (−18.7 ± 2.8 pA, WT vs. −15.1 ± 1.5 pA, KO, Figure 8C). mIPSC activity was studied in presence of 10 μM APV and 10 μM NBQX. As expected from the Syn I-gephyrin co-localization experiments, no differences were observed in either mIPSC frequency between KO and WT genotypes (Figures 8A–C). KLHL1 KO neurons had a mean mIPSC frequency of 0.43 ± 0.21 Hz compared to 0.43 ± 0.15 Hz in the WT. mIPSC amplitude did not change: 16.3 ± 2.9 pA and 17.2 ± 1.3 pA. mIPSCs exhibited slower kinetics than mEPSCs, as expected (Shao et al., 2003; Szczot et al., 2010), but no significant changes in the kinetic properties of either excitatory or inhibitory currents were detected between groups (Figure 8D). Overall, the mEPSC/mIPSC frequency ratio was 2.8 in WT neurons, compared to 1 in the KO (Figure 8A).
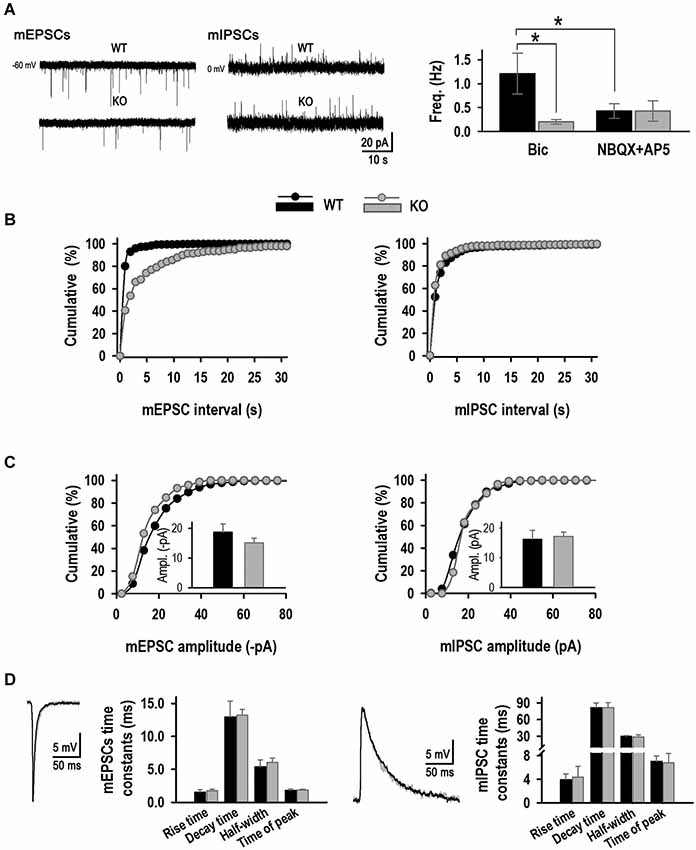
Figure 8. Excitatory and inhibitory mPSC analysis. (A) Examples of mEPSCs and mIPSC from WT and KO neurons. Right, Mean frequency values (Hz, n = 6, 7, 7, 7). (B) mEPSC and mIPSC frequency distribution for WT and KO. (C) mEPSC and mIPSC amplitude distribution for WT and KO neurons. Inset, mean amplitude value for each population (pA) (n = 6, 7, 7, 7). (D) Kinetic analysis. Averaged mEPSC and mIPSC traces for WT and KO synapses. *p < 0.05, ANOVA.
Discussion
KLHL1 function as an endogenous modulator of P/Q- and T-type calcium channels was first detected by acute KLHL1 KD experiments in rat neurons (Perissinotti et al., 2014) and is now confirmed in the KLHL1 knockout mouse model.
Hippocampal HVA currents were comprised of L-type, P/Q-type, and N type currents, as previously reported (Isaeva et al., 1998; Chameau et al., 1999; Perissinotti et al., 2014), in line with a differential contribution of HVA calcium channel subtypes at different stages in vitro (Chameau et al., 1999; Nudler et al., 2003). KLHL1 ablation resulted in a 33% decrease in HVA current density at early culture stages, which was compensated for by 8–10 days in culture. KO neurons exhibited decreased contribution by P/Q-type current since early stages of culture, and decreased α1A levels were detected in adult hippocampus. This data is in agreement with KD experiments of KLHL1 using shRNA in cultured rat hippocampal neurons (Perissinotti et al., 2014), and also with over-expression experiments of KLHL1 in vitro (Aromolaran et al., 2007). N-type and L-type currents increased in KO neurons during early and late stages of culture, respectively, likely as compensatory mechanisms for the decrement in P/Q-type currents. α1B subunit protein levels were similar between adult WT and KO hippocampal samples, which are representative of late stage hippocampal culture conditions, where adult neuronal phenotypes are observed. There was a possible up-regulation of the α1C subunit of the L-type channel, its protein level tended to be statiscally significant by western blot analysis (p = 0.05); therefore increased L-type current activity may be due to post-translational mechanisms and/or increased protein levels.
LVA calcium current density was constant during the time in culture in WT neurons, as reported for cultured mouse hippocampal neurons (Chameau et al., 1999), and in contrast with acutely dissociated and cultured rat hippocampal neurons during postnatal development (Kortekaas and Wadman, 1997; Perissinotti et al., 2014). All three T-type channel isoforms (CaV3.1–3.3 or α1G-I) are present in hippocampal neurons (McKay et al., 2006), and despite the lack of change in total current, it is known that the expression pattern of CaV3.3 (α1I) mRNA is higher in immature compared to mature stages, whereas CaV3.1 and CaV3.2 expression (α1G and α1H) predominates in mature hippocampal neurons (McRory et al., 2001). Regarding their biophysical properties, CaV3.3 (α1I) channels have peak currents at more positive potential, display slower kinetics of activation and inactivation and have faster kinetics of deactivation compared to CaV3.1 and CaV3.2. α1I currents also display more positive steady state V50 values than α1H/α1G currents (Klöckner et al., 1999; McRory et al., 2001; Chemin et al., 2002; Perez-Reyes, 2003). Analysis of protein levels demonstrates the KO mouse model exhibited slight down-regulation of the CaV3.2 α1H isoform, in contrast with KD experiments where α1H down-regulation was substantial (Perissinotti et al., 2014); this difference is likely due to the manifestation of compensatory mechanisms in the KO, although differences in LVA current modualtion/expression between mouse and rat models could also be involved. CaV3.1 α1G levels were increased and no changes in the level of CaV3.3 α1I expression were detected in the KO model, in line with the function of KLHL1 as a positive modulator of CaV3.2 (Aromolaran et al., 2009, 2010; Perissinotti et al., 2014).
Similar to previous reports, we did not detect differences in total LVA current density between stages in culture, nor between genotypes; however analysis of biophysical properties showed Vpeak, SSA and SSI curves were shifted toward more negative values in WT neurons, with slower deactivation rates at 8–10 DIV, consistent with a decrease in the relative contribution of the α1I component in WT neurons at later stages in vitro. In contrast, neither Vpeak, SSA nor SSI curves changed in KO neurons during their time in culture suggesting that down-regulation of α1H allowed the electrophysiological detection of α1I current properties, even at late stages of neuronal culture when they are normally not detectable due the preponderance of α1G and α1H. LVA currents in KO neurons had properties similar to those seen in WT neuronal cultures at early stages in vitro, when α1I is more abundant in hippocampal neurons. This result is in agreement with our KLHL1 knockdown study in rat hippocampal neurons (Perissinotti et al., 2014).
CaV3.1 current is not modulated by KLHL1 (Aromolaran et al., 2010); and interestingly, the KO model elicited significant overexpression of α1G subunit in the hippocampus. Accordingly, LVA currents in KO neurons exhibited slow time constant of deactivation from early days in culture; suggesting the presence of α1G masked the contribution of the faster deactivation kinetics of α1I, the normally predominant component at early stages of development. The rate of deactivation was unaffected by the increase in the relative contribution of α1G at later stages likely due to the concomitant decrease in α1H levels, as both α1G and α1H have similar deactivation constants.
The unique biophysical properties of the LVA currents are more noticeable in APW experiments as previously reported (McCobb and Beam, 1991), where LVA-mediated calcium influx was 34% smaller in KO neurons at early stage, despite the similar LVA current densities detected in WT and KO. Interestingly, expression of CaV3.3 in immature cultures cannot effectively provide comparable calcium influx as CaV3.1 and/or CaV3.2 do in mature neurons (McRory et al., 2001). The slow activation kinetics of α1I channels results in small currents in response to a single action potential (Kozlov et al., 1999), uncovering the deficiency in α1H subunit expression in the KO. At late stages α1G and α1H activate quickly and display similar current amplitudes in response to a single action potential (Kozlov et al., 1999). In agreement, we did not observe differences in the calcium influx between KO and WT genotypes at mature stages, even though these cultures displayed different α1H/α1G expression ratios. Calcium entry through T-type channels occurs mainly during the repolarization phase of the AP, therefore the deactivation kinetics are important in tuning the current decay (Djouhri and Lawson, 1999; Chemin et al., 2002). Current deactivation and its decay time constant in response to an APW were increased in the KO neurons at early days of culture, likely due to the contribution of the slow α1G component which contributes to a slowly decaying current (Chemin et al., 2002). Overall, the data show a differential contribution of T-type isoforms during development of WT and KLHL1-KO neurons in vitro, and a homeostatic regulation of LVA currents in the KO by increased α1G levels upon down-regulation of α1H.
KLHL1 KD in cultured rat hippocampal neurons resulted in decreased synapsin I contents and decreased number of excitatory synapses, confirmed by decreased number of synaptic puncta and decreased mEPSC frequency. The number of inhibitory synapses was also reduced, however electrophysiological confirmation of mIPSC frequency could not be obtained in that system due to experimental difficulty (Perissinotti et al., 2014). Decreased synapsin I levels and decreased synaptic inputs onto cultured hippocampal neurons also occurred in the KLHL1 KO model. However, the reduction in the number of synapses was specific for excitatory neurons in the KO. This synaptic alteration resulted in abnormal mEPSC/mIPSC frequency ratio, favoring inhibition. In contrast to the KD model, there were no differences in inhibitory synapse number and the frequency of mIPSCs between genotypes; in fact we observed an increase in the % co-localization between GAD67 and gephyrin, suggesting increased expression of GAD-67 as a likely compensatory mechanism for reduced glutamatergic inputs. Synaptic homeostasis mechanisms have been thoroughly demonstrated to maintain neuronal excitability (Davis and Bezprozvanny, 2001; Turrigiano, 2012) and GAD67 is a target for activity-dependent regulation (Lau and Murthy, 2012); however changes in expression of gephyrin has not been ruled out.
The inability to compensate the excitatory/inhibitory imbalance in KO neurons is likely due to the combined altered expression of synapsin I and α1A and α1H CaV channels. Synapsin phosphoproteins play an important role in the regulation of axonogenesis, synaptogenesis and the modulation of neurotransmitter release (Hilfiker et al., 1999; Ferreira and Rapoport, 2002; Evergren et al., 2007; Bykhovskaia, 2011). In parallel, pre- and post-synaptic CaV channel subunits are directly involved in the formation and maintenance of synapses by interacting with synapse organizers (Brodbeck et al., 2002; Nishimune et al., 2004; Eroglu et al., 2009; Kurshan et al., 2009; Nishimune, 2011). We studied the status of somatic calcium currents only, but western blot results are indicative of global CaV protein levels in pre- and post-synaptic sites altogether. P/Q-type channels are preferentially located in presynaptic terminals throughout the brain; they have a prominent role in controlling neurotransmitter release that increases during development (Nudler et al., 2003; Inchauspe et al., 2004; Giugovaz-Tropper et al., 2011); thus decreased presynaptic α1A could alter the number of excitatory synapses in the KLHL1 KO. Q and N-type calcium channels mediate synaptic transmission in the hippocampus (Scholz and Miller, 1995; Wheeler et al., 1995; Pravettoni et al., 2000), and P/Q-, N- and R-type channel openings account for ~50% of all spontaneous glutamate release at rat cultured hippocampal synapses (Scholz and Miller, 1995; Ermolyuk et al., 2013); on the other hand, N- and L-type but not P/Q-type channel activity generate the spontaneous release of GABA in hippocampal granule neurons (Goswami et al., 2012). Therefore decreased P/Q channel levels and activity could affect excitatory neurons to a greater extent than inhibitory neurons. Furthermore, regulation of spontaneous synaptic release of glutamate by presynaptic CaV3.2 channels has been reported for dorsal horn neurons, raising the possibility that alterations in T-type current activity could also have a deleterious role in pre-synaptic function of excitatory hippocampal neurons (Bao et al., 1998; Jacus et al., 2012; Rozanski et al., 2013; Fekete et al., 2014). In contrast, L-type channels are preferentially located at postsynaptic sites and have less effect on neurotransmitter release (Kamiya et al., 1988; Pravettoni et al., 2000), therefore up-regulation of L-type currents unlikely compensated for deficits in presynaptic calcium currents in the KO. Finally, altered astrocyte function due to the absence of KLHL1 could be possible and has not been ruled out as a factor contributing to the synaptic deficits observed in the KLHL1 KO (Ullian et al., 2001; Christopherson et al., 2005; Jiang et al., 2007; Südhof, 2012).
The KLHL1 KO mouse model highlights the importance of KLHL1 in the modulation of CaV2.1 and CaV3.2-mediated calcium currents, and revealed compensatory mechanisms to maintain calcium homeostasis. Overall, ablation of KLHL1 leads to an initial decrease in calcium current in cultured neurons, which was compensated for by homeostatic up-regulation of voltage dependent calcium currents not subjected to modulation by KLHL1, such as L-, N- and α1G T-type currents. However, despite the up-regulation of somatic HVA and LVA current densities, possible alterations in calcium channel composition at presynaptic sites and down-regulation of synapsin I resulted in decreased number of excitatory synapses and altered balance between excitatory and inhibitory inputs onto hippocampal neurons, corroborating a synaptic function for KLHL1 (Aromolaran et al., 2007, 2009, 2010; Perissinotti et al., 2014). These deficits may become significant during process of sub-optimal function, such as aging or in disease.
Author’s Contributions
Erika S. Piedras-Rentería conception of research; Michael D. Koob’s laboratory generated the KLHL1-knockout mice; Erika S. Piedras-Rentería and Paula P. Perissinotti designed the experiments; Paula P. Perissinotti, Elizabeth A. Ethington, Erik Almazan, Elizabeth Martínez-Hernández, Jennifer Kalil and Erika S. Piedras-Rentería performed experiments; Erika S. Piedras-Rentería supervised the experiments; Paula P. Perissinotti and Erika S. Piedras-Rentería analyzed data, interpreted results of experiments; Paula P. Perissinotti and Erika S. Piedras-Rentería prepared figures; Erika S. Piedras-Rentería and Paula P. Perissinotti wrote the manuscript; Paula P. Perissinotti and Erika S. Piedras-Rentería edited and revised the manuscript. Erika S. Piedras-Rentería approved the final version of the manuscript.
Conflict of Interest Statement
The authors declare that the research was conducted in the absence of any commercial or financial relationships that could be construed as a potential conflict of interest.
Acknowledgments
We thank all members of the Piedras laboratory for helpful comments and discussions. This paper is based upon work supported by the National Science Foundation under Grant no. 1022075 (EPR).
References
Aromolaran, K. A., Benzow, K. A., Cribbs, L. L., Koob, M. D., and Piedras-Rentería, E. S. (2009). Kelch-like 1 protein upregulates T-type currents by an actin-F dependent increase in alpha(1H) channels via the recycling endosome. Channels (Austin) 3, 402–412. doi: 10.4161/chan.3.6.9858
Pubmed Abstract | Pubmed Full Text | CrossRef Full Text | Google Scholar
Aromolaran, K. A., Benzow, K. A., Cribbs, L. L., Koob, M. D., and Piedras-Rentería, E. S. (2010). T-type current modulation by the actin-binding protein Kelch-like 1. Am. J. Physiol. Cell Physiol. 298, C1353–C1362. doi: 10.1152/ajpcell.00235.2009
Pubmed Abstract | Pubmed Full Text | CrossRef Full Text | Google Scholar
Aromolaran, K. A., Benzow, K. A., Cribbs, L. L., Koob, M. D., and Piedras-Rentería, E. S. (2012). Elimination of the actin-binding domain in kelch-like 1 protein induces T-type calcium channel modulation only in the presence of action potential waveforms. J. Signal Transduct. 2012:505346. doi: 10.1155/2012/505346
Pubmed Abstract | Pubmed Full Text | CrossRef Full Text | Google Scholar
Aromolaran, K. A., Benzow, K. A., Koob, M. D., and Piedras-Rentería, E. S. (2007). The Kelch-like protein 1 modulates P/Q-type calcium current density. Neuroscience 145, 841–850. doi: 10.1016/j.neuroscience.2006.12.046
Pubmed Abstract | Pubmed Full Text | CrossRef Full Text | Google Scholar
Bao, J. P., Li, J. J., and Perl, E. R. (1998). Differences in Ca2+ channels governing generation of miniature and evoked excitatory synaptic currents in spinal laminae I and II. J. Neurosci. 18, 8740–8750.
Bean, B. P. (1985). Two kinds of calcium channels in canine atrial cells. Differences in kinetics, selectivity and pharmacology. J. Gen. Physiol. 86, 1–30. doi: 10.1085/jgp.86.1.1
Pubmed Abstract | Pubmed Full Text | CrossRef Full Text | Google Scholar
Bolte, S., and Cordelières, F. P. (2006). A guided tour into subcellular colocalization analysis in light microscopy. J. Microsc. 224, 213–232. doi: 10.1111/j.1365-2818.2006.01706.x
Pubmed Abstract | Pubmed Full Text | CrossRef Full Text | Google Scholar
Brodbeck, J., Davies, A., Courtney, J. M., Meir, A., Balaguero, N., Canti, C., et al. (2002). The ducky mutation in Cacna2d2 results in altered Purkinje cell morphology and is associated with the expression of a truncated alpha 2 delta-2 protein with abnormal function. J. Biol. Chem. 277, 7684–7693. doi: 10.1074/jbc.m109404200
Pubmed Abstract | Pubmed Full Text | CrossRef Full Text | Google Scholar
Bykhovskaia, M. (2011). Synapsin regulation of vesicle organization and functional pools. Semin. Cell Dev. Biol. 22, 387–392. doi: 10.1016/j.semcdb.2011.07.003
Pubmed Abstract | Pubmed Full Text | CrossRef Full Text | Google Scholar
Cain, S. M., and Snutch, T. P. (2010). Contributions of T-type calcium channel isoforms to neuronal firing. Channels (Austin) 4, 475–482. doi: 10.4161/chan.4.6.14106
Pubmed Abstract | Pubmed Full Text | CrossRef Full Text | Google Scholar
Chameau, P., Lucas, P., Melliti, K., Bournaud, R., and Shimahara, T. (1999). Development of multiple calcium channel types in cultured mouse hippocampal neurons. Neuroscience 90, 383–388. doi: 10.1016/s0306-4522(98)00457-6
Pubmed Abstract | Pubmed Full Text | CrossRef Full Text | Google Scholar
Chemin, J., Monteil, A., Perez-Reyes, E., Bourinet, E., Nargeot, J., and Lory, P. (2002). Specific contribution of human T-type calcium channel isotypes (alpha(1G), alpha(1H) and alpha(1I)) to neuronal excitability. J. Physiol. 540, 3–14. doi: 10.1113/jphysiol.2001.013269
Pubmed Abstract | Pubmed Full Text | CrossRef Full Text | Google Scholar
Chen, W. L., Lin, J. W., Huang, H. J., Wang, S. M., Su, M. T., Lee-Chen, G. J., et al. (2008). SCA8 mRNA expression suggests an antisense regulation of KLHL1 and correlates to SCA8 pathology. Brain Res. 1233, 176–184. doi: 10.1016/j.brainres.2008.07.096
Pubmed Abstract | Pubmed Full Text | CrossRef Full Text | Google Scholar
Christopherson, K. S., Ullian, E. M., Stokes, C. C., Mullowney, C. E., Hell, J. W., Agah, A., et al. (2005). Thrombospondins are astrocyte-secreted proteins that promote CNS synaptogenesis. Cell 120, 421–433. doi: 10.1016/j.cell.2004.12.020
Pubmed Abstract | Pubmed Full Text | CrossRef Full Text | Google Scholar
Danglot, L., Triller, A., and Bessis, A. (2003). Association of gephyrin with synaptic and extrasynaptic GABAA receptors varies during development in cultured hippocampal neurons. Mol. Cell. Neurosci. 23, 264–278. doi: 10.1016/s1044-7431(03)00069-1
Pubmed Abstract | Pubmed Full Text | CrossRef Full Text | Google Scholar
Davis, G. W., and Bezprozvanny, I. (2001). Maintaining the stability of neural function: a homeostatic hypothesis. Annu. Rev. Physiol. 63, 847–869. doi: 10.1146/annurev.physiol.63.1.847
Pubmed Abstract | Pubmed Full Text | CrossRef Full Text | Google Scholar
Djouhri, L., and Lawson, S. N. (1999). Changes in somatic action potential shape in guinea-pig nociceptive primary afferent neurones during inflammation in vivo. J. Physiol. 520(Pt. 2), 565–576. doi: 10.1111/j.1469-7793.1999.t01-1-00565.x
Pubmed Abstract | Pubmed Full Text | CrossRef Full Text | Google Scholar
Ermolyuk, Y. S., Alder, F. G., Surges, R., Pavlov, I. Y., Timofeeva, Y., Kullmann, D. M., et al. (2013). Differential triggering of spontaneous glutamate release by P/Q-, N- and R-type Ca2+ channels. Nat. Neurosci. 16, 1754–1763. doi: 10.1038/nn.3563
Pubmed Abstract | Pubmed Full Text | CrossRef Full Text | Google Scholar
Eroglu, C., Allen, N. J., Susman, M. W., O’Rourke, N. A., Park, C. Y., Ozkan, E., et al. (2009). Gabapentin receptor alpha2delta-1 is a neuronal thrombospondin receptor responsible for excitatory CNS synaptogenesis. Cell 139, 380–392. doi: 10.1016/j.cell.2009.09.025
Pubmed Abstract | Pubmed Full Text | CrossRef Full Text | Google Scholar
Evergren, E., Benfenati, F., and Shupliakov, O. (2007). The synapsin cycle: a view from the synaptic endocytic zone. J. Neurosci. Res. 85, 2648–2656. doi: 10.1002/jnr.21176
Pubmed Abstract | Pubmed Full Text | CrossRef Full Text | Google Scholar
Fekete, A., Johnston, J., and Delaney, K. R. (2014). Presynaptic T-type Ca2+ channels modulate dendrodendritic mitral-mitral and mitral-periglomerular connections in mouse olfactory bulb. J. Neurosci. 34, 14032–14045. doi: 10.1523/JNEUROSCI.0905-14.2014
Pubmed Abstract | Pubmed Full Text | CrossRef Full Text | Google Scholar
Ferreira, A., and Rapoport, M. (2002). The synapsins: beyond the regulation of neurotransmitter release. Cell. Mol. Life Sci. 59, 589–595. doi: 10.1007/s00018-002-8451-5
Pubmed Abstract | Pubmed Full Text | CrossRef Full Text | Google Scholar
Florio, V., Striessnig, J., and Catterall, W. A. (1992). Purification and reconstitution of skeletal-muscle calcium channels. Methods Enzymol. 207, 529–546. doi: 10.1016/0076-6879(92)07037-o
Pubmed Abstract | Pubmed Full Text | CrossRef Full Text | Google Scholar
Giugovaz-Tropper, B., González-Inchauspe, C., Di Guilmi, M. N., Urbano, F. J., Forsythe, I. D., and Uchitel, O. D. (2011). P/Q-type calcium channel ablation in a mice glycinergic synapse mediated by multiple types of Ca(2)+ channels alters transmitter release and short term plasticity. Neuroscience 192, 219–230. doi: 10.1016/j.neuroscience.2011.06.021
Pubmed Abstract | Pubmed Full Text | CrossRef Full Text | Google Scholar
Gomperts, S. N. (1996). Clustering membrane proteins: it’s all coming together with the PSD-95/SAP90 protein family. Cell 84, 659–662. doi: 10.1016/s0092-8674(00)81043-0
Pubmed Abstract | Pubmed Full Text | CrossRef Full Text | Google Scholar
Goswami, S. P., Bucurenciu, I., and Jonas, P. (2012). Miniature IPSCs in hippocampal granule cells are triggered by voltage-gated Ca2+ channels via microdomain coupling. J. Neurosci. 32, 14294–14304. doi: 10.1523/JNEUROSCI.6104-11.2012
Pubmed Abstract | Pubmed Full Text | CrossRef Full Text | Google Scholar
He, Y., Zu, T., Benzow, K. A., Orr, H. T., Clark, H. B., and Koob, M. D. (2006). Targeted deletion of a single Sca8 ataxia locus allele in mice causes abnormal gait, progressive loss of motor coordination and Purkinje cell dendritic deficits. J. Neurosci. 26, 9975–9982. doi: 10.1523/jneurosci.2595-06.2006
Pubmed Abstract | Pubmed Full Text | CrossRef Full Text | Google Scholar
Hilfiker, S., Pieribone, V. A., Czernik, A. J., Kao, H. T., Augustine, G. J., and Greengard, P. (1999). Synapsins as regulators of neurotransmitter release. Philos. Trans. R. Soc. Lond. B Biol. Sci. 354, 269–279. doi: 10.1098/rstb.1999.0378
Pubmed Abstract | Pubmed Full Text | CrossRef Full Text | Google Scholar
Ikeda, Y., Dalton, J. C., Day, J. W., and Ranum, L. P. W. (2007). “Spinocerebellar ataxia type 8,” in GeneReviews™ [Internet], eds R. A. Pagon, T. D. Bird, C. R. Dolan, K. Stephens and M. P. Adam (Seattle (WA): University of Washington).
Inchauspe, C. G., Martini, F. J., Forsythe, I. D., and Uchitel, O. D. (2004). Functional compensation of P/Q by N-type channels blocks short-term plasticity at the calyx of held presynaptic terminal. J. Neurosci. 24, 10379–10383. doi: 10.1523/jneurosci.2104-04.2004
Pubmed Abstract | Pubmed Full Text | CrossRef Full Text | Google Scholar
Isaeva, E. V., Fedulova, S. A., and Veselovskii, N. S. (1998). Voltage-dependent calcium channels in cultivated neurons of the rat hippocampus. Neurophysiology 30, 297–300. doi: 10.1007/bf02462842
Jacus, M. O., Uebele, V. N., Renger, J. J., and Todorovic, S. M. (2012). Presynaptic CaV3.2 channels regulate excitatory neurotransmission in nociceptive Dorsal horn neurons. J. Neurosci. 32, 9374–9382. doi: 10.1523/JNEUROSCI.0068-12.2012
Pubmed Abstract | Pubmed Full Text | CrossRef Full Text | Google Scholar
Jiang, S. X., Seng, S., Avraham, H. K., Fu, Y. G., and Avraham, S. (2007). Process elongation of oligodendrocytes is promoted by the kelch-related protein MRP2/KLHL1. J. Biol. Chem. 282, 12319–12329. doi: 10.1074/jbc.m701019200
Pubmed Abstract | Pubmed Full Text | CrossRef Full Text | Google Scholar
Kamiya, H., Sawada, S., and Yamamoto, C. (1988). Synthetic omega-conotoxin blocks synaptic transmission in the hippocampus in vitro. Neurosci. Lett. 91, 84–88. doi: 10.1016/0304-3940(88)90253-4
Pubmed Abstract | Pubmed Full Text | CrossRef Full Text | Google Scholar
Kasumu, A., and Bezprozvanny, I. (2012). Deranged calcium signaling in Purkinje cells and pathogenesis in spinocerebellar ataxia 2 (SCA2) and other ataxias. Cerebellum 11, 630–639. doi: 10.1007/s12311-010-0182-9
Pubmed Abstract | Pubmed Full Text | CrossRef Full Text | Google Scholar
Klöckner, U., Lee, J. H., Cribbs, L. L., Daud, A., Hescheler, J., Pereverzev, A., et al. (1999). Comparison of the Ca2 + currents induced by expression of three cloned α1 subunits, α1G, α1H and α1I, of low-voltage-activated T-type Ca2 + channels. Eur. J. Neurosci. 11, 4171–4178. doi: 10.1046/j.1460-9568.1999.00849.x
Pubmed Abstract | Pubmed Full Text | CrossRef Full Text | Google Scholar
Köhler, C., and Chan-Palay, V. (1983). Distribution of gamma aminobutyric acid containing neurons and terminals in the septal area. An immunohistochemical study using antibodies to glutamic acid decarboxylase in the rat brain. Anat. Embryol. (Berl) 167, 53–65. doi: 10.1007/bf00304600
Pubmed Abstract | Pubmed Full Text | CrossRef Full Text | Google Scholar
Koob, M. D., Moseley, M. L., Schut, L. J., Benzow, K. A., Bird, T. D., Day, J. W., et al. (1999). An untranslated CTG expansion causes a novel form of spinocerebellar ataxia (SCA8). Nat. Genet. 21, 379–384. doi: 10.1038/7710
Pubmed Abstract | Pubmed Full Text | CrossRef Full Text | Google Scholar
Kortekaas, P., and Wadman, W. J. (1997). Development of HVA and LVA calcium currents in pyramidal CA1 neurons in the hippocampus of the rat. Brain Res. Dev. Brain Res. 101, 139–147. doi: 10.1016/s0165-3806(97)00059-x
Pubmed Abstract | Pubmed Full Text | CrossRef Full Text | Google Scholar
Kozlov, A. S., McKenna, F., Lee, J. H., Cribbs, L. L., Perez-Reyes, E., Feltz, A., et al. (1999). Distinct kinetics of cloned T-type Ca2 + channels lead to differential Ca2 + entry and frequency-dependence during mock action potentials. Eur. J. Neurosci. 11, 4149–4158. doi: 10.1046/j.1460-9568.1999.00841.x
Pubmed Abstract | Pubmed Full Text | CrossRef Full Text | Google Scholar
Kurshan, P. T., Oztan, A., and Schwarz, T. L. (2009). Presynaptic alpha2delta-3 is required for synaptic morphogenesis independent of its Ca2+-channel functions. Nat. Neurosci. 12, 1415–1423. doi: 10.1038/nn.2417
Pubmed Abstract | Pubmed Full Text | CrossRef Full Text | Google Scholar
Lau, C. G., and Murthy, V. N. (2012). Activity-dependent regulation of inhibition via GAD67. J. Neurosci. 32, 8521–8531. doi: 10.1523/JNEUROSCI.1245-12.2012
Pubmed Abstract | Pubmed Full Text | CrossRef Full Text | Google Scholar
Lin, H.-Y., Hung, W.-L., Kao, S.-H., Chang, J.-H., Li, M.-L., and Lee-Chen, G.-J. (2007). Studies of trans RNA interference of SCA8 CTG Trinucleotide repeats expansion. BioFormosa 42, 25–33.
McCobb, D. P., and Beam, K. G. (1991). Action potential waveform voltage-clamp commands reveal striking differences in calcium entry via low and high voltage-activated calcium channels. Neuron 7, 119–127. doi: 10.1016/0896-6273(91)90080-j
Pubmed Abstract | Pubmed Full Text | CrossRef Full Text | Google Scholar
McKay, B. E., McRory, J. E., Molineux, M. L., Hamid, J., Snutch, T. P., Zamponi, G. W., et al. (2006). Ca(V)3 T-type calcium channel isoforms differentially distribute to somatic and dendritic compartments in rat central neurons. Eur. J. Neurosci. 24, 2581–2594. doi: 10.1111/j.1460-9568.2006.05136.x
Pubmed Abstract | Pubmed Full Text | CrossRef Full Text | Google Scholar
McRory, J. E., Santi, C. M., Hamming, K. S., Mezeyova, J., Sutton, K. G., Baillie, D. L., et al. (2001). Molecular and functional characterization of a family of rat brain T-type calcium channels. J. Biol. Chem. 276, 3999–4011. doi: 10.1074/jbc.m008215200
Pubmed Abstract | Pubmed Full Text | CrossRef Full Text | Google Scholar
Nemes, J. P., Benzow, K. A., Moseley, M. L., Ranum, L. P., and Koob, M. D. (2000). The SCA8 transcript is an antisense RNA to a brain-specific transcript encoding a novel actin-binding protein (KLHL1). Hum. Mol. Genet. 9, 1543–1551. doi: 10.1093/hmg/9.10.1543
Pubmed Abstract | Pubmed Full Text | CrossRef Full Text | Google Scholar
Nishimune, H. (2011). Transsynaptic channelosomes: non-conducting roles of ion channels in synapse formation. Channels (Austin) 5, 432–439. doi: 10.4161/chan.5.5.16472
Pubmed Abstract | Pubmed Full Text | CrossRef Full Text | Google Scholar
Nishimune, H., Sanes, J. R., and Carlson, S. S. (2004). A synaptic laminin-calcium channel interaction organizes active zones in motor nerve terminals. Nature 432, 580–587. doi: 10.1038/nature03112
Pubmed Abstract | Pubmed Full Text | CrossRef Full Text | Google Scholar
Nudler, S., Piriz, J., Urbano, F. J., Rosato-Siri, M. D., Renteria, E. S., and Uchitel, O. D. (2003). Ca2+ channels and synaptic transmission at the adult, neonatal and P/Q-type deficient neuromuscular junction. Ann. N Y Acad. Sci. 998, 11–17. doi: 10.1196/annals.1254.003
Pubmed Abstract | Pubmed Full Text | CrossRef Full Text | Google Scholar
Otsu, N. (1979). A threshold selection method from gray level histograms. IEEE Trans. Syst. 9, 62–66. doi: 10.1109/tsmc.1979.4310076
Perez-Reyes, E. (2003). Molecular physiology of low-voltage-activated T-type calcium channels. Physiol. Rev. 83, 117–161. doi: 10.1152/physrev.00018.2002
Pubmed Abstract | Pubmed Full Text | CrossRef Full Text | Google Scholar
Perissinotti, P. P., Ethington, E. G., Cribbs, L., Koob, M. D., Martin, J., and Piedras-Rentería, E. S. (2014). Down-regulation of endogenous KLHL1 decreases voltage-gated calcium current density. Cell Calcium 55, 269–280. doi: 10.1016/j.ceca.2014.03.002
Pubmed Abstract | Pubmed Full Text | CrossRef Full Text | Google Scholar
Piedras-Rentería, E. S., Pyle, J. L., Diehn, M., Glickfeld, L. L., Harata, N. C., Cao, Y., et al. (2004). Presynaptic homeostasis at CNS nerve terminals compensates for lack of a key Ca2+ entry pathway. Proc. Natl. Acad. Sci. U S A 101, 3609–3614. doi: 10.1073/pnas.0308188100
Pubmed Abstract | Pubmed Full Text | CrossRef Full Text | Google Scholar
Prag, S., and Adams, J. C. (2003). Molecular phylogeny of the kelch-repeat superfamily reveals an expansion of BTB/kelch proteins in animals. BMC Bioinformatics 4:42. doi: 10.1186/1471-2105-4-42
Pubmed Abstract | Pubmed Full Text | CrossRef Full Text | Google Scholar
Pravettoni, E., Bacci, A., Coco, S., Forbicini, P., Matteoli, M., and Verderio, C. (2000). Different localizations and functions of L-type and N-type calcium channels during development of hippocampal neurons. Dev. Biol. 227, 581–594. doi: 10.1006/dbio.2000.9872
Pubmed Abstract | Pubmed Full Text | CrossRef Full Text | Google Scholar
Rasband, W. S. (1997–2006). ImageJ. US National Institutes of Health. Bethesda, MD, USA. http://rsb.info.nih.gov/ij/.
Rozanski, G. M., Nath, A. R., Adams, M. E., and Stanley, E. F. (2013). Low voltage-gated calcium channels gate transmitter release at the Dorsal root Ganglion sandwich synapse. J. Physiol. 591, 5575–5583. doi: 10.1113/jphysiol.2013.260281
Pubmed Abstract | Pubmed Full Text | CrossRef Full Text | Google Scholar
Scholz, K. P., and Miller, R. J. (1995). Developmental changes in presynaptic calcium channels coupled to glutamate release in cultured rat hippocampal neurons. J. Neurosci. 15, 4612–4617.
Seng, S., Avraham, H. K., Jiang, S. X., Venkatesh, S., and Avraham, S. (2006). KLHL1/MRP2 mediates neurite outgrowth in a glycogen synthase kinase 3 beta-dependent manner. Mol. Cell. Biol. 26, 8371–8384. doi: 10.1128/mcb.02167-05
Pubmed Abstract | Pubmed Full Text | CrossRef Full Text | Google Scholar
Shao, M., Hirsch, J. C., Giaume, C., and Peusner, K. D. (2003). Spontaneous synaptic activity is primarily GABAergic in vestibular nucleus neurons of the chick embryo. J. Neurophysiol. 90, 1182–1192. doi: 10.1152/jn.00076.2003
Pubmed Abstract | Pubmed Full Text | CrossRef Full Text | Google Scholar
Südhof, T. C. (2012). The presynaptic active zone. Neuron 75, 11–25. doi: 10.1016/j.neuron.2012.06.012
Pubmed Abstract | Pubmed Full Text | CrossRef Full Text | Google Scholar
Szczot, M., Wojtowicz, T., and Mozrzymas, J. W. (2010). GABAergic and glutamatergic currents in hippocampal slices and neuronal cultures show profound differences: a clue to a potent homeostatic modulation. J. Physiol. Pharmacol. 61, 501–506.
Turrigiano, G. (2012). Homeostatic synaptic plasticity: local and global mechanisms for stabilizing neuronal function. Cold Spring Harb Perspect. Biol. 4:a005736. doi: 10.1101/cshperspect.a005736
Pubmed Abstract | Pubmed Full Text | CrossRef Full Text | Google Scholar
Ullian, E. M., Sapperstein, S. K., Christopherson, K. S., and Barres, B. A. (2001). Control of synapse number by glia. Science 291, 657–661. doi: 10.1126/science.291.5504.657
Pubmed Abstract | Pubmed Full Text | CrossRef Full Text | Google Scholar
Wheeler, D. B., Randall, A., Sather, W. A., and Tsien, R. W. (1995). Neuronal calcium channels encoded by the alpha 1A subunit and their contribution to excitatory synaptic transmission in the CNS. Prog. Brain Res. 105, 65–78. doi: 10.1016/s0079-6123(08)63284-7
Pubmed Abstract | Pubmed Full Text | CrossRef Full Text | Google Scholar
Keywords: actin-binding proteins, Kelch-like 1 protein, T-type voltage-gated calcium channels, P/Q-type voltage-gated calcium channels, LVA, HVA, synapsin I, SCA8
Citation: Perissinotti PP, Ethington EA, Almazan E, Martínez-Hernández E, Kalil J, Koob MD and Piedras-Renteria ES (2015) Calcium current homeostasis and synaptic deficits in hippocampal neurons from Kelch-like 1 knockout mice. Front. Cell. Neurosci. 8:444. doi: 10.3389/fncel.2014.00444
Received: 07 November 2014; Accepted: 10 December 2014;
Published online: 07 January 2015.
Edited by:
Mauro Pessia, Universtity of Perugia, ItalyReviewed by:
Francisco J. Urbano, Consejo Superior de Investigaciones Cientificas (CONICET)-Argentina, ArgentinaAlessandro Tozzi, University of Perugia, Italy
Copyright © 2015 Perissinotti, Ethington, Almazan, Martínez-Hernández, Kalil, Koob and Piedras-Renteria. This is an open-access article distributed under the terms of the Creative Commons Attribution License (CC BY). The use, distribution and reproduction in other forums is permitted, provided the original author(s) or licensor are credited and that the original publication in this journal is cited, in accordance with accepted academic practice. No use, distribution or reproduction is permitted which does not comply with these terms.
*Correspondence: Erika S. Piedras-Rentería, Department of Cell and Molecular Physiology and Neuroscience Institute, Loyola University Chicago, Stritch School of Medicine, 2160 S. First Ave., Maywood, IL, 60153, USA e-mail: epiedra@luc.edu