Bruchpilot and Synaptotagmin collaborate to drive rapid glutamate release and active zone differentiation
 Mila M. Paul1
  Martin Pauli1 Nadine Ehmann1
  Stefan Hallermann2
  Markus Sauer3
  Robert J. Kittel1*
  Manfred Heckmann1*
- 1Department of Neurophysiology, Institute of Physiology, Julius-Maximilians-University Würzburg, Würzburg, Germany
- 2Carl-Ludwig-Institute for Physiology, University of Leipzig, Leipzig, Germany
- 3Department of Biotechnology and Biophysics, Julius-Maximilians-University Würzburg, Würzburg, Germany
The active zone (AZ) protein Bruchpilot (Brp) is essential for rapid glutamate release at Drosophila melanogaster neuromuscular junctions (NMJs). Quantal time course and measurements of action potential-waveform suggest that presynaptic fusion mechanisms are altered in brp null mutants (brp69). This could account for their increased evoked excitatory postsynaptic current (EPSC) delay and rise time (by about 1 ms). To test the mechanism of release protraction at brp69 AZs, we performed knock-down of Synaptotagmin-1 (Syt) via RNAi (sytKD) in wildtype (wt), brp69 and rab3 null mutants (rab3rup), where Brp is concentrated at a small number of AZs. At wt and rab3rup synapses, sytKD lowered EPSC amplitude while increasing rise time and delay, consistent with the role of Syt as a release sensor. In contrast, sytKD did not alter EPSC amplitude at brp69 synapses, but shortened delay and rise time. In fact, following sytKD, these kinetic properties were strikingly similar in wt and brp69, which supports the notion that Syt protracts release at brp69synapses. To gain insight into this surprising role of Syt at brp69 AZs, we analyzed the structural and functional differentiation of synaptic boutons at the NMJ. At ‘tonic’ type Ib motor neurons, distal boutons contain more AZs, more Brp proteins per AZ and show elevated and accelerated glutamate release compared to proximal boutons. The functional differentiation between proximal and distal boutons is Brp-dependent and reduced after sytKD. Notably, sytKD boutons are smaller, contain fewer Brp positive AZs and these are of similar number in proximal and distal boutons. In addition, super-resolution imaging via dSTORM revealed that sytKD increases the number and alters the spatial distribution of Brp molecules at AZs, while the gradient of Brp proteins per AZ is diminished. In summary, these data demonstrate that normal structural and functional differentiation of Drosophila AZs requires concerted action of Brp and Syt.
Introduction
Active zones (AZs) allow exquisite spatial and temporal control of vesicle fusion. Large multidomain proteins rich in coiled-coil sequences such as Bassoon, Piccolo and the CAST/ERC family member Brp are major structural and functional organizers of AZs (Südhof, 2012). Their abundance appears to correlate positively with neurotransmitter release (Graf et al., 2009; Matz et al., 2010; Weyhersmüller et al., 2011; Ehmann et al., 2014; Peled et al., 2014).
At Drosophila melanogaster NMJs, Brp is crucial for synchronous glutamate release and the clustering of calcium channels at AZs (Kittel et al., 2006; Wagh et al., 2006). Linking the amount of Brp or Bassoon per AZ to the number and spatial arrangement of calcium channels may account for the correlation with release probability, e.g., in the context of synaptic homeostasis (Matz et al., 2010; Weyhersmüller et al., 2011; Ehmann et al., 2014). Slight increases in coupling distance in the 20–40 nm range reduce release probability dramatically while changing kinetic release parameters to a lesser extent (Neher, 1998; Eggermann et al., 2011; Schmidt et al., 2013; Vyleta and Jonas, 2014). Differences in coupling distance are therefore ideal for scaling the amount of release, whereas controlling its time course appears to require additional molecular mechanisms.
The main kinetic transmitter release parameters are synaptic delay, rise, and decay times. In the present study, we focus on synaptic delay and EPSC rise time. Notably, the latter is increased by more than 1 ms at synapses lacking Brp, while release probability drops by comparison only moderately (Kittel et al., 2006; Eggermann et al., 2011). This marked kinetic change appears disproportional to the reduction in release probability. While synaptic delay has not yet been analyzed at brp69 synapses, it is usually fairly constant for a wide range of release probabilities (Barrett and Stevens, 1972; Datyner and Gage, 1980).
While the molecular mechanisms controlling release kinetics are complex and not well understood (Neher, 2010), it is clear that the vesicle protein Syt plays an important role (Brose et al., 2002; Young and Neher, 2009). As initially suggested more than 20 years ago (DiAntonio et al., 1993; Littleton et al., 1993; Geppert et al., 1994), Syt is crucial for triggering release and may act both as a calcium sensor and a vesicle fusion clamp. In fact, its role may change from clamp to sensor upon calcium influx into the presynaptic terminal (DeBello et al., 1993; Walter et al., 2011).
To clarify the molecular mechanisms that shape the time course of release we analyzed the interaction between Brp and Syt. We find that in addition to prolonged EPSC rise time, synaptic delay is strongly increased at brp69 synapses. Interestingly, whereas Syt is necessary for the increase in both kinetic parameters, it has little effect on the amount of transmitter released from brp69 AZs. Following up on the functional interaction of Brp and Syt, our data suggest central roles of these two proteins in the spatial differentiation of AZs and reveal that the number of AZs per bouton, as well as the number and distribution of Brp molecules per AZ is Syt-dependent.
Materials and Methods
Fly Stocks
Drosophila larvae were raised in vials on standard corn meal (Ashburner, 1989) at 25°C for focal recordings in Figure 1 (wt and brp69) or at 29°C for reliable RNAi expression in all other experiments (mutant and control groups). For Syt RNAi, we expressed syt1_RNAi8875 Vienna Drosophila Resource Center (VDRC) specifically in motor neurons (ok6-GAL4/+; UAS-syt1_RNAi8875/+) or panneuronally (elav-GAL4/UAS-syt1_RNAi8875) using the binary UAS-GAL4 expression system (Brand and Perrimon, 1993). brp69 and rab3rup were used as previously described (Kittel et al., 2006; Graf et al., 2009). To combine brp69 and rab3rup with syt1_RNAi8875 the following lines were generated: brp69ok6-GAL4/ df(2R)BSC29; UAS-syt1_RNAi8875/+ and brp69/df(2R)BSC29; elav-GAL4/UAS-syt1_RNAi8875 (brp69, sytKD); rab3rup/df(2R)ED2076 ok6-GAL4; UAS-syt1_RNAi8875/+ and rab3rup/df(2R)ED2076; elav-GAL4/UAS-syt1_RNAi8875 (rab3rup, sytKD); ok6-GAL4/+ and elav-GAL4/+ served as wt controls. For focal recordings, GFP was expressed in presynaptic terminals: ok6-GAL4/+; UAS-CD8::GFP/+ (wt), brp69ok6-GAL4/df(2R)BSC29;UAS-CD8::GFP/+ (brp69) and ok6-GAL4/+; UAS-CD8::GFP/UAS-Syt1_RNAi8875 (sytKD). For non-allelic non-complementation the following genotypes were used: w1118 (wt), syt1AD4/+ (DiAntonio et al., 1993), brp69/+ (Kittel et al., 2006) and syt1AD4/ brp69 (sytAD4+/+brp69).
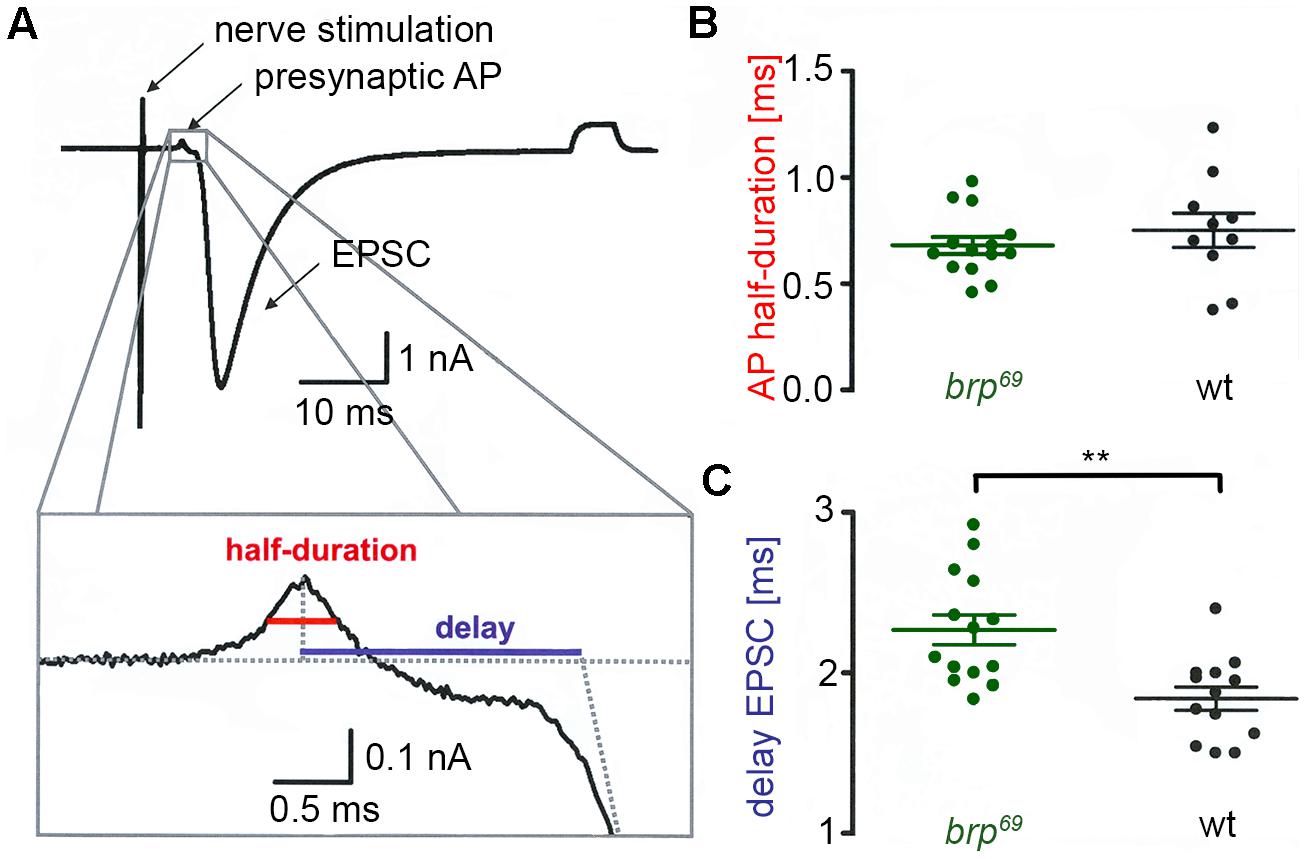
FIGURE 1. Presynaptic action potential and synaptic delay in brp69. (A) Focal recording from a Drosophila wt NMJ. Nerve stimulation (left arrow) elicited an action potential in the suction electrode which traveled to the presynaptic bouton under the focal electrode and lead to deflections (presynaptic AP, second arrow) prior to the large compound EPSC (third arrow). A subthreshold pulse through the focal electrode elicited the final upward deflection (right side of the trace and allowed to measure electrode and seal resistance). The lower panel shows the enlarged presynaptic AP and illustrates how half-duration of the positive AP deflection (red) and synaptic delay (blue) were determined. (B) While AP half-duration is unchanged between brp69 (green) and wt (black), (C) synaptic delay is prolonged in brp69. Shown are single values (dots) and mean ± SD.
Physiological Solution and Preparation
The composition of the extracellular, physiological, hemolymph-like saline (HL-3, Stewart et al., 1994) was (in mM): NaCl 70, KCl 5, MgCl2 20, NaHCO3 10, trehalose 5, sucrose 115, HEPES 5, CaCl2 as indicated, pH adjusted to 7.2. Wandering male third instar larvae were dissected in HL-3 without CaCl2. All experiments were carried out at NMJs formed on ventral abdominal muscles 6/7 in segments A2 and A3.
Focal Recordings
Macropatch recordings in Figure 1 were performed in HL-3 saline containing 1 mM [Ca2+]Ex essentially as reported previously (Pawlu et al., 2004). Bath temperature was kept constant at 18 ± 0.5°C using a Peltier element (27 W, Conrad Electronic) glued to the bath inflow with heat-conductive paste (Fischer Elektronik). EPSCs were elicited using a 0.2 Hz nerve-stimulation protocol with 0.2 ms pulse duration and amplitudes slightly above the threshold for eliciting an action potential via a suction electrode (filled with extracellular solution). Recording electrodes with openings of about 5–10 μm diameter below the tip had resistances of 250 kΩ when filled with HL-3. About 20 EPSCs were recorded per site and analyzed with IgorPro 5.04 (Wavemetrics). The data were digitally filtered at 3 kHz (Gaussian filter), baseline subtracted and the average of all failures was subtracted from the currents. AP durations were measured at half amplitude of the positive deflection (Dudel, 1965) and synaptic delay was measured from the peak of the AP to the point at which the back extrapolation of the EPSC current rising phase crossed the baseline (Figure 1). Focal recordings in Figure 6 were performed in HL-3 saline containing 0.5 mM [Ca2+]Ex. Bath temperature was kept constant at 20 ± 1°C. Focal electrodes (resistances 600 ± 50 kΩ when filled with HL-3 solution) were positioned on proximal or distal type Ib boutons of muscles 6/7. EPSCs were elicited using a 0.2 Hz nerve-stimulation protocol with 0.2 ms pulse duration and 7 V amplitude. Traces were low-pass filtered at 20 kHz, and recorded and stored with Patchmaster using an EPC10 double patch clamp amplifier (HEKA electronics). About 60 EPSCs were averaged per site and analyzed with Igor Pro 6.05 (Wavemetrics). 10 mg EGTA-AM (membrane permeable tetraacetoxymethyl ester of ehtyleneglycol-bis(ß-aminoethyl)-N,N,N’,N’-tetraacetic acid, Calbiochem Germany) was dissolved in DMSO with 20% Pluronic (Invitrogen) to obtain a stock solution of 10 mM EGTA. This stock solution was diluted 1:100 with calcium-free HL-3 and applied to the dissected preparation for 10 min. After incubation preparations were washed for 5 minutes with HL-3 (Müller et al., 2012) and recordings were performed in HL-3 containing 1.0 mM [Ca2+]Ex as described above.
Two-Electrode Voltage Clamp Recordings (TEVC)
Two-electrode voltage clamp-recordings (Figure 3) were performed essentially as previously described (Kittel et al., 2006) using an Axo Clamp 2B amplifier (Axon Instruments, Molecular Devices). All measurements were made from muscle 6 at 21 ± 1°C bath temperature. Intracellular electrodes were filled with 3 M KCl and had resistances of 12–15 MΩ. Vholding was -60 mV for evoked EPSCs. Only cells with an initial membrane potential of at least -50 mV and ≥4 MΩ input resistance were analyzed. Synaptic responses were generated by pulses of 0.3 ms length and 5–10 V amplitude, applied via a suction electrode (filled with extracellular solution) and low-pass filtered at 10 kHz. We applied a 0.2 Hz stimulation protocol, averaged 20 EPSCs per muscle cell and analyzed the data with Clampfit (Axon Instruments, Molecular Devices).
Imaging
Larvae were dissected in ice-cold HL-3 standard saline without CaCl2, fixed with 4% paraformaldehyde in 0.1 M phosphate buffered saline (PBS) for 10 min and blocked with PBT (PBS containing 0.05% Triton X-100, Sigma) including 5% natural goat serum (Dianova) for 30 min. Primary antibodies were added for overnight staining at 4°C. After three washing steps with PBS (20 min each), preparations were incubated with secondary antibodies for 2–4 h at room temperature followed by three washing steps with PBS. Filets were mounted using Vectashield (Vector Laboratories) and images were aquired using an Apotome System (Zeiss, Axiovert 200M Zeiss, objective 63x, NA 1.4, oil). Antibodies were used at the following concentrations: mouse monoclonal antibody (mAb) BrpNc82 (1:250), Alexa Fluor 488-conjugated goat α-mouse (Invitrogen) and Cy3-conjugated goat α-horseradish peroxidase (HRP, Jackson Immuno Research) antibodies (1:250), rabbit α-Dsyt-CL1 (Mackler et al., 2002) and Cy3-conjugated goat α-rabbit (Jackson Immuno Research, 1:250) antibodies. Z-stacks of 15–20 single images taken every 250 nm were maximum projected and analyzed in ImageJ (1.440, NIH). Brp puncta per NMJ and per bouton were quantified manually. Using the three terminal boutons of type Ib and Is branches the respective structural gradient was analyzed. Distal boutons were located at the end of bouton chains, while proximal boutons were closer to the entry site of the motor neuron. Bouton area, length (along chain axis) and width (90° to length) were measured using α-HRP stainings.
dSTORM (Direct Stochastic Optical Reconstruction Microscopy)
Larvae were dissected, fixed and washed as described above and super-resolution imaging was performed essentially as previously reported (Ehmann et al., 2014). Preparations were incubated with mAb BrpNc82 (1:2000) and secondary antibody goat α-mouse F(ab’)2 fragments (A10534, Invitrogen) labeled with Cy5-NHS (PA15101, GE Healthcare) at a concentration of 5.2 × 10⁻⁸ M or with rabbit α-Dsyt-CL1 (1:10000, Mackler et al., 2002) and secondary antibody goat α-rabbit F(ab’)2 fragments labeled with Alexa Fluor 647 (1:500, Invitrogen). Boutons were visualized with Alexa Fluor 488 conjugated goat α-horseradish-peroxidase antibody (α-HRP, 1:250, Jackson Immuno Research). After staining, larval preparations were incubated in 100 mM Mercaptoethylamin (MEA, Sigma-Aldrich) buffer in PBS, pH 7.8–7.9 to allow reversible switching of single fluorophores during data acquisiton (van de Linde et al., 2008). Images were acquired using an inverted microscope (Olympus IX-71, 60x, NA 1.45, oil immersion) equiped with a nosepiece-stage (IX2-NPS, Olympus). 644 nm (iBEAM-SMART-640-S, Toptica), and 488 nm (iBEAM-SMART-488-S, Toptica) lasers were used for excitation of Cy5 and Alexa Fluor488, respectively. Laser beams were passed through a clean-up filter (Brightline HC 642/10, Semrock, and ZET 488/10, Chroma, respectively) and two dichroic mirrors (Laser-MUX BS 514-543 and HC-quadband BP, Semrock) onto the probe. The emmitted fluorescence was filtered with a quadband-filter (HC-quadband 446/523/600/677, Semrock) and divided onto two cameras (iXon Ultra DU-897-U, Andor) using a dichroic mirror (HC-BS 640 imaging, Semrock). In addition, fluorescence was filtered using a longpass- (Edge Basic 635, Semrock) or bandpass-filter (Brightline HC 525/50, Semrock) for red and green channels, respectively. Pixel sizes were 126 nm (red) and 128 nm (green). Single fluorophores were localized and high resolution-images were reconstructed with rapidSTORM (Heilemann et al., 2008; Wolter et al., 2010; van de Linde et al., 2011; Wolter et al., 2012; www.super-resolution.de). Only fluorescence spots with more than 1000 photons were analyzed (10 nm /pixel sub-pixel binning). Data were processed with ImageJ (1.440, NIH), AZ area and Brp localizations per AZ were analyzed as previously described Ehmann et al. (2014). AZs were assigned to single boutons using the α-HRP signal. For Syt1 quantification (Figure 2) we determined localization counts in single type Ib boutons that were defined according to the α-HRP signal. Localization densities were analyzed only in boutons with areas <10 μm.
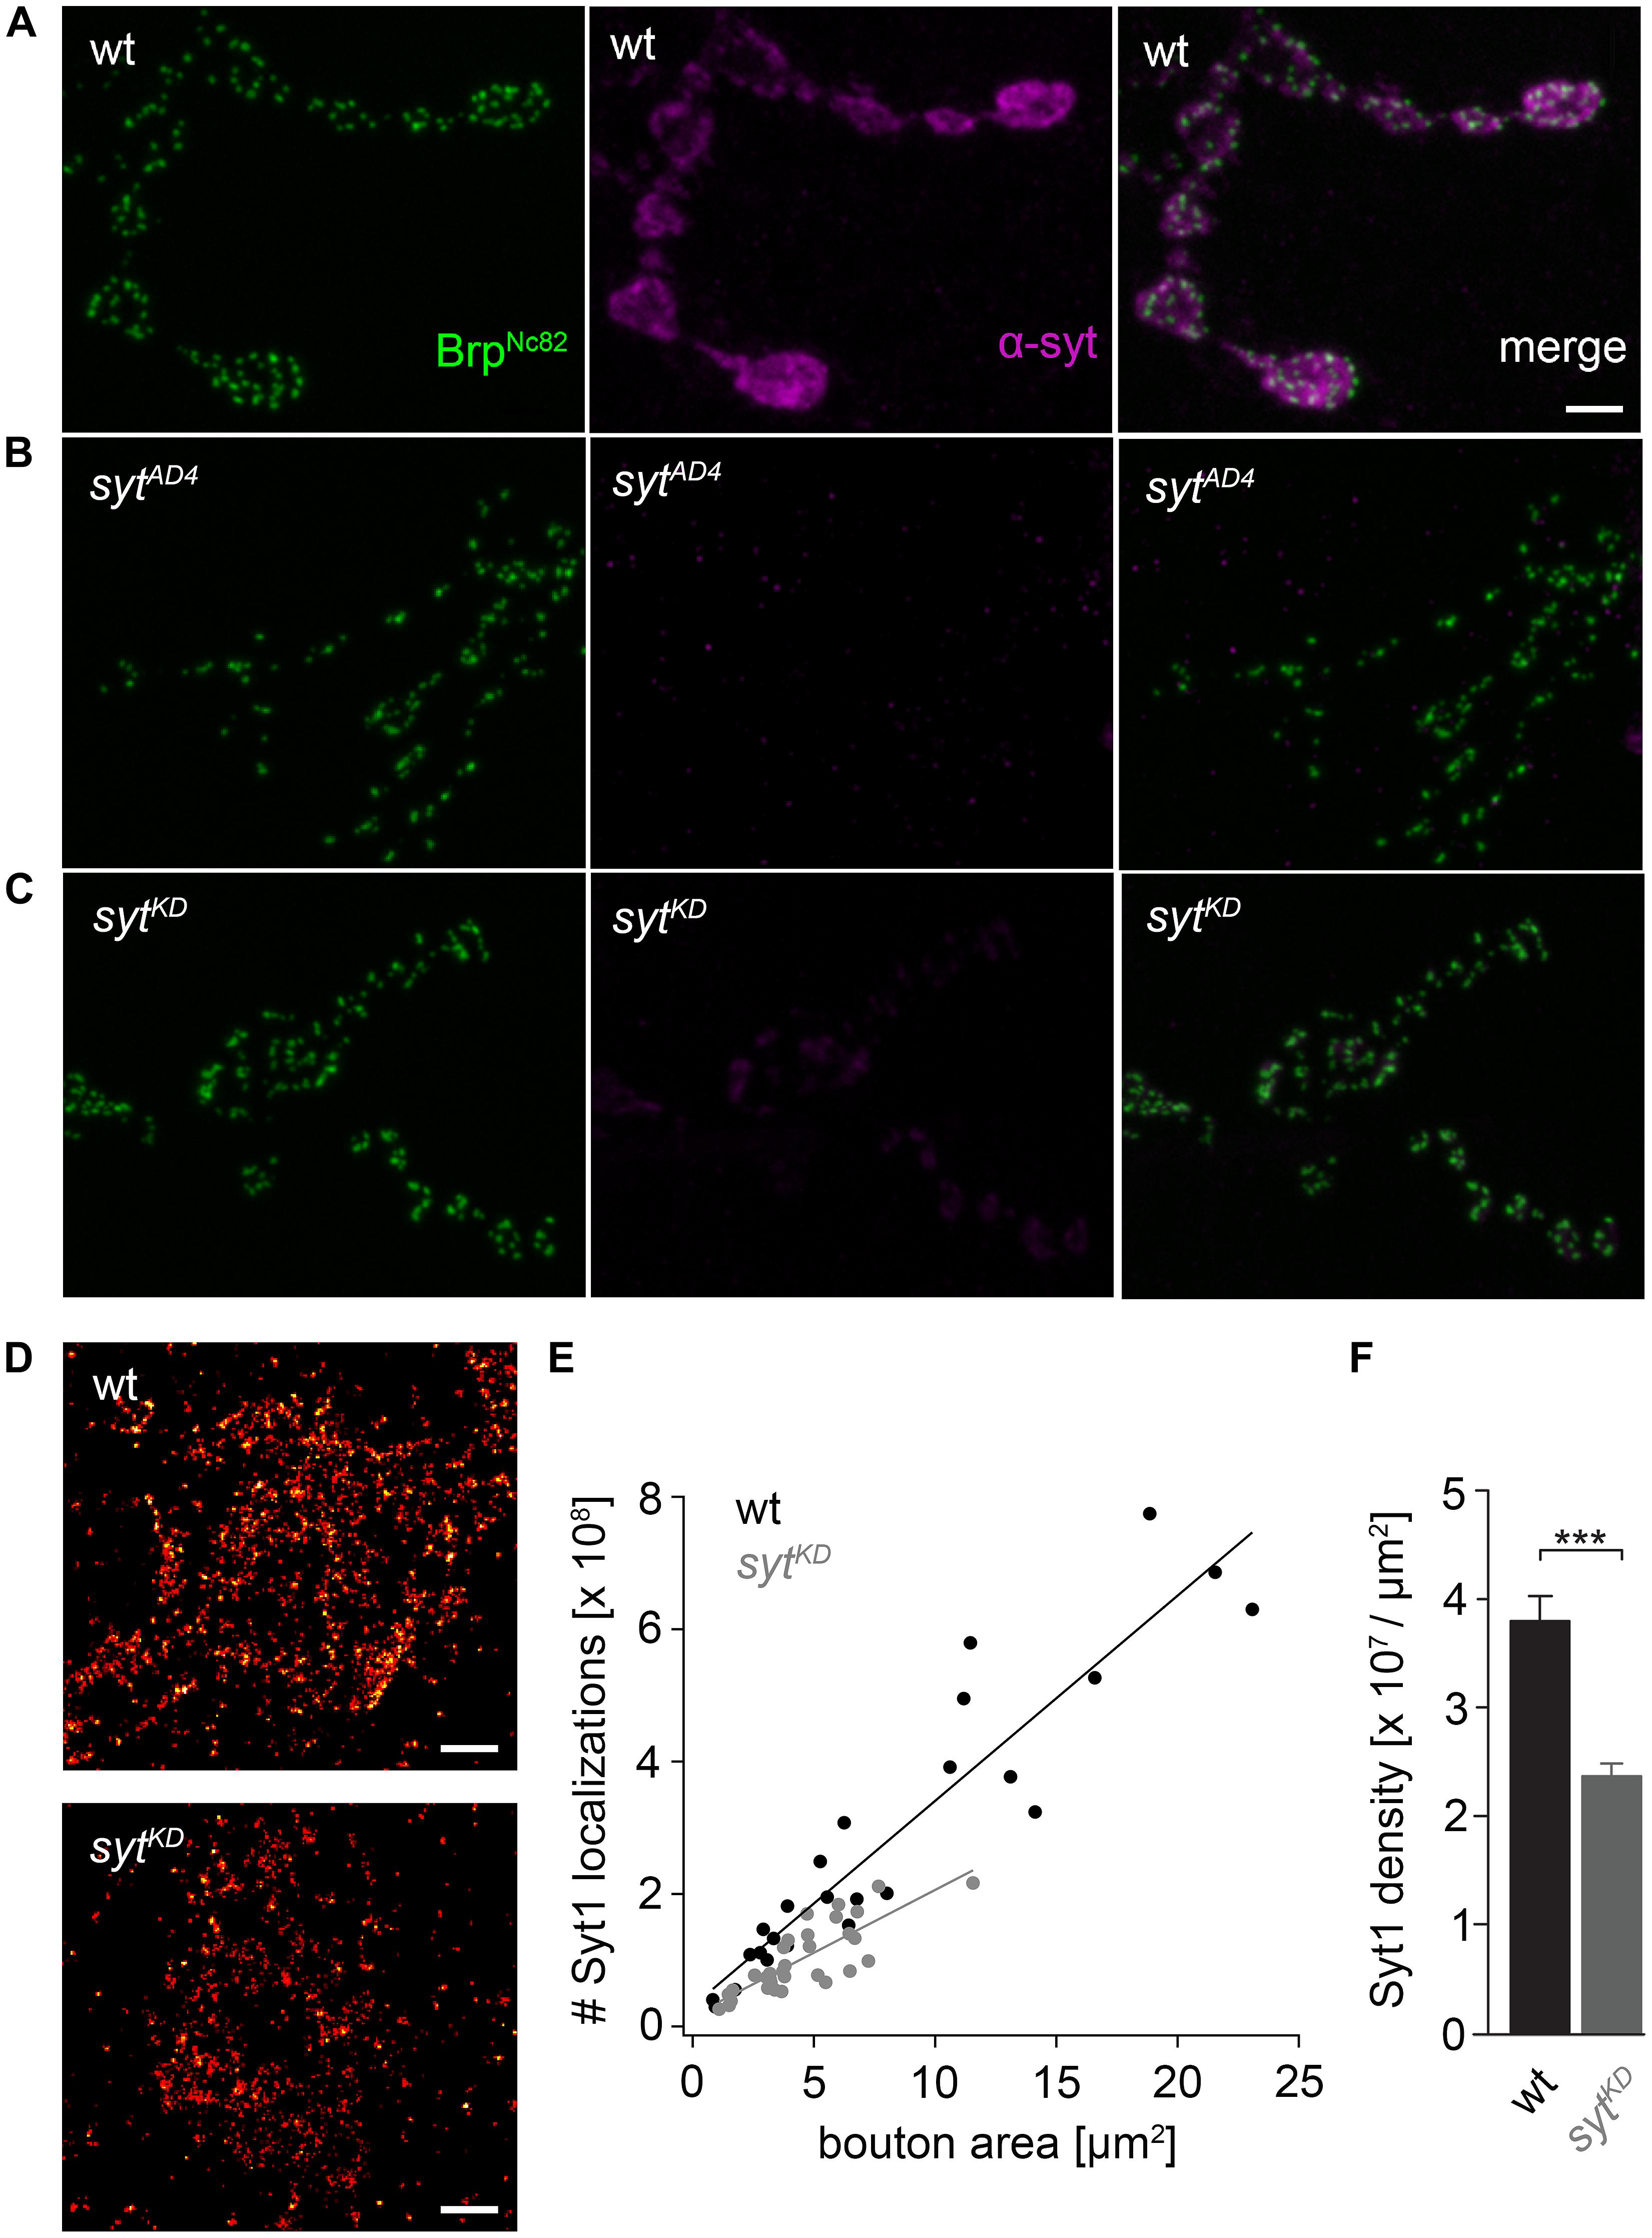
FIGURE 2. Ribonucleic acid interference decreases presynaptic Syt protein levels. (A) Drosophila wt NMJ on larval abdominal muscles 6/7 stained with antibodies against Brp (BrpNc82, green) and Synaptotagmin (α-Syt, magenta). Brp demarks individual AZs, whereas Syt labels synaptic vesicles predominately distributed around the bouton circumference. (B) The α-Syt signal is absent in Syt null mutans (sytAD4) and (C) strongly reduced after Syt knock-down (sytKD) through presynaptically (ok6-GAL4) driven RNA interference (UAS-syt1-RNAi8875). (D) dSTORM images of single presynaptic boutons stained against Syt1. (E) Number of single-fluorophore localization events by dSTORM. Syt1 localizations plotted against bouton area for wt (black) and sytKD (gray) with respective regression lines. Dots represent values for single boutons. (F) Summary bar graph indicates the decrease of Syt1 density in boutons of similar size (below 10 μm2) to 62.38% in sytKD compared to wt (p < 0.001). Scale bar = 2 μm (A–C) and 300 nm (D).
Statistical Analysis
Statistical analyses were performed with Sigma Plot 12 (Systat Software) using the non-parametric Mann–Whitney rank sum test. Linear fits for mean ± SEM Brp localizations per AZ (Figure 9) were made in Igor Pro (Wavemetrics) and statistical analysis was performed using the non-parametric Spearman correlation coefficient. Asterisks indicate the significance level (∗p < 0.05, ∗∗p < 0.01, ∗∗∗p < 0.001). Data are reported as mean ± SEM unless indicated otherwise and n denotes sample number.
Results
Synaptic Delay is Increased in brp69
We performed focal recordings using macropatch electrodes which allow simultaneous measurements of presynaptic action potentials (AP) and synaptic release (Dudel, 1965). EPSCs evoked by 0.2 Hz nerve stimulation were recorded at brp69 and wt larval NMJs on muscles 6/7 to measure half-duration of the positive AP deflection and synaptic delay (Figure 1A). Whereas AP wave form was unchanged in brp69 compared to wt, synaptic delay was significantly increased (2.27 ± 0.3 ms and 1.8 ± 0.3 ms mean ± SD, p = 0.0014, n = 14, and 13 for brp69 and wt, Figures 1B,C). As quantal time course is normal in brp69 (Kittel et al., 2006), the increase in release kinetics at brp69 synapses is likely due to alterations in presynaptic fusion mechanisms.
Impact of Syt on Different AZ States
We used wt, brp69 and rab3rup to define explicit AZ conditions: (i) normal organization, (ii) disorganized lacking Brp (Kittel et al., 2006), and (iii) large accumulation of Brp proteins (Graf et al., 2009; Ehmann et al., 2014), respectively. To determine the impact of the putative calcium sensor Syt on synchronous transmitter release in the context of different AZ states we combined these genotypes with sytKD. Protein levels of endogeneous Syt were decreased via RNAi (syt1-RNAi8875, see experimental procedures). By engaging the binary UAS-Gal4 expression system (Brand and Perrimon, 1993), syt1-RNAi was driven in larval glutamatergic motor neurons or panneuronally. To confirm that presynaptic Syt expression was reduced by this strategy, immunostainings of larval NMJs were performed using an antiserum against Syt1 (Mackler et al., 2002; Figure 2). Whereas presynaptic terminals of sytAD4 were completely devoid of Syt, there was residual though heavily reduced protein expression in sytKD compared to wt (Figure 2C). Furthermore, we quantified the protein reduction following Syt knock-down with dSTORM (Ehmann et al., 2014). Comparison of Syt1 localization numbers in boutons of similar size in wt and sytKD revealed a reduction to 62.38% in sytKD (Figures 2D–F). To address the functional consequences of sytKD at wt, brp69, and rab3rup synapses, postsynaptic currents in response to low-frequency nerve stimulation were recorded in two-electrode voltage clamp mode (TEVC) from larval ventral abdominal muscles 6/7 (Figure 3). Both panneuronal (Figure 3) and motoneuronal (data not shown) RNAi expression gave essentially comparable results. At wt synapses, sytKD decreased EPSC amplitude and lengthened rise time (amplitude: 30.0 ± 4.5 nA and 53.6 ± 4.7 nA, p = 0.002; rt: 1.3 ± 0.1 ms and 1.0 ± 0.03 ms, p < 0.001; n = 11 and 17 for sytKD and wt, Figure 3B) consistent with the role of Syt as a sensor for fast release (DiAntonio et al., 1993; Littleton et al., 1993). Similarly, at rab3rup synapses, sytKD reduced the amplitude and increased the delay of postsynaptic responses (amplitude: 19.5 ± 2.1 nA and 50.3 ± 5.3 nA, p < 0.001; delay: 1.7 ± 0.1 ms and 1.4 ± 0.04 ms, p = 0.013; n = 14 and 10 for rab3rup, sytKD, and rab3rup). Strikingly, sytKD at brp69 synapses left current amplitudes unchanged (35.1 ± 6.7 nA and 24.8 ± 3.3 nA, p > 0.05) and in fact accelerated EPSC rise time and delay (rt: 1.4 ± 0.1 ms and 2.2 ± 0.2 ms, p = 0.008; delay: 1.6 ± 0.03 ms and 1.9 ± 0.1 ms, p < 0.001; n = 12 and 11 for brp69, sytKD, and brp69). These results illustrate that Syt is necessary for efficient and rapid vesicle fusion at AZs with normal or increased Brp levels. In contrast, vesicle release from brp69 AZs appears less dependent on Syt. We did not find any changes in size or kinetics of quantal events in brp69 and brp69, sytKD that could explain these effects (amplitude: 0.89 ± 0.04 nA and 0.90 ± 0.04 nA; rt: 1.0 ± 0.06 ms and 1.0 ± 0.04 ms; tau: 6.02 ± 0.6 ms and 7.2 ± 0.4 ms; all p > 0.05; n = 10 and 14 for brp69 and brp69, sytKD, respectively). Thus, the changes in release kinetics following sytKD suggest that Syt protracts release at brp69 AZs.
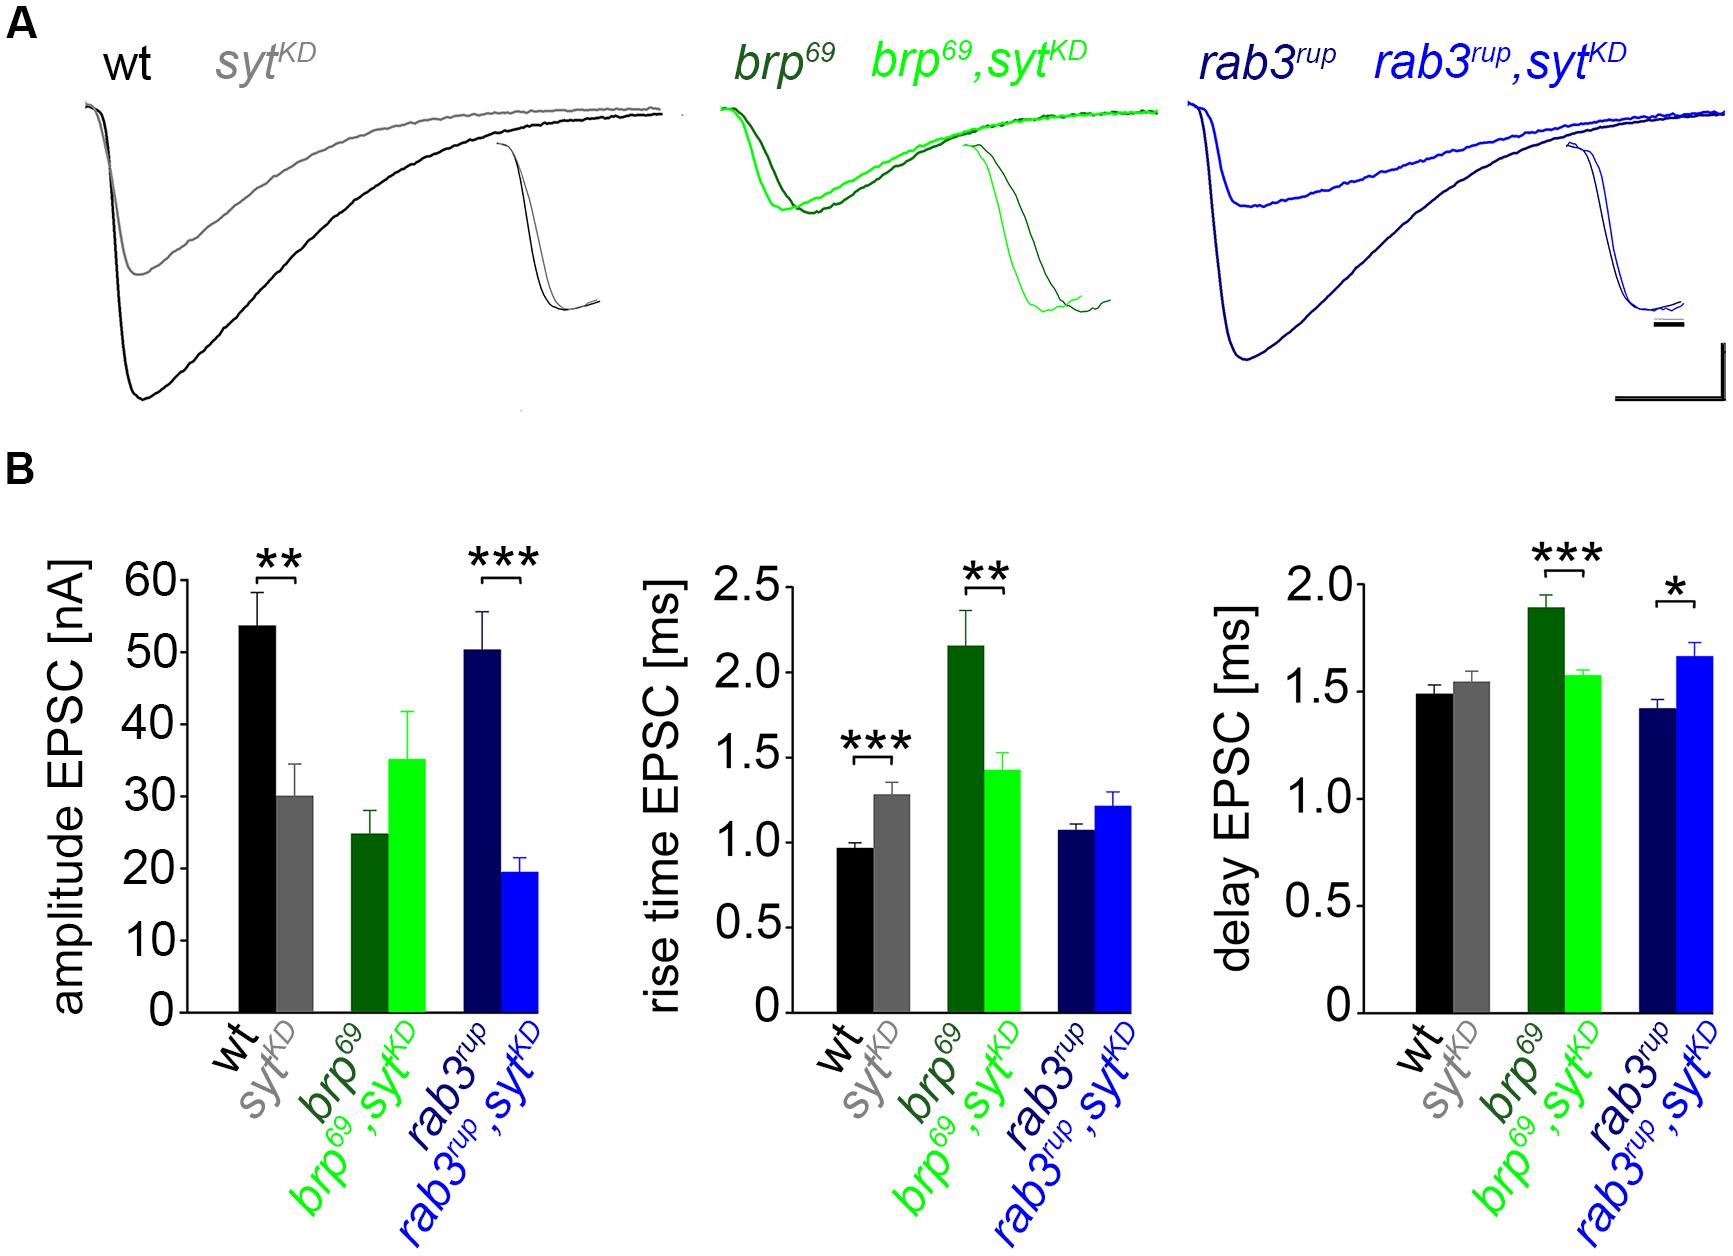
FIGURE 3. Effect of sytKD on amplitude and kinetics of the postsynaptic response. (A) Two-electrode voltage clamp recordings in physiological solution with 1.0 mM [Ca2+]Ex and 0.2 Hz nerve stimulation. Traces from wt (black), brp69 (dark green), and rab3rup (dark blue) are shown superimposed with recordings of the respective genotypes after sytKD (brighter shades). Insets show normalized events to highlight the differences in synaptic delay and postsynaptic current rise time. Scale bars = 5 ms, 10 nA (main traces), and 1 ms (insets). (B) Summary bar graphs for mean ± SEM amplitude, current rise time and synaptic delay for all six genotypes, color coded as in (A).
Reduced EGTA Sensitivity in brp69, sytKD
To further clarify how sytKD affects release we tested the influence of EGTA-AM in sytKD and brp69, sytKD in focal recordings (Figure 4, Kittel et al., 2006). Consistent with earlier work (Maximov and Südhof, 2005) release in sytKD was significantly reduced (0.37 ± 0.03 nA and 0.22 ± 0.03 nA, p = 0.002, n = 16 each), whereas the reduction was not significant in brp69, sytKD (0.28 ± 0.05 nA and 0.21 ± 0.03 nA, p > 0.05, n = 17, and 10 without and with EGTA). This is in contrast to the findings described in Kittel et al. (2006) for brp69 and suggests that Syt knock-down reduces coupling distance in brp69 and that Syt’s role in positional priming (Young and Neher, 2009) requires Brp.
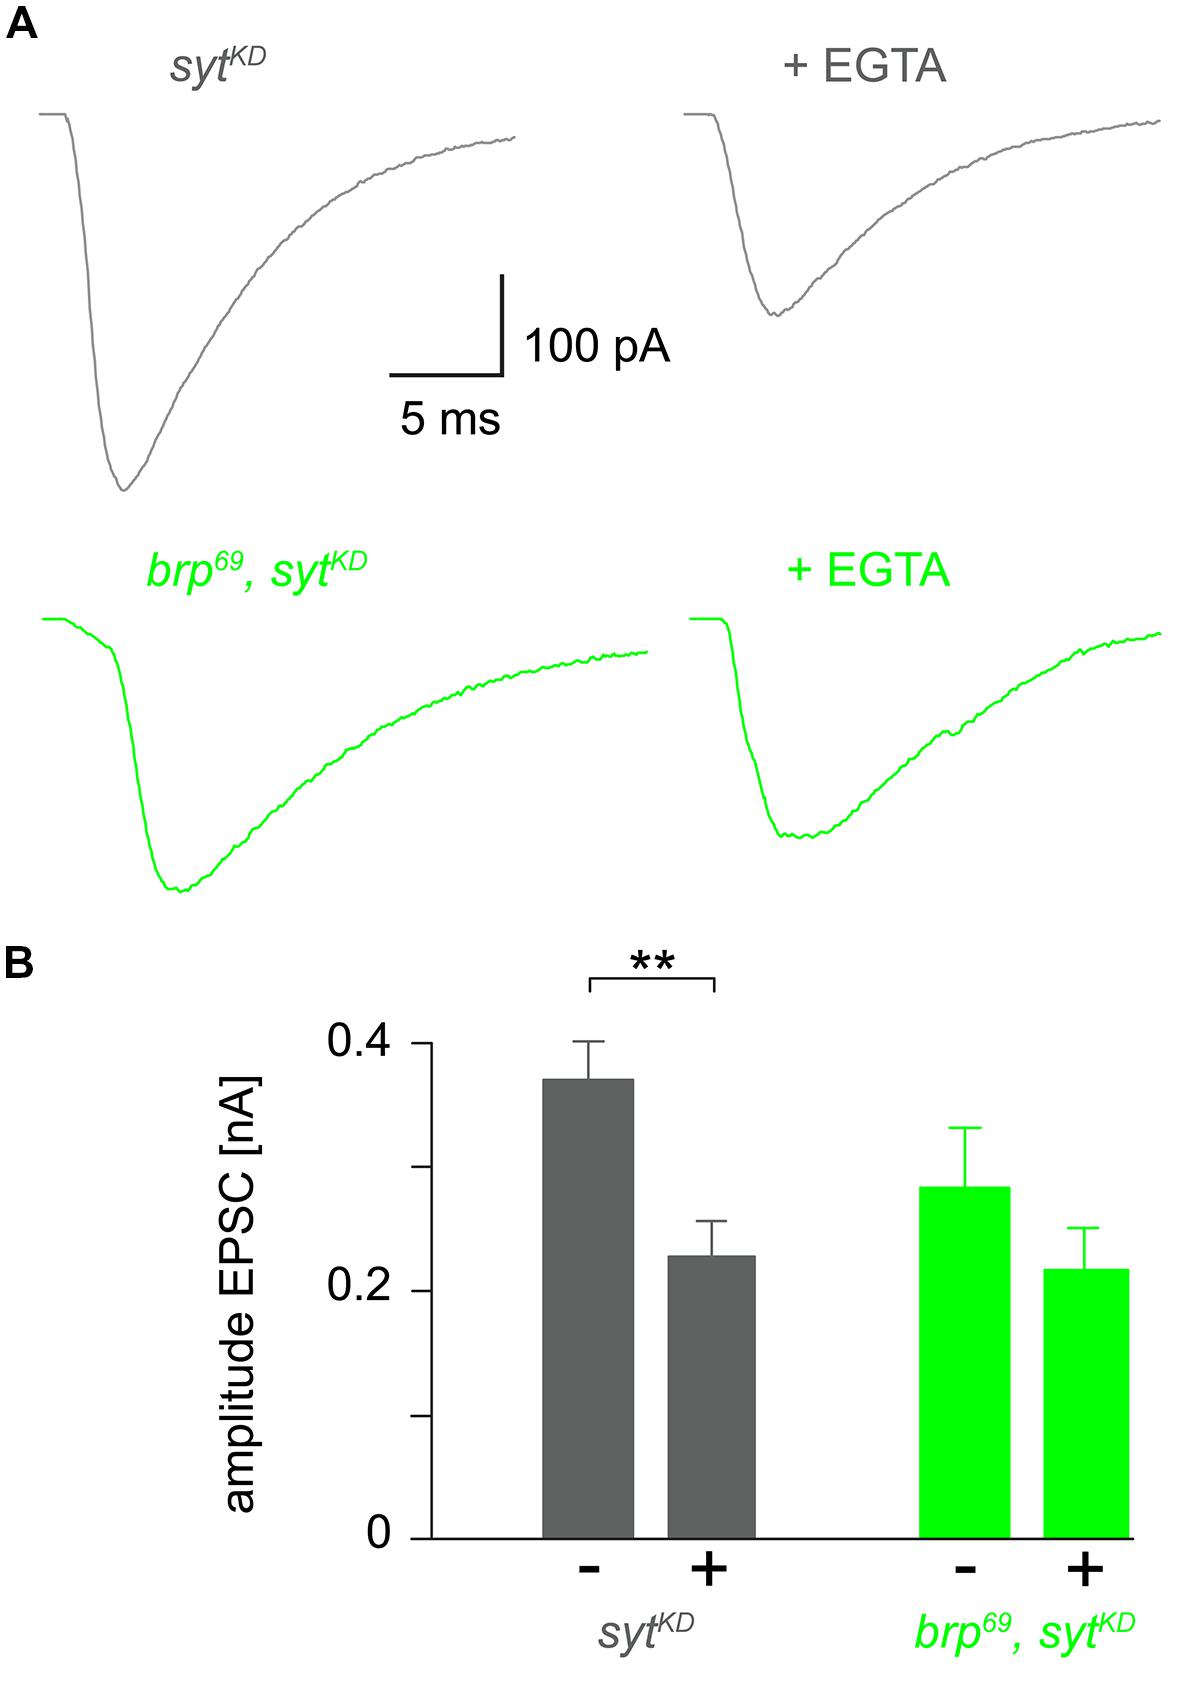
FIGURE 4. Reduced EGTA sensitivity in brp69, sytKD. (A) Focally recorded, averaged EPSCs from sytKD (gray) and brp69, sytKD (light green) NMJs under control conditions and after incubation with 100 μM EGTA-AM for 10 min (+EGTA). (B) Summary bar graph of EPSC amplitudes without (–) or with (+) EGTA-AM in both genotypes.
Brp is Distributed Unevenly at WT and rab3rup NMJs
The innervation of ventral abdominal muscles 6/7 is shared between two functionally distinct motoneurons in Drosophila larvae (Karunanithi et al., 2002): the MN6/7b-Ib (RP3) neuron gives rise to large type Ib boutons (Atwood et al., 1993), whereas the MNSNb/d-Is neuron forms smaller type Is boutons (Kurdyak et al., 1994; Lnenicka and Keshishian, 2000; Hoang and Chiba, 2001). We performed immunostainings and counted the number of Brp puncta per bouton as an estimate of the number of AZs. In addition, staining against horseradish-peroxidase (HRP) was used to measure dimensions of presynaptic arborizations (Jan and Jan, 1982; Figure 5). We found an uneven Brp distribution in wt type Ib motoneurons with more Brp positive AZs in distal than in proximal boutons (16.5 ± 0.8, 9.8 ± 0.7, 9.6 ± 0.8, p < 0.001, n = 115 (1), 70 (2), 70 (3), Figure 5B). In addition, distal type Ib boutons were largest along the bouton chain (10.6 ± 0.5 μm2, 6.9 ± 0.5 μm2, 6.5 ± 0.5 μm2, p < 0.001). Interestingly, this gradient was not found in type Is boutons regarding both AZ number [5.5 ± 0.4, 5.5 ± 0.3, 4.6 ± 0.3, p > 0.05, n = 73 (1), 73 (2), 73 (3)] and bouton area (3.0 ± 0.2 μm2, 3.1 ± 0.2 μm2, 3.3 ± 0.2 μm2, p > 0.05, Figure 5C). Our data are in line with previous work analyzing functional (Guerrero et al., 2005; Peled and Isacoff, 2011) and structural properties (Ehmann et al., 2014) of the NMJ. Furthermore, the number of AZs per bouton was decreased at rab3rup NMJs compared to wt (Figures 5D–F). This matches earlier work, showing that Rab3 controls the distribution of Brp at the NMJ with decreased AZ numbers per NMJ and increased Brp levels per AZ in rab3rup (Graf et al., 2009). However, the structural gradient regarding AZ number per bouton and bouton size was still present in rab3rup type Ib axons [Brp: 7.0 ± 0.3, 4.1 ± 0.3, 4.2 ± 0.3; area: 10.5 ± 0.5 μm2, 6.9 ± 0.5 μm2, 7.5 ± 0.5 μm2, p < 0.001, respectively, n = 117 (1), 57 (2), 57 (3), Figure 5E]. Thus, a structural gradient is present along the MN6/7b-Ib motor neuron with larger distal than proximal type Ib boutons. In addition, Brp is unevenly distributed in type Ib boutons of wt and rab3rup NMJs.
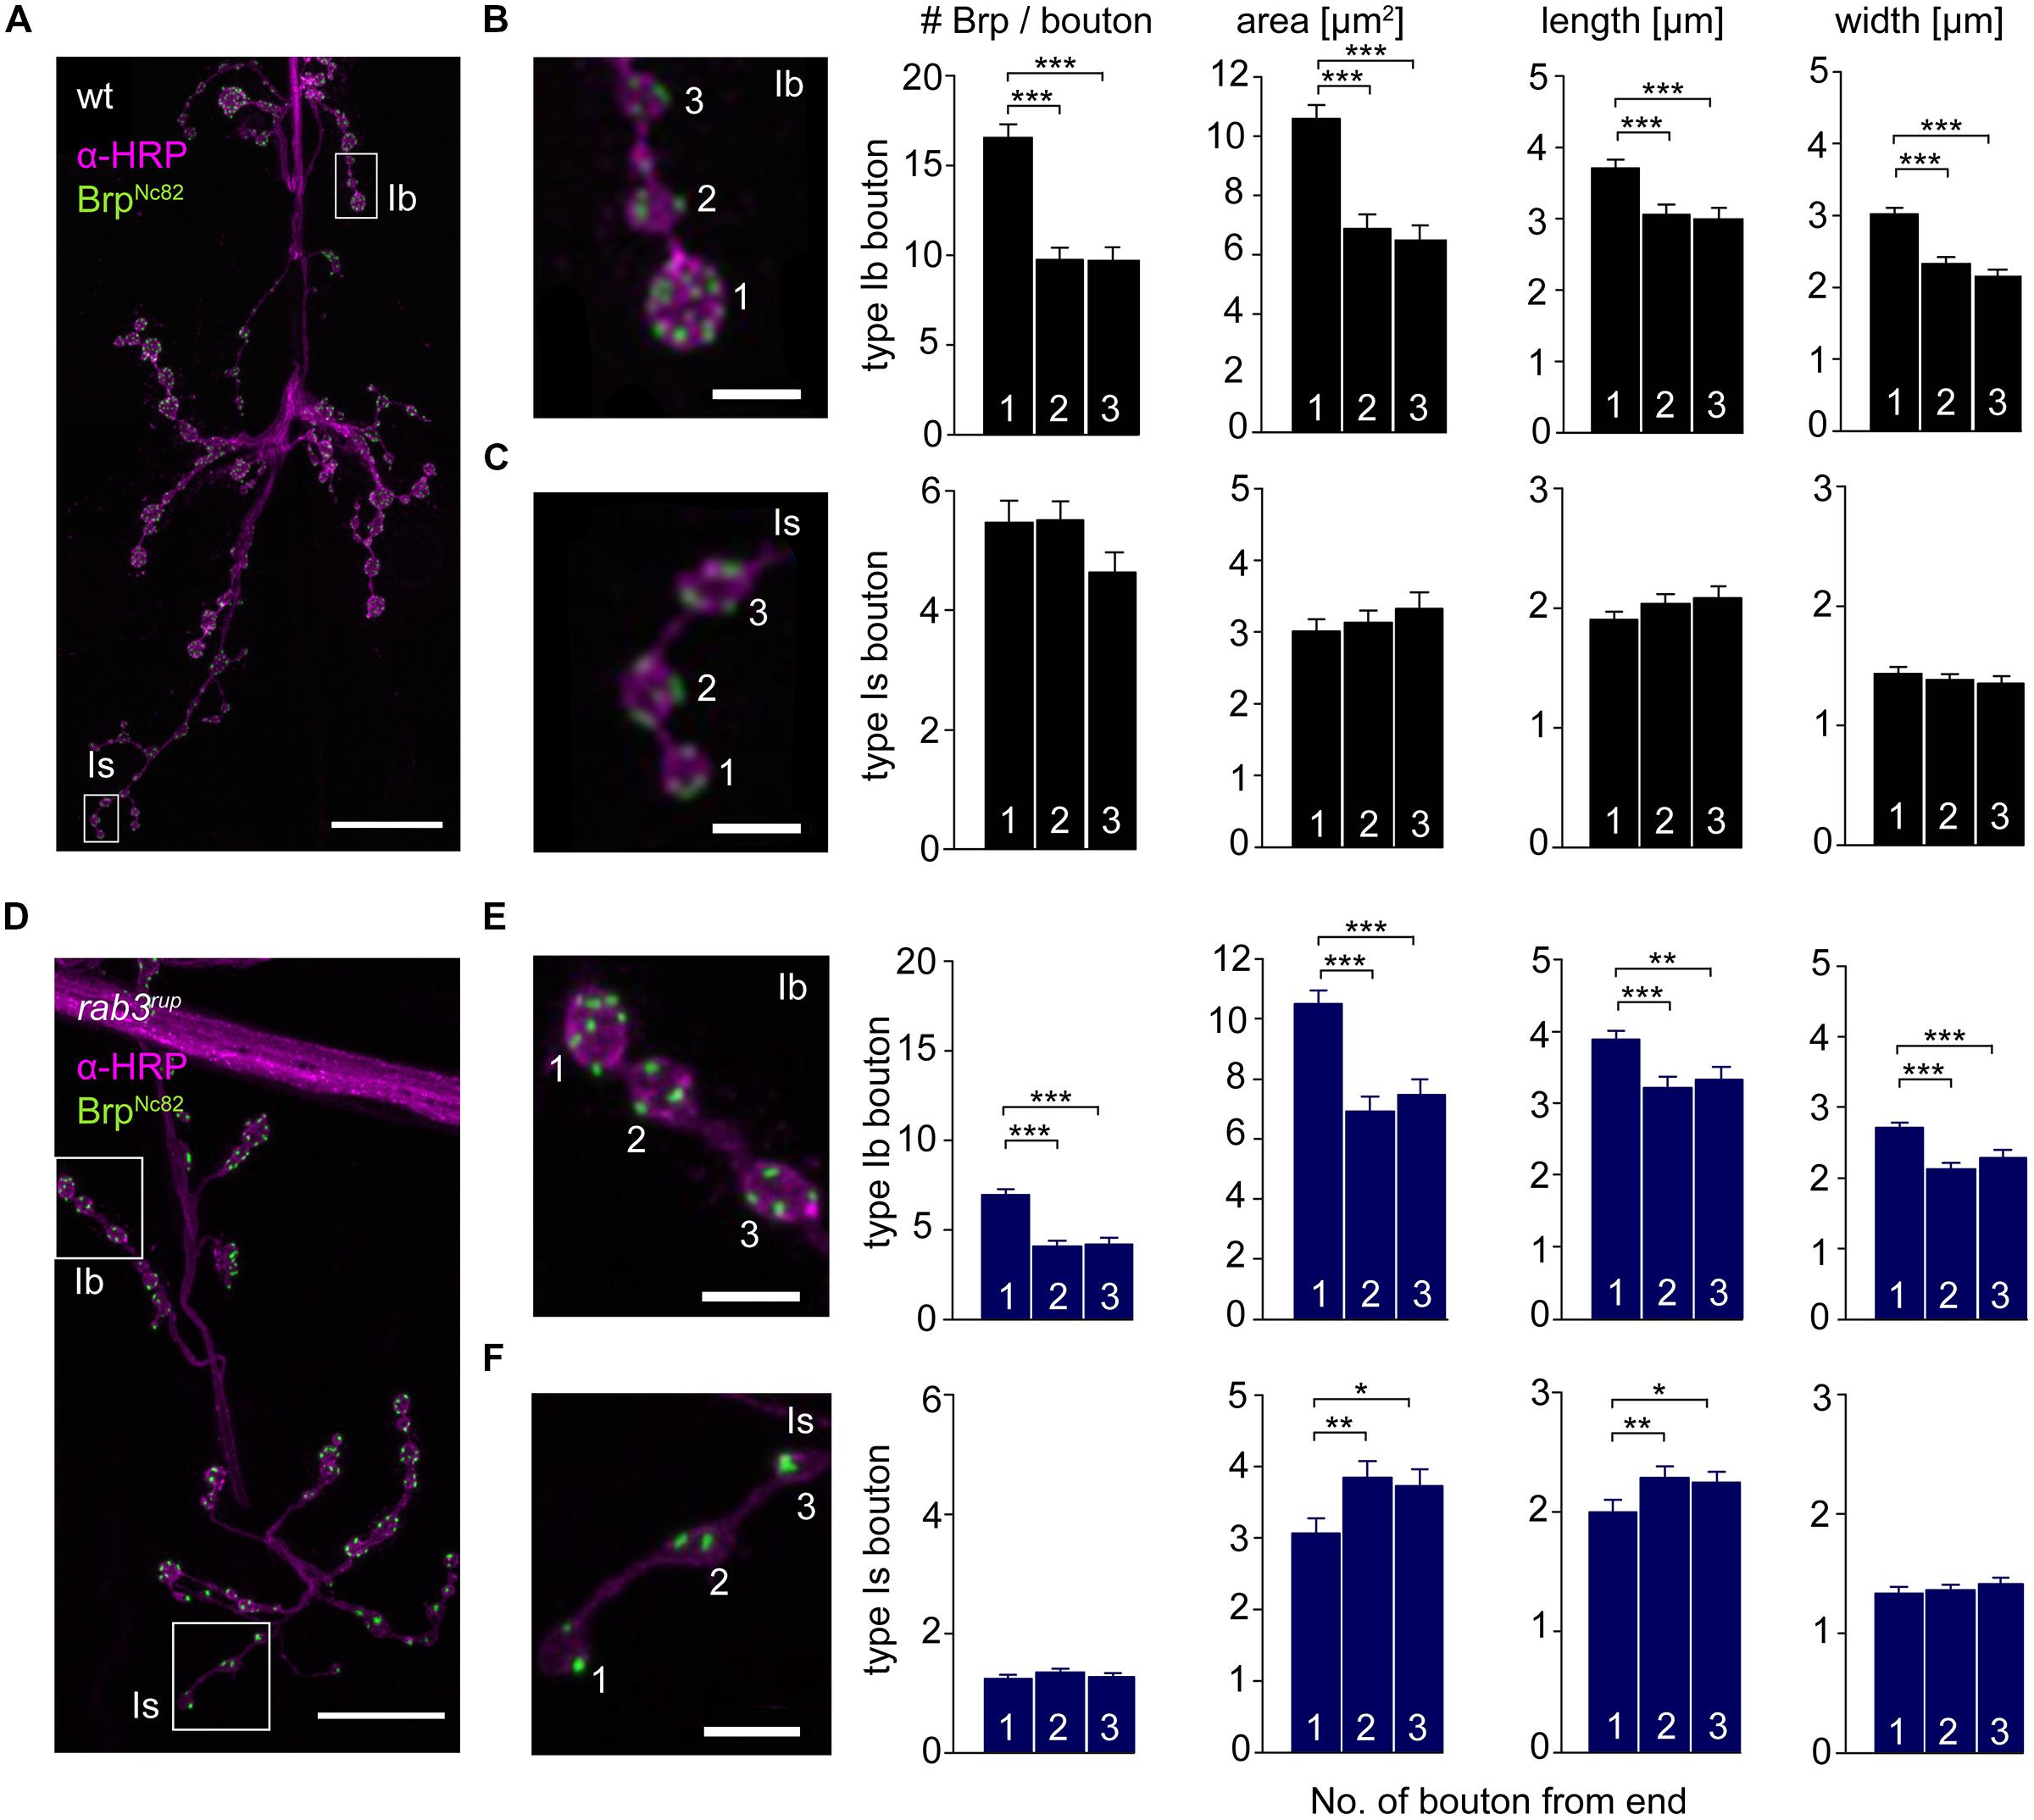
FIGURE 5. Type Ib and type Is bouton morphometry in wt and rab3rup. (A) Drosophila wt NMJ stained with α-HRP against neuronal membranes (magenta) and mAb BrpNc82 against Brp (green). White boxes indicate terminal three boutons of type Ib and type Is branches. (B,C) Magnification of boxed regions in (A). Summary bar graphs for the number of Brp puncta per bouton and bouton area, length and width of the terminal three boutons. (D) Drosophila rab3rup NMJ as in (A). Neurite passing by the NMJ at the top. (E,F) Magnification of boxed regions in (D) show the terminal three boutons of respective type Ib and type Is endings. Summary bar graphs for the number of Brp puncta per bouton and area, length and width of the terminal three boutons. Scale bars = 20 μm (A,D) and 5 μm (B,C,E,F).
Syt and Brp are Essential for Functional Presynaptic Differentiation
We used focal electrodes as these can be selectively placed on a subset of presynaptic boutons to improve spatial resolution of synaptic measurements. Boutons were visualized by GFP-expression (Pawlu et al., 2004) and postsynaptic currents of proximal and distal type Ib boutons were measured in response to low-frequency nerve stimulation in 0.5 mM [Ca2+]Ex (Figure 6). Distal boutons of wt NMJs showed larger EPSC amplitudes and shorter rise times than proximal boutons (amplitude: 1.4 ± 0.1 nA and 1.0 ± 0.1 nA, p = 0.005; rt: 1.1 ± 0.07 ms and 1.3 ± 0.07 ms, p = 0.032, n = 24, and 33, Figure 6B). In contrast, at both brp69 and sytKD NMJs amplitude and kinetics of postsynaptic currents were comparable in distal and proximal boutons (n = 10 and 11 for brp69 and 11 and 13 for sytKD, Figure 6B). These results reveal that Brp and Syt are both essential for the functional differentiation of the NMJ.
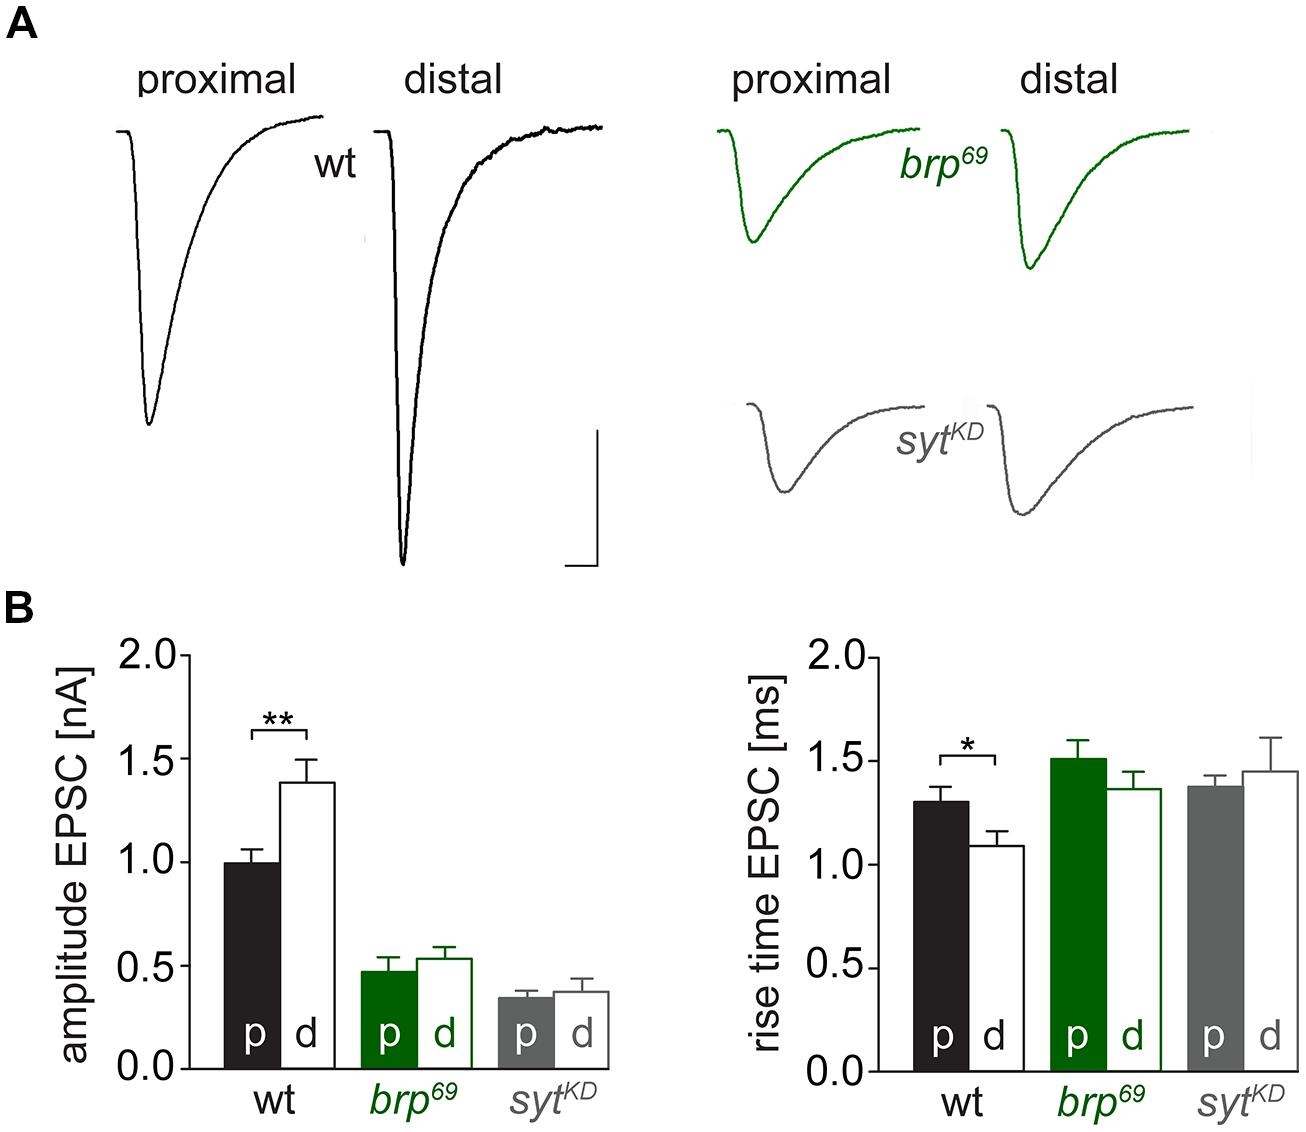
FIGURE 6. Functional differentiation of proximal and distal type Ib boutons. (A) Averaged EPSCs elicited by 0.2 Hz nerve stimulation in physiological solution containing 0.5 mM [Ca2+]Ex and recorded focally from proximal and distal type Ib boutons in wt (black), brp69 (green) and sytKD (gray). Scale bars = 0.5 ms, 1 nA. (B) Summary bar graphs for EPSC amplitudes and current rise times (mean ± SEM) for the three genotypes with p, proximal and d, distal, color coded like in (A).
Syt and Brp Interact Genetically
To test for a genetic interaction between Brp and Syt we analyzed non-allelic non-complementation (Yook et al., 2001). This genetic strategy tests for the ability of two recessive mutations to complement one another for a specific phenotype. We studied heterozygous animals carrying either one copy of the syt null allele SytAD4 (DiAntonio et al., 1993) or the brp null allele brp69 (Kittel et al., 2006) and trans-heterozygous animals carrying both. We analyzed the structural gradient along the MN6/7b-Ib motor axon regarding AZ number and bouton dimensions (Figure 7). Whereas in heterozygous animals distal boutons contained more Brp puncta than proximal boutons (p < 0.001, n = 95 (1), 72 (2), 72 (3) for sytAD4; p < 0.001, n = 51 (1), 40 (2), 40 (3) for brp69), this gradient was lost in trans-heterozygous animals (9.8 ± 0.5, 10.0 ± 0.4, 11.0 ± 0.5, p > 0.05, n = 81 (1), 81 (2), 81 (3), Figure 7A). Interestingly, distal boutons of trans-heterozygous animals were still largest along the bouton chain (7.3 ± 0.4 μm2, 5.5 ± 0.3 μm2, 5.8 ± 0.3 μm2, p = 0.003 and 0.014 for (2) and (3), Figure 7B). We conclude that regarding AZ distribution both mutations fail to complement one another, suggesting a direct interaction of Brp and Syt or an action of the two proteins in the same functional pathway.
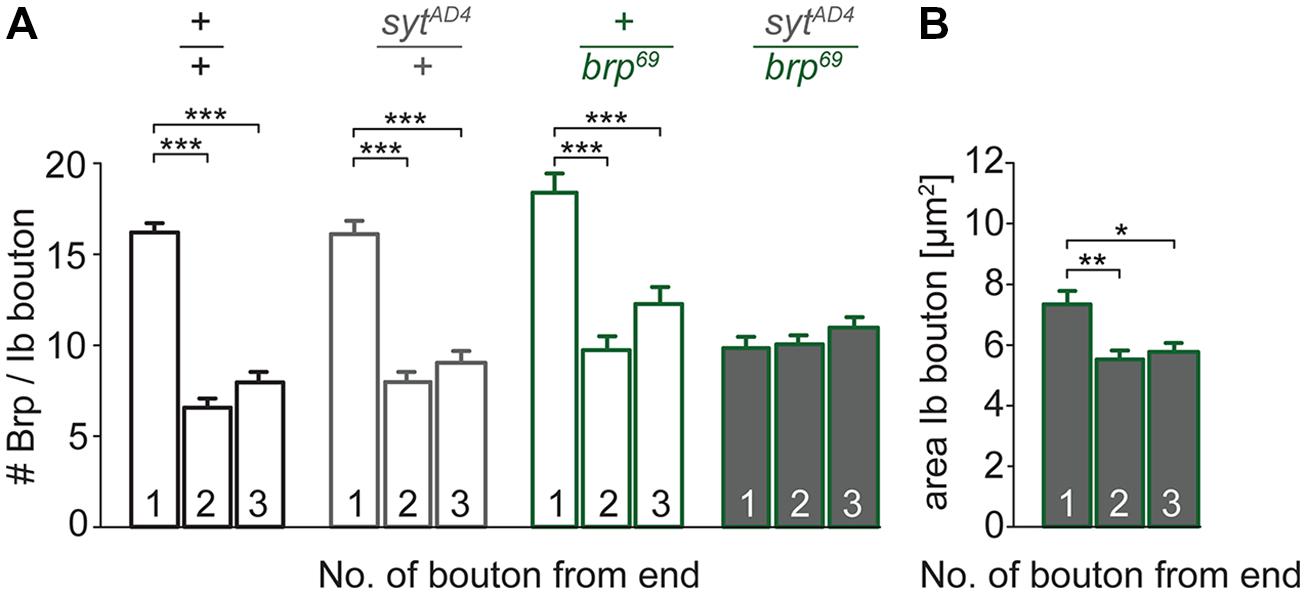
FIGURE 7. Genetic interaction between brp and syt. (A) Summary bar graphs for the number of Brp puncta per terminal three type Ib boutons of wt (+/+, black), heterozygous sytAD4 (sytAD4/+, gray), heterozygous brp69 (+/brp69, green) and trans-heterozygous sytAD4/brp69 larvae (gray with green edge). (B) Summary bar graph for the area of the three terminal type Ib boutons in sytAD4/brp69 trans-heterozygotes.
Syt Guides AZ Distribution
To further investigate the impact of Brp and Syt on maintaining the structural gradient we again performed immunostainings (Figure 8). At brp69 NMJs, bouton area, length, and width were larger for distal than for proximal type Ib boutons (data not shown). Analysis of sytKD NMJs showed profound alterations of synaptic morphology regarding Brp distribution and bouton size. Whereas the number of Brp positive AZs per NMJ was slightly decreased compared to wt (724 ± 38 and 861 ± 41, p = 0.019, n = 16 NMJs each), AZ numbers per Ib bouton were reduced to about a quarter. Furthermore, Brp was distributed homogeneously along the MN6/7b-Ib motor neuron and spatial dimensions of type Ib boutons were similar for all locations along the motoneuron [p > 0.05, n = 125 (1), 109 (2), 109 (3), Figures 8B,C]. Compared to wt, bouton size was reduced dramatically. In addition, analysis of the structural gradient in combined rab3rup, sytKD animals revealed that Syt knock-down also decreases the structural differentation at rab3rup NMJs (data not shown). These data demonstrate that Syt is essential for the structural differentation of the NMJ both in wt and rab3rup.
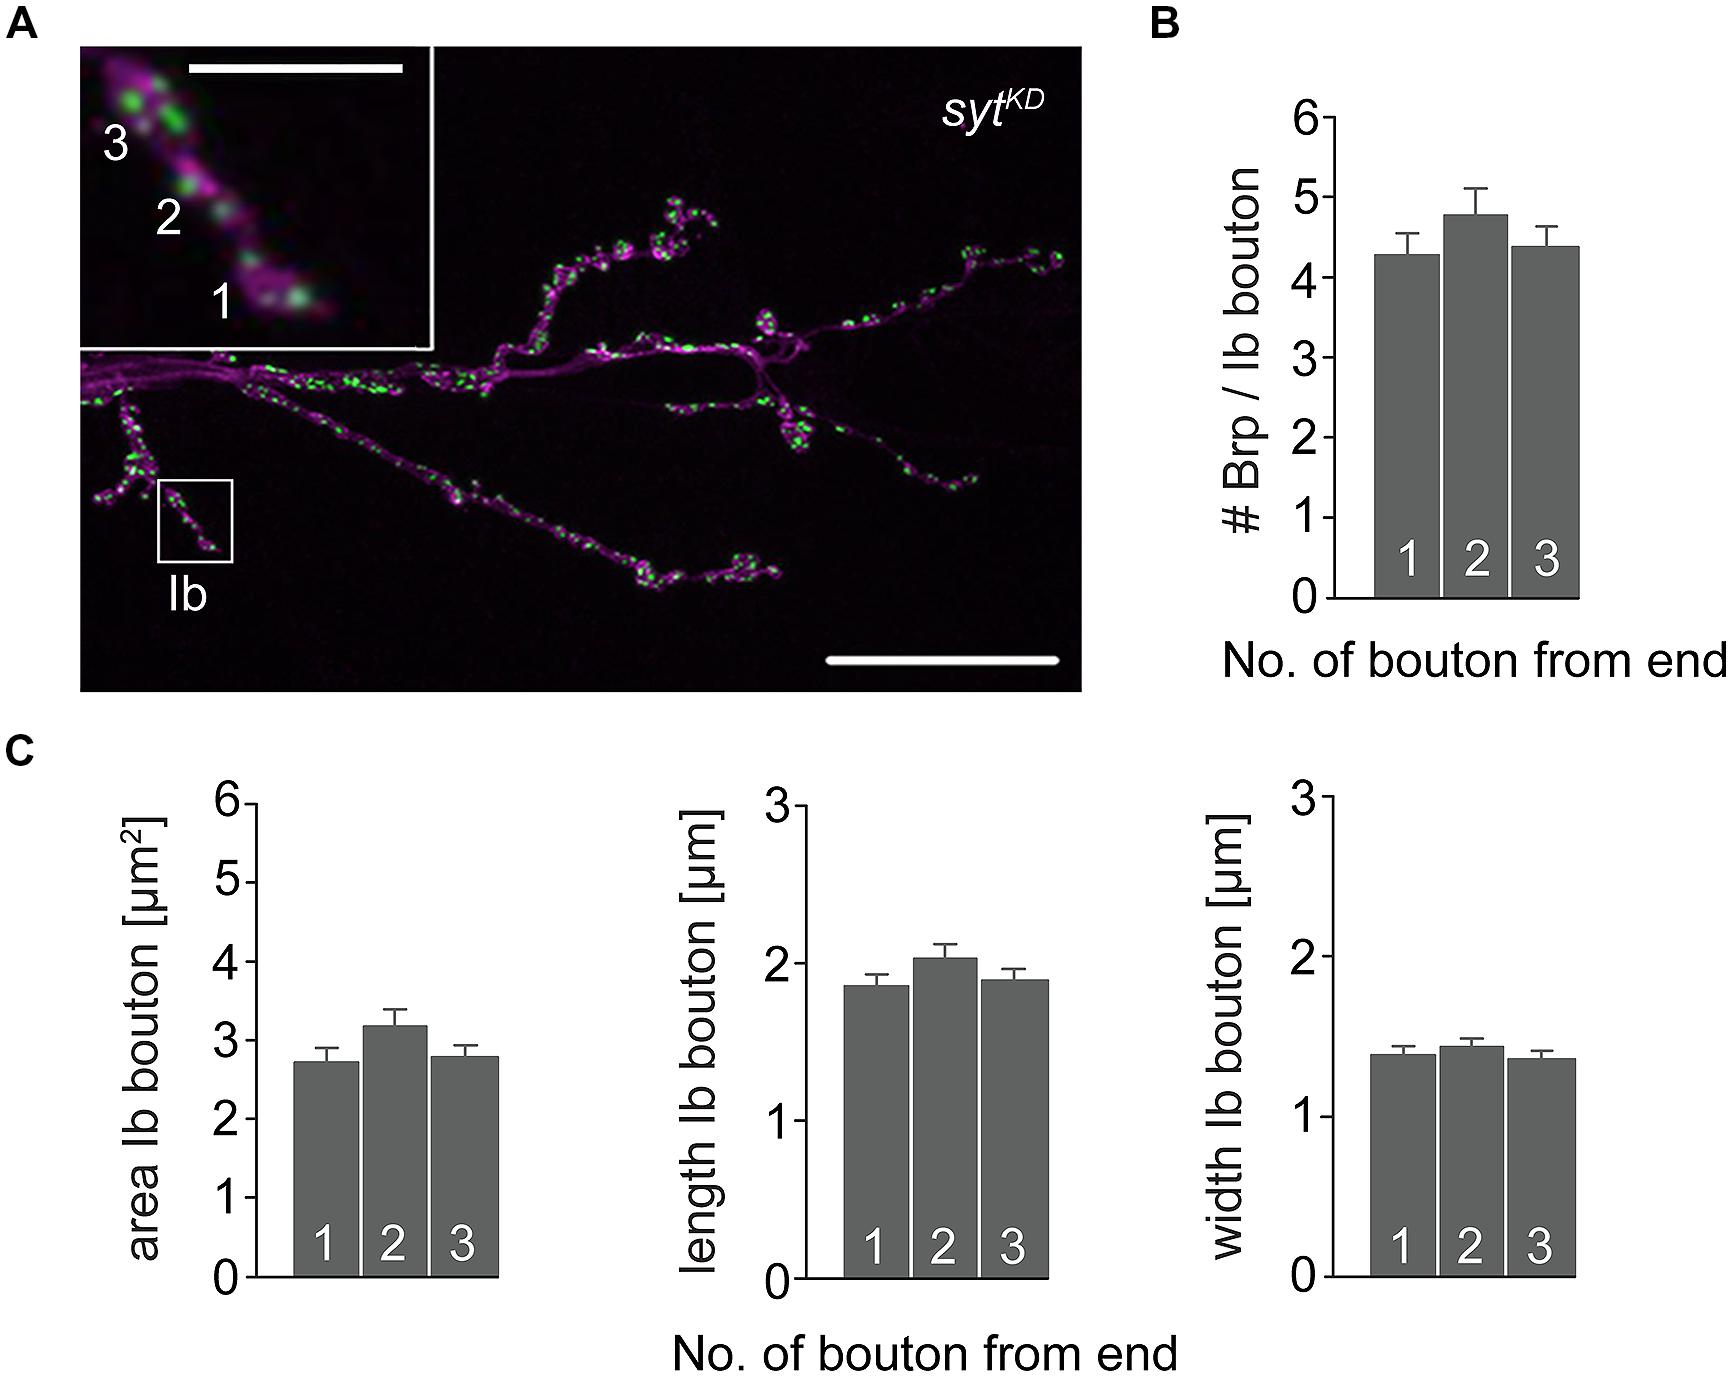
FIGURE 8. Type Ib bouton morphometry in sytKD. (A) sytKD NMJ stained with α-HRP against neuronal membranes (magenta) and mAb BrpNc82 (green). Higher magnification of type Ib ending (white box) showing the three terminal boutons. Scale bars = 20 μm, 2 μm (inset). (B) Summary bar graph for the number of Brp puncta per terminal three type Ib boutons in sytKD and (C) bouton area, length, and width.
Syt Influences Organization and Number of Brp Proteins at Individual AZs
In a final set of experiments we employed dSTORM to image glutamatergic boutons. This localization microscopy technique substantially increases spatial resolution compared to conventional fluorescence light microscopy (Heilemann et al., 2008; van de Linde et al., 2011) and can provide quantitative insight into the nanoscopic organization of presynaptic AZs (Sauer, 2013; Ehmann et al., 2014, 2015). dSTORM resolved the substructural arrangement of indiviudal Brp localizations into multiple clusters within single AZs, which correspond to diffraction-limited Brp puncta in confocal images. We analyzed AZs in the distal six type Ib boutons of MN6/7b-Ib motor neurons in wt and sytKD (Figure 9). Interestingly, sytKD AZs were larger than their wt counterparts (0.079 ± 0.003 μm2 and 0.069 ± 0.002 μm2, p = 0.003, n = 300, and 468 AZs, Figure 9D) and contained more localizations (710 ± 30 and 590 ± 19, p = 0.003, Figure 9E), which reflects an increased number of Brp protein copies (Ehmann et al., 2014). Furthermore, we observed that sytKD AZs contained a similar number of Brp localizations irrespective of bouton order (Figure 9F, Spearman correlation coefficient r = -0.169, p < 0.001 for wt and r = 0.014, p > 0.05 for sytKD indicates a moderate negative correlation for wt and no correlation for sytKD). Thus, Syt influences the arrangement of Brp at the AZ. Previous work showed that the number of Brp localizations per wt AZ is higher in distal than in proximal type Ib boutons (Ehmann et al., 2014). This is consistent with the electrophysiological and structural data presented here.
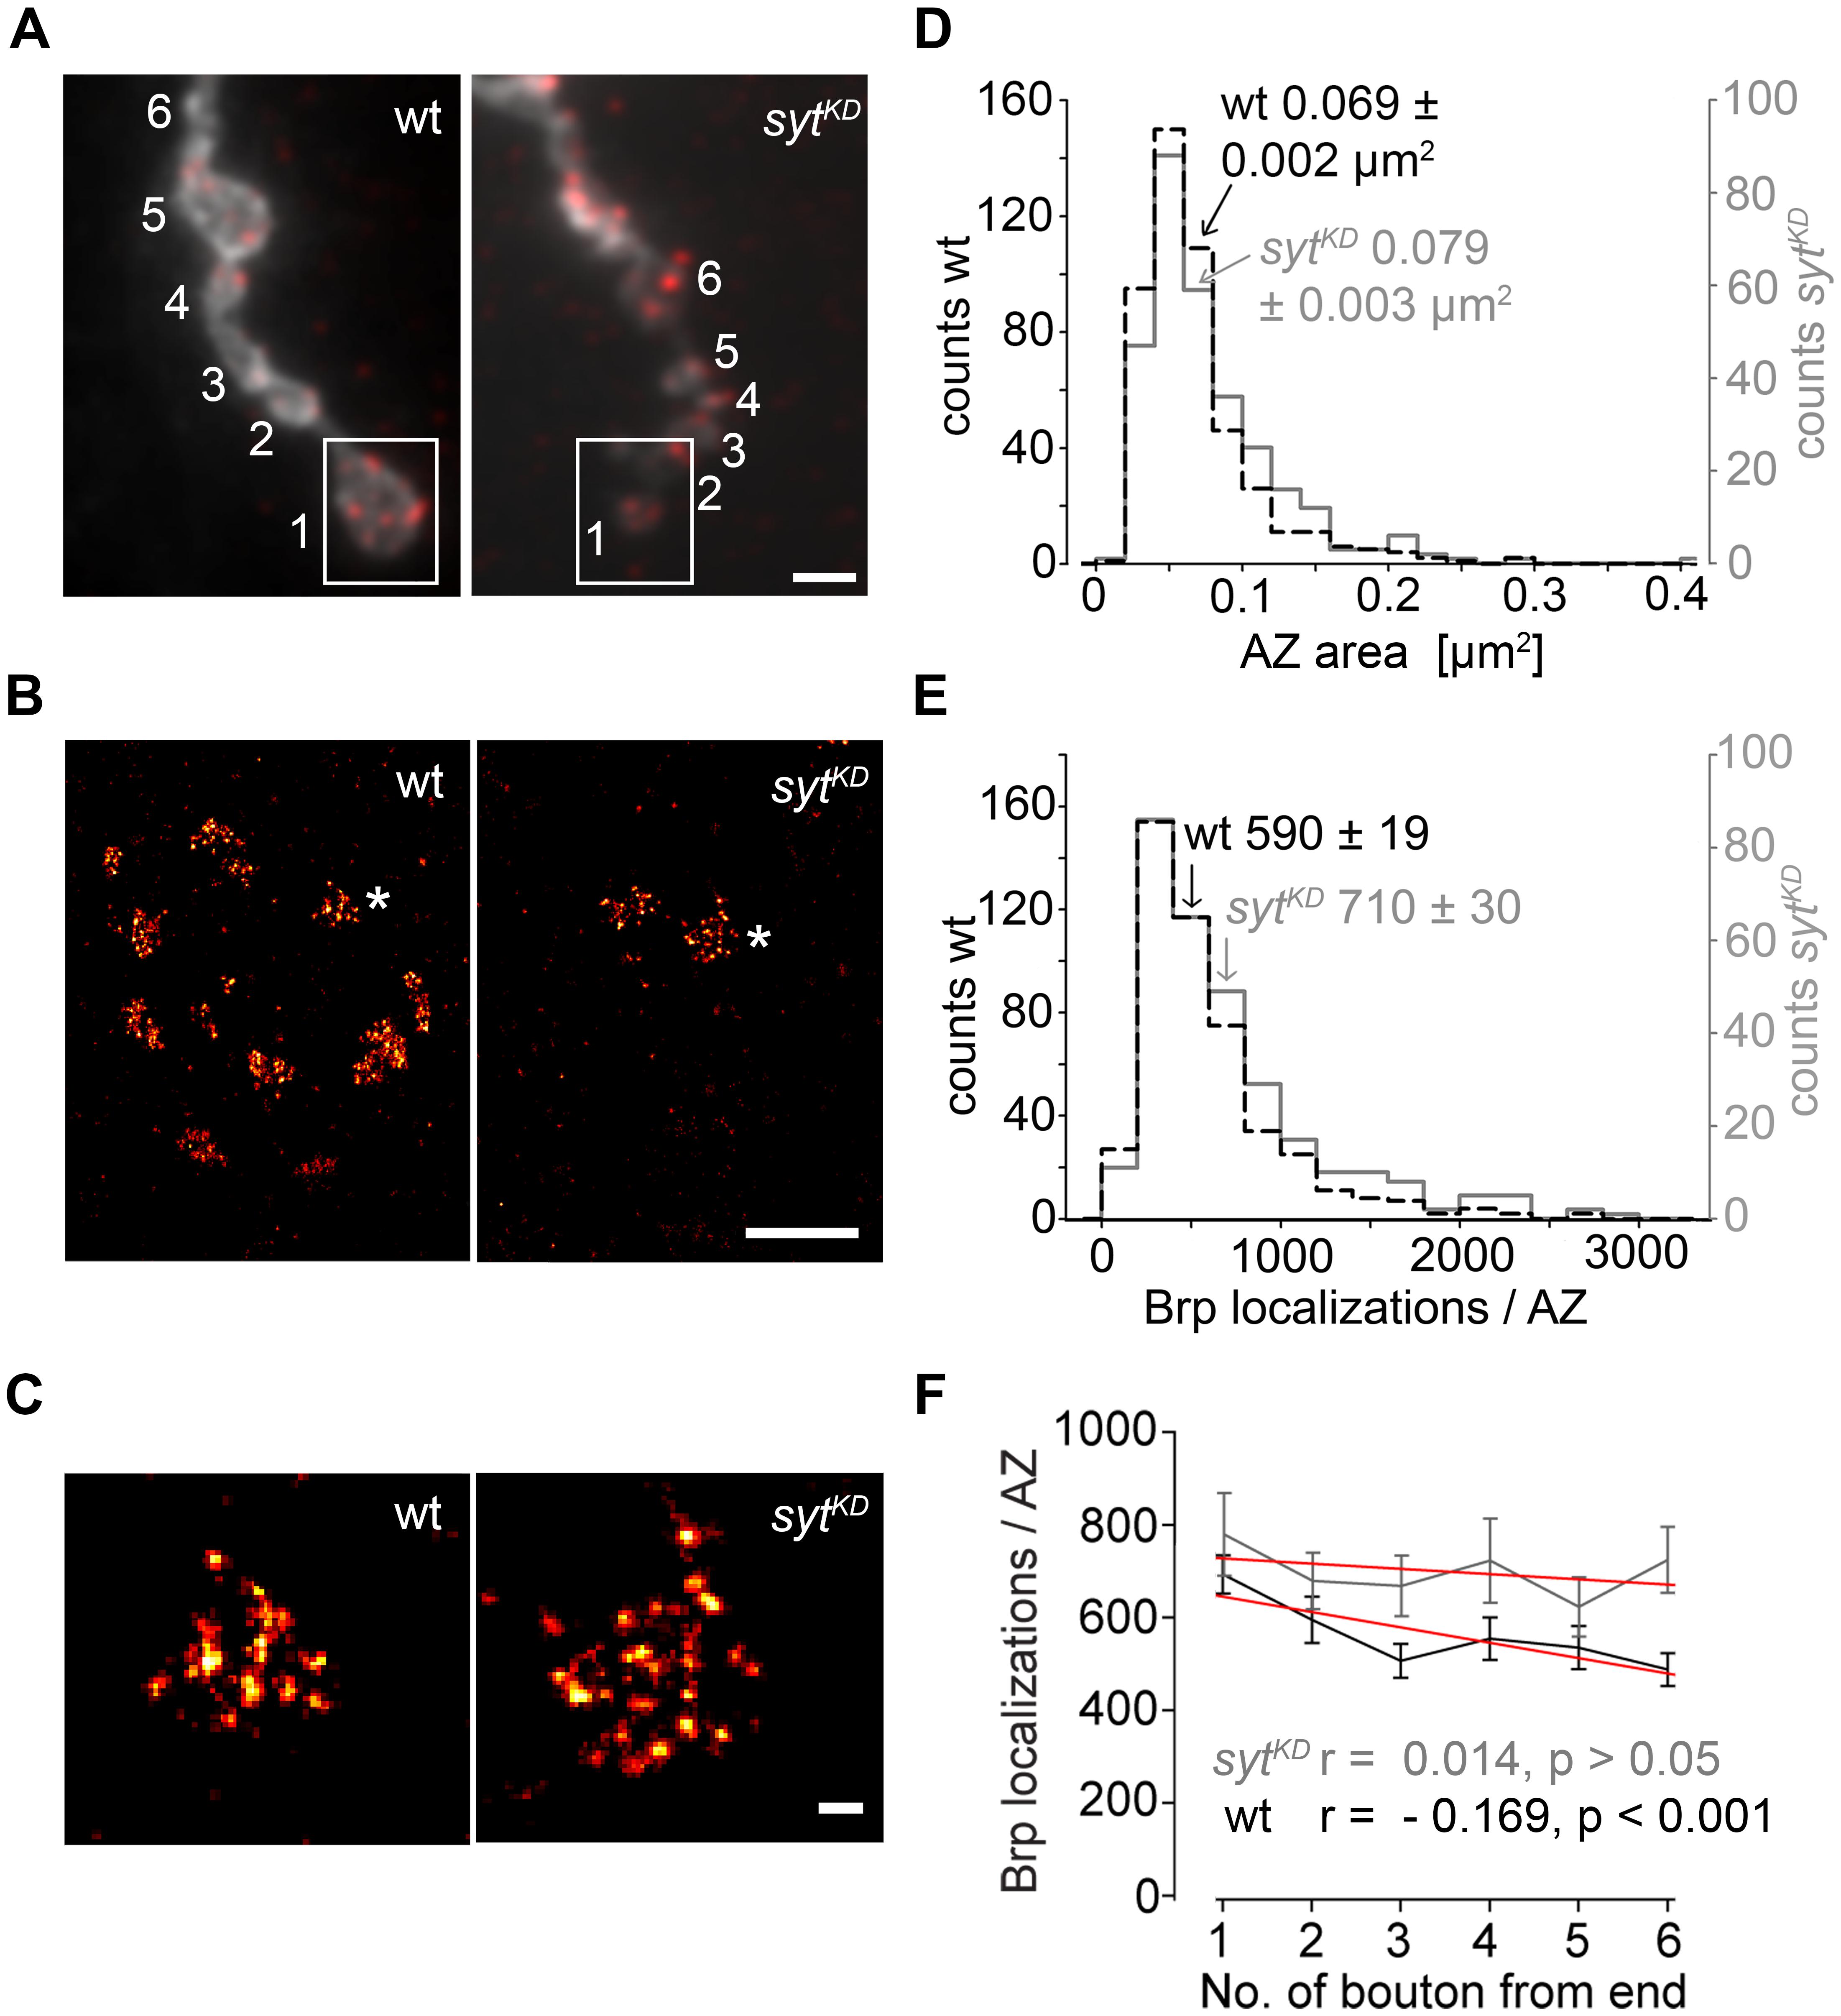
FIGURE 9. Super-resolution imaging of sytKD AZs. (A) Two-channel epifluorescence image displaying the terminal six type Ib boutons of wt and sytKD NMJs stained with α-HRP (gray) and mAb BrpNc82 (red). (B) dSTORM images of distal boutons (1, boxed region) show individual AZs defined by Brp. (C) Magnification of dSTORM images (asterisks in B) show that single AZs are composed of clustered Brp localizations. (D) Compared to wt (black), AZ areas and (E) distribution of Brp localizations per AZ are shifted to larger values in sytKD (gray). Arrows indicate respective mean ± SEM values. (F) Linear fits (red) of mean ± SEM Brp localizations per AZ in the terminal six type Ib boutons had slopes of –33.2 (wt) and –11.2 (sytKD) (non-parametric Spearman correlation coefficient wt: r = –0.169, p < 0.001; sytKD: r = 0.014, p > 0.05). Scale bars = 2 μm (A), 1 μm (B), 100 nm (C).
Discussion
While differentiation of presynaptic terminals was initially described more than 50 years ago and has since been studied extensively in various organisms, its mechanisms remain poorly understood (Katz, 1936; Hoyle and Wiersma, 1958; Reyes et al., 1998; reviewed in Atwood and Karunanithi, 2002). In view of the enormous complexity of the relevant molecular mechanisms (Südhof, 2012), the genetically and experimentally accessible NMJ of Drosophila melanogaster provides advantageous features for studying a glutamatergic synaptic system. Type Is- and Ib-boutons of the NMJ exhibit distinct functional properties (Kurdyak et al., 1994; Pawlu et al., 2004), show differences in vesicle size (Karunanithi et al., 2002) and in the amount of Brp molecules per AZ (Ehmann et al., 2014).
Here we show branch-specific differentiation in the MN6/7b-Ib motoneuron regarding structure and function. Distal type Ib boutons are larger than proximal ones, have more Brp positive AZs and show larger and faster postsynaptic responses (Figures 5 and 6). Consistent with these findings, AZs of distal type Ib boutons are larger and possess more Brp molecules per AZ (Ehmann et al., 2014). Presynaptic differentiation is impaired by disrupting either Brp or Syt function (Figures 6, 8, and 9). Postsynaptic responses of proximal and distal boutons in brp69 and sytKD are comparable and the structural gradient in bouton size, AZs per bouton and AZ size is absent in sytKD. Moreover, genetic evidence suggests that Brp and Syt act in the same functional pathway to mediate structural heterogeneity (Figure 7). Structural and functional presynaptic differentiation thus clearly requires the concerted action of Brp and Syt.
Interestingly, we obtained consistently lower values for AZ size and Brp counts per AZ than a recent previous investigation using dSTORM (Ehmann et al., 2014). In the present study, we raised both mutant and control animals at 29°C to ensure efficient RNA-mediated sytKD (expression via the GAL4-UAS system is temperature-dependent), whereas Ehmann et al. (2014) raised larvae at 25°C. Since higher temperature accelerates the development of Drosophila, enlarges presynaptic arborizations and increases the number of AZs per NMJ (Ashburner, 1989; Sigrist et al., 2003), it is conceivable that temperature-dependent plasticity also affects molecular organization at the level of individual AZs.
The molecular mechanisms controlling size, structure and distribution of AZs are complex. Several years ago, the vesicle protein Rab3 was identified as an important regulatory factor of AZ size and distribution (Graf et al., 2009). Rab-proteins are key organizers of vesicle trafficking (Harris and Littleton, 2011). Measurements with genetically encoded postsynaptic calcium sensor showed comparable calcium signals in proximal and distal type Ib boutons at rab3rup NMJs (Peled and Isacoff, 2011). Here, we found a gradient in rab3rup animals in the number of Brp positive AZs along the MN6/7b-Ib motoneuron (Figure 5), unlike in sytKD (Figure 8). Whereas at rab3rup NMJs the overall number of AZs is reduced dramatically (Graf et al., 2009), this reduction is moderate at sytKD NMJs (724 ± 38 and 861 ± 41, see Results). However, at both rab3rup and sytKD type Ib branches, the number of Brp proteins per AZ is increased strongly and moderately, respectively (Ehmann et al., 2014; Figure 9). In contrast to rab3rup synapses, sytKD decreases bouton size. Smaller boutons were reported for sytAD4 and linked to defects in endocytosis (Dickman et al., 2006). We found that brp and syt interact genetically regarding AZ number per bouton, but not area of boutons (Figure 7), which suggests that the effects of Syt on bouton size and AZ-differentiation are not strictly linked.
The pronounced presynaptic structural alterations after sytKD are puzzling. Syt is one of the best-studied synaptic proteins. However, its function has mainly been discussed without considering AZ-differentiation. After sytKD, evoked release was reduced by a factor of 4–5 compared to wt in our focal recordings (Figure 6). However, the number of Brp spots in terminal boutons was also reduced by a factor of 4–5 after sytKD (Figure 8). Is release probability per AZ in distal boutons following sytKD therefore similar to wt? More work perhaps combining optical release sensors, focal recordings and subsequent immunostainings will be necessary to clarify this issue. The present study highlights how interpretations of synaptic function and differentiation profit from electrophysiological recording techniques with improved spatial resolution (focal vs. TEVC). Functional sampling of synaptic subsets appears absolutely necessary when considering the significant differentiation at the structural level. Either way, linking structure and function at one and the same AZ is fundamentally important for a comprehensive mechanistic interpretation (Bailey and Chen, 1983; Wojtowicz et al., 1994).
Our electrophysiological data suggest that Syt protracts release at AZs lacking Brp. In this study, we used sytKD to reduce the protein level in presynpatic terminals (Figure 2). While we assume there are normally more than 10 Syt molecules on each vesicle in our preparation (Takamori et al., 2006), it is unclear whether sytKD leads to a reduction in the average number of Syt proteins per vesicle or a reduction in the number of Syt positive vesicles with those remaining possessing a full complement of Syt copies. This is relevant in the context of the molecular interpretation of our results. For example, ring-like oligomerization of Syt’s cytosolic C2-domains, which prevents release in the absence of calcium, requires a certain copy number (Wang et al., 2014). Furthermore, quantitative information on Syt’s partner molecules, such as Complexin and SNARE-proteins, will be required for a mechanistic interpretation down to the level of stochiometric interactions (Mohrmann et al., 2010; Cho et al., 2014). Imaging techniques such as dSTORM can be used to quantify the molecular organization of AZs (Sauer, 2013; Ehmann et al., 2015) and will be necessary to clarify the so far insufficiently understood kinetic release parameters. In this context, interpretations may well have to take into account the existence of alternative sensors (Walter et al., 2011).
Syt contributes to vesicle docking at the AZ, vesicle positioning within the AZ, clamping and triggering release from the AZ (Walter et al., 2011). While specific amino acids of Syt have been put in connection with certain subsets of these features (e.g., Young and Neher, 2009), it remains unclear which specific functional roles and molecular domains of Syt are responsible for interactions with Brp and structural synaptic specialization. Intriguingly, both Syt and Rab3 are involved in vesicle trafficking and participate in the structural differentiation of AZs. Our work supports the notion that organization of the synaptic vesicle cycle and AZ structure are causally linked.
Author Contributions
Mila M. Paul, Martin Pauli, Nadine Ehmann, Stefan Hallermann, Markus Sauer, and Manfred Heckmann performed experiments. Mila M. Paul, Stefan Hallermann, Robert J. Kittel, and Manfred Heckmann analyzed the data. Robert J. Kittel and Manfred Heckmann conceived the project and coordinated the study. Mila M. Paul, Robert J. Kittel, and Manfred Heckmann wrote the manuscript with assistance from all co-authors.
Conflict of Interest Statement
The authors declare that the research was conducted in the absence of any commercial or financial relationships that could be construed as a potential conflict of interest.
Acknowledgments
This work was supported by grants from the German Research Foundation (DFG) to Robert J. Kittel (KI 1460/1-1 and SFB 1047/A05), from the IZKF Würzburg to Manfred Heckmann (N229), a BMBF grant to Markus Sauer (133N12781) and a GSLS-fellowship from the University of Würzburg to Nadine Ehmann. The authors thank N. Reist for the α-Dsyt-CL1 antibody, D. Ljaschenko for support in the intitial phase of the study and F. Köhler, T. Martini, M. Oppmann, and C. Wirth for technical assistance.
References
Ashburner, M. (1989). Drosophila: A Laboratory Handbook. Cold Spring Harbor, NY: Cold Spring Harbor Laboratory Press.
Atwood, H. L., Govind, C. K., and Wu, C. F. (1993). Differential ultrastructure of synaptic terminals on ventral longitudinal abdominal muscles in Drosophila larvae. J. Neurobiol. 24, 1008–1024. doi: 10.1002/neu.480240803
Pubmed Abstract | Pubmed Full Text | CrossRef Full Text | Google Scholar
Atwood, H. L., and Karunanithi, S. (2002). Diversification of synaptic strength: presynaptic elements. Nat. Rev. Neurosci. 3, 497–516. doi: 10.1038/nrn876
Pubmed Abstract | Pubmed Full Text | CrossRef Full Text | Google Scholar
Bailey, C. H., and Chen, M. (1983). Morphological basis of long-term habituation and sensitization in Aplysia. Science 220, 91–93. doi: 10.1126/science.6828885
Barrett, E. F., and Stevens, C. F. (1972). The kinetics of transmitter release at the frog neuromuscular junction. J. Physiol. 227, 691–708. doi: 10.1113/jphysiol.1972.sp010054
Brand, A. H., and Perrimon, N. (1993). Targeted gene expression as a means of altering cell fates and generating dominant phenotypes. Development 118, 401–415.
Brose, N., Petrenko, A. G., Südhof, T. C., and Jahn, R. (2002). Synaptotagmin: a calcium sensor on the synaptic vesicle surface. Science 256, 1021–1025. doi: 10.1126/science.1589771
Cho, R. W., Kümmel, D., Li, F., Baguley, S. W., Coleman, J., and Rothman, J. E.et al. (2014). Genetic analysis of the Complexin trans-clamping model for cross-linking SNARE complexes in vivo. Proc. Natl. Acad. Sci. U.S.A. 111, 10317–10322. doi: 10.1073/pnas.1409311111
Pubmed Abstract | Pubmed Full Text | CrossRef Full Text | Google Scholar
Datyner, N. B., and Gage, P. W. (1980). Phasic secretion of acetylcholine at a mammalian neuromuscular junction. J. Physiol. 303, 299–314. doi: 10.1113/jphysiol.1980.sp013286
Pubmed Abstract | Pubmed Full Text | CrossRef Full Text | Google Scholar
DeBello, W. M., Betz, H., and Augustine, G. J. (1993). Synaptotagmin and neurotransmitter release. Cell 74, 947–950. doi: 10.1016/0092-8674(93)90716-4
DiAntonio, A., Parfitt, K. D., and Schwarz, T. L. (1993). Synaptic transmission persists in synaptotagmin mutants of Drosophila. Cell 73, 1281–1290. doi: 10.1016/0092-8674(93)90356-U
Dickman, D. K., Lu, Z., Meinertzhagen, I. A., and Schwarz, T. L. (2006). Altered synaptic development and active zone spacing in endocytosis mutants. Curr. Biol. 16, 591–598. doi: 10.1016/j.cub.2006.02.058
Pubmed Abstract | Pubmed Full Text | CrossRef Full Text | Google Scholar
Dudel, J. (1965). Potential changes in the crayfish motor nerve terminal during repetitive stimulation. Pflügers Arch. Gesamte Physiol. Menschen Tiere 282, 323–337. doi: 10.1007/BF00412507
Eggermann, E., Bucurenciu, I., Goswami, S. P., and Jonas, P. (2011). Nanodomain coupling between Ca2+ channels and sensors of exocytosis at fast mammalian synapses. Nat. Rev. Neurosci. 13, 7–21. doi: 10.1038/nrn3125
Pubmed Abstract | Pubmed Full Text | CrossRef Full Text | Google Scholar
Ehmann, N., Sauer, M., and Kittel, R. J. (2015). Super-resolution microscopy of the synaptic active zone. Front. Cell. Neurosci. 9:7. doi: 10.3389/fncel.2015.00007
Ehmann, N., van de Linde, S., Alon, A., Ljaschenko, D., Keung, X. Z., Holm, T.,et al. (2014). Quantitative super-resolution imaging of Bruchpilot distinguishes active zone states. Nat. Commun. 5, 4650. doi: 10.1038/ncomms5650
Pubmed Abstract | Pubmed Full Text | CrossRef Full Text | Google Scholar
Geppert, M., Goda, Y., Hammer, R. E., Li, C., Rosahl, T. W., Stevens, C. F.,et al. (1994). Synaptotagmin I: a major Ca2+ sensor for transmitter release at a central synapse. Cell 79, 717–727. doi: 10.1016/0092-8674(94)90556-8
Pubmed Abstract | Pubmed Full Text | CrossRef Full Text | Google Scholar
Graf, E. R., Daniels, R. W., Burgess, R. W., Schwarz, T. L., and DiAntonio, A. (2009). Rab3 dynamically controls protein composition at active zones. Neuron 64, 663–677. doi: 10.1016/j.neuron.2009.11.002
Pubmed Abstract | Pubmed Full Text | CrossRef Full Text | Google Scholar
Guerrero, G., Reiff, D. F., Agarwal, G., Ball, R. W., Borst, A., Goodman, C. S.,et al. (2005). Heterogeneity in synaptic transmission along a Drosophila larval motor axon. Nat. Neurosci. 8, 1188–1196. doi: 10.1038/nn1526
Pubmed Abstract | Pubmed Full Text | CrossRef Full Text | Google Scholar
Harris, K. P., and Littleton, J. T. (2011). Vesicle trafficking: a Rab family profile. Curr. Biol. 21, 841–843. doi: 10.1016/j.cub.2011.08.061
Pubmed Abstract | Pubmed Full Text | CrossRef Full Text | Google Scholar
Heilemann, M., van de Linde, S., Schüttpelz, M., Kasper, R., Seefeldt, B., Mukherjee, A.,et al. (2008). Subdiffraction-resolution fluorescence imaging with conventional fluorescent probes. Angew. Chem. Int. Ed. Engl. 47, 6172–6176. doi: 10.1002/anie.200802376
Pubmed Abstract | Pubmed Full Text | CrossRef Full Text | Google Scholar
Hoang, B., and Chiba, A. (2001). Single-cell analysis of Drosophila larval neuromuscular synapses. Dev. Biol. 229, 55–70. doi: 10.1006/dbio.2000.9983
Pubmed Abstract | Pubmed Full Text | CrossRef Full Text | Google Scholar
Hoyle, G., and Wiersma, C. A. (1958). Excitation at neuromuscular junctions in Crustacea. J. Physiol. 143, 403–425. doi: 10.1113/jphysiol.1958.sp006068
Jan, L. Y., and Jan, Y. N. (1982). Antibodies to horseradish peroxidase as specific neuronal markers in Drosophila and in grasshopper embryos. Proc. Natl. Acad. Sci. U.S.A. 79, 2700–2704. doi: 10.1073/pnas.79.8.2700
Pubmed Abstract | Pubmed Full Text | CrossRef Full Text | Google Scholar
Karunanithi, S., Marin, L., Wong, K., and Atwood, H. L. (2002). Quantal size and variation determined by vesicle size in normal and mutant Drosophila glutamatergic synapses. J. Neurosci. 22, 10267–10276.
Katz, B. (1936). Neuro-muscular transmission in crabs. J. Physiol. 87, 199–221. doi: 10.1113/jphysiol.1936.sp003401
Pubmed Abstract | Pubmed Full Text | CrossRef Full Text | Google Scholar
Kittel, R. J., Wichmann, C., Rasse, T. M., Fouquet, W., Schmidt, M., Schmid, A.,et al. (2006). Bruchpilot promotes active zone assembly, Ca2+ channel clustering, and vesicle release. Science 312, 1051–1054. doi: 10.1126/science.1126308
Pubmed Abstract | Pubmed Full Text | CrossRef Full Text | Google Scholar
Kurdyak, P., Atwood, H. L., Stewart, B. A., and Wu, C. F. (1994). Differential physiology and morphology of motor axons to ventral longitudinal muscles in larval Drosophila. J. Comp. Neurol. 350, 463–472. doi: 10.1002/cne.903500310
Pubmed Abstract | Pubmed Full Text | CrossRef Full Text | Google Scholar
Littleton, J. T., Stern, M., Schulze, K., Perin, M., and Bellen, H. J. (1993). Mutational analysis of Drosophila synaptotagmin demonstrates its essential role in Ca2+-activated neurotransmitter release. Cell 74, 1125–1134. doi: 10.1016/0092-8674(93)90733-7
Pubmed Abstract | Pubmed Full Text | CrossRef Full Text | Google Scholar
Lnenicka, G. A., and Keshishian, H. (2000). Identified motor terminals in Drosophila larvae show distinct differences in morphology and physiology. J. Neurobiol. 43, 186–197. doi: 10.1002/(SICI)1097-4695(200005)43:2<186::AID-NEU8>3.0.CO;2-N
Pubmed Abstract | Pubmed Full Text | CrossRef Full Text | Google Scholar
Mackler, J. M., Drummond, J. A., Loewen, C. A., Robinson, I. M., and Reist, N. E. (2002). The C2B Ca2+-binding motif of synaptotagmin is required for synaptic transmission in vivo. Nature 418, 340–344. doi: 10.1038/nature00846
Pubmed Abstract | Pubmed Full Text | CrossRef Full Text | Google Scholar
Matz, J., Gilyan, A., Kolar, A., McCarvill, T., and Krueger, S. R. (2010). Rapid structural alterations of the active zone lead to sustained changes in neurotransmitter release. Proc. Natl. Acad. Sci. U.S.A. 107, 8836–8841. doi: 10.1073/pnas.0906087107
Pubmed Abstract | Pubmed Full Text | CrossRef Full Text | Google Scholar
Maximov, A., and Südhof, T. C. (2005). Autonomous function of synaptotagmin 1 in triggering synchronous release independent of asynchronous release. Neuron 48, 547–554. doi: 10.1016/j.neuron.2005.09.006
Pubmed Abstract | Pubmed Full Text | CrossRef Full Text | Google Scholar
Mohrmann, R., de Wit, H., Verhage, M., Neher, E., and Sørensen, J. B. (2010). Fast vesicle fusion in living cells requires at least three SNARE complexes. Science 330, 502–505. doi: 10.1126/science.1193134
Pubmed Abstract | Pubmed Full Text | CrossRef Full Text | Google Scholar
Müller, M., Liu, K. S., Sigrist, S. J., and Davis, G. W. (2012). RIM controls homeostatic plasticity through modulation of the readily-releasable vesicle pool. J. Neurosci. 32, 16574–16585. doi: 10.1523/JNEUROSCI.0981-12.2012
Pubmed Abstract | Pubmed Full Text | CrossRef Full Text | Google Scholar
Neher, E. (1998). Vesicle pools and Ca2+ microdomains: new tools for understanding their roles in neurotransmitter release. Neuron 20, 389–399. doi: 10.1016/S0896-6273(00)80983-6
Pubmed Abstract | Pubmed Full Text | CrossRef Full Text | Google Scholar
Neher, E. (2010). What is rate-limiting during sustained synaptic activity: vesicle supply or the availability of release sites. Front. Synaptic Neurosci. 2:144. doi: 10.3389/fnsyn.2010.00144
Pubmed Abstract | Pubmed Full Text | CrossRef Full Text | Google Scholar
Pawlu, C., DiAntonio, A., and Heckmann, M. (2004). Postfusional control of quantal current shape. Neuron 42, 607–618. doi: 10.1016/S0896-6273(04)00269-7
Pubmed Abstract | Pubmed Full Text | CrossRef Full Text | Google Scholar
Peled, E. S., and Isacoff, E. Y. (2011). Optical quantal analysis of synaptic transmission in wild-type and rab3-mutant Drosophila motor axons. Nat. Neurosci. 14, 519–526. doi: 10.1038/nn.2767
Pubmed Abstract | Pubmed Full Text | CrossRef Full Text | Google Scholar
Peled, E. S., Newman, Z. L., and Isacoff, E. Y. (2014). Evoked and spontaneous transmission favored by distinct sets of synapses. Curr. Biol. 24, 484–493. doi: 10.1016/j.cub.2014.01.022
Pubmed Abstract | Pubmed Full Text | CrossRef Full Text | Google Scholar
Reyes, A., Lujan, R., Rozov, A., Burnashev, N., Somogyi, P., and Sakmann, B. (1998). Target-cell-specific facilitation and depression in neocortical circuits. Nat. Neurosci. 1, 279–285. doi: 10.1038/1092
Pubmed Abstract | Pubmed Full Text | CrossRef Full Text | Google Scholar
Sauer, M. (2013). Localization microscopy coming of age: from concepts to biological impact. J. Cell Sci. 126, 3505–3513. doi: 10.1242/jcs.123612
Pubmed Abstract | Pubmed Full Text | CrossRef Full Text | Google Scholar
Schmidt, H., Brachtendorf, S., Arendt, O., Hallermann, S., Ishiyama, S., Bornschein, G.,et al. (2013). Nanodomain coupling at an excitatory cortical synapse. Curr. Biol. 23, 244–249. doi: 10.1016/j.cub.2012.12.007
Pubmed Abstract | Pubmed Full Text | CrossRef Full Text | Google Scholar
Sigrist, S. J., Reiff, D. F., Thiel, P. R., Steinert, J. R., and Schuster, C. M. (2003). Experience-dependent strengthening of Drosophila neuromuscular junctions. J. Neurosci. 23, 6546–6556.
Stewart, B. A., Atwood, H. L., Renger, J. J., Wang, J., and Wu, C. F. (1994). Improved stability of Drosophila larval neuromuscular preparations in haemolymph-like physiological solutions. J. Comp. Physiol. A 175, 179–191. doi: 10.1007/BF00215114
Pubmed Abstract | Pubmed Full Text | CrossRef Full Text | Google Scholar
Südhof, T. C. (2012). The presynaptic active zone. Neuron 75, 11–25. doi: 10.1016/j.neuron.2012.06.012
Pubmed Abstract | Pubmed Full Text | CrossRef Full Text | Google Scholar
Takamori, S., Holt, M., Stenius, K., Lemke, E. A., Grønborg, M., and Riedel, D.et al. (2006). Molecular anatomy of a trafficking organelle. Cell 127, 831–846. doi: 10.1016/j.cell.2006.10.030
Pubmed Abstract | Pubmed Full Text | CrossRef Full Text | Google Scholar
van de Linde, S., Kasper, R., Heilemann, M., and Sauer, M. (2008). Photoswitching microscopy with standard fluorophores. Appl. Phys. B 93, 725–731. doi: 10.1007/s00340-008-3250-9
van de Linde, S., Löschberger, A., Klein, T., Heidbreder, M., Wolter, S., Heilemann, M.,et al. (2011). Direct stochastic optical reconstruction microscopy with standard fluorescent probes. Nat. Protoc. 6, 991–1009. doi: 10.1038/nprot.2011.336
Vyleta, N. P., and Jonas, P. (2014). Loose coupling between Ca2+ channels and release sensors at a plastic hippocampal synapse. Science 343, 665–670. doi: 10.1126/science.1244811
Pubmed Abstract | Pubmed Full Text | CrossRef Full Text | Google Scholar
Wagh, D. A., Rasse, T. M., Asan, E., Hofbauer, A., Schwenkert, I., Dürrbeck, H.,et al. (2006). Bruchpilot, a Protein with homology to ELKS/CAST, is required for structural integrity and function of synaptic active zones in Drosophila. Neuron 49, 833–844. doi: 10.1016/j.neuron.2006.02.008
Pubmed Abstract | Pubmed Full Text | CrossRef Full Text | Google Scholar
Walter, A. M., Groffen, A. J., Sørensen, J. B., and Verhage, M. (2011). Multiple Ca2+ sensors in secretion: teammates, competitors or autocrats? Trends Neurosci. 34, 487–497. doi: 10.1016/j.tins.2011.07.003
Pubmed Abstract | Pubmed Full Text | CrossRef Full Text | Google Scholar
Wang, J., Bello, O., Auclair, S. M., Wang, J., Coleman, J., Pincet, F.,et al. (2014). Calcium sensitive ring-like oligomers formed by synaptotagmin. Proc. Natl. Acad. Sci. U.S.A. 111, 13966–13971. doi: 10.1073/pnas.1415849111
Pubmed Abstract | Pubmed Full Text | CrossRef Full Text | Google Scholar
Weyhersmüller, A., Hallermann, S., Wagner, N., and Eilers, J. (2011). Rapid active zone remodeling during synaptic plasticity. J. Neurosci. 31, 6041–6052. doi: 10.1523/JNEUROSCI.6698-10.2011
Pubmed Abstract | Pubmed Full Text | CrossRef Full Text | Google Scholar
Wojtowicz, J. M., Marin, L., and Atwood, H. L. (1994). Activity-induced changes in synaptic release sites at the crayfish neuromuscular junction. J. Neurosci. 14, 3688–3703.
Wolter, S., Löschberger, A., Holm, T., Aufmkolk, S., Dabauvalle, M. C., van de Linde, S.,et al. (2012). rapidSTORM: accurate, fast and open-source software for localization microscopy. Nat. Methods 9, 1040–1041. doi: 10.1038/nmeth.2224
Pubmed Abstract | Pubmed Full Text | CrossRef Full Text | Google Scholar
Wolter, S., Schüttpelz, M., Tscherepanow, M., van de Linde, S., Heilemann, M., and Sauer, M. (2010). Real-time computation of subdiffraction-resolution fluorescence images. J. Microsc. 237, 12–22. doi: 10.1111/j.1365-2818.2009.03287.x
Pubmed Abstract | Pubmed Full Text | CrossRef Full Text | Google Scholar
Yook, K. J., Proulx, S. R., and Jorgensen, E. M. (2001). Rules of nonallelic noncomplementation at the synapse in Caenorhabditis elegans. Genetics 158, 209–220.
Young, S. M. Jr., and Neher, E. (2009). Synaptotagmin has an essential function in synaptic vesicle positioning for synchronous release in addition to its role as a calcium sensor. Neuron 63, 482–496. doi: 10.1016/j.neuron.2009.07.028
Pubmed Abstract | Pubmed Full Text | CrossRef Full Text | Google Scholar
Keywords: Bruchpilot, active zone, neurotransmitter release, synaptic delay, presynaptic differentiation, synaptotagmin, dSTORM
Citation: Paul MM, Pauli M, Ehmann N, Hallermann S, Sauer M, Kittel RJ and Heckmann M (2015) Bruchpilot and Synaptotagmin collaborate to drive rapid glutamate release and active zone differentiation. Front. Cell. Neurosci. 9:29. doi: 10.3389/fncel.2015.00029
Received: 28 October 2014; Accepted: 16 January 2015;
Published online: 05 February 2015.
Edited by:
Christian D. Wilms, University College London, UKReviewed by:
Annalisa Scimemi, State University of New York Albany, USADion Dickman, University of Southern California, USA
Copyright © 2015 Paul, Pauli, Ehmann, Hallermann, Sauer, Kittel and Heckmann. This is an open-access article distributed under the terms of the Creative Commons Attribution License (CC BY). The use, distribution or reproduction in other forums is permitted, provided the original author(s) or licensor are credited and that the original publication in this journal is cited, in accordance with accepted academic practice. No use, distribution or reproduction is permitted which does not comply with these terms.
*Correspondence: Manfred Heckmann and Robert J. Kittel, Department of Neurophysiology, Institute of Physiology, Julius-Maximilians-University Würzburg, Röntgenring 9, 97070 Würzburg, Germany e-mail: heckmann@uni-wuerzburg.de; robert.kittel@uni-wuerzburg.de