Identification and characterization of mouse otic sensory lineage genes
 Byron H. Hartman
 Robert Durruthy-Durruthy
 Roman D. Laske
 Steven Losorelli
 Stefan Heller
- Department of Otolaryngology, Head and Neck Surgery, Stanford University School of Medicine, Stanford, CA, USA
Vertebrate embryogenesis gives rise to all cell types of an organism through the development of many unique lineages derived from the three primordial germ layers. The otic sensory lineage arises from the otic vesicle, a structure formed through invagination of placodal non-neural ectoderm. This developmental lineage possesses unique differentiation potential, giving rise to otic sensory cell populations including hair cells, supporting cells, and ganglion neurons of the auditory and vestibular organs. Here we present a systematic approach to identify transcriptional features that distinguish the otic sensory lineage (from early otic progenitors to otic sensory populations) from other major lineages of vertebrate development. We used a microarray approach to analyze otic sensory lineage populations including microdissected otic vesicles (embryonic day 10.5) as well as isolated neonatal cochlear hair cells and supporting cells at postnatal day 3. Non-otic tissue samples including periotic tissues and whole embryos with otic regions removed were used as reference populations to evaluate otic specificity. Otic populations shared transcriptome-wide correlations in expression profiles that distinguish members of this lineage from non-otic populations. We further analyzed the microarray data using comparative and dimension reduction methods to identify individual genes that are specifically expressed in the otic sensory lineage. This analysis identified and ranked top otic sensory lineage-specific transcripts including Fbxo2, Col9a2, and Oc90, and additional novel otic lineage markers. To validate these results we performed expression analysis on select genes using immunohistochemistry and in situ hybridization. Fbxo2 showed the most striking pattern of specificity to the otic sensory lineage, including robust expression in the early otic vesicle and sustained expression in prosensory progenitors and auditory and vestibular hair cells and supporting cells.
Introduction
The sensory and neuronal cells of the vertebrate inner ear arise from the otic vesicle (OV), a spheroid epithelial structure formed during midgestation embryogenesis through invagination of the otic placode. Of all the developmental lineages of the vertebrate embryo, the otic sensory lineage has the unique capacity to give rise to auditory and vestibular hair cells, supporting cells, and neurons, all of which are essential for hearing and balance function (Figure 1A). The otic placode is derived from posterior preplacodal non-neural ectoderm, specifically within the otic-epibranchial domain (Chen and Streit, 2013). The process of otic induction from preplacodal ectoderm is initiated around embryonic day 8 (E8) in mouse. By E10.5 otic vesicle invagination has encapsulated the otic placode epithelia into a vesicle where subsequent processes of morphogenesis and differentiation give rise to cell fates of the inner ear, including neural, sensory (hair cells and supporting cells) and non-sensory fates (Figures 1B,C). A progressive lineage bifurcation model of otic differentiation is consistent with experimental observations and illustrates how pan-otic progenitor cells of the otic vesicle could give rise to non-sensory, neural, supporting cell, and hair cell populations (Figure 1C). Several signaling pathways including Fgf, Notch, and Wnt have been shown to be involved in specification of the otic placode as well as subsequent specifications of neuronal and prosensory populations (Liu et al., 2003; Jayasena et al., 2008; Dominguez-Frutos et al., 2009; Hartman et al., 2010; Hammond and Whitfield, 2011; Chen and Streit, 2013; Vendrell et al., 2013; Schlosser, 2014). Evolutionarily conserved transcription factors such as Eya1, Six1, Gata3, and Pax2/8 are expressed in the early otic sensory lineage and have been implicated in its specification and development (Xu et al., 1999; Zheng et al., 2003; Hans et al., 2004; Lillevali et al., 2006; Zou et al., 2006; Barrionuevo et al., 2008; Freter et al., 2012). Despite the unique nature of the otic sensory lineage, there are no known markers that unambiguously discriminate this lineage from others persistently through the course of development. The goal of this study was to apply a transcriptome-wide comparison to find such markers. Systematic transcriptome-wide identification of otic lineage distinguishing genes would contribute to our understanding of transcriptional states and gene regulation in inner ear development and function. Furthermore, classification of genes that enable rigorous identification of otic sensory lineage cells would greatly benefit in vitro studies of inner ear development and regeneration, which currently rely on combinatorial expression of transient non-specific markers (Oshima et al., 2010; Koehler et al., 2013).
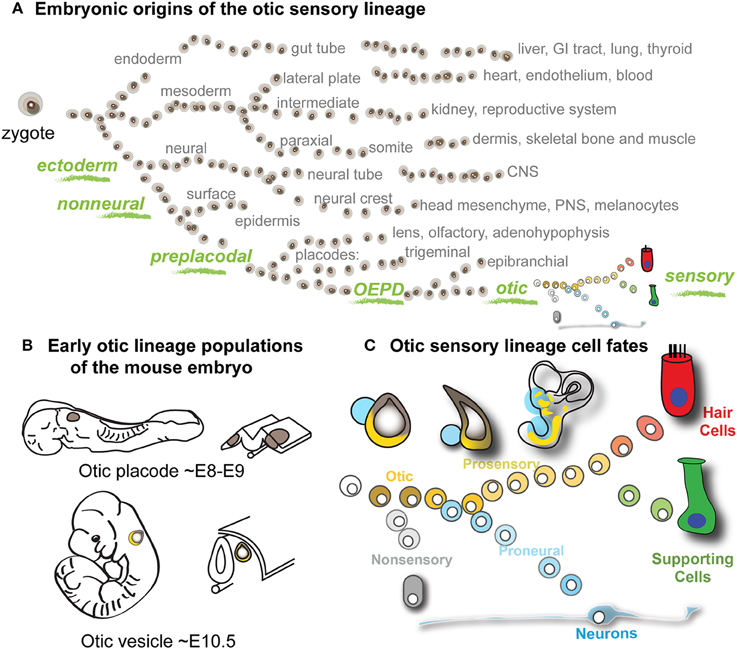
Figure 1. Otic sensory development and project rationale. (A) Schematic of the major developmental lineages of the vertebrate embryo. The otic sensory lineage is derived from the non-neural preplacodal domain of the ectodermal germ lineage (green). The otic-epibranchial domain (OEPD) gives rise to the otic placode, which invaginates to form the epithelium of the otic vesicle, from which the otic sensory populations differentiate. (B) The locations of early otic lineage populations of the mouse embryo are depicted at the placode and vesicle stages with corresponding embryonic ages indicated. (C) Model of otic lineage differentiation. Through progressive lineage bifurcations, cells of the otic vesicle give rise to hair cells, supporting cells and neurons, as well as non-sensory epithelial cells of the inner ear.
Here we compare transcriptional states in three branches of the otic sensory lineage (early otic progenitors, sensory hair cells and supporting cells) to those of tissues broadly representing non-otic lineages of vertebrate development. We used multivariate analysis methods to identify correlations across ~25,000 probe sets that distinguish the otic sensory lineage from non-otic populations. Otic consensus genes were identified based on differential expression between otic (otic vesicle, hair cell, and supporting cell) and non-otic groups (whole embryos with otic regions removed and periotic tissues). Otic consensus scores and rankings for each probe were devised as a reduction of enrichment values in each of the three otic categories to further aid in identification of lineage specific genes. Our analyses ranked top otic lineage-specific transcripts and identified many novel genes expressed in early otic progenitors as well as sensory hair cells and supporting cells. We performed additional expression analyses on select genes using immunohistochemistry and in situ hybridization, which revealed patterns that concurred with the array data. Fbxo2 showed the most striking pattern of specificity to the otic sensory lineage, including robust expression in the early otic vesicle and sustained expression in prosensory progenitors, and subsequently in auditory and vestibular hair cells and supporting cells.
Materials and Methods
Mice
Embryos were collected from timed pregnant CD-1 dams (Charles River). Noon on the day of the vaginal plug was considered to be E0.5 and embryo ages were confirmed according to Theiler (Theiler, 1989). For postnatal mice, postnatal day 0 (P0) was defined as the day of birth. Mice were housed with the Stanford Department of Comparative Medicine and the Stanford University Administrative Panel on Laboratory Animal Care (APLAC) approved all procedures.
RNA Isolation from Otic and Non-Otic Tissue populations from E10.5 Embryos
Three separate litters of E10.5 CD-1 embryos (Theiler Stage 16–17) were dissected in cold phosphate buffered saline (PBS) using fine forceps and separated into triplicate pools consisting of (1) 20 otic vesicles (OVs), (2) periotic tissue including mesenchyme and hindbrain, and (3) whole embryos minus the greater otic region (Figures 2A,B). RNA was isolated using the Nucleospin RNA XS Kit (Machery Nagel). RNA quality and concentrations were verified with Agilent BioAnalyzer RNA and Nanodrop spectrophotometer assays.
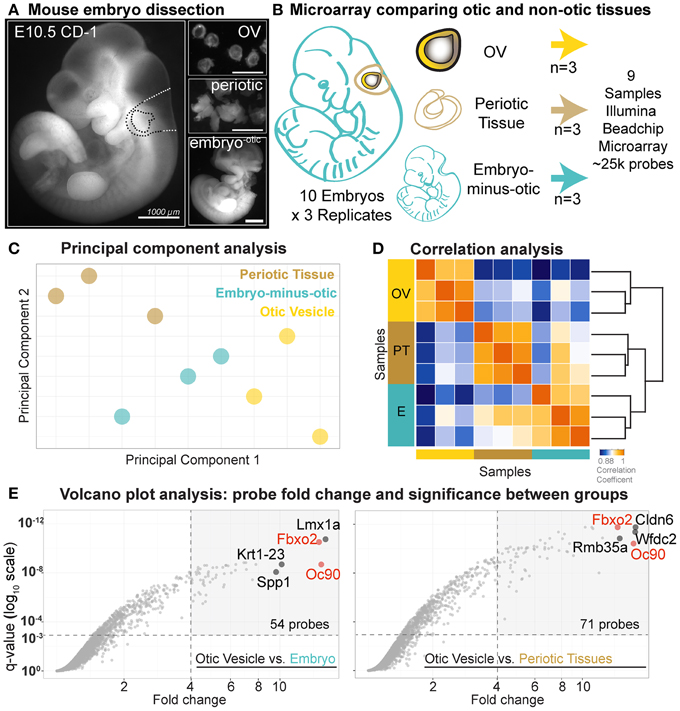
Figure 2. Comparative early stage otic microarray. (A) E10.5 mouse embryos were dissected into OV, periotic, and the whole embryo minus greater otic region. (B) Dissected tissues were collected as indicated and nine samples were processed for microarray. (C) Score plot of principal component analysis. Individual replicates for each of the three populations (OV, periotic tissue, embryo minus greater otic region) are projected onto the first two principal components. Color-code corresponds to tissue origin. (D) Correlation analysis between samples using Spearman's correlation coefficients as a measure of similarity. Replicates within one group of samples show higher correlation with each other than with samples of other tissue populations. (E) Volcano plots display corrected p-values (q-values) for each probe set as a function of associated fold change values between OV and each non-otic group. Fold change values calculated based on log2-normalized probe intensity values. Horizontal dashed lines indicate statistical significance level of q = 0.001. Vertical dashed lines indicate fold change = 4.
Gene Array Hybridization
Each of the nine RNA samples was amplified using the Ambion Illumina RNA amplification kit with biotin UTP labeling. The Ambion Illumina RNA amplification kit uses T7 oligo(dT) primer to generate single stranded cDNA followed by a second strand synthesis to generate double-stranded cDNA, which is then column purified. In vitro transcription was done to synthesize biotin-labeled cRNA using T7 RNA polymerase. The cRNA was then column purified and a total of 750 ng was hybridized for each array using standard Illumina protocols with streptavidin-Cy3 used for detection. The MouseRef-8 v2.0 Illumina beadchip targets ~25,600 annotated RefSeq transcripts, over 19,000 unique genes, and enables the interrogation of eight samples in parallel. For practical purposes we will refer to the transcriptome-wide scope of data from this assay, although technically it is limited because some transcripts are not represented and some probe sets will perform better than others. Slides were scanned on an Illumina Beadstation and analyzed using GenomeStudio (Illumina, Inc.). The data discussed in this publication were deposited in NCBI's Gene Expression Omnibus, accession number GSE65843 (accessible at http://www.ncbi.nlm.nih.gov/geo/).
Microarray Data Analysis
Differential microarray analysis was performed with the goal to identify genes enriched in early otic lineage cells as compared broadly to other developmental lineages. At E10.5 the mouse otic vesicle has fully invaginated from the head ectoderm and can be microdissected intact from the surrounding tissues (Figure 2A). Mouse embryos at E10.5 were dissected into three tissue groups, one otic and two non-otic. 20 otic vesicles were pooled for each OV sample and the remaining tissue of the embryos were dissected into two non-otic groups consisting of: (1) pooled periotic tissues including mesenchyme and dorsal neural tissue, and (2) whole embryos minus the greater otic regions (Figures 2A,B). We analyzed gene expression in triplicate samples for each group using MouseRef-8 v2.0 Expression Beadchip Microarrays (Illumina). To initially assess the quality of the data we performed principal component analysis (PCA) on all nine samples (Figure 2C). PCA reduces the high dimensionality of microarray data into a set of linearly uncorrelated variables called principal components, which are defined so that the first principal component retains the largest possible variance (Jollife, 2010). Projections on the first two principal components positioned samples of the same tissue origin in closer proximity with each other than samples from different origins (Figure 2C). As expected, transcriptome-wide expression profiles were more similar between replicates of each group. We also analyzed transcriptome-wide correlation between using Spearman's coefficients, which revealed intra-sample similarities and inter-sample differences (Figure 2D). Correlation coefficients and the structure of the associated dendrogram indicate that transcriptional profiles of otic vesicle cells are distinct from the two non-otic sample populations.
To compare gene expression in multiple otic sensory populations to non-otic populations, the data for the nine samples from E10.5 embryos described above were analyzed alongside equivalently generated array datasets for FACS-sorted neonatal cochlear hair cells and supporting cells generated in an earlier study (Sinkkonen et al., 2011). These included Illumina MouseRef-8 v2.0 datasets from P3 cochlear hair cells (HCs, n = 4, Atoh1-GFP+) and supporting cells (SCs, n = 2, Atoh1-GFP-/CD271L/CD146L/CD326+); NCBI Gene Expression Omnibus accession number GSE62582. GeneSpring 12.6 software and R 3.1.1 software packages (RStudio) were used for multivariate microarray data analysis. Data values were log2-transformed and quantile normalization was applied. Quantile normalization removes non-biological variance between arrays by making the distribution of probe intensities the same for each sample based on a normalization distribution chosen by averaging each quantile across all samples (Bolstad et al., 2003). Group means of expression and standard deviation (SD) were calculated for the five groups: E10.5 otic vesicle (OV), E10.5 periotic tissue, E10.5 embryo-minus-otic, and P3 hair cells (HCs) and supporting cells (SCs). Means of expression levels were compared between the otic groups and each of the two non-otic sample groups and fold change (fold Δ) values were calculated as the ratio of normalized mean intensities (for log2-transformed data, fold Δ = 2∧(A−B), where A and B represent log2-transformed normalized intensity values for two different samples). All probes were ranked in three categories based on fold Δ in expression value in the OV, HC, and SC groups vs. the maximum expressing non-otic group (periotic or embryo-minus-otic) for the given probe. Calculated p-values (moderated t-test, Smyth, 2004) were corrected for multiple comparisons using Benjamini and Hochberg's false discovery rate algorithm (termed q-values, Benjamini and Hochberg, 1995; Benjamini and Yekutieli, 2005). The R packages FactoMinerR and gplots were used to perform principal component analysis and visualize correlation and expression data in heat map format.
To identify otic vesicle specific genes we compared expression values between the E10.5 OV and the two non-otic populations individually (periotic, and embryo-minus-otic groups). Use of different non-otic reference populations affects the fold change values for some genes more than others. This is illustrated by the differences in probes with high fold change (fold Δ > 4) and high significance (q < 0.001) between comparisons (Figure 2E). For the OV vs. embryo-minus-otic comparison, 54 probes meet this cutoff, while 71 probes are found for the OV vs. periotic tissue. The probes with highest fold change in each category also change between comparisons, but some probes have high fold change in both, such as Fbxo2 and Oc90, which are found in the top 5 probes for both comparisons. To rank genes based on the most conservative assessment of otic specificity, OV fold change values were determined using the highest non-otic intensity value for each probe (either the embryo-minus-otic, or the periotic tissue) (Supplemental File 1).
Whole Mount Fluorescent Immunohistochemistry
Whole embryos (E10.5–E12.5) or dissected neonatal cochlea tissues were fixed overnight at 4°C in either 4% paraformaldehyde (PFA) in phosphate-buffered saline at pH 7.4 (PBS), or Glyofixx (Thermo Fisher Scientific, Waltham, MA). Samples were washed in PBS then permeabilized with 2% TritonX100 in PBS for 1 h at room temperature. Samples were incubated in blocking solution (10% fetal bovine serum, 0.5% TritonX100, in PBS) overnight at 4°C. Primary antibodies were diluted in blocking solution and samples were incubated for three nights at 4°C with rocking. Samples were washed 4x in blocking solution for 1 h at room temperature, then overnight at 4°C, all with rocking. Species-specific Alexafluor 488-/568-/ or 633-conjugated secondary antibodies (Life Technologies) were diluted in blocking solution and samples were incubated for 2 nights at 4°C with rocking. Samples were washed twice at room temperature for 1 h in blocking solution, twice for 1 h in PBS, then overnight in PBS at 4°C, all with rocking. For optical clearing of whole embryos, samples were incubated at 4°C with rocking in Scale/A2 (Hama et al., 2011) for at least 5 days, with 2–3 changes of the Scale/A2 solution. For imaging, whole embryos were mounted in Scale/A2 between glass coverslips in imaging chambers consisting of 2–3 stacked 0.5 mm adhesive silicone spacers, modified from SecureSeal Hybridization Chambers (Grace Biolabs). Optically cleared embryos were imaged with a Zeiss LSM700 confocal microscope using a 10X or 20X objective to generate multiple z-stacks for coverage of the whole specimen. Maximum intensity z-projections were stitched together in Adobe Photoshop CS6 using the auto blend layers function.
Cryosection Fluorescent Immunohistochemistry
Embryonic heads or neonatal inner ears were fixed overnight at 4°C in 4% PFA in PBS. Samples were washed in PBS, then cryoprotected through graded sucrose in PBS (10% sucrose, 20% sucrose, 30% sucrose), then embedded in OCT (Tissue Tek), frozen in a bath of ethanol and dry ice, sectioned at 12 μm, and mounted on Superfrost+ slides (Fisher Scientific). Slides with cryosections were then washed briefly in PBS and incubated with blocking solution (10% fetal bovine serum, 0.5% TritonX100, in PBS). Primary antibodies were diluted in blocking solution and incubated overnight at 4°C. Slides were then washed in PBS 3 × 10 min and incubated in species-specific Alexafluor 488-/568-/ or 633-conjugated secondary antibodies (Life Technologies). After immunostaining, slides were coverslipped in Fluoromount G (Southern Biotechnology, Birmingham, AL, USA) and imaged on a Zeiss LSM700 confocal microscope.
Antibodies
The following primary antibodies were used for section and whole mount immunohistochemistry, at the dilutions indicated: rabbit anti-Fbx2 (1:300, Kato et al., 2005, gift of A. Kato and D. Bredt), goat anti-Sox2 (1:300, Santa Cruz Biotechnology, Sox2 Y-17, cat. no. SC-17320); goat anti-Sox10 (1:100, Santa Cruz Biotechnology, Sox10 N-20, SC-17342); mouse anti-Tuj1 (1:2000, Millipore, Ms X beta III tubulin, MAB5564); goat anti-Jag1 (1:300 Santa Cruz Biotechnology, Jag1 C-20, SC-6011); rabbit anti-COL9A2 (1:100, Atlas Antibodies, HPA056316), and rabbit anti-Pax2 (1:100, Covance).
Paraffin Section in Situ Hybridization
Digoxigenin-labeled probe was in vitro transcribed from a linearized complementary DNA clone corresponding to Oc90 (MGC:59513 IMAGE:6334417). In situ hybridization was performed as previously described (Hartman et al., 2007). Briefly, whole embryos (E10.5 and E12.5) or half heads (E14.5 and older) were fixed overnight at 4°C in modified Carnoy's solution (60% ethanol, 11.1% formaldehyde (30% of 37% stock), 10% glacial acetic acid), dehydrated though an ethanol series, prepared for paraffin embedding, and sectioned at 10 μm. Slides were baked overnight at 68°C, dewaxed in xylene, rinsed in ethanol, and air-dried at room temperature. Overnight hybridization and subsequent washes were carried out at 68°C. Hybridized probe was detected using anti-digoxygenin alkaline phosphatase conjugated antibody (1:2000 dilution, Roche Biochemical, Indianapolis, IN, USA) and visualized with NBT/BCIP for a blue precipitate. After in situ hybridization, sections were postfixed in 4% PFA and coverslipped with Fluoromount G.
Results
Identification of Genes Distinguishing the Otic Vesicle from other Lineages of the Midgestation Embryo
OV fold Δ values (see Methods) for the top 100 OV probes range from about 15- to 3-fold, and 47 probes had OV fold Δ values greater than 4 (Supplemental File 1). Low q-values indicated high statistical significance (q < 0.05) for the vast majority of the probes that ranked in the top 200 based on OV fold Δ (Table 1 and Supplemental File 1). Sensitivity and dynamic range are highly dependent on probe design and differ greatly between probes. This is reflected in the broad range of average OV intensity values among the top 30 OV probes (Table 1) and illustrates the necessity for differential comparison to reference populations. The MouseRef-8 Beadchip represents most genes with only a single probe (identified by Probe_ID, Supplemental File 1), however some genes are represented by more than one probe. The inclusion of two non-otic reference populations is useful for assessing dynamic range, estimating limit of detection and in some cases identification of the presence of non-otic expression sites. If an OV specific gene were not substantially expressed in other tissues then we would not expect to see differential expression between the two non-otic populations. Thus, periotic vs. embryo fold Δ values and statistical comparisons are included in Table 1 and Supplemental File 1.
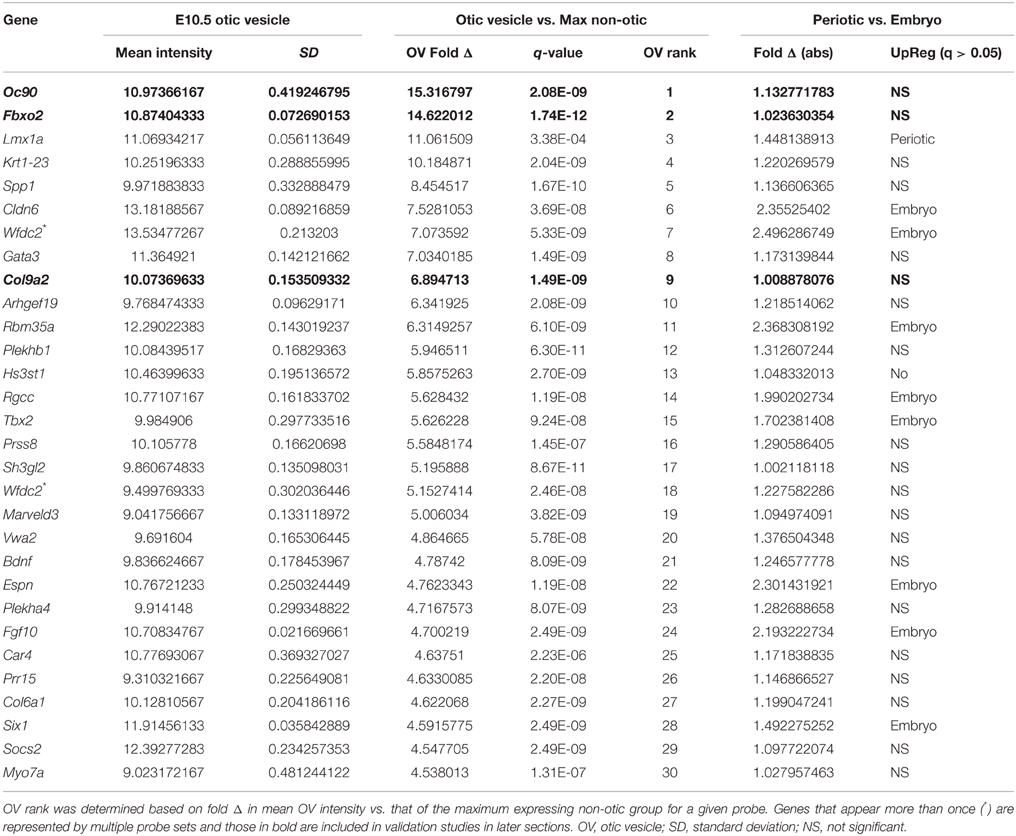
Table 1. Top 30 probes ranked by OV fold Δ vs. maximum non-otic population.
The top-ranking OV probe was for the Oc90 gene, with an OV fold Δ of 15.32 (q = 2.08E-09), while the probe for Fbxo2 had an OV fold Δ value of 14.62 (q = 1.74E–12) (Figure 2E, Table 1, and Supplemental File 1). Both probes exhibited low non-otic group intensity values without significant differences between periotic and embryo-minus-otic samples (Oc90 fold Δ = 1.13, q = 0.506; Fbxo2 fold Δ = 1.02, q = 0.946, Supplemental File 1), suggesting that these two genes are otic-specific. Both of these genes were initially discovered based on high expression of RNA or protein in screens of rodent cochlea (Thalmann et al., 1997, 2003; Verpy et al., 1999). A probe for Col9a2 (OV rank 9, OV fold Δ = 6.89, q = 1.49E-09) also had nearly identical intensities between the two non-otic populations (periotic vs. embryo fold Δ = 1.01, q = 0.981) suggestive of very low or undetectable expression in other lineages. Further discussion and analysis of expression patterns for Oc90, Fbxo2, and Col9a2 are found below.
A difference in probe intensities between the two non-otic populations can be an indication of other regions of gene expression. For example, some probes had higher intensity in the periotic tissue group, which can indicate expression domains in the dorsal mesenchyme or neural tube. A probe for Lmx1a had a fold change in the OV vs. the rest of the embryo slightly higher than that of Fbxo2, however relatively high periotic tissue intensity put this probe in 3rd for the OV rankings (OV fold Δ = 11.06, q = 3.38E-04). The difference between the periotic group and embryo-minus-otic group intensities for the Lmx1a probe (fold Δ = 1.45, q = 0.005, Supplemental File 1) is consistent with the described expression of Lmx1a in OV as well as the dorsal midline (roof plate) of the developing neural tube (Failli et al., 2002; Nichols et al., 2008). Elevated probe intensity in the embryo-minus-otic group as compared to the periotic group was relatively common and is suggestive of gene expression in other ectodermal, endodermal, or mesodermal cell populations of the embryo. For example, Cldn6, Wfdc2, and Rbm35a (OV ranks: 6, 7, and 11, respectively), all have described expression patterns in the otic vesicle as well as endodermal tissues such as the branchial arches and pronephros (Kollmar et al., 2001; Anderson et al., 2008; Tamplin et al., 2008; Ohazama et al., 2010). Expression in these domains is reflected as significantly elevated intensities in the embryo-minus-otic group vs. the periotic group for all of these probes (Table 1 and Supplemental File 1). Two probes for Fgf10 (OV ranks 24 and 37) were also elevated in the embryo-minus-otic group compared to the periotic group, reflective of Fgf10 expression in the OV as well as limb bud mesoderm (Ohuchi et al., 1997; Mailleux et al., 2005). Espn (OV rank 22) was upregulated in the embryo compared to the periotic group, which is consistent with a well described pattern of Espin expression in early otic epithelia as well as brachial clefts, pharyngeal pouches and other embryonic epithelial tissues (Sekerkova et al., 2006).
Comparison to Neonatal Hair Cell and Supporting Cell Gene Array Data and Identification of Otic Consensus Genes
We next wanted to identify transcriptional features and individual genes that distinguish the otic sensory lineage from non-otic lineages throughout developmental time. To address this, we added two more otic populations to our comparative array analysis: hair cell (HC) and supporting cell (SC) RNA samples isolated from P3 mouse cochlea by dissociation and flow cytometry in an earlier study (Sinkkonen et al., 2011) (Figure 3A). We combined and normalized these P3 sample probe intensities [HC (n = 4) and SC (n = 2)] with those of our nine samples from E10.5 embryos described above (Supplemental File 1). We then performed principal component analysis to assess the transcriptome-wide similarities and differences between all of the samples (Figure 3B). Projection of the samples onto the first two principal components illustrates the inter-group relationship of otic sensory lineage populations and their segregation from non-otic samples.
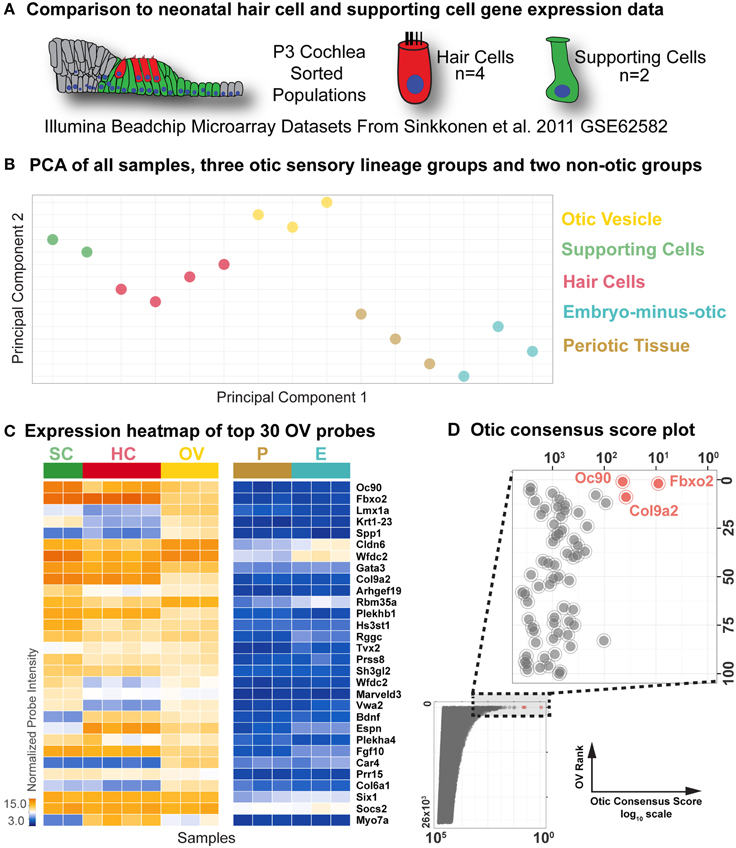
Figure 3. Comparison to neonatal hair cell and supporting cell microarray data. (A) Differential comparison was extended to an existing microarray dataset (GSE62582, Sinkkonen et al., 2011) consisting of flow-sorted hair cell and supporting cell populations from P3 cochlea. (B) Principal component analysis score plot of all samples, color-coded as indicated on the right. (C) Probe intensity heat map of top 30 OV ranked probes in all samples, indicated by group color in the top bar. Genes are ordered according to Table 1. (D) Otic consensus score plotted against OV rank for all probes, with an enlargement of the top 100 OV probes in the inset. The top three probes are indicated in red.
To identify the most differentially expressed genes in the P3 hair cell and supporting cell populations, we compared individual probe intensity levels vs. the non-otic samples. The heat map of probe intensity values for the top 30 probes by OV rank across all samples shown in Figure 3C illustrates the diversity of gene expression profiles in these populations. As with the OV comparisons, HC fold Δ and SC fold Δ values were determined for each probe based on relative intensities between the HC or SC groups and the highest expressing non-otic group for a given probe (Table 2 and Supplemental File 1). In general, probe intensities and fold Δ values for the HC and SC groups showed a much wider range than the OV samples. This is expected due to the more differentiated state of neonatal HCs and SCs as compared to OV progenitors, as well as the more homogeneous makeup of the FACS purified P3 samples (Sinkkonen et al., 2011). Both HC and SC fold Δ values across all probes ranged from about 300 fold up regulated to about 300 fold down regulated (0.003 fold Δ). 684 probes had HC fold Δ values greater than 4, while 565 probes had SC fold Δ values greater than 4 (Supplemental File 1).
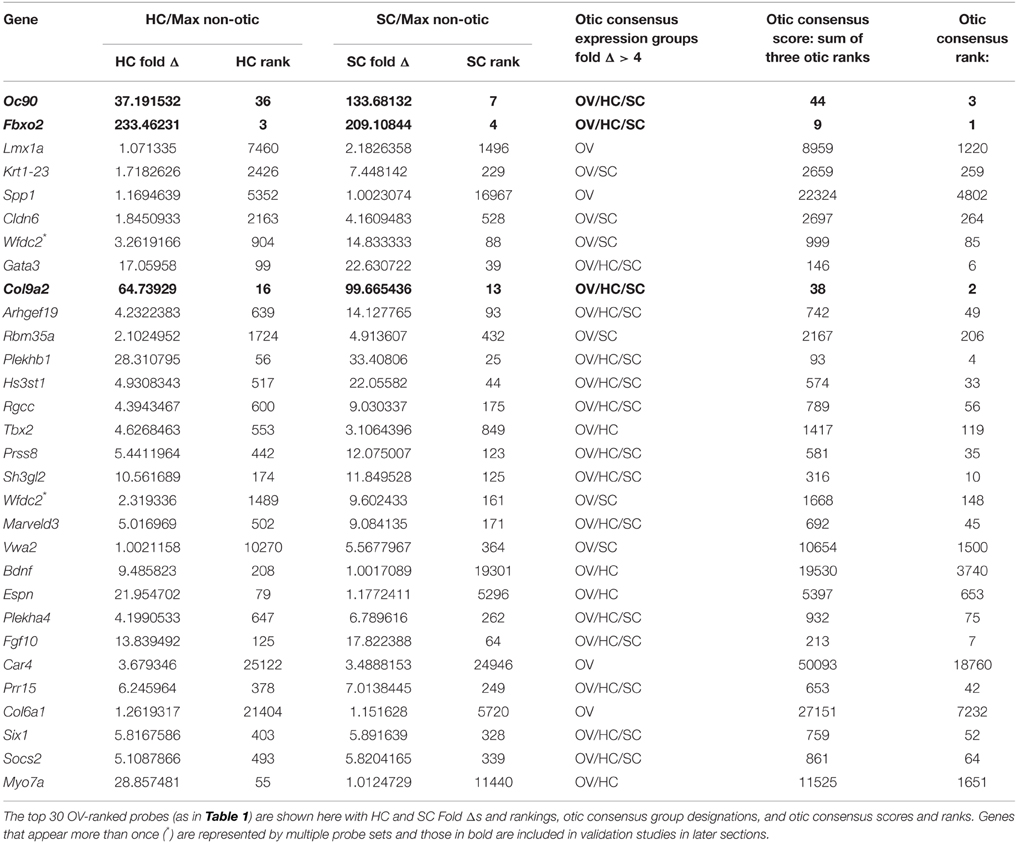
Table 2. Comparison of P3 hair cell and supporting cell expression intensities to non-otic populations.
We next sought to identify genes with consensus of specific expression in the OV as well as SC and HC groups. Probes were evaluated for otic consensus expression based on fold change and rankings in the three otic categories. As an initial approach, a fold change threshold was used to assign otic consensus expression groups, based on a minimum change vs. max non-otic of 4-fold (Table 2 and Supplemental File 1). This analysis highlights the correlation of gene expression between the three otic populations and, in particular, shows that many genes strongly expressed in HCs and/or SCs are initially expressed quite early in otic development, showing elevated probe intensity in the OV. When we examined all probes ranked by OV fold Δ (Supplemental File 1) there is a notably high prevalence of probes with HC and/or SC consensus among the higher-ranked OV probes. Indeed, 17.4% of HC consensus probes and 25.5% of SC consensus probes (119/684 and 144/565 probes > 4-fold, respectively) are found within the top 500 probes by OV rank (Supplemental File 1). About half of the top 30-ranked OV probes shown in Table 2 are designated as having consensus expression above the threshold in all three otic populations (OV/HC/SC). Other probes are designated as consensus only for one or two otic groups (i.e., OV, OV/HC, or OV/SC). For example, Lmx1a, Spp1, Car4, and Col6a1 are enriched greater than 4-fold in OV, but not in HCs or SCs, suggesting down regulation of these genes in both HC and SC branches of the otic sensory lineage during development. Probes with OV/HC consensus expression are also indicated in Table 2, and include Tbx2, Bdnf, Espn, and Myo7a. OV/SC consensus probes include Krt1-23, Cldn6, Wfdc2, and Vwa2. This analysis shows how assignment of expression groups based on fold change and q-value cutoffs can be useful in identify genes with expression in the different branches of the otic sensory lineage. However, outcomes from this type of analysis are highly modulated by fold change and statistical cutoffs (Dalman et al., 2012) so interpretations will vary and multiple methods of comparison are necessary.
To address this, we calculated otic consensus scores for each probe as the sum of the three otic ranks. All probe sets were ranked by otic consensus score values, which ranged from 9 to 77,083 (Supplemental File 1). Otic consensus scores and ranks illustrate the relative differences between total otic vs. non-otic expression of genes. Lower otic consensus scores represent more “otic lineage-specific” genes. A representation of all probes positioned by OV rank vs. otic consensus score illustrates their distribution across the dataset and highlights top otic consensus genes Fbxo2, Col9a2, and Oc90 (Figure 3D). The broad range of otic consensus ranks among the 30 top OV genes shown in Table 2 is an indication of the diverse expression behavior of these genes in the later otic sensory lineages (HCs and SCs). The top 30 probes by OV consensus rank are listed in Table 3, with Fbxo2, Col9a2, and Oc90 topping the list; all three with an OV rank less than 10 and OV consensus score below 50. Several of the probes in Table 3 represent well-known otic genes and some are listed more than once due to having multiple probe sets similarly ranked. This analysis also highlights genes that are likely expressed in the OV but were not particularly noted earlier due to the relatively low range of fold change values across all probes in OV vs. non-otic samples. For example, probes for Btbd14a, Otolin, Kai1, Gjb2, and Ush1c, have OV rankings from about 100–380 and OV fold changes from 2.5 to 1.5-fold, but all ranked well by otic consensus due to high fold changes in HC and SC groups combined with a reasonably high OV rank.
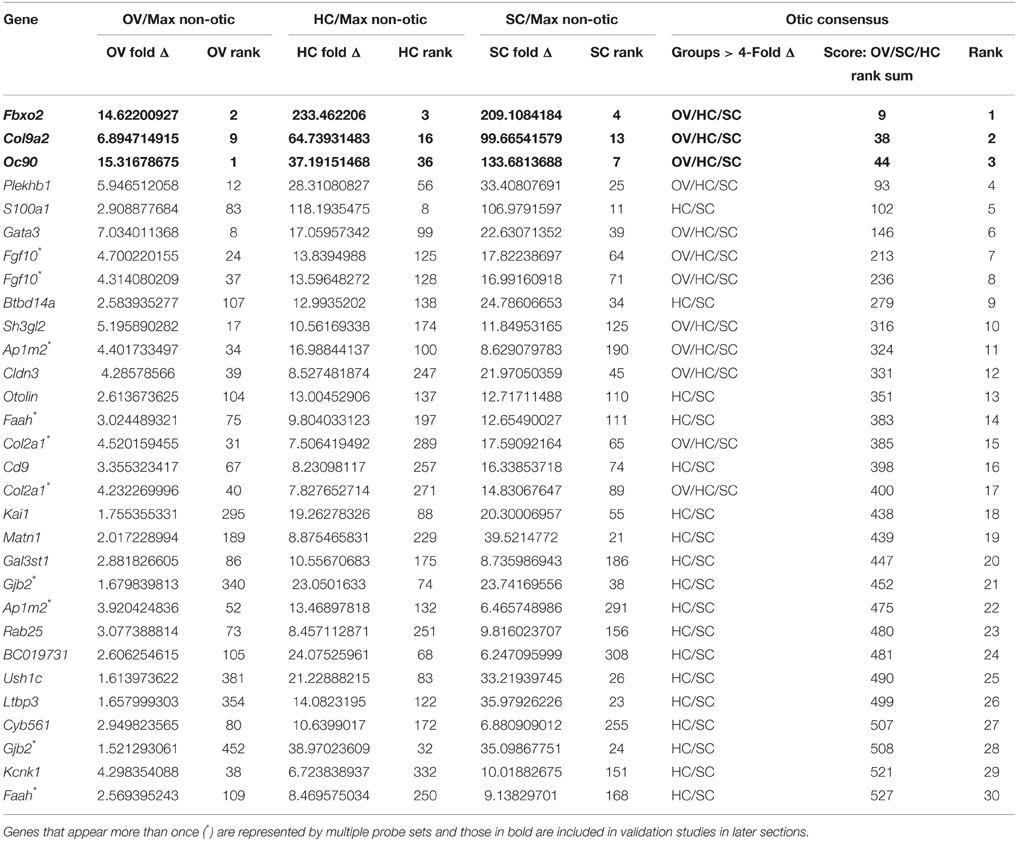
Table 3. Top 30 probes by otic consensus rank.
Analysis of Fbxo2/Fbx2 Expression in the Developing Mouse
Fbxo2 was the highest-ranking gene based on otic consensus score and was in the top five probes for each of the otic rankings (rank 2 in OVs, 3 in SCs, and 4 in HCs). Fbxo2 encodes the F-box ubiquitin ligase F-Box 2 (Fbx2) and previous studies have shown that this protein is strongly expressed in juvenile and adult mouse and guinea pig cochlea (Thalmann et al., 1997; Henzl et al., 2001, 2004; Nelson et al., 2007). Mice with targeted deletion of Fbxo2 exhibit age-related cochlear degeneration with hearing loss beginning at 2 months, and the only deficiency observed is the inner ear phenotype, suggesting specificity (Nelson et al., 2007). These studies indicate that Fbx2 functions to ensure protein quality control required for cochlear homeostasis. While expression of Fbx2 was described in the mature cochlea in the above studies, the developmental expression pattern has not been reported. Thus, we used an antibody against mouse Fbx2 to assess expression in the developing mouse, with whole mount preparations as well as tissue sections. We labeled whole embryos at early stages of otic development with anti-Fbx2 and anti-Sox2, optically cleared samples with the Scale method (Hama et al., 2011), and generated confocal z-stacks to assess expression in toto (Figures 4, 5). At E10.5, Fbx2 expression was robust throughout the OV including the Sox2+ prosensory and neurogenic domains and was undetectable in nearly all non-otic tissues (Figures 4A–C″). Sox2, which was not upregulated in the OV compared to the rest of the embryo based on the microarray, is broadly expressed in the developing central nervous system. An E11 otic vesicle stained for Fbx2 and Sox10 shows strong Fbx2 expression in the OV and lower levels of expression in delaminating cochleovestibular neuroblasts as well as the ninth cranial nerve ganglia (Figures 4D–E″). At E12.5, Fbx2 was detected only in the developing inner ear, where it was expressed throughout the membranous labyrinth (Figures 5A,B″), including prosensory epithelial regions that express Sox2 and contain Tuj1-labeled neurites (Figures 5C–C″). We stained for Fbx2 in tissue sections of embryos at E16.5 and E18.5 and co-labeled with antibodies to the prosensory/sensory domain markers Sox2 and Jag1 (Figure 6). Similar to earlier stages, expression of Fbx2 was strongly restricted to the otocyst-derived epithelium when compared broadly to the rest of the embryo in sagittal sections at E16.5 (Figure 6A). In the cochlea, Fbx2 was localized to the floor of the duct, including and flanking the sensory region marked by expression of Sox2 (Figure 6B) and Jag1 (Figures 6C–C″) and clearly expressed in both the young hair cells and supporting cells. In the vestibular epithelia including the saccule and crista, Fbx2 was also expressed in sensory regions, including hair cells and supporting cells (Figures 6D–E″).
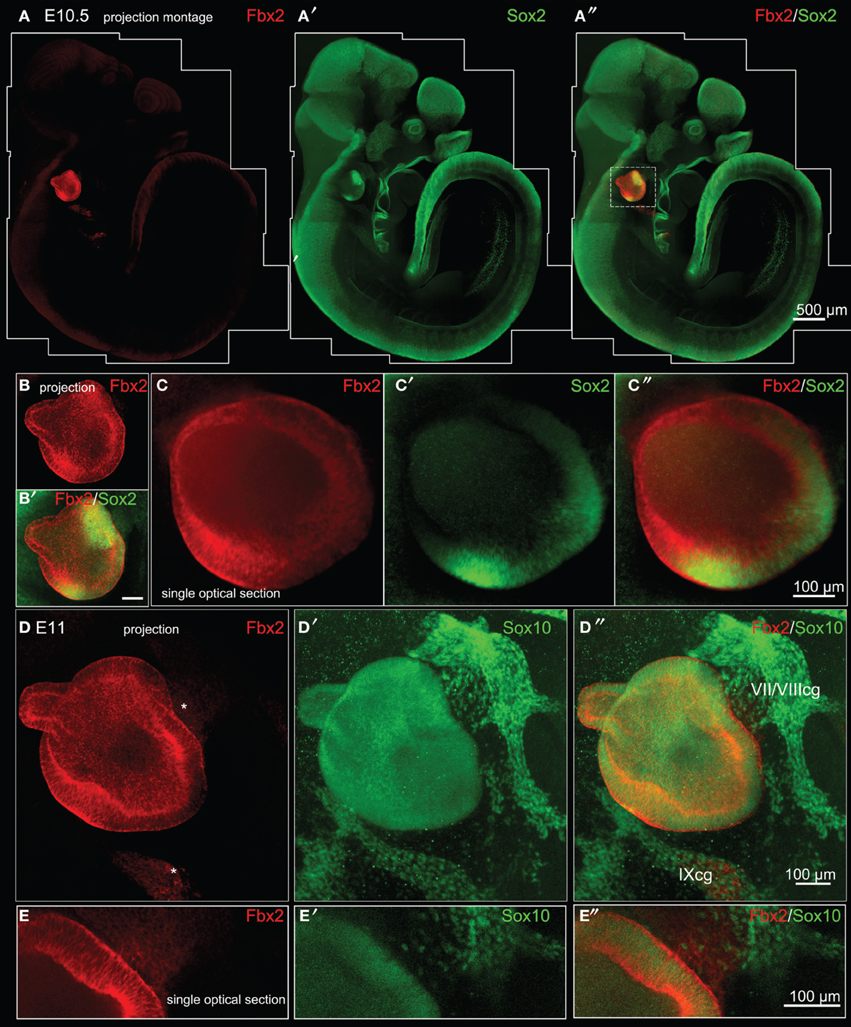
Figure 4. Fbxo2/Fbx2 expression in whole embryos at E10.5–E11. Whole mount immunohistochemistry was performed with the antibodies indicated and embryos were imaged with confocal microscopy. Fbx2 expression is shown in red, with Sox2 at E10.5 (A–C″) and Sox10 at E11 (D–E″) in green. Fbx2 expression is strong in the otic vesicle epithelia and less intense expression is also noted (asterisks) in the neurons delaminating to the cochleovestibular and ninth cranial ganglia (VII/VIIIcg and IXcg).
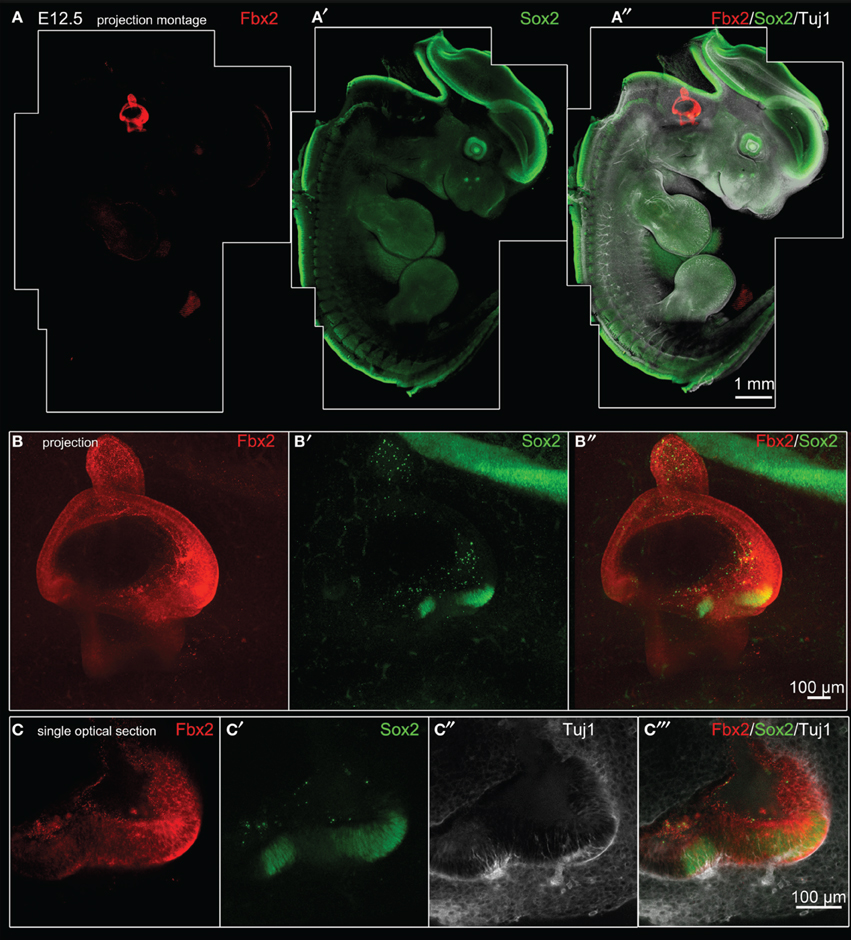
Figure 5. Fbxo2/Fbx2 expression in whole embryos at E12.5. Whole mount immunohistochemistry was performed with the antibodies indicated and embryos were imaged with confocal microscopy. Fbx2 expression is shown in red, with Sox2 in green, and Tuj1 in white. (A–A″) Merged montages of maximum intensity z projections of confocal image stacks of a whole E12.5 embryo. (B–B″) show a projected stack of images through the otocyst region of the embryo shown in (A). Sox2 expression is seen in two bright vestibular prosensory patches in the anterior region of the vestibule, while Sox2 expression in other prosensory domains (such as posterior vestibule or cochlea areas) are not visible in this projection due to lower intensity signal and attenuation from optical density of the tissue. (C–C″) Single optical sections through the anterior vestibular prosensory patches showing Fbx2-positive epithelia contain prosensory domains expressing bright Sox2 and containing Tuj1-labeled neurites.
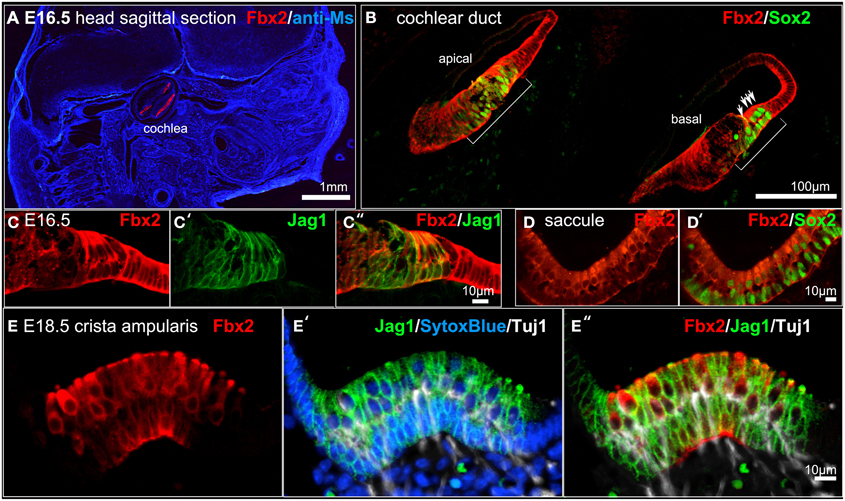
Figure 6. Fbxo2/Fbx2 expression in tissue sections at E16.5–E18.5. Immunohistochemistry was performed with the antibodies indicated and embryos were imaged with confocal microscopy. Fbx2 expression is shown in red and additional antibodies or counter stains are shown in the colors indicated. (A) E16.5 sagittal head section immunolabeled for Fbx2 with anti-mouse IgG (blue) as a background stain. E16.5 cochlea (B–C″), saccule (D,D′), and E18.5 crista (E–E″) stained as indicated.
Analysis of Col9a2/Col9a2 Expression in the Developing Mouse
Col9a2 held the second otic consensus rank, with OV/HC/SC ranks of 9, 16, and 13, respectively. Col9a2 encodes collagen alpha-2(IX), one of the three essential alpha chains of the collagen IX protein. A loss of function mutation in Col9a2 was identified as a causative locus in autosomal recessive Stickler syndrome, characterized by hearing loss and ocular, skeletal, and orofacial abnormalities (Baker et al., 2011). Type IX collagen loss in mice (caused by absence of Col9a1, which leads to functional knockout of the entire collagen IX protein, Hagg et al., 1997), causes progressive hearing loss associated with abnormal integrity of collagen fibers in the tectorial membrane (Suzuki et al., 2005). The Col9a1/2/3 genes were detected in adult mouse cochlea by RT-PCR and immunohistochemical analysis with a polyclonal antibody against type IX collagen indicated possible expression in the tectorial membrane (Asamura et al., 2005). Developmental expression of type IX collagen has not been investigated in the inner ear so we performed immunohistochemical analysis using a Col9a2-specific antibody to evaluate embryo-wide expression patterns (Figure 7). At E10.5, in a whole embryo preparation, Col9a2 immunofluorescence is prominent in the OV and is also visible in the branchial epithelia and pronephros (Figures 7A–B′). The signal is broad throughout most of the OV with reduced expression in the dorsal region (Figures 7C,C′). In P6 cochlea sections Col9a2 immunoreactivity is strong in the greater epithelial ridge (GER)/spiral limbus, tectorial membrane, organ of Corti, and spiral ligament (Figures 7D–E″). A closer look at the organ of Corti shows a strong signal in the basilar membrane as well as tunnel of Corti/pillar cell region and a less intense signal in hair cells (Figures 7E–E″).
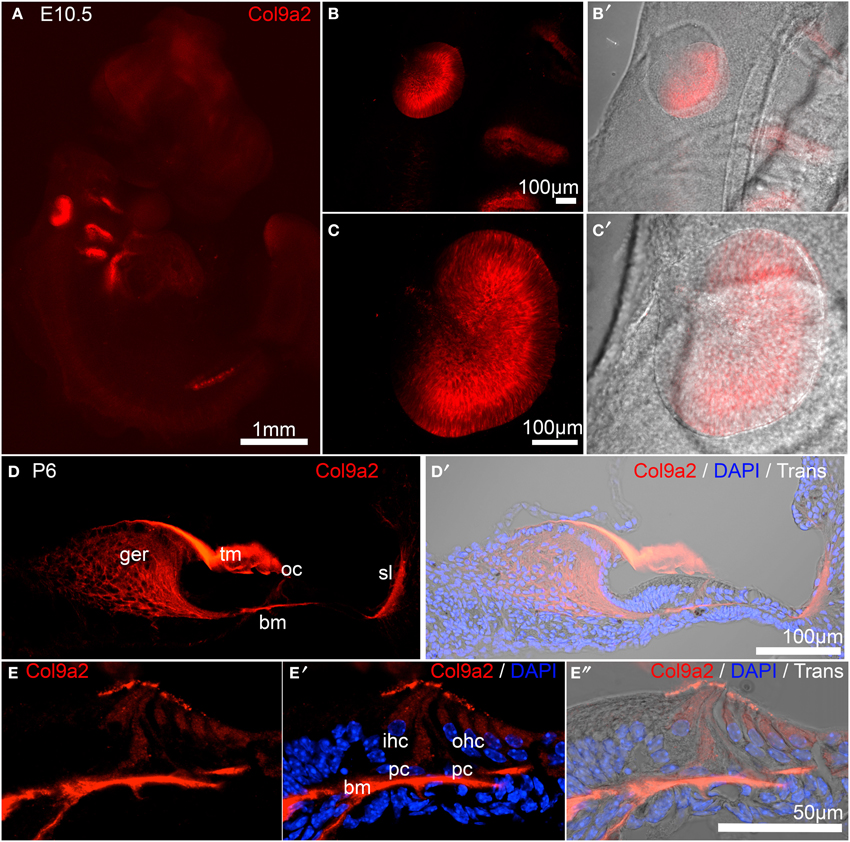
Figure 7. Col9a2 expression in whole E10.5 embryo and neonatal cochlea. Col9a2 immunoreactivity is shown in red in E10.5 whole embryo (A). Higher magnification views show the pattern of reactivity in the OV and surrounding tissues (B–C′). (D,D′) A cochlea cryosection at P6 shows Col9a2 immunoreactivity in the tectorial membrane, greater epithelial ridge/spiral limbus, organ of Corti, and spiral ligament. (E–E″) A higher magnification view of a similar section of the organ of Corti with the tectorial membrane removed (to better image the lower intensity signal in the organ of Corti) shows the Col9a2 signal in the basilar membrane, pillar cells and the developing tunnel of Corti, and inner and outer hair cells. Abbreviations: ger, greater epithelial ridge; tm, tectorial membrane; oc, organ of Corti; sl, spiral ligament; bm, basilar membrane.
Analysis of Oc90 Expression in the Developing Mouse
Oc90 was the highest ranked probe by OV fold Δ and the third ranked by otic consensus score. Oc90 (Ocn-95, PLA2L) encodes a 95-kDa secreted glycoprotein initially identified due to its abundant expression in the developing and adult inner ear and shown to be an essential organizer of the otoconial matrix (Wang et al., 1998; Verpy et al., 1999; Zhao et al., 2007, 2008). Consistent with earlier reports (Verpy et al., 1999), our in situ hybridization expression analysis indicated that Oc90 is highly specific to the otic vesicle at E10.5 (Figures 8A,B). At E12.5 Oc90 expression was present throughout most of the otocyst with a strong signal in the dorsal regions and less intense signal noted in the ventral domains (Figures 8C,D). In the cochlear duct at E16.5 and E18.5 we observed a wide dynamic range of Oc90 expression, with very intense signal in the roof of the cochlear duct (developing Reissner's membrane and stria vascularis) as well as weaker signal in the developing organ of Corti (Figures 8E,F). In situ hybridization is limited in capacity to evaluate expression signals across a wide dynamic range in regions of close proximity due to signal overdevelopment and saturation. Taken together with previous studies, our data suggest that expression of Oc90 is high in the otic sensory lineage as compared to most genes. Within the inner ear, Oc90 has a markedly higher expression in non-sensory otic cells, particularly in domains possibly derived from dorsal OV regions. The otic-specific expression and wide dynamic range of Oc90 in the inner ear makes this an interesting gene for regulatory studies but its dominant expression is in otic non-sensory domains, making it less useful for otic sensory lineage studies.
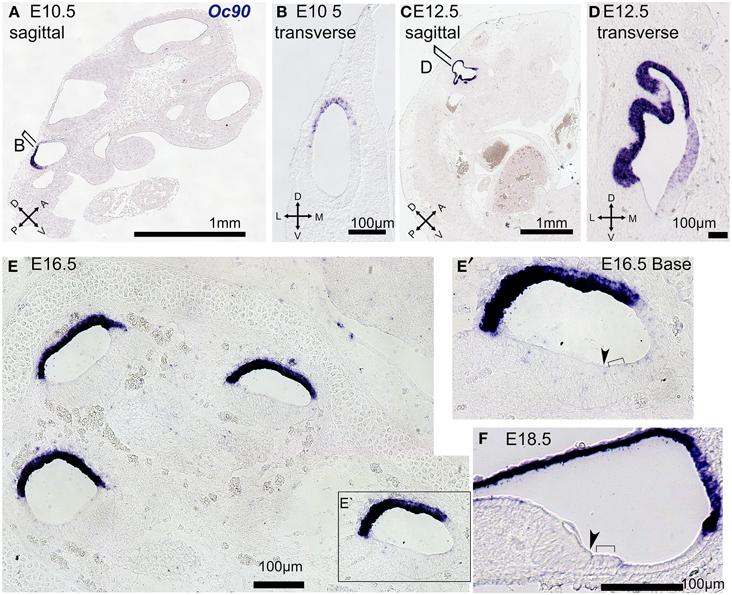
Figure 8. Oc90 expression in tissue sections at E10.5–E18.5. In situ hybridization was performed on paraffin sections at the indicated ages with antisense probe against Oc90 (blue). E10.5 embryo specimens are shown in sagittal (A) and transverse views (B) and illustrate the dorsal and posterior expression domain of Oc90 in the OV. At E12.5 the region of Oc90 expression is expanded through most of the otic epithelium, save the most ventral region, as shown in sagittal (C) and transverse views (D). (E) At E16.5 in a mid-modiolar section of the cochlea Oc90 expression is strongest in the roof of the cochlear duct but is also present at lower signal levels in the thickened epithelium of the floor, as shown in higher magnification view in (E′). (F) At E18.5 Oc90 is strong in Reissner's membrane the stria vascularis and a lower level signal is also present in the organ of Corti and some non-sensory epithelial cells. In (E′,F), inner hair cells are indicated with arrowheads and outer hair cells are indicated with brackets.
Discussion
We sought to systematically identify transcriptional features that distinguish the otic sensory lineage from other lineages of vertebrate development by employing a microarray approach to compare OV, HC, and SC populations with developmental non-otic tissues. Whole E10.5 embryos with the greater otic regions removed were used to represent a wide range of non-otic lineages from all three germ layers, and periotic tissues represented non-otic tissues proximally associated with the OV, such as dorsal neural tissues and periotic mesenchyme. The inclusion of two non-otic populations was effective for gauging dynamic range of probe intensity and identifying probes with expression domains outside of the inner ear. Multivariate analyses including PCA and Spearman's correlation demonstrated that samples from the three otic populations shared transcriptome-wide correlations in expression profiles that distinguish this lineage from non-otic populations. We further analyzed the microarray data to identify individual genes that are specifically expressed in the otic sensory lineage. Fold change comparisons of otic samples to the maximum expressing non-otic populations for each probe provided a conservative assessment of specificity and enabled ranking of probes across the dataset. Comparison of OV, HC, and SC fold changes for each probe allowed identification of otic consensus genes based on fold change thresholds. We developed otic consensus scores and rankings based on expression in individual otic categories to reduce the data to a single dimension to aid in identification of lineage-specific genes. The entire dataset is assembled in Supplemental File 1 as a searchable spreadsheet than can be sorted and further interrogated to suit the needs of individual readers.
A major motivation for this study was the previous lack of unambiguous otic sensory lineage markers, which has hindered advancement of regenerative and developmental studies. In vitro experiments aimed at producing otic progenitors and sensory epithelial cells from stem cells have had to rely on combinations of less specific markers to assay cell identities (Oshima et al., 2010; Koehler et al., 2013). Most current markers used to label potential early otic progenitor cells (i.e., Pax2/8, Gata3, Jag1, Sox2/9/10) are themselves transcription factors or signaling molecules involved in otic development. These highly conserved factors tend to be expressed in multiple embryonic lineages so coexpression of multiple markers has been used as an indication of otic identity. For example, Pax2 is expressed strongly in the otic vesicle at E10.5, but is also very abundant in the developing central nervous system and pronephros (Supplemental Figure 1A). On the other hand, Sox10 is expressed strongly in neural crest progenitors of the peripheral nervous system, but overlaps with Pax2 in the otic vesicle (Supplemental Figures 1A–A″). While coexpression of these two markers appears to be specific to the otic vesicle at this stage, this is a transient feature since Pax2 becomes downregulated in the otic sensory lineage soon after (Burton et al., 2004). Gata3 is one transcription factor that showed a high specificity to the otic sensory lineage based on our microarray analyses. This is consistent with the relatively restricted pattern of Gata3 expression observed in E10.5 mouse embryos (Supplemental Figure 1B). While the non-otic expression of Gata3 is not as prominent as with Pax2 or Sox10, domains of varying intensities are present in the central nervous system and pronephros, though generally weaker than in the otic vesicle. Coexpression of Gata3 and Fbx2 occurs exclusively in the otic vesicle at E10.5 (Supplemental Figures 1B–B″) and these markers both persist in the otic sensory lineage through later stages of development (Figure 6 and Luo et al., 2013).
Our study differs from most earlier microarray studies of the inner ear in its design as a comparative analysis of specific otic sensory lineage populations to a broad representation of non-otic lineages. Most of earlier analyses were conducted without comparative populations to other tissues. Many were designed to compare expression between wild type and mutant animals or between different tissues of the inner ear, such as at different ages or between the base and apex of the cochlea, or after insult (for review see Hertzano and Elkon, 2012). The most highly comprehensive microarray analysis of mouse inner ear morphogenesis included a total of 29 finely dissected inner ear samples in duplicate from E9 to E15 (Sajan et al., 2007). This study also included three samples designated as non-inner ear collected from areas in close proximity to the inner ear tissues pooled at E9, E9.5–10.5, and E11–15. These included neural tissue as well as mesenchyme, similar to the periotic tissue group used in this report. In another study aimed at identification of early otic-specific transcripts, cDNA subtractions of mouse otic vesicle against adult liver cDNA were used to identify candidate genes (Powles et al., 2004). Our use of whole embryos with the greater otic regions removed provided an inclusive representation of non-otic developmental lineages. While our findings indicate whole embryo-minus-otic tissue is an effective general non-otic reference population it has limitations in identifying genes expressed in smaller subsets of cells. We included periotic tissues as a separate non-otic population, which enabled us to gauge dynamic range of probes and evaluate the likelihood of non-otic expression domains based on differential expression between non-otic groups. Future studies may improve sensitivity of non-otic reference samples through further division of embryo tissue into a larger set of non-otic sample groups from smaller domains as well as from different stages of development.
Another feature distinguishing the current study is our use of data representing purified populations of HCs and SCs in combination with data from OV tissues to evaluate expression in distinct branches of the lineage before and after bifurcation of HC and SC fates. As the goal of this study was not to specifically search for genes that are exclusive for distinct otic lineages, we succeeded in the identification of markers that are much more restricted to the developing inner ear than those previously identified. The conditions that we chose for the top ranking genes were guided by restriction to the otic lineage at E10.5 and further by enrichment in hair cells and supporting cells in the neonatal cochlea.
Our analysis identified and ranked top otic sensory lineage-specific transcripts including Fbxo2, Col9a2, and Oc90. We verified otic-specific expression of these genes using immunohistochemistry and in situ hybridization, which revealed novel expression patterns and concurred with the array data. Fbxo2/Fbx2 showed the most striking pattern of specificity to the otic sensory lineage. Although Fbx2 expression has been reported in neuronal populations of the CNS (Eom et al., 2004) our analysis identified very few regions of expression outside of the inner ear and none with the robust intensity found in otic tissues. A likely explanation is that Fbxo2 is expressed in some non-otic cell types, but at a very low level compared to the otic vesicle. The lack of any phenotype in Fbxo2 null mice besides selective cochlear degeneration is evidence that this gene is functionally specific to the inner ear (Nelson et al., 2007). From our study it is clear that both at the transcript level and the protein level Fbxo2 stands out from all other genes as a highly specific and robust marker of the otic sensory lineage. This feature elevates Fbxo2 to an important gene for future studies of otic sensory lineage development and gene regulation. Col9a2 also showed highly specific expression in the otic sensory lineage at both the transcript and protein levels. Compared to Fbxo2 and Oc90, Col9a2 is not as highly restricted to the otic sensory lineage as it is also expressed in branchial epithelia and pronephros (Figures 7A–B′). Col9a2 expression is initially robust in the OV epithelial cells and in the neonatal cochlea becomes organized largely in extracellular domains, including the tectorial and basilar membranes and the tunnel of Corti. We were unable to achieve adequate performance from a Col9a2 probe for in situ hybridization in order to evaluate transcript levels in the organ of Corti, but this gene would be an interesting choice for future studies with a reporter mouse model. Oc90 expression is highly specific to the inner ear and includes the sensory lineage populations but is actually expressed at even higher levels in non-sensory otic cells. The array data show Oc90 at robust levels in the OV as well as HCs and SCs as compared to the non-otic samples. In situ hybridization also confirms highly specific expression of Oc90 in the OV and, although expression is detectable in sensory progenitors of the organ of Corti, the strongest region of Oc90 expression is found in non-sensory otic cells. This could be reflective of a very broad dynamic range of Oc90 expression in the neonatal cochlea combined with a highly sensitive microarray probe, detecting the gene robustly in P3 HCs and SCs, and very low expression in the non-otic tissue groups resulting in a high rank for Oc90 in HCs and SCs despite even higher expression of this gene in other cells. Beside Fbxo2, Col9a2, and Oc90, our analysis has revealed additional candidate novel otic sensory lineage genes and provided comparative expression data for quite a few well-known otic genes. Novel genes that show high-ranking consensus expression in the otic sensory lineage populations, such as Plekhb1, Btbd14a, Ap1m2, Kai1, and Faah, would be excellent candidates for further studies of gene expression and function in this lineage. Additionally the results of this study will aid in the design of experiments that require carefully selected lists of genes to assay for cell identity. For example, we used these data to inform the design of the 96-gene expression assay applied in recent work using single cell analysis of individual OV cells to reconstruct the otocyst and early neuroblast lineages in silico (Durruthy-Durruthy et al., 2014).
Conflict of Interest Statement
The authors declare that the research was conducted in the absence of any commercial or financial relationships that could be construed as a potential conflict of interest.
Acknowledgments
We thank Andy Groves for consulting on this project, members of the Heller lab for constructive comments, Saku Sinkkonen and coauthors for P3 Cochlea array datasets (Sinkkonen et al., 2011), the Stanford DNA Microarray Core Facility for hybridization and scanning of the E10.5 tissue samples, and A. Kato and D. Bredt for Fbx2 antibodies. Imaging was performed at the Stanford OHNS Imaging Core Facility and supported by core grant P30DC010363-03. Funding was provided by NIH grants RO1DC006167 (SH), NRSA F32DC013210 (BH), and an NIH Pediatric Research LRP award (BH).
Supplementary Material
The Supplementary Material for this article can be found online at: http://www.frontiersin.org/journal/10.3389/fncel.2015.00079/abstract
Supplementary Figure 1. E10.5 whole embryo immunohistochemistry. (A–A″) Pax2 and Sox10 as indicated. (B–B″) Gata3 and Fbx2 as indicated.
References
Anderson, W. J., Zhou, Q., Alcalde, V., Kaneko, O. F., Blank, L. J., Sherwood, R. I., et al. (2008). Genetic targeting of the endoderm with claudin-6CreER. Dev. Dyn. 237, 504–512. doi: 10.1002/dvdy.21437
PubMed Abstract | Full Text | CrossRef Full Text | Google Scholar
Asamura, K., Abe, S., Imamura, Y., Aszodi, A., Suzuki, N., Hashimoto, S., et al. (2005). Type IX collagen is crucial for normal hearing. Neuroscience 132, 493–500. doi: 10.1016/j.neuroscience.2005.01.013
PubMed Abstract | Full Text | CrossRef Full Text | Google Scholar
Baker, S., Booth, C., Fillman, C., Shapiro, M., Blair, M. P., Hyland, J. C., et al. (2011). A loss of function mutation in the COL9A2 gene causes autosomal recessive Stickler syndrome. Am. J. Med. Genet. A 155A, 1668–1672. doi: 10.1002/ajmg.a.34071
PubMed Abstract | Full Text | CrossRef Full Text | Google Scholar
Barrionuevo, F., Naumann, A., Bagheri-Fam, S., Speth, V., Taketo, M. M., Scherer, G., et al. (2008). Sox9 is required for invagination of the otic placode in mice. Dev. Biol. 317, 213–224. doi: 10.1016/j.ydbio.2008.02.011
PubMed Abstract | Full Text | CrossRef Full Text | Google Scholar
Benjamini, Y., and Hochberg, Y. (1995). Controlling the false discovery rate—a practical and powerful approach to multiple testing. J. R. Stat. Soc. Ser. B Methodol. 57, 289–300.
Benjamini, Y., and Yekutieli, D. (2005). False discovery rate-adjusted multiple confidence intervals for selected parameters. J. Am. Stat. Assoc. 100, 71–81. doi: 10.1198/016214504000001907
Bolstad, B. M., Irizarry, R. A., Astrand, M., and Speed, T. P. (2003). A comparison of normalization methods for high density oligonucleotide array data based on variance and bias. Bioinformatics 19, 185–193. doi: 10.1093/bioinformatics/19.2.185
PubMed Abstract | Full Text | CrossRef Full Text | Google Scholar
Burton, Q., Cole, L. K., Mulheisen, M., Chang, W., and Wu, D. K. (2004). The role of Pax2 in mouse inner ear development. Dev. Biol. 272, 161–175. doi: 10.1016/j.ydbio.2004.04.024
PubMed Abstract | Full Text | CrossRef Full Text | Google Scholar
Chen, J., and Streit, A. (2013). Induction of the inner ear: stepwise specification of otic fate from multipotent progenitors. Hear. Res. 297, 3–12. doi: 10.1016/j.heares.2012.11.018
PubMed Abstract | Full Text | CrossRef Full Text | Google Scholar
Dalman, M. R., Deeter, A., Nimishakavi, G., and Duan, Z. H. (2012). Fold change and p-value cutoffs significantly alter microarray interpretations. BMC Bioinformatics 13(Suppl. 2):S11. doi: 10.1186/1471-2105-13-S2-S11
PubMed Abstract | Full Text | CrossRef Full Text | Google Scholar
Dominguez-Frutos, E., Vendrell, V., Alvarez, Y., Zelarayan, L. C., Lopez-Hernandez, I., Ros, M., et al. (2009). Tissue-specific requirements for FGF8 during early inner ear development. Mech. Dev. 126, 873–881. doi: 10.1016/j.mod.2009.07.004
PubMed Abstract | Full Text | CrossRef Full Text | Google Scholar
Durruthy-Durruthy, R., Gottlieb, A., Hartman, B. H., Waldhaus, J., Laske, R. D., Altman, R., et al. (2014). Reconstruction of the mouse otocyst and early neuroblast lineage at single-cell resolution. Cell 157, 964–978. doi: 10.1016/j.cell.2014.03.036
PubMed Abstract | Full Text | CrossRef Full Text | Google Scholar
Eom, C. Y., Heo, W. D., Craske, M. L., Meyer, T., and Lehman, I. R. (2004). The neural F-box protein NFB42 mediates the nuclear export of the herpes simplex virus type 1 replication initiator protein (UL9 protein) after viral infection. Proc. Natl. Acad. Sci. U.S.A. 101, 4036–4040. doi: 10.1073/pnas.0400738101
PubMed Abstract | Full Text | CrossRef Full Text | Google Scholar
Failli, V., Bachy, I., and Retaux, S. (2002). Expression of the LIM-homeodomain gene Lmx1a (dreher) during development of the mouse nervous system. Mech. Dev. 118, 225–228. doi: 10.1016/S0925-4773(02)00254-X
PubMed Abstract | Full Text | CrossRef Full Text | Google Scholar
Freter, S., Muta, Y., O'Neill, P., Vassilev, V. S., Kuraku, S., and Ladher, R. K. (2012). Pax2 modulates proliferation during specification of the otic and epibranchial placodes. Dev. Dyn. 241, 1716–1728. doi: 10.1002/dvdy.23856
PubMed Abstract | Full Text | CrossRef Full Text | Google Scholar
Hagg, R., Hedbom, E., Mollers, U., Aszodi, A., Fassler, R., and Bruckner, P. (1997). Absence of the alpha1(IX) chain leads to a functional knock-out of the entire collagen IX protein in mice. J. Biol. Chem. 272, 20650–20654. doi: 10.1074/jbc.272.33.20650
PubMed Abstract | Full Text | CrossRef Full Text | Google Scholar
Hama, H., Kurokawa, H., Kawano, H., Ando, R., Shimogori, T., Noda, H., et al. (2011). Scale: a chemical approach for fluorescence imaging and reconstruction of transparent mouse brain. Nat. Neurosci. 14, 1481–1488. doi: 10.1038/nn.2928
PubMed Abstract | Full Text | CrossRef Full Text | Google Scholar
Hammond, K. L., and Whitfield, T. T. (2011). Fgf and Hh signalling act on a symmetrical pre-pattern to specify anterior and posterior identity in the zebrafish otic placode and vesicle. Development 138, 3977–3987. doi: 10.1242/dev.066639
PubMed Abstract | Full Text | CrossRef Full Text | Google Scholar
Hans, S., Liu, D., and Westerfield, M. (2004). Pax8 and Pax2a function synergistically in otic specification, downstream of the Foxi1 and Dlx3b transcription factors. Development 131, 5091–5102. doi: 10.1242/dev.01346
PubMed Abstract | Full Text | CrossRef Full Text | Google Scholar
Hartman, B. H., Hayashi, T., Nelson, B. R., Bermingham-McDonogh, O., and Reh, T. A. (2007). Dll3 is expressed in developing hair cells in the mammalian cochlea. Dev. Dyn. 236, 2875–2883. doi: 10.1002/dvdy.21307
PubMed Abstract | Full Text | CrossRef Full Text | Google Scholar
Hartman, B. H., Reh, T. A., and Bermingham-McDonogh, O. (2010). Notch signaling specifies prosensory domains via lateral induction in the developing mammalian inner ear. Proc. Natl. Acad. Sci. U.S.A. 107, 15792–15797. doi: 10.1073/pnas.1002827107
PubMed Abstract | Full Text | CrossRef Full Text | Google Scholar
Henzl, M. T., O'Neal, J., Killick, R., Thalmann, I., and Thalmann, R. (2001). OCP1, an F-box protein, co-localizes with OCP2/SKP1 in the cochlear epithelial gap junction region. Hear. Res. 157, 100–111. doi: 10.1016/S0378-5955(01)00285-4
PubMed Abstract | Full Text | CrossRef Full Text | Google Scholar
Henzl, M. T., Thalmann, I., Larson, J. D., Ignatova, E. G., and Thalmann, R. (2004). The cochlear F-box protein OCP1 associates with OCP2 and connexin 26. Hear. Res. 191, 101–109. doi: 10.1016/j.heares.2004.01.005
PubMed Abstract | Full Text | CrossRef Full Text | Google Scholar
Hertzano, R., and Elkon, R. (2012). High throughput gene expression analysis of the inner ear. Hear. Res. 288, 77–88. doi: 10.1016/j.heares.2012.01.002
PubMed Abstract | Full Text | CrossRef Full Text | Google Scholar
Jayasena, C. S., Ohyama, T., Segil, N., and Groves, A. K. (2008). Notch signaling augments the canonical Wnt pathway to specify the size of the otic placode. Development 135, 2251–2261. doi: 10.1242/dev.017905
PubMed Abstract | Full Text | CrossRef Full Text | Google Scholar
Kato, A., Rouach, N., Nicoll, R. A., and Bredt, D. S. (2005). Activity-dependent NMDA receptor degradation mediated by retrotranslocation and ubiquitination. Proc. Natl. Acad. Sci. U.S.A. 102, 5600–5605. doi: 10.1073/pnas.0501769102
PubMed Abstract | Full Text | CrossRef Full Text | Google Scholar
Koehler, K. R., Mikosz, A. M., Molosh, A. I., Patel, D., and Hashino, E. (2013). Generation of inner ear sensory epithelia from pluripotent stem cells in 3D culture. Nature 500, 217–221. doi: 10.1038/nature12298
PubMed Abstract | Full Text | CrossRef Full Text | Google Scholar
Kollmar, R., Nakamura, S. K., Kappler, J. A., and Hudspeth, A. J. (2001). Expression and phylogeny of claudins in vertebrate primordia. Proc. Natl. Acad. Sci. U.S.A. 98, 10196–10201. doi: 10.1073/pnas.171325898
PubMed Abstract | Full Text | CrossRef Full Text | Google Scholar
Lillevali, K., Haugas, M., Matilainen, T., Pussinen, C., Karis, A., and Salminen, M. (2006). Gata3 is required for early morphogenesis and Fgf10 expression during otic development. Mech. Dev. 123, 415–429. doi: 10.1016/j.mod.2006.04.007
PubMed Abstract | Full Text | CrossRef Full Text | Google Scholar
Liu, D., Chu, H., Maves, L., Yan, Y. L., Morcos, P. A., Postlethwait, J. H., et al. (2003). Fgf3 and Fgf8 dependent and independent transcription factors are required for otic placode specification. Development 130, 2213–2224. doi: 10.1242/dev.00445
PubMed Abstract | Full Text | CrossRef Full Text | Google Scholar
Luo, X. J., Deng, M., Xie, X., Huang, L., Wang, H., Jiang, L., et al. (2013). GATA3 controls the specification of prosensory domain and neuronal survival in the mouse cochlea. Hum. Mol. Genet. 22, 3609–3623. doi: 10.1093/hmg/ddt212
PubMed Abstract | Full Text | CrossRef Full Text | Google Scholar
Mailleux, A. A., Kelly, R., Veltmaat, J. M., De Langhe, S. P., Zaffran, S., Thiery, J. P., et al. (2005). Fgf10 expression identifies parabronchial smooth muscle cell progenitors and is required for their entry into the smooth muscle cell lineage. Development 132, 2157–2166. doi: 10.1242/dev.01795
PubMed Abstract | Full Text | CrossRef Full Text | Google Scholar
Nelson, R. F., Glenn, K. A., Zhang, Y., Wen, H., Knutson, T., Gouvion, C. M., et al. (2007). Selective cochlear degeneration in mice lacking the F-box protein, Fbx2, a glycoprotein-specific ubiquitin ligase subunit. J. Neurosci. 27, 5163–5171. doi: 10.1523/JNEUROSCI.0206-07.2007
PubMed Abstract | Full Text | CrossRef Full Text | Google Scholar
Nichols, D. H., Pauley, S., Jahan, I., Beisel, K. W., Millen, K. J., and Fritzsch, B. (2008). Lmx1a is required for segregation of sensory epithelia and normal ear histogenesis and morphogenesis. Cell Tissue Res. 334, 339–358. doi: 10.1007/s00441-008-0709-2
PubMed Abstract | Full Text | CrossRef Full Text | Google Scholar
Ohazama, A., Haworth, K. E., Ota, M. S., Khonsari, R. H., and Sharpe, P. T. (2010). Ectoderm, endoderm, and the evolution of heterodont dentitions. Genesis 48, 382–389. doi: 10.1002/dvg.20634
PubMed Abstract | Full Text | CrossRef Full Text | Google Scholar
Ohuchi, H., Nakagawa, T., Yamamoto, A., Araga, A., Ohata, T., Ishimaru, Y., et al. (1997). The mesenchymal factor, FGF10, initiates and maintains the outgrowth of the chick limb bud through interaction with FGF8, an apical ectodermal factor. Development 124, 2235–2244.
Oshima, K., Shin, K., Diensthuber, M., Peng, A. W., Ricci, A. J., and Heller, S. (2010). Mechanosensitive hair cell-like cells from embryonic and induced pluripotent stem cells. Cell 141, 704–716. doi: 10.1016/j.cell.2010.03.035
PubMed Abstract | Full Text | CrossRef Full Text | Google Scholar
Powles, N., Babbs, C., Ficker, M., Schimmang, T., and Maconochie, M. (2004). Identification and analysis of genes from the mouse otic vesicle and their association with developmental subprocesses through in situ hybridization. Dev. Biol. 268, 24–38. doi: 10.1016/j.ydbio.2003.11.024
PubMed Abstract | Full Text | CrossRef Full Text | Google Scholar
Sajan, S. A., Warchol, M. E., and Lovett, M. (2007). Toward a systems biology of mouse inner ear organogenesis: gene expression pathways, patterns and network analysis. Genetics 177, 631–653. doi: 10.1534/genetics.107.078584
PubMed Abstract | Full Text | CrossRef Full Text | Google Scholar
Schlosser, G. (2014). Early embryonic specification of vertebrate cranial placodes. Wiley Interdiscip. Rev. Dev. Biol. 3, 349–363. doi: 10.1002/wdev.142
PubMed Abstract | Full Text | CrossRef Full Text | Google Scholar
Sekerkova, G., Zheng, L., Mugnaini, E., and Bartles, J. R. (2006). Differential expression of espin isoforms during epithelial morphogenesis, stereociliogenesis and postnatal maturation in the developing inner ear. Dev. Biol. 291, 83–95. doi: 10.1016/j.ydbio.2005.12.021
PubMed Abstract | Full Text | CrossRef Full Text | Google Scholar
Sinkkonen, S. T., Chai, R., Jan, T. A., Hartman, B. H., Laske, R. D., Gahlen, F., et al. (2011). Intrinsic regenerative potential of murine cochlear supporting cells. Sci. Rep. 1, 26. doi: 10.1038/srep00026
PubMed Abstract | Full Text | CrossRef Full Text | Google Scholar
Smyth, G. K. (2004). Linear models and empirical bayes methods for assessing differential expression in microarray experiments. Stat. Appl. Genet. Mol. Biol. 3, Article3. doi: 10.2202/1544-6115.1027
PubMed Abstract | Full Text | CrossRef Full Text | Google Scholar
Suzuki, N., Asamura, K., Kikuchi, Y., Takumi, Y., Abe, S., Imamura, Y., et al. (2005). Type IX collagen knock-out mouse shows progressive hearing loss. Neurosci. Res. 51, 293–298. doi: 10.1016/j.neures.2004.12.001
PubMed Abstract | Full Text | CrossRef Full Text | Google Scholar
Tamplin, O. J., Kinzel, D., Cox, B. J., Bell, C. E., Rossant, J., and Lickert, H. (2008). Microarray analysis of Foxa2 mutant mouse embryos reveals novel gene expression and inductive roles for the gastrula organizer and its derivatives. BMC Genomics 9:511. doi: 10.1186/1471-2164-9-511
PubMed Abstract | Full Text | CrossRef Full Text | Google Scholar
Thalmann, R., Henzl, M. T., Killick, R., Ignatova, E. G., and Thalmann, I. (2003). Toward an understanding of cochlear homeostasis: the impact of location and the role of OCP1 and OCP2. Acta Otolaryngol. 123, 203–208. doi: 10.1080/0036554021000028100
PubMed Abstract | Full Text | CrossRef Full Text | Google Scholar
Thalmann, R., Henzl, M. T., and Thalmann, I. (1997). Specific proteins of the organ of Corti. Acta Otolaryngol. 117, 265–268. doi: 10.3109/00016489709117784
PubMed Abstract | Full Text | CrossRef Full Text | Google Scholar
Vendrell, V., Vazquez-Echeverria, C., Lopez-Hernandez, I., Alonso, B. D., Martinez, S., Pujades, C., et al. (2013). Roles of Wnt8a during formation and patterning of the mouse inner ear. Mech. Dev. 130, 160–168. doi: 10.1016/j.mod.2012.09.009
PubMed Abstract | Full Text | CrossRef Full Text | Google Scholar
Verpy, E., Leibovici, M., and Petit, C. (1999). Characterization of otoconin-95, the major protein of murine otoconia, provides insights into the formation of these inner ear biominerals. Proc. Natl. Acad. Sci. U.S.A. 96, 529–534. doi: 10.1073/pnas.96.2.529
PubMed Abstract | Full Text | CrossRef Full Text | Google Scholar
Wang, Y., Kowalski, P. E., Thalmann, I., Ornitz, D. M., Mager, D. L., and Thalmann, R. (1998). Otoconin-90, the mammalian otoconial matrix protein, contains two domains of homology to secretory phospholipase A2. Proc. Natl. Acad. Sci. U.S.A. 95, 15345–15350. doi: 10.1073/pnas.95.26.15345
PubMed Abstract | Full Text | CrossRef Full Text | Google Scholar
Xu, P. X., Adams, J., Peters, H., Brown, M. C., Heaney, S., and Maas, R. (1999). Eya1-deficient mice lack ears and kidneys and show abnormal apoptosis of organ primordia. Nat. Genet. 23, 113–117. doi: 10.1038/12722
PubMed Abstract | Full Text | CrossRef Full Text | Google Scholar
Zhao, X., Jones, S. M., Yamoah, E. N., and Lundberg, Y. W. (2008). Otoconin-90 deletion leads to imbalance but normal hearing: a comparison with other otoconia mutants. Neuroscience 153, 289–299. doi: 10.1016/j.neuroscience.2008.01.055
PubMed Abstract | Full Text | CrossRef Full Text | Google Scholar
Zhao, X., Yang, H., Yamoah, E. N., and Lundberg, Y. W. (2007). Gene targeting reveals the role of Oc90 as the essential organizer of the otoconial organic matrix. Dev. Biol. 304, 508–524. doi: 10.1016/j.ydbio.2007.01.013
PubMed Abstract | Full Text | CrossRef Full Text | Google Scholar
Zheng, W., Huang, L., Wei, Z. B., Silvius, D., Tang, B., and Xu, P. X. (2003). The role of Six1 in mammalian auditory system development. Development 130, 3989–4000. doi: 10.1242/dev.00628
PubMed Abstract | Full Text | CrossRef Full Text | Google Scholar
Zou, D., Silvius, D., Rodrigo-Blomqvist, S., Enerback, S., and Xu, P. X. (2006). Eya1 regulates the growth of otic epithelium and interacts with Pax2 during the development of all sensory areas in the inner ear. Dev. Biol. 298, 430–441. doi: 10.1016/j.ydbio.2006.06.049
PubMed Abstract | Full Text | CrossRef Full Text | Google Scholar
Keywords: cochlea, vestibular, microarray, inner ear, transcriptome
Citation: Hartman BH, Durruthy-Durruthy R, Laske RD, Losorelli S and Heller S (2015) Identification and characterization of mouse otic sensory lineage genes. Front. Cell. Neurosci. 9:79. doi: 10.3389/fncel.2015.00079
Received: 19 December 2014; Accepted: 22 February 2015;
Published: 19 March 2015.
Edited by:
Andy Groves, Baylor College of Medicine, USAReviewed by:
Ronna Hertzano, University of Maryland School of Medicine, USADoris Wu, National Institutes of Health, USA
Copyright © 2015 Hartman, Durruthy-Durruthy, Laske, Losorelli and Heller. This is an open-access article distributed under the terms of the Creative Commons Attribution License (CC BY). The use, distribution or reproduction in other forums is permitted, provided the original author(s) or licensor are credited and that the original publication in this journal is cited, in accordance with accepted academic practice. No use, distribution or reproduction is permitted which does not comply with these terms.
*Correspondence: Byron H. Hartman and Stefan Heller, Department of Otolaryngology, Head and Neck Surgery, Stanford University School of Medicine, 300 Pasteur Drive, Edwards R213 Stanford, CA 94305, USA byronh@stanford.edu; hellers@stanford.edu