A Novel Method for the Description of Voltage-Gated Ionic Currents Based on Action Potential Clamp Results—Application to Hippocampal Mossy Fiber Boutons
 John R. Clay
- Department of Physiology, National Institute of Neurological Disorders and Stroke, National Institutes of Health, Rockville, MD, USA
Action potential clamp (AP-clamp) recordings of the delayed rectifier K+ current IK and the fast-activated Na+ current INa in rat hippocampal mossy fiber boutons (MFBs) are analyzed using a computational technique recently reported. The method is implemented using a digitized AP from an MFB and computationally applying that data set to published models of IK and INa. These numerical results are compared with experimental AP-clamp recordings. The INa result is consistent with experiment; the IK result is not. The difficulty with the IK model concerns the fully activated current-voltage relation, which is described here by the Goldman-Hodgkin-Katz dependence on the driving force (V-EK) rather than (V-EK) itself, the standard model for this aspect of ion permeation. That revision leads to the second—a much steeper voltage dependent activation curve for IK than the one obtained from normalization of a family of IK records by (V-EK). The revised model provides an improved description of the AP-clamp measurement of IK in MFBs compared with the standard approach. The method described here is general. It can be used to test models of ionic currents in any excitable cell. In this way it provides a novel approach to the relationship between ionic current and membrane excitability in neurons.
Introduction
The action potential clamp technique (AP-clamp) is a paradigm in which an AP recorded from a neuron in current clamp is applied to that same cell in voltage clamp mode before and after the addition of a specific ion channel blocker to the external medium (Llinás et al., 1982; Bean, 2007). In this way the role of that current during an AP can be determined. The AP can also be applied computationally to a mathematical model of that current constructed from voltage step results in order to provide an additional test of the model. This approach was recently applied to INaand ICa in suprachiasmatic nucleus neurons (Jackson et al., 2004; Clay, 2015). In this report the method is applied to the AP-clamp recordings of Alle et al. (2009) of INa and IK in rat hippocampal mossy fiber boutons (MFBs) at physiological temperatures (T = 36−37°C). Those results demonstrate a significant separation in time during an AP of INa and IK, an important result for efficient neuronal signaling (Crotty et al., 2006; Alle et al., 2009; Sengupta et al., 2010). The method was implemented using digitized results from MFBs (personal communication, Dr. H. Alle). A digitized representation of an AP from an MFB was applied computationally to the models of IK and INa in MFBs of Engel and Jonas (2005) for model testing. The IK AP-clamp analysis revealed a significant discrepancy between theory and experiment, which can be resolved using the Goldman-Hodgkin-Katz (GHK) equation for the fully activated current-voltage relation for IK (Clay, 2009). The revised IK model provides a significant improvement in the description of this component compared with a model in which a linear dependence of IK on (V-EK) was used. Computational analysis of the INa AP-clamp result (Alle et al., 2009) using the Engel and Jonas (2005) INa model was in agreement with experiment.
Materials and Methods
A data set corresponding to an AP from MFBs was applied computationally to the models of IK and INa of Engel and Jonas (2005) which are given by IK = gKn4(V-EK) and INa = gNam3h(V-ENa), respectively, similar to the original models of IK and INa in squid giant axons of Hodgkin and Huxley (1952), with gK and gNaconstants, EK and ENa the K+, and Na+ reversal potentials and
with x = n, m, or h, and time t in msec. The rate parameters in Equation (1) are given by Engel and Jonas (2005).
The expressions for αn and βn (Equation 2) were taken from the experimental procedures of Engel and Jonas (2005). The expressions for αm, βm, αh, and βh (Equation 3) were taken from Supplementary Table 1 of their paper. All αs and βs in Equations (2) and (3) are in units of inverse milliseconds. The model of IK was based on the voltage step recordings of this component in MFBs by Geiger and Jonas (2000) obtained at T = 34°C. It was extrapolated to T = 37°C using a Q10 of 2.2 (Fohlmeister, 2015). That is, αn and βn (Equation 2) were each multiplied by 1.27. The reversal potential for K+ used in the analysis was EK = −110 mV. [EK = kT/q ln(/) where k is the Boltzmann constant, T is the absolute temperature, q is the unit electron charge (kT/q = 26.7 mV for T = 37°C), =2.5 mM and = 155 mM (Alle et al., 2009)]. The recordings of INa of Engel and Jonas (2005) were obtained at T = 23°C. Their model of INa was extrapolated to T = 37°by multiplying each of the αs and βs in Equation (3) by a factor of 2.8. The reversal potential for Na+ was ENa = 62 mV (Alle et al., 2009).
The Vi vs. ti data set (i = 1,2,3… ; Supplementary Table 1) of the MFB AP from Figure 1B of Alle et al. (2009) is represented in the top panel of Figure 1 with lines connecting adjacent points. It was applied to Equation (1) with x = n, m, or h using NDSolve in Mathematica (Wolfram Research, Inc., Champaign, IL). At t1 = 0, V1 = −80 mV. The initial value of n, n1, was given by αn/(αn+βn) with V = −80 mV and αnand βn given by Equation (2), i.e., n1 = 0.1288. The following point of the AP data set is t2 = 0.039 ms, V2 = −77.7 mV. The corresponding value of n, n2, was determined from Equation (1) and NDSolve using V(t) = V1+(V2−V1)(t−t1)/(t2−t1) for t1< t< t2. The result was n2 = 0.1289. More significant changes in n occur later as the membrane potential is depolarized throughout the AP. A similar analysis was applied to x = m and h.
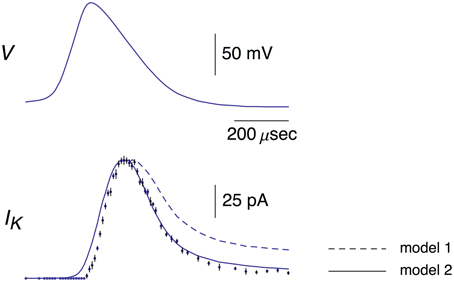
Figure 1. Top panel: This AP corresponds to the AP in the top panel of Figure 1B from Alle et al. (2009). A digitized version of this waveform is given in Supplementary Table 1. The points in that data set were connected by lines to given the result shown. Bottom panel: The data points with error bars (n = 9; ±SEM) correspond to AP-clamp measurements of IK in MFBs (Alle et al., 2009). The mean values of these results are also given in Supplementary Table 1. The theoretical results (models 1 and 2) are as described in the text.
Results
K+ Current
A digital representation of the AP-clamp recordings of IK from Alle et al. (2009) is given in the bottom panel of Figure 1 of this report (data points with the error bars representing ±SEM, n = 9; Supplementary Table 1). These results are the differences obtained by application of the AP in Figure 1 to MFBs in voltage-clamp before and after addition to the bath of 1 mM 4-aminopyridine (4-AP), which was sufficient to completely block IK elicited by an AP (Alle et al., 2009, 2011). They were scaled to match the IK result in the bottom panel of Figure 1B of Alle et al. (2009). Also shown in Figure 1 is the prediction of the Engel and Jonas (2005) IK model (dashed line; model 1) starting from the maximum level of IK close to the peak of the AP. The rising phase of the model is not shown. These results (also given in Supplementary Table 1) correspond to IK,i = gKni4(Vi-EK), i = 1.2.3… , with ni determined as described above (Section Materials and Methods), EK = −110 mV, and gK = 36 mS/cm2. This model—model 1, the Engel and Jonas (2005) IK model—does not provide a good description of the IK AP-clamp result. The difficulty most likely concerns the fully activated current-voltage relation for IK. This result for squid axons is well described by the GHK dependence on (V-EK) rather than by (V-EK) itself (Clay et al., 2008), a relationship given by IK(n = 1) = aGHK[(V-EK)] where a is a constant, and GHK[(V-EK)] = (qV/kT) {exp[q(V-EK)/kT]-1}/[exp(qV/kT)-1]. In their original analysis of squid axon currents Hodgkin and Huxley (1952) obtained the IK activation curve, an important result for models of IK, by normalizing a family of IK records with (V-EK), a linear dependence on driving force. Normalization by GHK[(V-EK)] should be used instead. This analysis is illustrated for IK from MFBs in Figure 2 using the results of Geiger and Jonas (2000). Their IKactivation curve is shown in Figure 2 (open circles) along with a description of this result by (V) with n∞(V) = αn/(αn+βn) and αn and βn as given above (Equation 2). Their result for V = 50 mV (Figure 1C of Geiger and Jonas, 2000) was not included. The IK component in squid axons is partially blocked by in a voltage-dependent manner for strong depolarizations such as V ≥ 50 mV (Bezanilla and Armstrong, 1972; French and Wells, 1977). Geiger and Jonas (2000) used an intracellular solution containing 21 mM Na+. A partial block of IK in MFBs at 50 mV by this level of cannot be ruled out and so this point was excluded from the analysis. The remaining results from V = −70 to +30 mV were multiplied by (V-EK) to remove the linear normalization they used to obtain their result. The next step was normalization with GHK[(V-EK)] as described in Clay (2009)—closed circles in Figure 2. The result is an IK activation curve that is significantly steeper than the one obtained using normalization by (V-EK). A single modification in the Engel and Jonas (2005) model is sufficient to describe these results, namely a change in βn from 0.125 exp[−(V+65)/80] ms−1 to 0.125 exp[−(V+65)/20] ms−1, the curve labeled “ revised” in Figure 2. The same modification in the original Hodgkin and Huxley (1952) model, namely replacing “80” in the exponential term of βn to “20,” is sufficient to describe the IK activation curve in squid axons obtained using GHK normalization of a family of IK records (Clay et al., 2008). The AP-clamp result for this version of the Engel and Jonas (2005) IK model—model 2—is given by ani4 GHK[(Vi-EK)], continuous line in Figure 1, with a = 1.3 mA/cm2 and ni determined from Equation (1) using the modified version of βn. This result provides a significant improvement in the description of the falling phase of the experimental record compared with model 1. The rising phase of both models underestimates the delay in the rise of IK during an AP, a result that is similar to the Cole and Moore (1960) effect for voltage steps in squid axons (Discussion).
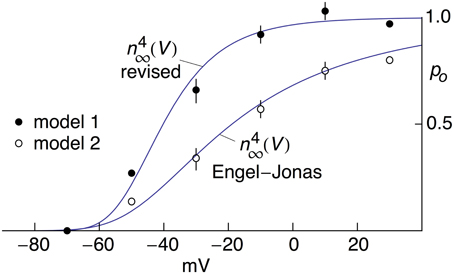
Figure 2. Open channel probability, po, for IK in MFB's as a function of V. The open circles were taken from Figure 5C from Geiger and Jonas (2000). The curve describing those results corresponds to (V) with n∞(V) = αn∕(αn+βn) and αn = −0.01(V+55)/{exp[−(V+55)/10]−1} msec−1, βn = 0.125 exp[−(V+65)/80] msec−1 (Engel and Jonas, 2005). These results were obtained from normalization of a family of IK records with (V-EK) and EK = −85 mV (Geiger and Jonas, 2000). They were multiplied by (V+85) and renormalized using GHK[(V−EK)] as described in the text with kT/q=26.5 mV (T = 34°C) and EK = −104 mV from Ko = 2.5 mM and Ki = 125 mM (Geiger and Jonas, 2000). The renormalized results are represented by the filled circles. The theoretical curve describing those results is given by (V) with αn= −0.01(V+55)/{exp[−(V+55)/10]−1} msec−1 and βn = 0.125 exp[−(V+65)/20] msec −1.
The revised IK result in Figure 1—model 2—is further illustrated by the current-voltage trajectory for IK during the AP in Figure 1 (Figure 3—dashed line). The IK gate—the n variable—is maximally activated during the AP to a level of 0.283, which occurs near the latter part of the repolarization phase. The GHK current voltage relation with n = 0.283, also shown in Figure 3, is tangent to the trajectory at this point (arrow labeled a). The trajectory lies close to the GHK relation a considerable distance on either side of a, indicating that the time course of IK in model 2 during repolarization is largely determined by the GHK equation.
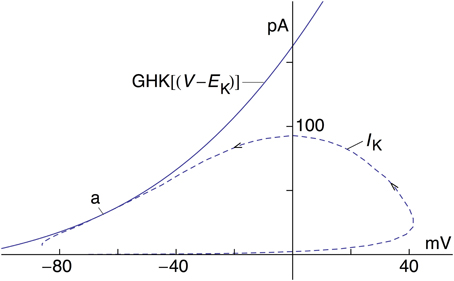
Figure 3. Current-voltage trajectory (dashed line) of IK—model 2—for the AP in Figure 1. The arrows indicate the direction of time. Also shown is the GHK current-voltage relation, an4 GHK(V-EK) with a = 1.3 mA/cm2, n = 0.283, and GHK(V-EK) as given in the text. The IK trajectory during the AP is tangent to the GHK relation at point a.
Na+ Current
Activation curve results for INa from MFBs—both experimental and theoretical—taken from Engel and Jonas (2005) are shown in Figure 4 along with the revised IK results described above. The IK and INa activation curves overlap almost completely (Figure 4) an observation that may be consistent with known structural similarities of voltage-gated Na+ and K+ channels (MacKinnon, 1991, 1995; Jan and Jan, 1997; Hanlon and Wallace, 2002).
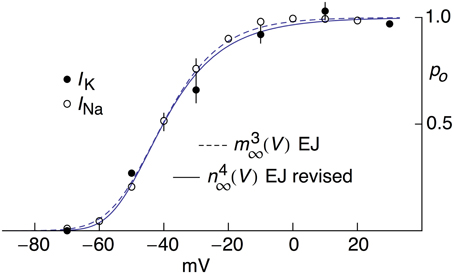
Figure 4. Open channel probability, po, for IK and INa for MFBs as a function of V, both experimental and theoretical. The experimental results for IK were taken from Figure 5C of Geiger and Jonas (2000) as modified in Figure 2. The solid line labeled “n4∞(V) EJ revised” corresponds to [αn/(αn+βn)]4 with αn = −0.01(V+55)/{exp[−(V+55)∕10]−1} msec−1 and βn = 0.125 exp[−(V+65)∕20] msec −1. The experimental results for INa were taken from Figure 2B of Engel and Jonas (2005). The dashed curve labeled “m3∞(V) EJ” corresponds to [αm/(αm+βm)]3 with αm = −93.8(V−105)/{exp[−(V−105)∕17.7]−1} msec−1 and βm = 0.17 exp(−V∕23.3) msec−1.
Pooled results of AP-clamp recordings of INa from Alle et al. (2009) are illustrated in Figure 5 (data points with error bars representing ±SEM, n = 9; Supplementary Table 1). They were scaled to match the INa result in the bottom panel of Figure 2B of Alle et al. (2009). The results are the differences obtained by applying the AP shown in the top panel of Figure 5 to MFBs before and after the addition of 1 μM tetrodotoxin (TTX) to the bathing medium. Also shown in Figure 5 is the prediction of the Engel and Jonas (2005) model described above, INa,i = gNami3hi(Vi-ENa), with i = 1.2,3…, gNa = 110 mS/cm2, mi and hi determined as described in Section Materials and Methods and ENa = 62 mV (Alle et al., 2009). The model provides a good description of the experimental results. The arrow in Figure 5 highlights a slight secondary increase of INa during repolarization in the Engel and Jonas (2005) INa model attributable to an overlap of activation and inactivation. A similar result is not apparent in the experimental recordings.
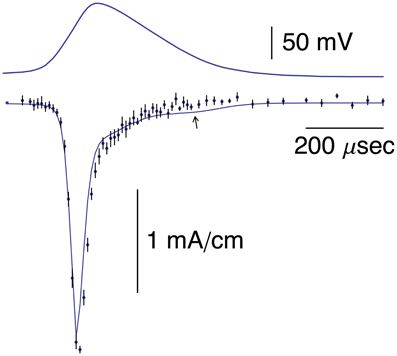
Figure 5. Top panel: Same AP as in the top panel of Figure 1. Bottom panel: The data points with error bars (n = 8; ±SEM) correspond to AP-clamp measurements of INa in MFBs (Alle et al., 2009). The mean values of those results are also given in Supplementary Table 1. The theoretical curve is as described in the text.
The mean of the pooled results for IK and –INa from Figures 1, 5, respectively, are shown in Figure 6 scaled as described in Alle et al. (2009) along with the predictions of the INa model and IK model 2 described above. The arrow in Figure 6 highlights a slight overlap of INa with IKduring the AP, an energetically inefficient result (Alle et al., 2009).
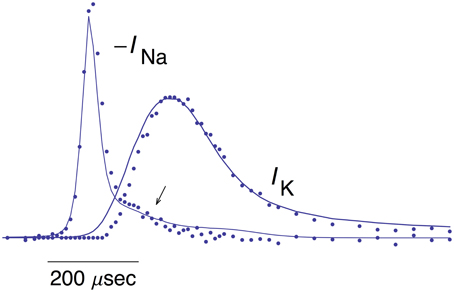
Figure 6. Pooled results for –INa and IK from MFBs. The mean values of these measurements are shown here along with the theoretical curves for –INa and IK are the same as described in Figures 1, 5, respectively. The arrow highlights a slight overlap in time of the two results (Alle et al., 2009).
Discussion
This report provides further illustration of a method recently described for the analysis of ionic currents recorded with the AP-clamp technique (Clay, 2015). The work also provides an example of the utility of the GHK equation for the analysis of IK from a mammalian neuronal preparation. Traditionally, those results have been described by IK = gK(V-EK) with gK a constant (Hodgkin and Huxley, 1952). This expression implies, by definition, that the slope conductance for IK at a given potential below EK is the same as the slope conductance positive to EK. This result is theoretically impossible when EK ≠ 0 because IK is proportional to with V well below EK and IK is proportional to when V is well above EK. The fully activated current-voltage relation for IK outwardly rectifies, a result that is well described by the GHK equation (Clay, 2009). A similar result applies for INa with a caveat. The fully activated current-voltage relation for INa in squid axons in Ca2+-free seawater is consistent with the GHK equation (Vandenberg and Bezanilla, 1991; their Figure 3). It inwardly rectifies since is much greater than . Calcium ions in normal seawater partially block INa in a voltage-dependent manner with the blockade increasing as the membrane potential is hyperpolarized relative to ENa. This effect counterbalances the inward rectification of INa in the absence of divalent cations so that INa is approximately proportional to (V-ENa) for physiological conditions over the range of potentials spanned by an AP (Vandenberg and Bezanilla, 1991). A similar mechanism may apply to INa from other preparations (Worley et al., 1986; Green et al., 1987).
One consequence of the original prediction by Hodgkin and Huxley (1952) that IK = gK(V-EK) is that activation curves for voltage gated K+ channels have typically been determined by normalizing a family of IK records using (V-EK). An activation curve with a shallow voltage dependence is obtained (open circles, Figure 2). In contrast, normalization of those results by GHK[(V-EK)] yields an activation curve having a steepness similar to that noted by Sigworth (2003) for voltage-gated K+ channels. Moreover, the revised K+ channel activation curve is similar to the Na+ channel activation curve (Figure 4). High sensitivity of these channels to voltage is important because cellular voltage changes are small (Sigworth, 2003).
Models 1 and 2 for IK both fail to account for the delay in the rising phase of this component during an AP (Figures 1, 6), a result that is similar to the Cole and Moore (1960) effect in squid axons. Specifically, the delay in the rising phase of IK following a voltage clamp step from relatively negative holding potentials is greater than the prediction of the Hodgkin and Huxley (1952) n4 model (Cole and Moore, 1960). This result is significant in squid axons even for moderately hyperpolarized holding potentials such as −75 mV (Figure 5; Clay et al., 2008). The discrepancy between theory and experiment reported here for the rising phase of IK elicited during AP-clamp from a holding potential of −80 mV in MFBs is a corollary of the Cole and Moore (1960) effect.
The IK component underlying repolarization in rat hippocampal MFBs is the result of the entry of K+ through a mixture of channels, Kv1, Kv3, and BK (Alle et al., 2011). BK channels appear not to be significant for basal APs, i.e., APs recorded under normal physiological conditions (Alle et al., 2011). The model of IK in MFB's by Engel and Jonas (2005) is based, implicitly, on the assumption of a homogeneous population of K+ channels. They noted that their model provided “a relatively accurate description of the voltage-dependence of activation of K+ channels in MFBs.” This view is not necessarily at odds with the results of Alle et al. (2011) especially with regard to Kv, channels that are activated rapidly. The kinetics of Kv1 and Kv3 may well be described by the same, or similar, Hodgkin and Huxley (1952) type model. In any event the falling phase of IK obtained in AP-clamp from MFBs is consistent with a homogeneous population of K+ channels with their fully-activated current-voltage relation described by GHK(V-EK).
The emphasis in this report is on a method, for analyzing ionic currents in neurons with an application to MFBs. The method is general. It can be applied to ionic currents in any excitable cell for which a specific blocker is available, such as TTX for INa. The method requires a digitized representation of an experimentally recorded AP as well as a model of the ionic current in question obtained from voltage clamp step results such as the Hodgkin and Huxley (1952) m3h model for INa. The analysis given above for INa in MFBs is largely confirmatory of the m3h model as given by Engel and Jonas (2005). The analysis for IK in MFBs reveals two discrepancies between experiment and the Hodgkin and Huxley (1952) model of IK, one concerning the rising phase of IK during an AP similar to the Cole and Moore (1960) effect and a discrepancy in the falling phase that can be accounted for by changing the fully-activated current-voltage for IK from a linear dependence upon the K+ driving force to the GHK dependence on (V-EK). The method provides a complementary test of models constructed from voltage step results. An AP-clamp rapidly scans the range of membrane potentials corresponding to this waveform. In this way the GHK dependence of IK on (V-EK) can be elucidated for the physiological range of membrane potentials more readily than is possible with voltage steps.
The original work of Hodgkin and Huxley (1952) continues to influence the design and analysis of experimentals in membrane neuroscience. The method described in this report provides a variation of their approach that can yield additional insight to the relationship between membrane excitability and the ionic currents that underlie excitability.
Conflict of Interest Statement
The author declares that the research was conducted in the absence of any commercial or financial relationships that could be construed as a potential conflict of interest.
Acknowledgments
This research was supported by the Intramural Research Program of the National Institute of Neurological Disorders and Stroke, National Institutes of Health, Bethesda, Maryland USA. The author gratefully acknowledges Dr. Henrik Alle for providing a table of digitized results from Alle et al. (2009).
Supplementary Material
The Supplementary Material for this article can be found online at: https://www.frontiersin.org/article/10.3389/fncel.2015.00514
References
Alle, H., Kubota, H., and Geiger, J. R. P. (2011). Sparse but highly efficient Kv3 outpace BKCa channels in action potential repolarization at hippocampal mossy fiber boutons. J. Neurosci. 31, 8001–8012. doi: 10.1523/JNEUROSCI.0972-11.2011
Alle, H., Roth, A., and Geiger, J. R. P. (2009). Energy-efficient action potentials in hippocampal mossy fibers. Science 325, 1405–1408. doi: 10.1126/science.1174331
Bean, B. P. (2007). The action potential in mammalian central neurons. Nat. Rev. Neurosci. 8, 451–465. doi: 10.1038/nrn2148
Bezanilla, F., and Armstrong, C. M. (1972). Negative conductance caused by the entry of sodium and cesium ions into the potassium channels of squid axons. J. Gen. Physiol. 60, 588–608. doi: 10.1085/jgp.60.5.588
Clay, J. R. (2009). Determining K+ channel activation curves from K+ channel currents often requires the Goldman-Hodgkin-Katz equation. Front. Cell. Neurosci. 3:20. doi: 10.3389/neuro.03.020.2009
Clay, J. R. (2015). A novel description of ionic currents recorded with the action potential clamp technique: application to excitatory currents in suprachiasmatic nucleus neurons. J. Neurophysiol. 114, 707–716. doi: 10.1152/jn.00846.2014
Clay, J. R., Paydarfar, D., and Forger, D. B. (2008). A simple modification of the Hodgkin and Huxley equations explains type 3 excitability in squid axons. J. R. Soc. Interface 5, 1421–1428. doi: 10.1098/rsif.2008.0166
Cole, K.S., and Moore, J.W. (1960). Potassium ion current in the squid giant axon: dynamic characteristic. Biophys. J. 1, 1–14.
Crotty, P., Sangrey, T., and Levy, W. B. (2006). Metabolic costs of action potential velocity. J. Neurophysiol. 96, 1237–1246. doi: 10.1152/jn.01204.2005
Engel, D., and Jonas, P. (2005). Presynaptic action potential amplification by voltage-gated Na+ channels in hippocampal mossy fiber boutons. Neuron 45, 405–417. doi: 10.1016/j.neuron.2004.12.048
Fohlmeister, J. F. (2015). Voltage-gating by molecular subunits of Na+ and K+ ion channels: higher-dimensional cubic kinetics, rate constants, and temperature. J. Neurophysiol. 113, 3759–3777. doi: 10.1152/jn.00551.2014
French, R. J., and Wells, J. B. (1977). Sodium ions as blocking agents and charge carriers in the potassium channel of the squid giant axon. J. Gen. Physiol. 70, 707–724. doi: 10.1085/jgp.70.6.707
Geiger, J. R. P., and Jonas, P. (2000). Dynamic control of presynaptic Ca2+ inflow by fast-inactivating K+ channels in hippocampal mossy fiber boutons. Neuron 28, 927–939. doi: 10.1016/S0896-6273(00)00164-1
Green, W. N., Weiss, L. B., and Anderson, O. S. (1987). Batrachotoxin-modified sodium channels in planar lipid bilayers. J. Gen. Physiol. 89, 841–872. doi: 10.1085/jgp.89.6.841
Hanlon, M. R., and Wallace, B. A. (2002). Structure and function of voltage-dependent ion channel regulatory beta subunits. Biochemistry 41, 2886–2894. doi: 10.1021/bi0119565
Hodgkin, A. L., and Huxley, A. F. (1952). A quantitative description of membrane current and its application to conduction and excitation in nerve. J. Physiol. 117, 500–544. doi: 10.1113/jphysiol.1952.sp004764
Jackson, A. C., Yao, G. L., and Bean, B. P. (2004). Mechanism of spontaneous firing in dorsomedial suprachiasmatic nucleus neurons. J. Neurosci. 24, 7985–7998. doi: 10.1523/JNEUROSCI.2146-04.2004
Jan, L. Y., and Jan, Y. N. (1997). Cloned potassium channels from eukaroytes and prokaroytes. Annu. Rev. Neurosci. 20, 91–123. doi: 10.1146/annurev.neuro.20.1.91
Llinás, R., Sugimori, M., and Simon, S. M. (1982). Transmission by presynaptic spike-like depolarization in the squid giant synapse. Proc. Natl. Acad. Sci. U.S.A. 79, 2415–2419. doi: 10.1073/pnas.79.7.2415
MacKinnon, R. (1991). Determination of the subunit stoichiometry of a voltage-activated potassium channel. Nature 350, 232–235. doi: 10.1038/350232a0
MacKinnon, R. (1995). Pore loops: an emerging theme in ion channel structure. Neuron 14, 889–892. doi: 10.1016/0896-6273(95)90327-5
Sengupta, B., Stemmler, M., Laughlin, S. B., and Niven, J. E. (2010). Action potential energy-efficiency varies among neuron types in vertebrates and invertebrates. PLoS Comp. Biol. 6:e1000840. doi: 10.1371/journal.pcbi.1000840
Vandenberg, C. A., and Bezanilla, F. (1991). Single-channel, macroscopic, and gating currents from sodium channels in the squid giant axon. Biopyhs. J. 60, 1499–1510. doi: 10.1016/S0006-3495(91)82185-3
Keywords: rat hippocampus, action potential clamp, mathematical models, Goldman-Hodgkin-Katz, ion channels
Citation: Clay JR (2016) A Novel Method for the Description of Voltage-Gated Ionic Currents Based on Action Potential Clamp Results—Application to Hippocampal Mossy Fiber Boutons. Front. Cell. Neurosci. 9:514. doi: 10.3389/fncel.2015.00514
Received: 23 September 2015; Accepted: 21 December 2015;
Published: 13 January 2016.
Edited by:
Lavinia Alberi, University of Fribourg, SwitzerlandReviewed by:
Euan Robert Brown, Heriot Watt University, UKPing Liu, University of Connecticut Health Center, USA
Copyright © 2016 Clay. This is an open-access article distributed under the terms of the Creative Commons Attribution License (CC BY). The use, distribution or reproduction in other forums is permitted, provided the original author(s) or licensor are credited and that the original publication in this journal is cited, in accordance with accepted academic practice. No use, distribution or reproduction is permitted which does not comply with these terms.
*Correspondence: John R. Clay, jrclay@ninds.nih.gov