N- and L-Type Voltage-Gated Calcium Channels Mediate Fast Calcium Transients in Axonal Shafts of Mouse Peripheral Nerve
 Ruxandra Barzan
 Friederike Pfeiffer
 Maria Kukley
- Group of Neuron Glia Interaction, Werner Reichardt Centre for Integrative Neuroscience, University of Tübingen, Tübingen, Germany
In the peripheral nervous system (PNS) a vast number of axons are accommodated within fiber bundles that constitute peripheral nerves. A major function of peripheral axons is to propagate action potentials along their length, and hence they are equipped with Na+ and K+ channels, which ensure successful generation, conduction and termination of each action potential. However little is known about Ca2+ ion channels expressed along peripheral axons and their possible functional significance. The goal of the present study was to test whether voltage-gated Ca2+ channels (VGCCs) are present along peripheral nerve axons in situ and mediate rapid activity-dependent Ca2+ elevations under physiological circumstances. To address this question we used mouse sciatic nerve slices, Ca2+ indicator Oregon Green BAPTA-1, and 2-photon Ca2+ imaging in fast line scan mode (500 Hz). We report that transient increases in intra-axonal Ca2+ concentration take place along peripheral nerve axons in situ when axons are stimulated electrically with single pulses. Furthermore, we show for the first time that Ca2+ transients in peripheral nerves are fast, i.e., occur in a millisecond time-domain. Combining Ca2+ imaging and pharmacology with specific blockers of different VGCCs subtypes we demonstrate that Ca2+ transients in peripheral nerves are mediated mainly by N-type and L-type VGCCs. Discovery of fast Ca2+ entry into the axonal shafts through VGCCs in peripheral nerves suggests that Ca2+ may be involved in regulation of action potential propagation and/or properties in this system, or mediate neurotransmitter release along peripheral axons as it occurs in the optic nerve and white matter of the central nervous system (CNS).
Introduction
In the peripheral nervous system (PNS) a vast number of axons are accommodated within fiber bundles that constitute peripheral nerves. The major function of peripheral axons is to propagate action potentials along their length, therefore axons are equipped with voltage-gated Na+ and K+ channels which ensure successful generation, conduction and termination of each action potential. In addition to Na+ and K+ channels voltage-gated Ca2+ channels (VGCCs) are expressed on peripheral axons. However only few groups have so far directly studied these channels and very little is known about their sub-types, developmental regulation, and function. Ca2+-conductance probably mediated by VGCCs was detected in rat preganglionic cervical sympathetic nerves (Elliott et al., 1989) and in unmyelinated fibers of biopsied human sural nerve (Quasthoff et al., 1995, 1996). Increase in intra-axonal Ca2+ level along peripheral axons was reported during prolonged (0.3–10 s) repetitive electrical stimulation of rat vagus nerve and of biopsied human sural nerves (Wächtler et al., 1998; Mayer et al., 1999), yet the exact channel subtypes mediating Ca2+ influx remain unknown. In mouse postganglionic sympathetic axonal bundles Ca2+ transients could be detected not only during train stimulation but also in response to a single stimulus (Jackson et al., 2001). VGCCs located along axonal shafts in the PNS could be of great significance for modulation of action potential conduction velocity and/or frequency (François et al., 2015), fast axonal transport (Chan et al., 1980), or release of neuropeptides (Eberhardt et al., 2008; Spitzer et al., 2008). To play a modulatory role during these fast cellular processes, Ca2+ transients in the peripheral axons should occur in a millisecond time domain. Yet, it remains unclear whether rapid activity-dependent Ca2+ elevations take place along peripheral axons under physiological conditions, because in the previous studies either image acquisition has been done using relatively slow frame scanning mode and low sampling rate (Wächtler et al., 1998; Mayer et al., 1999; Jackson et al., 2001), or Ca2+ conductance has been measured with blockers of K+ channels in the bath or strongly elevated extracellular K+ concentration (Elliott et al., 1989; Quasthoff et al., 1995, 1996). It is also un-clear which types of VGCCs mediate rapid Ca2+ elevations in the peripheral axons. Remarkably, in the central nervous system (CNS) VGCCs are present along the axons in several structures including retina (Sargoy et al., 2014), cerebellum (Callewaert et al., 1996; Forti et al., 2000), corpus callosum (Kukley et al., 2007), optic nerve (Lev-Ram and Grinvald, 1987; Fern et al., 1995; Sun and Chiu, 1999; Brown et al., 2001; Zhang et al., 2006; Alix et al., 2008) and spinal dorsal column (Ouardouz et al., 2003). They open in a millisecond time domain upon action potential arrival and mediate fast Ca2+ transients which are similar to those observed in presynaptic nerve terminals at conventional neuronal synapses (Lev-Ram and Grinvald, 1987; Sun and Chiu, 1999; Kukley et al., 2007). Axonal Ca2+ transients in the CNS are involved in synaptic signaling between axons and oligodendrocyte progenitor cells (Kukley et al., 2007; Ziskin et al., 2007), modulation of axonal excitability, and regulation of intracellular Ca2+ level during axonal growth (Sun and Chiu, 1999; Bucher and Goaillard, 2011).
A major goal of the present study was to test whether VGCCs mediate rapid (in a millisecond time domain) activity-dependent Ca2+ elevations along mammalian peripheral nerve axons in situ under physiological conditions. Answering this question is of great importance for the follow-up research on the functional role of VGCCs in peripheral nerves in situ and in vivo, and is also of clinical and pharmaceutical relevance. Using 2-photon Ca2+ imaging in line scan mode we found that action potentials trigger fast Ca2+ transients along peripheral nerve axons in situ; these Ca2+ transients involve activation of N- and-L-type VGCCs.
Materials and Methods
Animals
C57BL/6N mice were originally obtained from Charles River and bred in house. All experiments were performed in accordance with the guidelines of the Animal Care and Use Committee at the University of Tübingen.
Preparation of Sciatic Nerve Live Slices
Newborn mouse pups (P0–2) were sacrificed by decapitation without anesthesia and both sciatic nerves were isolated. The nerves were transferred to a Petri dish and maintained for ~15 min in ice-cold high-Mg2+ ACSF containing in mM: 124 NaCl, 1.25 NaH2PO4, 10 MgSO4, 2.7 KCl, 26 NaHCO3, 2 CaCl2, 2 ascorbic acid, 18.6 glucose. Subsequently nerves were embedded into 2.5% low-melting agarose dissolved in normal ACSF, containing in mM: 124 NaCl, 1.25 NaH2PO4, 1.3 MgSO4, 2.7 KCl, 26 NaHCO3, 2 CaCl2, 2 ascorbic acid, 18.6 glucose and cooled down to 37°C. One hundred micrometres-thin longitudinal nerve slices were prepared on a vibratome (VT1200S, Leica Biosystems), using ice-cold high-Mg2+ACSF. The slices were placed into a Haas-type interface chamber and maintained at room temperature up to 8 h perfused with normal ACSF gassed with 95% O2 and 5% CO2.
Ca2+ Indicator Injection
Individual sciatic nerve slices were loaded with a high-affinity Ca2+ indicator Oregon-green-BAPTA-1 (OGB-1 AM) or low-affinity indicator Magnesium Green, as described previously (Regehr, 2000). Briefly, 50 μg of Ca2+ indicator was dissolved in 20 μl of pluronic acid in dimethyl sulfoxide (20% w/v). Four hundred microliter normal ACSF was added to this solution. The final Ca2+ indicator concentration was ~100 μM. A volume of 5 μl of the indicator solution was loaded into a glass micropipette (diameter ~3–6 μm) which was lowered into a nerve slice; a small positive pressure was applied for 10–15 min. Subsequently the slice was washed with ACSF for ~15 min.
Ca2+ Imaging with Two-Photon Excitation Microscopy
Individual nerve slices filled with Ca2+ indicator were transferred to a recording chamber mounted on the stage of a 2-photon laser-scanning microscope (LaVision Biotech, Germany) and perfused with ACSF containing 2.5 mM Ca2+. Axons were stimulated with a monopolar glass electrode (3–6 μm tip diameter) filled with normal ASCF. Single pulses (pulse length 200–500 μs, pulse amplitude 50 V) were applied every 30 s using isolated pulse stimulator (ISO-STIM 01D, NPI Electronic, Germany). To acquire high temporal resolution, line scanning was performed perpendicular to the orientation of the axons, with a frequency of 500 Hz. The dye was excited at 790 nm (Spectra-Physics MaiTai HP Laser) and fluorescence signals were detected using a high sensitivity photomultiplier H7422-40 (Hamamatsu, Japan), after filtering with a DCLP dichroic mirror >500 nm. A laser-scanning system (TriM Scope II, LaVisionBiotec, Germany) coupled to an upright microscope (Olympus, Japan) equipped with a 20×, NA 1.1 water-immersion objective (Zeiss, Germany) was controlled using ImSpector Pro Software (version 4.0, LaVision Biotec, Germany), which also allowed online analysis of the data. The scan head and stimulator were synchronized using Igor Pro 6.2 Software (WaveMetrics, Lake Oswego, OR, USA) and an external trigger system (SyncUnit, LaVisionBiotec, Germany).
Analysis of Ca2+ Imaging Data
The amplitude of the Ca2+ fluorescence signal was measured in parts of axonal bundles positioned in the focal plane, as the ratio of the difference between the peak fluorescence and the resting fluorescence (ΔF = F−F0) and the resting fluorescence (F0), after background subtraction. Background region was chosen as the less bright area in the field of view (FOV; not more than 10 μm away from the recorded axon). The analysis was performed using custom-written macros for IgorPro (WaveMetrics, Lake Oswego, OR, USA). 10–90% rise-time of Ca2+ transients was measured manually using hairline cursors in IgorPro. To determine the decay time constant, a mono-exponential function was fitted to the decaying part of the transient, from the peak until ~500 ms after the peak. The graphs show mean ± standard error (SEM).
Measurement of Axon Diameter
To estimate the diameter of single axons within small axonal bundles from which Ca2+ transients were recorded, 3D line-scan pictures (z-stack) of the axons loaded with OGB-1 were recorded. The brightness profile of the line-scans was plotted, and the diameter of single axons was measured in the plane where the axons were in focus. ImSpector Pro Software (LaVision Biotech, Germany) was employed for these measurements.
Immunohistochemistry and Confocal Laser Scanning Microscopy
Newborn mouse pups (P0–2) were sacrificed by decapitation without anesthesia and both sciatic nerves were isolated. The nerves were transferred to a Petri dish and maintained for ~15 min in ice-cold high-Mg2+ ACSF containing in mM: 124 NaCl, 1.25 NaH2PO4, 10 MgSO4, 2.7 KCl, 26 NaHCO3, 2 CaCl2, 2 ascorbic acid, 18.6 glucose. The nerves were fixed for 1 h in 4% paraformaldehyde (PFA) prepared in phosphate-buffered saline (PBS). PBS contained, in mM: 4.3 Na2HPO4, 1.6 NaH2PO4, 150 NaCl. Afterwards the nerves were washed with PBS (3 times × 15 min) and transferred to 30% sucrose solution in PBS, where they were kept overnight at 4°C. The nerves were then embedded into Tissue-Tek (Sakura Finetek Europe, Netherlands) and frozen at −80°C. Ten micrometre thick slices were prepared with a Leica CM3050S Cryotome and Leica 819 Microtome blades, and transferred onto the glass slides. The slices were washed (3 times × 15 min) with tris-buffered saline (TBS), and incubated in blocking solution for 2 h at room temperature. TBS contained, in mM: 100 Sigma 7–9, 154 NaCl. Blocking solution contained: 3% bovine serum albumin and 0.2% Triton-X in TBS. The slices were incubated with primary antibody overnight at 4°C, washed in TBS (3 times × 15 min), and incubated with secondary antibody coupled to a fluorescent dye for 3–4 h at room temperature. For double and triple immune-labeling the antibodies were applied sequentially, i.e., first primary followed by first secondary, followed by second primary, followed by second secondary, etc. All antibodies were applied in the blocking solution. Washing of slices with TBS (3 times × 15 min) was performed after incubation with each antibody. At the end of the immuno-labeling procedure counterstain 4′,6-diamidino-2-phenylindole (DAPI, 5 mg/ml) was applied for 5 min at room temperature. The slices were washed with water, dried, covered with Vectashield (Vector Laboratories, Inc, Burlingame, CA, USA), and sealed with nail-polish. The list of antibodies used in this study is given in Table 1. Confocal images were acquired with confocal laser scanning microscope LSM-710 (Zeiss, Germany) equipped with 40× objective (Plan-Apochromat 40×/1.3 Oil DIC M27, Zeiss, Germany). The dyes were excited with the following laser-lines: 405 nm for DAPI, 488 nm for Alexa-Fluor-488, 568 nm for rhodamine-red-X (RRX) or Cy3, and 633 nm for Alexa-Fluor-633 or Cy5. The pinhole was set to 34–38 μm depending on the wave-length, and was adjusted so that the optical section for each channel was 0.9 μm. Images for multiple channels were acquired sequentially, and care was taken that parts of the emission spectra from which the light was collected for different dyes do not overlap. Images were further analyzed with ZEN Software (Zeiss, Germany).
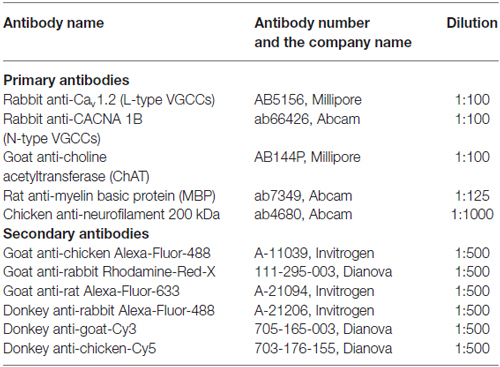
Table 1. List of antibodies used for immunohistochemistry.
Chemicals and Drugs
All chemicals were obtained from Sigma (Taufkirchen, Germany) or Carl Roth (Karlsruhe, Germany). OGB-1, Magnesium Green, and pluronic acid were obtained from Invitrogen (LifeTechnologies GmbH, Darmstadt, Germany). Tetrodotoxin (TTX), TTA-P2, ω-conotoxin GVIA, and ω-agatoxin IVa were obtained from Alomone Labs (Jerusalem, Israel). Stock solutions were prepared according to manufacturer’s instructions and stored at −20°C.
Statistics
Statistical analysis was performed using SPSS statistics Software (Version 23.0, IBM Corp. Armonk, NY, USA). Statistical significance of the drug effect was determined with paired-samples T-test. All values are shown as the mean ± SEM. Differences were considered significant at p < 0.05 (*p < 0.05, **p < 0.01, ***p < 0.001).
Results
Electrical Stimulation of Nerve Bundles Triggers Ca2+ Transients Along Sciatic Nerve Axons
The first goal was to test whether activity-dependent Ca2+ transients occur along mouse sciatic nerve axons in a millisecond time domain, and to assess whether high- or low-affinity indicator works best to measure these transients. We performed 2-photon Ca2+ imaging in nerve slices filled with a high-affinity Ca2+ indicator OGB-1 AM (Kd = 170 nM) or a low-affinity Ca2+ indicator Magnesium Green (Kd = 6 μM), while stimulating axons electrically (Figures 1A,D). We aimed to image small axonal bundles which had constant diameter (in the range of 3–12 μm) over the length of tens of micrometers (Figure 1B). We estimated that the diameter of thin axons comprising these bundles was in the range of 0.6–2.4 μm (Figure 1E). Each region of interest (ROI) was selected as a line placed perpendicular to the orientation of the axons (Figure 1A). We avoided to image cellular structures appearing as varicosities and potentially being growth cones or cut-and-resealed axons. To ensure that we record Ca2+ transients selectively in axons, but not in the developing Schwann cells, we acquired all scans far from the indicator injection site (>300 μm). This was important, as we observed that at the injected site both Schwann cells and axons took up the dye, while far from the injection site only axons were stained with the indicator and no glial cells were labeled (Figure 1A left,B). Based on the previous studies (Thaxton et al., 2011) and our own unpublished observations, the end-to-end length of a Schwann cell in the sciatic nerve slice prepared from a neonatal mouse is no longer than 300 μm. In addition, Schwann cells in neonatal sciatic nerve are not coupled via gap-junctions (own unpublished observation). Hence, at the distance of >300 μm from the injection site, which exceeds the length of a Schwann cell in our preparation, we could selectively image the axons.
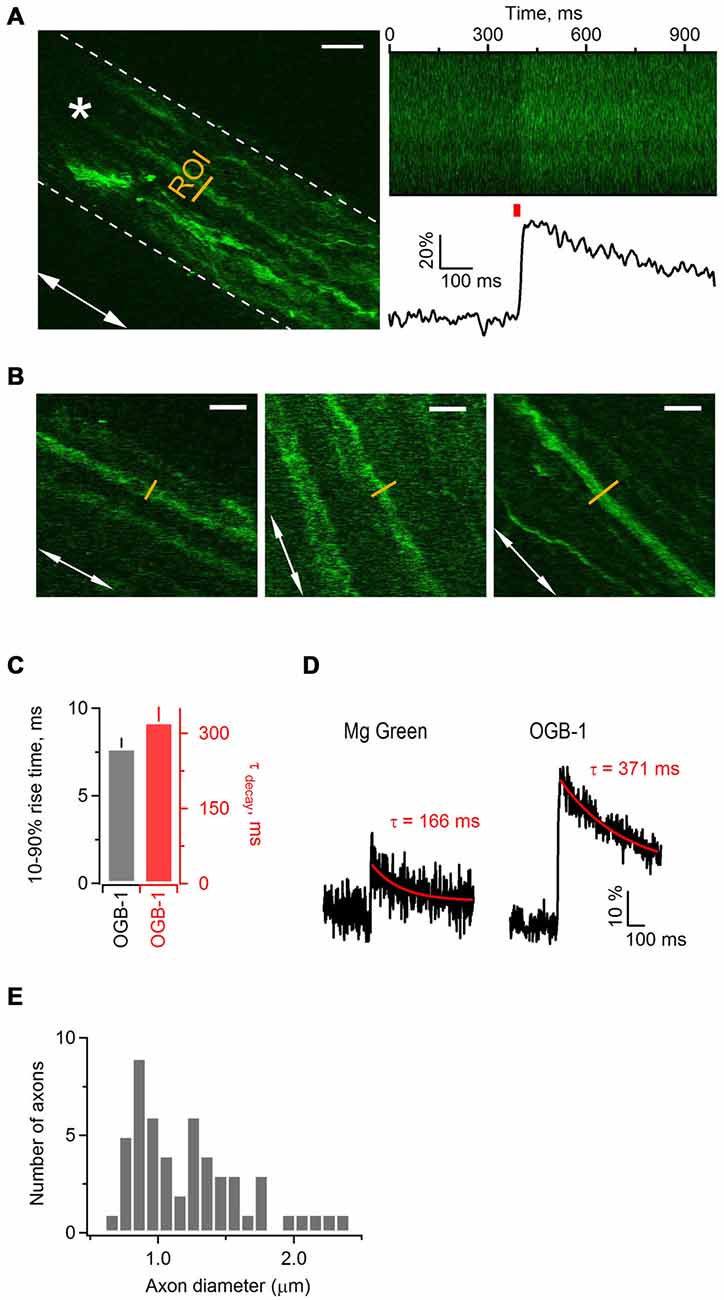
Figure 1. Electrical stimulation triggers Ca2+ transients along axonal shafts in neonatal mouse sciatic nerve. (A) Left: 2-photon image (single plane) of an axonal bundle filled with Ca2+ indicator Oregon Green BAPTA-1 (OGB-1) in a mouse sciatic nerve slice. The white dotted line delineates the contour of the axonal bundle. The white arrow shows orientation of the axons in the bundle. The yellow line indicates the ROI located ~300 μm away from the injection site. The white star indicates the position of stimulation electrode. Scale bar 20 μm. (A) Right, top: plot of fluorescence intensity in the ROI, indicated on the left, vs. time. The plot was obtained during the line scan along the ROI (500 lines scanned at 500 Hz). (A) Right, bottom: corresponding example trace showing increase in fluorescence intensity of OGB-1 upon electrical stimulation of axonal bundle with a single pulse. The trace is an average of three successive sweeps. The red bar indicates the time point of electrical stimulation. (B) Examples of imaged axons included in the study. White arrows show the orientation of axons in each neuronal bundle. The yellow line indicates the region of interest ROI located ~300 μm away from the injection site. Scale bars 12 μm. (C) Bar-graphs showing average 10–90% rise time of 7.73 ± 0.56 ms (mean ± SEM; n = 6) and average decay time constant of 323 ± 30 ms (mean ± SEM; n = 7) for Ca2+ transients recorded with OGB-1. (D) Example traces showing increase in fluorescence intensity of Magnesium Green (left) or OGB-1 (right) upon electrical stimulation of sciatic nerve axons with a single pulse. Each trace is an average of three successive sweeps. Red lines show mono-exponential fit to the decaying phase of each transient; corresponding decay time constants (tau) are indicated above each transient. (E) Histogram showing the diameter size distribution of the thin axons within bundles. Fifty-two axons within 18 bundles were analyzed.
While stimulating sciatic nerve axons electrically with single pulses every 30 s, we repeatedly executed fast line-scans (500 Hz) perpendicular to the orientation of the axons, and tracked changes in the fluorescence of OGB-1 (Figure 1A right) or Magnesium Green (not shown). Stimulation of axons led to a fast increase of Ca2+-dye fluorescence which then decayed back to baseline, indicating that changes in Ca2+ level occur in sciatic nerve axons upon electrical activity (Figure 1A right). The peak amplitude of Ca2+ transients in axons loaded with OGB-1 and stimulated with single pulse was typically several times larger than in axons loaded with Magnesium Green, and the signal-to-noise ratio was much better with OGB-1 compared to Magnesium Green (Figure 1D). Further, with Magnesium Green we usually had to stimulate the axons with trains (e.g., 3–50 pulses at 25–100 Hz) rather than with single pulses in order to detect Ca2+ transients. The 10–90% rise-time and the decay time constant of Ca2+ transients recorded with OGB-1 were 7.73 ± 0.56 ms (n = 6) and 323 ± 30 ms (n = 7), respectively (Figure 1C). Ca2+ transients recorded with Magnesium Green were very small upon single pulse stimulation, therefore it was difficult to estimate rise and decay time reliably even when several sweeps were averaged. We could do it only in one experiment where the 10–90% rise-time was 4.48 ms and the decay time constant was 166 ms (Figure 1D). Based on these findings we decided to use a high-affinity Ca2+ indicator OGB-1 for our experiments, aiming for higher signal sensitivity but keeping in mind that OGB-1 likely reports an overestimate of rise- and decay time of Ca2+ transients along the axons (Regehr, 2000).
Ca2+ Transients Along Sciatic Nerve Axons Depend on TTX-Sensitive Action Potentials
In brain slices, electrical stimulation of gray and white matter axons results in activation of VGCCs located in presynaptic boutons or along axonal shafts (Koester and Sakmann, 2000; Kukley et al., 2007). This activation depends on action potentials mediated by TTX-sensitive Na+ channels. As peripheral nerves contain both TTX-sensitive and TTX-resistant Na+ channels (Kostyuk et al., 1981), we tested whether Ca2+ transients in sciatic nerve axons are inhibited by TTX. We stimulated the axons electrically with single pulses at 0.033 Hz and acquired line-scans as described above. After verifying that the amplitude of evoked Ca2+ transients remains stable for at least 10 min, we applied TTX (1 μM) via the bath. TTX reduced the peak amplitude of Ca2+ transients by 97 ± 6% (Figures 2A,B) indicating that Ca2+ transients along the axons depend on action potentials mediated by TTX-sensitive Na+ channels. However, in one experiment we found that the amplitude of Ca2+ transients was decreased only by 68% upon TTX application (not shown), suggesting that TTX-resistant Na+ channels and/or Na+-action-potential independent mechanisms may partially mediate evoked Ca2+ increase along sciatic nerve axons.
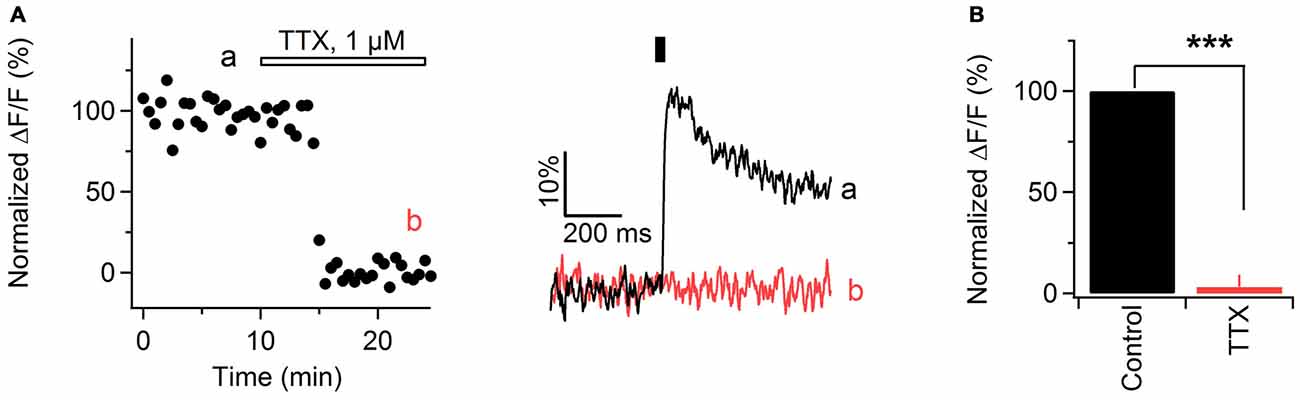
Figure 2. Ca2+ transients in mouse sciatic nerve depend on action potential propagation. (A) Left: time course of the amplitude of axonal Ca2+ transients evoked by single pulse stimulation, before and during bath application of 1 μM tetrodotoxin (TTX). “a” and “b” indicate time-period from which the 10 successive sweeps before and after TTX application were averaged (corresponding averages are shown on the right). Horizontal bar indicates time-period of TTX application. Ca2+ transients are recorded in axons filled with OGB-1. (A) Right: examples traces recorded before (black) and during (red) TTX application. Each example trace represents an average of 10 successive sweeps. Black vertical bar indicates time-point of electrical stimulation. (B) Summary bar graphs showing the effect of TTX on the amplitude of Ca2+ transients vs. control. The TTX application reduces the fluorescence by 97 ± 6% (mean ± SEM) of control values (n = 6; ***p < 0.001).
Ca2+ Transients Along Sciatic Nerve Axons Involve Ca2+ Influx from the Extracellular Space
To investigate the origin of Ca2+ transients in peripheral nerve axons, we perfused the slices with ACSF containing reduced Ca2+ concentration (1.8, 1.2 or 0.5 mM Ca2+ instead of 2.5 mM). The total divalent concentration was maintained constant by adjusting the levels of Mg2+ ions in the bath. Under these conditions, the peak amplitude of Ca2+ transients was reversibly reduced by 11 ± 2% in 1.8 mM Ca2+ (Figures 3A,D; n = 3), 29 ± 3% in 1.2 mM Ca2+ (Figures 3B,D; n = 3), and 55 ± 3% in 0.5 mM Ca2+ (Figures 3C,D; n = 3). These findings suggest that evoked Ca2+ transients along sciatic nerve axons involve Ca2+ influx from the extracellular space.
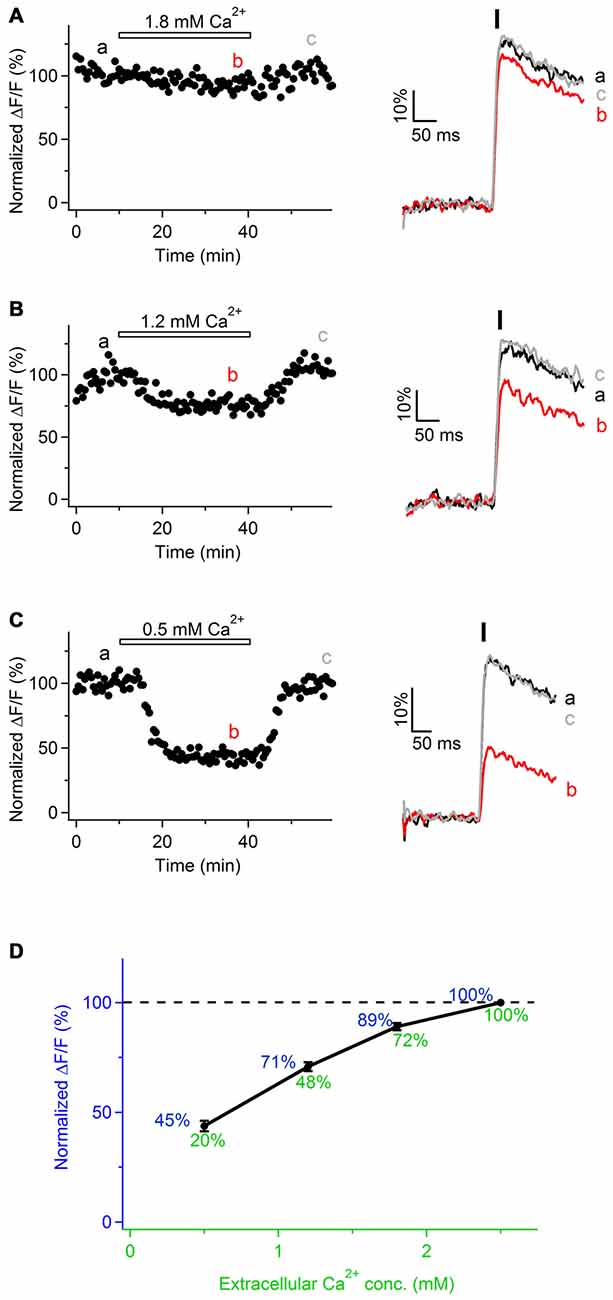
Figure 3. Ca2+ transients in mouse sciatic nerve involve Ca2+ influx from the extracellular space. (A–C) Left: time course of the amplitudes of axonal Ca2+ transients evoked by single pulse stimulation, before, during and after bath application of extracellular solution containing reduced Ca2+ concentration: 1.8 mM (A, n = 3), 1.2 mM (B, n = 3), and 0.5 mM (C, n = 3). Ca2+ concentration in the control solution was 2.5 mM. Horizontal bars indicate time-period when solution with reduced Ca2+ concentration was applied. Amplitude of Ca2+ transients is normalized on the amplitude of the transients obtained in the presence of 2.5 mM external Ca2+. “a”, “b”, and “c” indicate time-period from which the 10 successive sweeps were averaged (corresponding averages are shown on the right of each time course). Ca2+ transients are recorded in axons filled with OGB-1. (A–C) Right: example traces recorded before (black), during (red), and after (gray) bath application of extracellular solution with reduced Ca2+ concentration. Each example trace represents an average of 10 successive sweeps. Black vertical bar indicates time-point of electrical stimulation. (D) Summary graph showing dependence of the normalized amplitude of Ca2+ transients (ΔF/F, blue) on Ca2+ concentration in the extracellular solution (green). Values of the normalized amplitude of Ca2+ transients are shown in blue above the curve. Values of extracellular Ca2+ concentration normalized to 2.5 mM are shown in green below the curve.
Notably, in the experiments with various Ca2+ concentration in the bath we observed that relationship between the peak amplitude of Ca2+ transients (ΔF/F) and extracellular Ca2+ concentration is not linear, but Ca2+ influx tends to saturate with increasing Ca2+ level in the bath (Figure 3D). This non-linearity may be explained by the fact that Ca2+-binding site(s) at the membrane surface or within the channel pore, to which Ca2+ ions have to bind in order to pass through the channel, get saturated at higher extracellular Ca2+ concentration (Augustine and Charlton, 1986; Mintz et al., 1995). Alternatively, the observed non-linearity may be explained by slight saturation of OGB-1 when Ca2+ transients are recorded with 2.5 mM Ca2+ in the bath.
Ca2+ Transients Along Sciatic Nerve Axons are Mediated By VGCCs
In physiological or pathological conditions Ca2+ transients along the axons can be mediated by Ca2+ entry through different routes, e.g., VGCCs (Lev-Ram and Grinvald, 1987; Fern et al., 1995; Sun and Chiu, 1999; Brown et al., 2001; Zhang et al., 2006; Alix et al., 2008; Sargoy et al., 2014), reversal of Na+/Ca2+ exchanger (Lehning et al., 1996), release from intracellular stores (Matute, 2010; Villegas et al., 2014), or ionotropic Ca2+-permeable receptor channels (Kinkelin et al., 2000; Matute, 2010). Our goal was to test whether VGCCs contribute to Ca2+ entry along peripheral nerve axons. To address this question, we stimulated sciatic nerve axons electrically, acquired fast line-scans and perfused the slices with ACSF containing Cd2+ (50 μM), a broad-spectrum VGCCs blocker. Cd2+ strongly decreased the peak amplitude of Ca2+ transients, i.e., by 86 ± 2% (Figure 4A; n = 6). We also tested whether application of higher concentration of Cd2+, i.e., 100 μM, results in a stronger inhibition of evoked Ca2+ transients. This was indeed the case, as Ca2+ transients were inhibited by 94 ± 3% p < 0.01 (not shown; n = 3). However, application of 100 μM Cd2+ also caused a steady increase of both basal and peak fluorescence of OGB-1. Increase of Ca2+ indicator fluorescence in the presence of Cd2+ has also been reported in other preparations, e.g., in cultured hippocampal neurons (Ermolyuk et al., 2013) or in rat vagus nerve fibers (Wächtler et al., 1998). Possible explanations of this phenomenon are: rise of intracellular Ca2+ levels triggered by Cd2+ (Ermolyuk et al., 2013), binding of Cd2+ ions to the Ca2+ indicator (Regehr and Atluri, 1995) or block of Ca2+-ATPase by Cd2+ with subsequent accumulation of intracellular Ca2+ (Yuan et al., 2013). Taken together, our findings suggest that VGCCs contribute to Ca2+ transients along sciatic nerve axons.
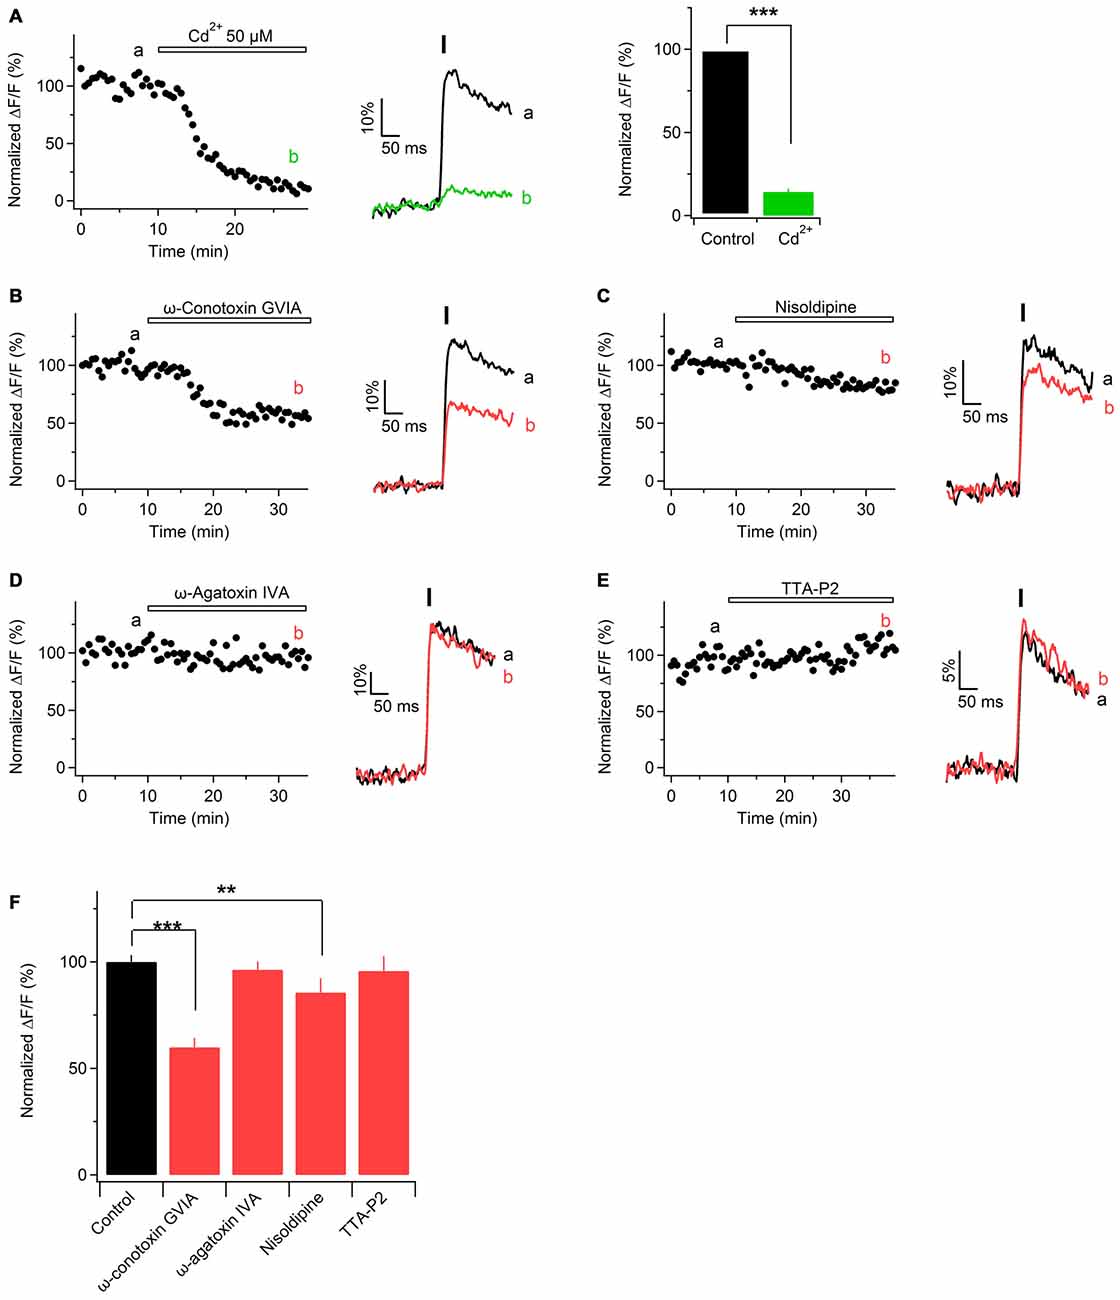
Figure 4. Ca2+ transients in mouse sciatic nerve are mediated by voltage-gated Ca2+ channels (VGCCs). (A) Left: time course of the amplitudes of axonal Ca2+ transients evoked by single pulse stimulation before and during application of Cd2+. “a” and “b” indicate the time-period from which 10 successive sweeps were averaged (corresponding average is shown on the right of the time course). Horizontal bar indicates time-period of Cd2+ application. (A) Middle: example traces recorded before (black) and during (green) application of 50 μM Cd2+. Each example trace represents an average of 10 successive sweeps. Black vertical bar indicates time-point of electrical stimulation. (A) Right: summary bar graphs showing the effect of Cd2+ on the amplitude of Ca2+ transients vs. control. Fifty micromolar Cd2+ reduces the fluorescence by 86 ± 2% (mean ± SEM) of control values (n = 6; ***p < 0.001). (B–E) Left: time course of the amplitudes of axonal Ca2+ transients evoked by single pulse stimulation, before and after application of a specific blocker of voltage-gated Ca2+ channels, VGCCs: N-type VGCCs blocker ω-conotoxin GVIA, 1 μM (B, n = 4); L-type VGCCs blocker nisoldipine, 1 μM (C, n = 5); P/Q-type VGCCs blocker ω-agatoxin IVA, 500 nM (D, n = 4), and T-type VGCCs blocker TTA-P2, 1 μM (E, n = 5). “a” and “b” indicate the time-period from which 10 successive sweeps were averaged (corresponding average is shown on the right of the time course). Horizontal bar indicates time-period of VGCCs blocker application. (B–E) Right: example traces recorded before (black) or during (red) bath application of a VGCCs blocker. Each example trace represents an average of 10 successive sweeps. Black vertical bar indicates time-point of electrical stimulation. (F) Summary bar graphs showing the effect of specific VGCCs blockers on the amplitude of Ca2+ transients vs. control. The amplitude was reduced in the presence of N-type VGCC blocker ω-conotoxin GVIA (1 μM, n = 4, ***p < 0.001), as well as in the presence of L-type VGCC blocker nisoldipine (1 μM, n = 5, **p < 0.01). On the contrary, the amplitude was unaffected by the P/Q- and T-type VGCCs blockers, ω-agatoxin IVA (500 nM, n = 4) and TTA-P2 (1 μM, n = 5), respectively.
Pharmacological Characterization of VGCCs Located Along Sciatic Nerve Axons
According to their electrophysiological and pharmacological properties VGCCs are classified into L-, N-, P/Q-, R-, and T-type (Dolphin, 2006). L-, N-, P/Q-, and R-type channels (also called high-voltage activated channels) open to large membrane depolarization and show a long-lasting current (Bean, 1985). T-type channels (also called low-voltage activated channels) open by smaller voltage changes and show a transient current (Huguenard, 1996). To investigate which subtypes of VGCCs are involved in Ca2+ entry along peripheral nerve axons, we challenged evoked Ca2+ transients with specific blockers of different VGCCs subtypes. Application of N-type VGCCs blocker ω-conotoxin GVIA (1 μM) reduced the peak amplitude of Ca2+ transients by 40 ± 3% (Figures 4B,F; n = 4). L-type VGCCs blockers nisoldipine (1 μM) or nifedipine (10 μM) inhibited the peak amplitude of Ca2+ transients by 15 ± 3% (Figures 4C,F; n = 5) or by 12 ± 7% p = 0.32 (not shown; n = 2), respectively. In contrast, application of P/Q-type VGCCs blocker ω-agatoxin IVa (500 nM) or T-type VGCCs blocker TTA-P2 (1 μM) did not significantly change the peak amplitude of Ca2+ transients: amplitude in the presence of ω-agatoxin IVa was reduced by 4 ± 6% (Figures 4D,F; n = 4) while in the presence of TTA-P2 it was reduced by 4.2 ± 7% (Figures 4E,F; n = 5). These results indicate that Ca2+ influx along sciatic nerve axons is partially mediated by N- and L-type VGCCs while P/Q and T-type VGCCs are not involved.
Immunohistological Evidence for VGCCs in the Mouse Sciatic Nerve
To obtain additional independent evidence for the presence of VGCCs in the developing mouse sciatic nerve, we performed immunohistochemistry. We found that both L- and N-type VGCCs were present in the nerve, but their localization was different. L-type VGCCs appeared on bundles of thin axons which often showed weaker labeling with neurofilament (NF200) than the other axons in the nerve (n = 3 animals, Figures 5A–H). The axons expressing L-type VGCCs showed no co-labeling with myelin basic protein (MBP; n = 3 animals, Figures 5I–L) or choline acetyltransferase (ChAT), a marker of motor axons (n = 3 animals, Figures 5M–P). These findings suggest that L-type VGCCs are expressed by non-myelinated sensory fibers. N-type VGCCs appeared on myelinated axons (n = 3 animals, Figures 6E–H) which were also positive for NF200 (n = 3 animals, Figures 6A–D). Yet the resolution of our confocal system did not allow to reliably conclude whether N-type VGCCs were expressed solely on the axonal membrane or on the myelin as well. Some axons positive for N-type VGCCs co-labeled with ChAT (n = 3 animals, Figures 6I–O), while other axons expressing N-type VGCCs were negative for ChAT (n = 3 animals, Figures 6I–L,P–R). These data point to the fact that N-type VGCCs are present on myelinated sensory and motor fibers.
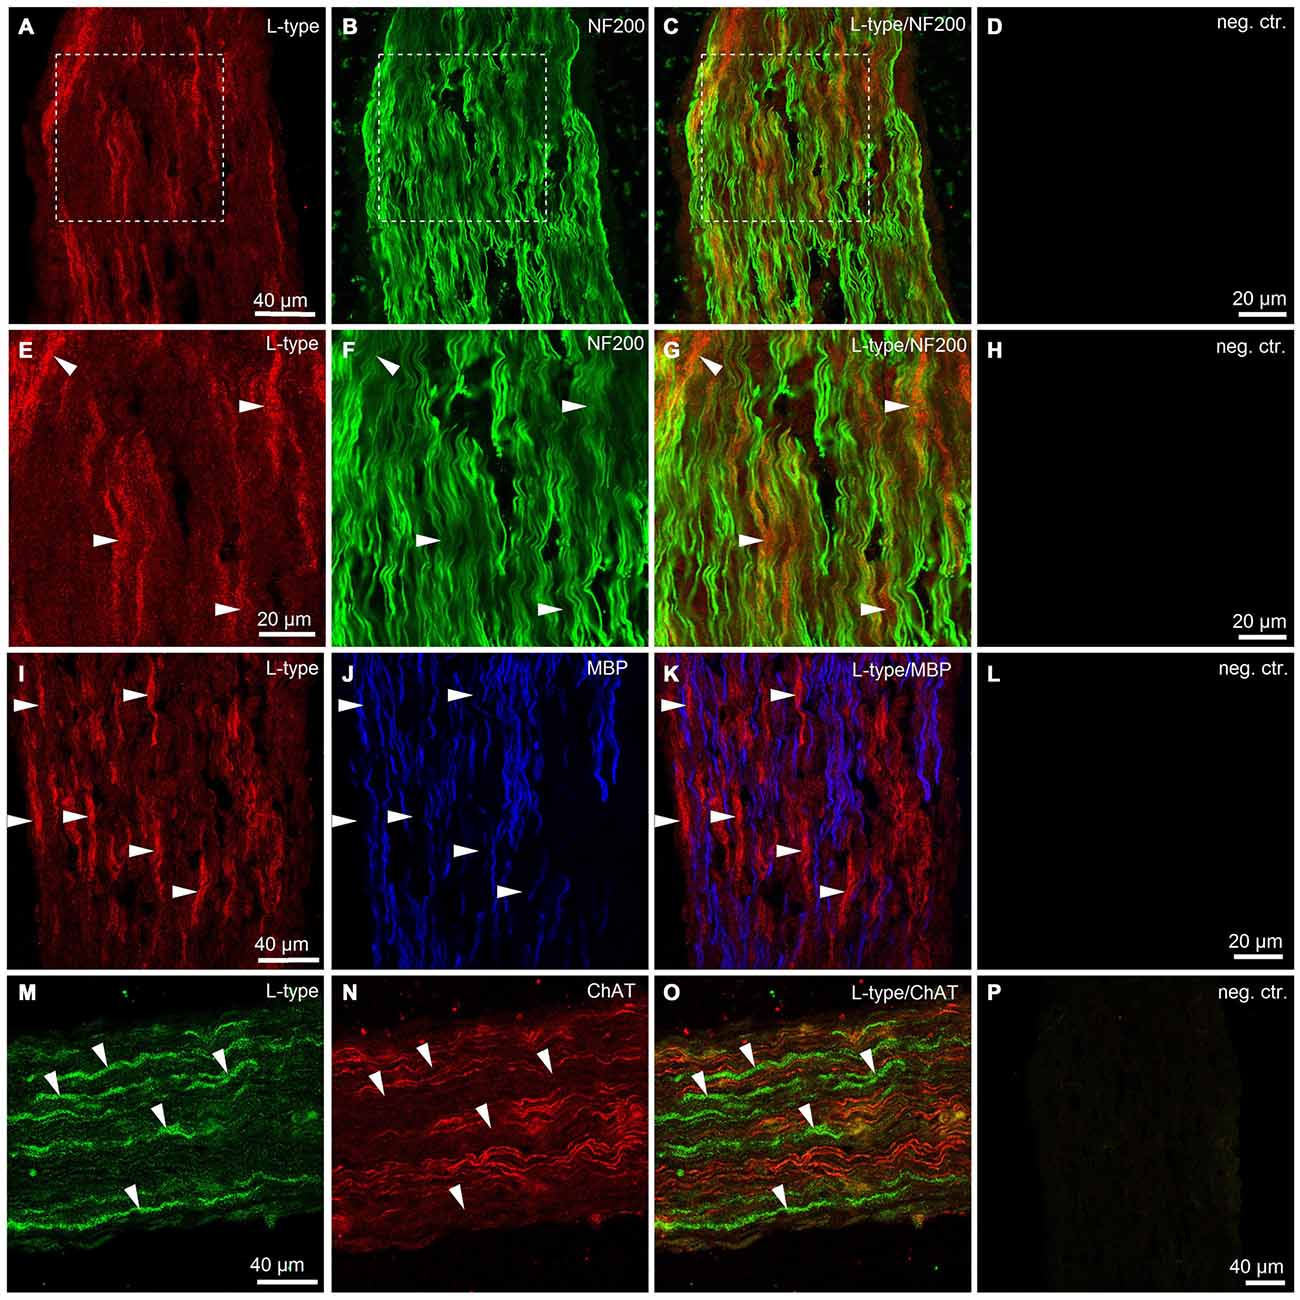
Figure 5. Immunohistological evidence for L-type VGCCs in the developing mouse sciatic nerve. (A) Confocal image (single plane) showing labeling of sciatic nerve axons with antibody against L-type VGCC (red, rhodamine-red-X, RRX). (B) Confocal image (single plane) showing labeling of sciatic nerve axons with antibody against neurofilament 200 kDa, NF200 (green, Alexa-Fluor-488). (C) Overlay of green and red channels. (D) Negative control, i.e., both primary antibodies are omitted. Scale bar shown in (A) is the same for images (A–C). Dotted white boxes in panels (A–C) indicate the region for which the higher magnification images are shown in panels (E–G). (E–G) Higher magnification images of the region marked with white boxes in panels (A–C). Note that mainly the thin axons labeled weakly with neurofilament 200 kD are stained for L-type VGCCs (arrowheads). (H) Negative control, i.e., both primary antibodies are omitted. Scale bar shown in (E) is the same for images (E–G). (I) Confocal image (single plane) showing labeling of sciatic nerve axons with antibody against L-type VGCCs (red, RRX). (J) Confocal image (single plane) showing labeling of sciatic nerve axons with antibody against myelin basic protein, MBP (blue, Alexa-Fluo-633). (K) Overlay of red and blue channels. (L) Negative control, i.e., both primary antibodies are omitted. Scale bar shown in (I) is the same for images (I–K). Note absence of co-localization between L-type VGCCs and MBP (arrowheads). (M) Confocal image (single plane) showing labeling of sciatic nerve axons with antibody against L-type VGCCs (green, Alexa-Fluor-488). (N) Confocal image (single plane) showing labeling of sciatic nerve axons with antibody against choline acetyltransferase, ChAT (red, Cy3). (O) Overlay of green and red channels. (P) Negative control, i.e., both primary antibodies are omitted. Scale bar shown in (M) is the same for images (M–O). Note absence of co-localization between L-type VGCCs and ChAT (arrowheads). The example images shown in (A–H), (I–L), and (M–P) are from three different animals, respectively.
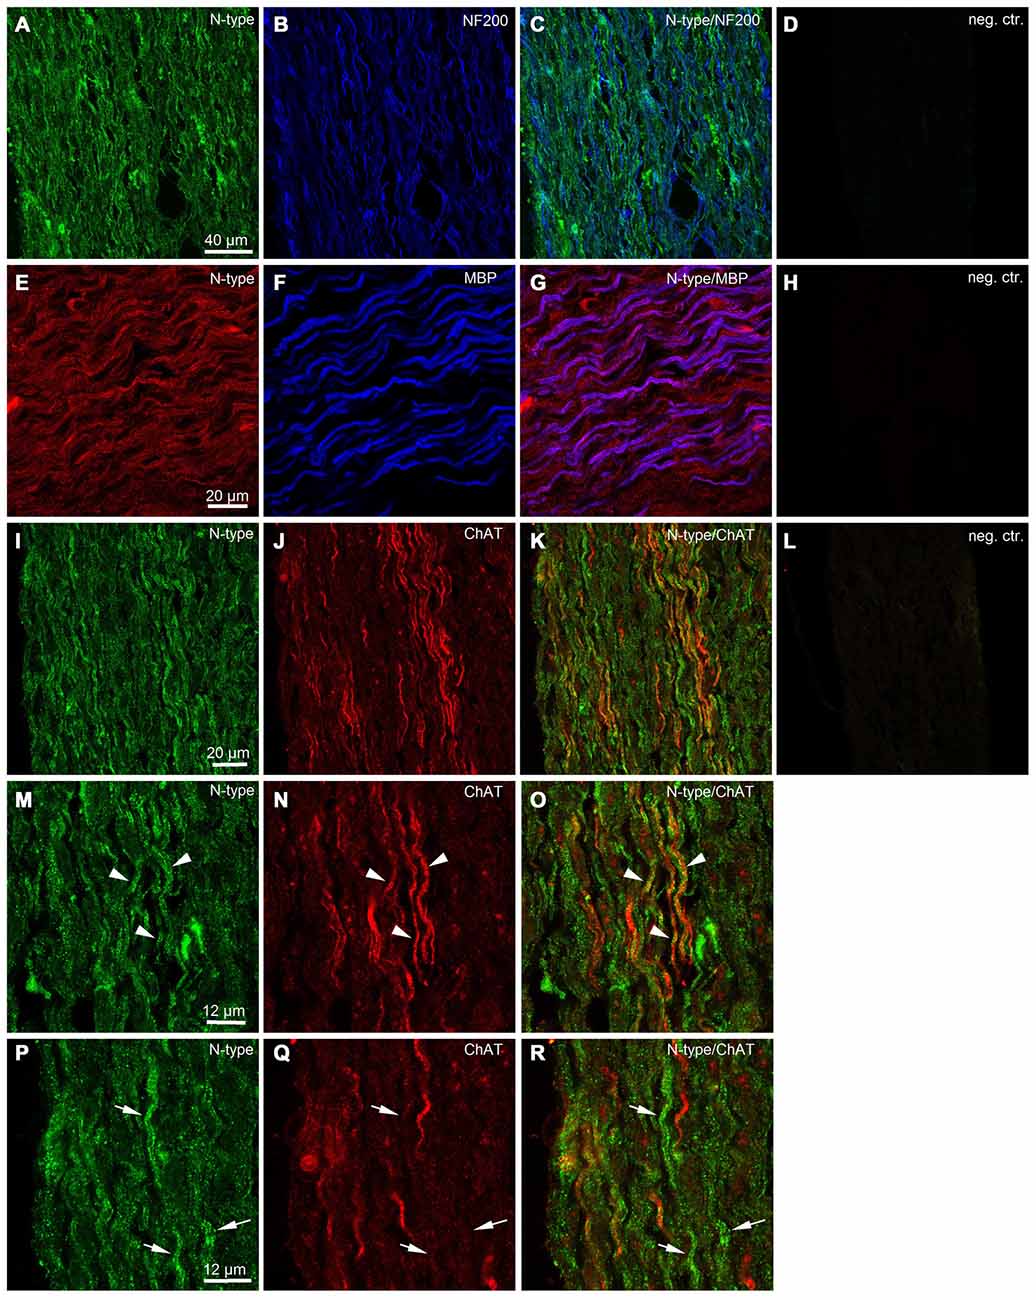
Figure 6. Immunohistological evidence for N-type VGCCs in the developing mouse sciatic nerve. (A) Confocal image (single plane) showing labeling of sciatic nerve axons with antibody against N-type VGCC (green, Alexa-Fluor-488). (B) Confocal image (single plane) showing labeling of sciatic nerve axons with antibody against neurofilament 200 kDa (blue, Cy5). (C) Overlay of green and blue channels. (D) Negative control, i.e., both primary antibodies are omitted. Scale bar shown in (A) is the same for images (A–D). (E) Confocal image (single plane) showing labeling of sciatic nerve axons with antibody against N-type VGCCs (red, RRX). (F) Confocal image (single plane) showing labeling of sciatic nerve axons with antibody against (MBP) blue, Alexa-Fluor-633. (G) Overlay of red and blue channels. (H) Negative control, i.e., both primary antibodies are omitted. Scale bar shown in (E) is the same for images (E–H). (I) Confocal image (single plane) showing labeling of sciatic nerve axons with antibody against N-type VGCCs (green, Alexa-Fluor-488). (J) Confocal image (single plane) showing labeling of sciatic nerve axons with antibody against ChAT (red, Cy3). (K) Overlay of green and red channels. (L) Negative control, i.e., both primary antibodies are omitted. Scale bar shown in (I) is the same for images (I–L). (M) Confocal image (single plane) showing labeling of sciatic nerve axons with antibody against N-type VGCCs (green, Alexa-Fluor-488). (N) Confocal image (single plane) showing labeling of sciatic nerve axons with antibody against ChAT (red, Cy3). (O) Overlay of green and red channels. Arrowheads indicate axons co-labeled with N-type VGCCs and ChAT. Scale bar shown in (M) is the same for images (M–O). (P) Confocal image (single plane) showing labeling of sciatic nerve axons with antibody against N-type VGCCs (green, Alexa-Fluor-488). (Q) Confocal image (single plane) showing labeling of sciatic nerve axons with antibody against ChAT (red, Cy3). (R) Overlay of green and red channels. Arrows indicate axons labeled with N-type VGCCs but negative for ChAT. Scale bar shown in (P) is the same for images (P–R). The example images shown in (A–D) and (I–R) are from the same animal, while the example images shown in (E–H) are from another animal.
Discussion
The first important finding of the present study is that transient increases in axoplasmic Ca2+ concentration take place in axonal shafts of neonatal mouse peripheral nerve when axons are stimulated electrically with single pulses. Further, we show for the first time that Ca2+ transients in peripheral nerves in situ are fast, i.e., occur in a millisecond time-domain. Up to now few studies have reported transient activity-dependent Ca2+ elevations along peripheral nerve axons in situ (Elliott et al., 1989; Quasthoff et al., 1995, 1996; Wächtler et al., 1998; Mayer et al., 1999; Jackson et al., 2001). However, no reasonable conclusion regarding kinetic parameters of Ca2+ transients can be made from these studies because the time-course of Ca2+ transients is rate-limited by slow acquisition, i.e., slow frame scanning mode and low sampling rate (~2.5 Hz; Jackson et al., 2001). At the same time Ca2+ transients with fast kinetics have been reported in axons of dorsal root ganglion neurons in culture but the involvement of VGCCs in Ca2+ elevations in culture has not been investigated (Lüscher et al., 1996). In the present study we used fast acquisition mode, i.e., line-scanning at 500 Hz, and found that action potentials in mouse sciatic nerve axons in situ trigger axoplasmic Ca2+ elevations which rise relatively fast (10–90% rise-time is ~7.7 ms) and decay back to baseline with a slower time constant τ of ~320 ms, as estimated with high-affinity Ca2+ indicator OGB-1. These values are quite similar to those obtained with a Ca2+ indicator of comparable Kd in other preparations, including mouse cerebellar mossy fiber boutons (Delvendahl et al., 2015) and presynaptic terminals of rat calyx of Held (Borst et al., 1995). Remarkably, aiming for sufficient sensitivity and good signal-to-noise ratio during imaging of small axons in neonatal mouse nerve, we selected a high-affinity Ca2+ indicator OGB-1 (Kd = 170 nM) for our experiments. The shortcoming of this experimental design is that OGB-1 may be too slow to precisely follow rapid changes in intra-axonal Ca2+ concentration, and most likely also adds some buffer capacity to the axoplasm (Regehr and Atluri, 1995). Hence, the factual activity-dependent Ca2+ dynamics in the axoplasm is likely to be even faster than reported by OGB-1. Taken together, our findings indicate that transient activity-dependent Ca2+ elevations along peripheral nerve axons can occur on a rapid time-scale, similar as it happens at synaptic boutons or along axonal shafts in the CNS.
The second important finding of our study is that activity-dependent Ca2+ transients along peripheral nerve axons in neonatal mouse depend on Ca2+ influx from extracellular space and involve activation of N- and L-type VGCCs. We found that a blocker of N-type VGCCs, ω-conotoxin GVIA, reduced the amplitude of Ca2+ transients by ~40%, the blockers of L-type VGCCs nisoldipine or nifedipine caused ~15% reduction, while the blockers of P/Q- and T-type channels were ineffective. Furthermore, the results of our immunohistological experiments suggest that in the developing mouse sciatic nerve L-type VGCCs are present on non-myelinated sensory fibers, while N-type channels appear on myelinated motor and sensory axons. To the best of our knowledge, this is the first report about subtypes of functional VGCCs present along the peripheral nerve axons in neonatal mice. Interestingly, in neonatal rodent central (optic) nerve likewise L- or N-type VGCCs were suggested to be of functional significance (Sun and Chiu, 1999; Alix et al., 2008), while P/Q-type channels seem to get involved later during development (Alix et al., 2008). L- and/or N-type VGCCs also mediate Ca2+ influx in adult optic nerve during pathological conditions (Fern et al., 1995; Brown et al., 2001). When we compared our findings on VGCCs subtypes in neonatal mouse sciatic nerve to another preparation of peripheral nerve, i.e., adult mouse postganglionic sympathetic axon bundle, it turned out that also in those axons ~40% of the total Ca2+ influx is carried by N-type VGCCs, however, in contrast to our findings, L-type VGCCs were not involved (Jackson et al., 2001). In adult mouse C-fibers T-type VGCCs have been suggested to play a role in modulating action potential conduction velocity (François et al., 2015), however in the neonatal mouse we could not find T-type VGCCs contribution to Ca2+ influx along the axons. Remarkably, at the mammalian neuromuscular junction, where some of the peripheral nerve axons terminate, P/Q-type represents the major subtype of VGCCs, although L- and N-type VGCCs also play a role during development, re-innervation or pathological conditions (Katz et al., 1996; Nudler et al., 2003). At the distal nerve endings, in turn, T-type VGCCs have been found in addition to other VGCCs subtypes (François et al., 2015). Hence the specific subtypes of VGCCs are likely targeted differently to different functional compartments of the same axon, and may be also differently regulated in developing and adult animals, as well as during pathological conditions. In addition to known VGCCs subtypes other yet unidentified subtypes of VGCCs, or alternative routes (e.g., reversed Na+/Ca2+ exchanger, release from internal store), may contribute to activity-dependent Ca2+ entry into the axoplasm of peripheral nerve axons. In line with this idea are our findings that Ca2+ transients in mouse sciatic nerve are reduced only partially by specific blockers of VGCCs. Furthermore, also in the unmyelinated nerve fibers of rat vagus nerve neither L- nor N-type nor P/Q-type VGCCs mediated Ca2+ entry along the axons, although Ca2+ transients in that preparation were largely inhibited by Cd2+ (Wächtler et al., 1998). Hence, more experiments in various preparations of central and peripheral nerves/white matter are required to clarify this issue.
Why do peripheral nerve axons express VGCCs along their shafts, and what could be the functional significance of activity-dependent axonal Ca2+ transients under physiological circumstances? Ca2+ is involved in the majority of cellular functions. Importantly, as cells keep free cytosolic Ca2+ level very low (~100 nM), what determines the specificity and the functional output of each Ca2+-dependent process is the amplitude, the time-course and the spatial domain of a transient change in intracellular Ca2+ concentration (Berridge et al., 2003). Fast (microseconds to milliseconds) Ca2+ transients are usually involved in fast cellular processes, e.g., synaptic transmission, opening of Ca2+-dependent channels, muscle contraction, etc (Berridge et al., 2003). At axonal synaptic terminals, for example, highly localized (nano- or microdomains) rapidly rising (<1 ms) and large (~20 fold) Ca2+ elevations mediated by VGCCs trigger rapid release of synaptic vesicles and ensure high precision of synaptic signaling (Kandel et al., 2000). In turn, more global residual Ca2+ changes, which are also slower and smaller in amplitude, contribute to modulation of transmitter release, e.g., synaptic potentiation (Swandulla et al., 1991; Wang and Augustine, 2015). We want to emphasize that as Ca2+ transients recorded along peripheral nerve axons in our study rise in a range of few milliseconds (10–90% rise time ~7.7 ms) and this time probably underestimates the true speed of Ca2+ influx into the axon upon action potential propagation, these Ca2+ transients are well suited to trigger or/and modulate relatively fast axonal processes. For example, transient increase in axoplasmic Ca2+ concentration may be involved in regulation of action potential conduction or frequency through e.g., activation of Ca2+-dependent K+ and/or Cl− channels, or inactivation of Ca2+ channels (Jirounek et al., 1991; Lüscher et al., 1996; Sun and Chiu, 1999; Alix et al., 2008). Another possible function of VGCCs and fast Ca2+ entry in peripheral axons, rarely considered in the literature, could be the contribution to neurotransmitter release (vesicular or non-vesicular) along axonal shafts. Rapid (few milliseconds) increases in Ca2+ concentration mediated by VGCCs take place along axonal shafts in white matter of the CNS (Lev-Ram and Grinvald, 1987; Sun and Chiu, 1999; Kukley et al., 2007). They result in buildup of axonal Ca2+ microdomains which are involved in triggering fast vesicular release of glutamate at synaptic-like junctions between axons and glia cells (Kukley et al., 2007; Ziskin et al., 2007). Intriguingly, peripheral axons also appear capable of releasing neurotransmitters (glutamate and acetylcholine) from their shafts at least in two experimental paradigms: (a) when nerves are dissected from an animal, placed in Ringer solution and stimulated electrically (Lissak, 1939; Vizi et al., 1983); or (b) when dissected nerves are pre-loaded with labeled neurotransmitters, (e.g., 14C-glutamate, tritiated choline, d-2, 3-(3)H-aspartic acid) and stimulated electrically or magnetically (Wheeler et al., 1966; DeFeudis, 1971; Weinreich and Hammerschlag, 1975; Vizi et al., 1983; Wieraszko and Ahmed, 2009). The mechanisms of neurotransmitter release from peripheral nerve axons in situ or in vivo remain largely un-investigated. But it is tempting to speculate that peripheral axons utilize similar mechanism of release as callosal and optic nerve axons, i.e., VGCCs located along axonal shafts mediate Ca2+ influx followed by fusion and release of neurotransmitter filled vesicles. Subsequently, released neurotransmitter may bind to its receptors on the neighboring Schwann cells. In line with this hypothesis are the recent findings in cell culture demonstrating that vesicular release of glutamate occurs along the axons of dorsal root ganglion neurons and mediates axonal-glia communication important for myelination (Wake et al., 2011, 2015). Notably, L- and N-type VGCCs expressed in peripheral nerve axons are the VGCCs subtypes which are involved in neurotransmitter release at Ribbon synapses and at conventional synapses between neurons, respectively (Catterall, 2011). Few older studies also show that axonal release in peripheral nerves resembles the axon terminal release in many respects, e.g., it depends on extracellular Ca2+ and is stimulated by elevated extracellular K+ (Dettbarn and Rosenberg, 1966; Vizi et al., 1983; Wieraszko and Ahmed, 2009). Yet, other investigators do not support these findings and suggest that the mechanism of axonal release in the peripheral nerves differs from release at synapses (Weinreich and Hammerschlag, 1975).
Finally, evidence is currently accumulating that multiple subtypes of VGCCs may contribute to injury mechanisms of central white matter axons (Fern et al., 1995; Brown et al., 2001; Tsutsui and Stys, 2013). In light of those findings it is likely that in addition to their physiological role, also VGCCs located along peripheral nerve axons may be of significance during pathological conditions, e.g., nerve injury, pain, or peripheral neuropathy.
Author Contributions
All experiments were conducted in the laboratory of MK at the Centre for Integrative Neuroscience, University of Tübingen. MK and RB designed experiments. RB and FP performed experiments and analyzed data. MK and RB interpreted the findings, prepared the figures, and wrote the manuscript.
Funding
This work was supported by the Deutsche Forschungsgemeinschaft (DFG) grants: KU2569/1-1 to MK, and PF574/5-1 to FP. This work was also supported by the Werner Reichardt Centre for Integrative Neuroscience (CIN) at the Eberhard Karls University of Tübingen. The CIN is an Excellence Cluster funded by the DFG within the framework of the Excellence Initiative (EXC 307).
Conflict of Interest Statement
The authors declare that the research was conducted in the absence of any commercial or financial relationships that could be construed as a potential conflict of interest.
Acknowledgments
We thank Dirk Jancke (Ruhr University Bochum), Dirk Dietrich (University of Bonn), and the members of Kukley’s laboratory Ting-Jiun Chen, Bartosz Kula and Balint Nagy for comments on the manuscript. We thank Nicole Fröhlich for help with sciatic nerve slice preparation, and Daniela Eißler for excellent technical assistance.
Abbreviations
ACSF, artificial cerebrospinal fluid; BAPTA, 1,2-bis(o-aminophenoxy)ethane-N, N, N′, N′-tetraacetic acid; Ca2+, calcium; Cd2+, cadmium; ChAT, choline acetyltransferase; DAPI, 4′,6-diamidino-2-phenylindole; K+, potassium; Kd, dissociation constant; MBP, myelin basic protein; Na+, sodium; NF200, neurofilament 200 kDa; OGB-1, Oregon Green BAPTA-1; PBS, phosphate-buffered saline; PFA, paraformaldehyde; RRX, rhodamine red X; TBS, tris-buffered saline; TTA-P2, 3,5-dichloro-N-[1-(2,2-dimethyl-tetrahydro-pyran-4-ylmethyl)-4-fluoro-piperidin-4-ylmethyl]-benzamide; TTX, tetrodotoxin; VGCCs, voltage-gated calcium channels.
References
Alix, J. J., Dolphin, A. C., and Fern, R. (2008). Vesicular apparatus, including functional calcium channels, are present in developing rodent optic nerve axons and are required for normal node of Ranvier formation. J. Physiol. 586, 4069–4089. doi: 10.1113/jphysiol.2008.155077
Augustine, G. J., and Charlton, M. P. (1986). Calcium dependence of presynaptic calcium current and post-synaptic response at the squid giant synapse. J. Physiol. 381, 619–640. doi: 10.1113/jphysiol.1986.sp016347
Bean, B. P. (1985). Two kinds of calcium channels in canine atrial cells. Differences in kinetics, selectivity and pharmacology. J. Gen. Physiol. 86, 1–30. doi: 10.1085/jgp.86.1.1
Berridge, M. J., Bootman, M. D., and Roderick, H. L. (2003). Calcium signalling: dynamics, homeostasis and remodelling. Nat. Rev. Mol. Cell Biol. 4, 517–529. doi: 10.1038/nrm1155
Borst, J. G., Helmchen, F., and Sakmann, B. (1995). Pre- and postsynaptic whole-cell recordings in the medial nucleus of the trapezoid body of the rat. J. Physiol. 489, 825–840. doi: 10.1113/jphysiol.1995.sp021095
Brown, A. M., Westenbroek, R. E., Catterall, W. A., and Ransom, B. R. (2001). Axonal L-type Ca2+ channels and anoxic injury in rat CNS white matter. J. Neurophysiol. 85, 900–911.
Bucher, D., and Goaillard, J. M. (2011). Beyond faithful conduction: short-term dynamics, neuromodulation and long-term regulation of spike propagation in the axon. Prog. Neurobiol. 94, 307–346. doi: 10.1016/j.pneurobio.2011.06.001
Callewaert, G., Eilers, J., and Konnerth, A. (1996). Axonal calcium entry during fast ‘sodium’ action potentials in rat cerebellar Purkinje neurones. J. Physiol. 495, 641–647. doi: 10.1113/jphysiol.1996.sp021622
Catterall, W. A. (2011). Voltage-gated calcium channels. Cold Spring Harb. Perspect. Biol. 3:a003947. doi: 10.1101/cshperspect.a003947
Chan, S. Y., Ochs, S., and Worth, R. M. (1980). The requirement for calcium ions and the effect of other ions on axoplasmic transport in mammalian nerve. J. Physiol. 301, 477–504. doi: 10.1113/jphysiol.1980.sp013219
DeFeudis, F. V. (1971). Effects of electrical stimulation on the efflux of L-glutamate from peripheral nerve in vitro. Exp. Neurol. 30, 291–296. doi: 10.1016/s0014-4886(71)80008-0
Delvendahl, I., Jablonski, L., Baade, C., Matveev, V., Neher, E., and Hallermann, S. (2015). Reduced endogenous Ca2+ buffering speeds active zone Ca2+ signaling. Proc. Natl. Acad. Sci. U S A 112, E3075–E3084. doi: 10.1073/pnas.1508419112
Dettbarn, W. D., and Rosenberg, P. (1966). Effect of ions on the efflux of acetylcholine from peripheral nerve. J. Gen. Physiol. 50, 447–460. doi: 10.1085/jgp.50.2.447
Dolphin, A. C. (2006). A short history of voltage-gated calcium channels. Br. J. Pharmacol. 147, S56–S62. doi: 10.1038/sj.bjp.0706442
Eberhardt, M., Hoffmann, T., Sauer, S. K., Messlinger, K., Reeh, P. W., and Fischer, M. J. (2008). Calcitonin gene-related peptide release from intact isolated dorsal root and trigeminal ganglia. Neuropeptides 42, 311–317. doi: 10.1016/j.npep.2008.01.002
Elliott, P., Marsh, S. J., and Brown, D. A. (1989). Inhibition of Ca-spikes in rat preganglionic cervical sympathetic nerves by sympathomimetic amines. Br. J. Pharmacol. 96, 65–76. doi: 10.1111/j.1476-5381.1989.tb11785.x
Ermolyuk, Y. S., Alder, F. G., Surges, R., Pavlov, I. Y., Timofeeva, Y., Kullmann, D. M., et al. (2013). Differential triggering of spontaneous glutamate release by P/Q-, N- and R-type Ca2+ channels. Nat. Neurosci. 16, 1754–1763. doi: 10.1038/nn.3563
Fern, R., Ransom, B. R., and Waxman, S. G. (1995). Voltage-gated calcium channels in CNS white matter: role in anoxic injury. J. Neurophysiol. 74, 369–377.
Forti, L., Pouzat, C., and Llano, I. (2000). Action potential-evoked Ca2+ signals and calcium channels in axons of developing rat cerebellar interneurones. J. Physiol. 527, 33–48. doi: 10.1111/j.1469-7793.2000.00033.x
François, A., Schüetter, N., Laffray, S., Sanguesa, J., Pizzoccaro, A., Dubel, S., et al. (2015). The low-threshold calcium channel Cav3.2 determines low-threshold mechanoreceptor function. Cell Rep. doi: 10.1016/j.celrep.2014.12.042 [Epub ahead of print].
Huguenard, J. R. (1996). Low-threshold calcium currents in central nervous system neurons. Annu. Rev. Physiol. 58, 329–348. doi: 10.1146/annurev.ph.58.030196.001553
Jackson, V. M., Trout, S. J., Brain, K. L., and Cunnane, T. C. (2001). Characterization of action potential-evoked calcium transients in mouse postganglionic sympathetic axon bundles. J. Physiol. 537, 3–16. doi: 10.1111/j.1469-7793.2001.0003k.x
Jirounek, P., Chardonnens, E., and Brunet, P. C. (1991). After potentials in nonmyelinated nerve fibers. J. Neurophysiol. 65, 860–873.
Kandel, E. R., Schwartz, J. H., and Jessell, T. M. (2000). Principles of Neural Science. New York: McGraw-Hill Companies, Inc.
Katz, E., Ferro, P. A., Weisz, G., and Uchitel, O. D. (1996). Calcium channels involved in synaptic transmission at the mature and regenerating mouse neuromuscular junction. J. Physiol. 497, 687–697. doi: 10.1113/jphysiol.1996.sp021800
Kinkelin, I., Brocker, E. B., Koltzenburg, M., and Carlton, S. M. (2000). Localization of ionotropic glutamate receptors in peripheral axons of human skin. Neurosci. Lett. 283, 149–152. doi: 10.1016/s0304-3940(00)00944-7
Koester, H. J., and Sakmann, B. (2000). Calcium dynamics associated with action potentials in single nerve terminals of pyramidal cells in layer 2/3 of the young rat neocortex. J. Physiol. 529, 625–646. doi: 10.1111/j.1469-7793.2000.00625.x
Kostyuk, P. G., Veselovsky, N. S., and Tsyndrenko, A. Y. (1981). Ionic currents in the somatic membrane of rat dorsal root ganglion neurons-I. Sodium currents. Neuroscience 6, 2423–2430. doi: 10.1016/0306-4522(81)90088-9
Kukley, M., Capetillo-Zarate, E., and Dietrich, D. (2007). Vesicular glutamate release from axons in white matter. Nat. Neurosci. 10, 311–320. doi: 10.1038/nn1850
Lehning, E. J., Doshi, R., Isaksson, N., Stys, P. K., and LoPachin, R. M., Jr. (1996). Mechanisms of injury-induced calcium entry into peripheral nerve myelinated axons: role of reverse sodium-calcium exchange. J. Neurochem. 66, 493–500. doi: 10.1046/j.1471-4159.1996.66020493.x
Lev-Ram, V., and Grinvald, A. (1987). Activity-dependent calcium transients in central nervous system myelinated axons revealed by the calcium indicator Fura-2. Biophys. J. 52, 571–576. doi: 10.1016/s0006-3495(87)83246-0
Lissak, K. (1939). Liberation of acetylcholine and adrenaline by stimulating isolated nerves. Am. J. Physiol. 127, 263–271.
Lüscher, C., Lipp, P., Lüscher, H. R., and Niggli, E. (1996). Control of action potential propagation by intracellular Ca2+ in cultured rat dorsal root ganglion cells. J. Physiol. 490, 319–324. doi: 10.1113/jphysiol.1996.sp021146
Matute, C. (2010). Calcium dyshomeostasis in white matter pathology. Cell Calcium 47, 150–157. doi: 10.1016/j.ceca.2009.12.004
Mayer, C., Quasthoff, S., and Grafe, P. (1999). Confocal imaging reveals activity-dependent intracellular Ca2+ transients in nociceptive human C fibres. Pain 81, 317–322. doi: 10.1016/s0304-3959(99)00015-9
Mintz, I. M., Sabatini, B. L., and Regehr, W. G. (1995). Calcium control of transmitter release at a cerebellar synapse. Neuron 15, 675–688. doi: 10.1016/0896-6273(95)90155-8
Nudler, S., Piriz, J., Urbano, F. J., Rosato-Siri, M. D., Renteria, E. S., and Uchitel, O. D. (2003). Ca2+ channels and synaptic transmission at the adult, neonatal and P/Q-type deficient neuromuscular junction. Ann. N Y Acad. Sci. 998, 11–17. doi: 10.1196/annals.1254.003
Ouardouz, M., Nikolaeva, M. A., Coderre, E., Zamponi, G. W., McRory, J. E., Trapp, B. D., et al. (2003). Depolarization-induced Ca2+ release in ischemic spinal cord white matter involves L-type Ca2+ channel activation of ryanodine receptors. Neuron 40, 53–63. doi: 10.1016/j.neuron.2003.08.016
Quasthoff, S., Adelsberger, H., Grosskreutz, J., Arzberger, T., and Schroder, J. M. (1996). Immunohistochemical and electrophysiological evidence for omega-conotoxin-sensitive calcium channels in unmyelinated C-fibres of biopsied human sural nerve. Brain Res. 723, 29–36. doi: 10.1016/0006-8993(96)00186-2
Quasthoff, S., Grosskreutz, J., Schröder, J. M., Schneider, U., and Grafe, P. (1995). Calcium potentials and tetrodotoxin-resistant sodium potentials in unmyelinated C fibres of biopsied human sural nerve. Neuroscience 69, 955–965. doi: 10.1016/0306-4522(95)00307-5
Regehr, W. G. (2000). “Monitoring presynaptic calcium dynamics with membrane-permeant indicators,” in Imaging Neurons. A Laboratory Manual, eds R. Yuste, F. Lanni and A. Konnerth (New York, NY: Cold Spring Harbor Laboratory Press), 37.1–37.11.
Regehr, W. G., and Atluri, P. P. (1995). Calcium transients in cerebellar granule cell presynaptic terminals. Biophys. J. 68, 2156–2170. doi: 10.1016/s0006-3495(95)80398-x
Sargoy, A., Sun, X., Barnes, S., and Brecha, N. C. (2014). Differential calcium signaling mediated by voltage-gated calcium channels in rat retinal ganglion cells and their unmyelinated axons. PLoS One 9:e84507. doi: 10.1371/journal.pone.0084507
Spitzer, M. J., Reeh, P. W., and Sauer, S. K. (2008). Mechanisms of potassium- and capsaicin-induced axonal calcitonin gene-related peptide release: involvement of L- and T-type calcium channels and TRPV1 but not sodium channels. Neuroscience 151, 836–842. doi: 10.1016/j.neuroscience.2007.10.030
Sun, B. B., and Chiu, S. Y. (1999). N-type calcium channels and their regulation by GABAB receptors in axons of neonatal rat optic nerve. J. Neurosci. 19, 5185–5194.
Swandulla, D., Hans, M., Zipser, K., and Augustine, G. J. (1991). Role of residual calcium in synaptic depression and posttetanic potentiation: fast and slow calcium signaling in nerve terminals. Neuron 7, 915–926. doi: 10.1016/0896-6273(91)90337-y
Thaxton, C., Bott, M., Walker, B., Sparrow, N. A., Lambert, S., and Fernandez-Valle, C. (2011). Schwannomin/merlin promotes Schwann cell elongation and influences myelin segment length. Mol. Cell. Neurosci. 47, 1–9. doi: 10.1016/j.mcn.2010.12.006
Tsutsui, S., and Stys, P. K. (2013). Metabolic injury to axons and myelin. Exp. Neurol. 246, 26–34. doi: 10.1016/j.expneurol.2012.04.016
Villegas, R., Martinez, N. W., Lillo, J., Pihan, P., Hernandez, D., Twiss, J. L., et al. (2014). Calcium release from intra-axonal endoplasmic reticulum leads to axon degeneration through mitochondrial dysfunction. J. Neurosci. 34, 7179–7189. doi: 10.1523/JNEUROSCI.4784-13.2014
Vizi, E. S., Gyires, K., Somogyi, G. T., and Ungváry, G. (1983). Evidence that transmitter can be released from regions of the nerve cell other than presynaptic axon terminal: axonal release of acetylcholine without modulation. Neuroscience 10, 967–972. doi: 10.1016/0306-4522(83)90234-8
Wächtler, J., Mayer, C., and Grafe, P. (1998). Activity-dependent intracellular Ca2+ transients in unmyelinated nerve fibres of the isolated adult rat vagus nerve. Pflugers Arch. 435, 678–686. doi: 10.1007/s004240050569
Wake, H., Lee, P. R., and Fields, R. D. (2011). Control of local protein synthesis and initial events in myelination by action potentials. Science 333, 1647–1651. doi: 10.1126/science.1206998
Wake, H., Ortiz, F. C., Woo, D. H., Lee, P. R., Angulo, M. C., and Fields, R. D. (2015). Nonsynaptic junctions on myelinating glia promote preferential myelination of electrically active axons. Nat. Commun. 6:7844. doi: 10.1038/ncomms8844
Wang, L. Y., and Augustine, G. J. (2015). Presynaptic nanodomains: a tale of two synapses. Front. Cell. Neurosci. 8:455. doi: 10.3389/fncel.2014.00455
Weinreich, D., and Hammerschlag, R. (1975). Nerve impulse-enhanced release of amino acids from non-synaptic regions of peripheral and central nerve trunks of bullfrog. Brain Res. 84, 137–142. doi: 10.1016/0006-8993(75)90807-0
Wheeler, D. D., Boyarsky, L. L., and Brooks, W. H. (1966). The release of amino acids from nerve during stimulation. J. Cell. Physiol. 67, 141–147. doi: 10.1002/jcp.1040670116
Wieraszko, A., and Ahmed, Z. (2009). Axonal release of glutamate analog, d-2,3–3H-Aspartic acid and l-14C-proline from segments of sciatic nerve following electrical and magnetic stimulation. Neurosci. Lett. 458, 19–22. doi: 10.1016/j.neulet.2009.04.024
Yuan, Y., Jiang, C. Y., Xu, H., Sun, Y., Hu, F. F., Bian, J. C., et al. (2013). Cadmium-induced apoptosis in primary rat cerebral cortical neurons culture is mediated by a calcium signaling pathway. PLoS One 8:e64330. doi: 10.1371/journal.pone.0064330
Zhang, C. L., Wilson, J. A., Williams, J., and Chiu, S. Y. (2006). Action potentials induce uniform calcium influx in mammalian myelinated optic nerves. J. Neurophysiol. 96, 695–709. doi: 10.1152/jn.00083.2006
Keywords: Ca2+ channels, peripheral nervous system, axonal shafts
Citation: Barzan R, Pfeiffer F and Kukley M (2016) N- and L-Type Voltage-Gated Calcium Channels Mediate Fast Calcium Transients in Axonal Shafts of Mouse Peripheral Nerve. Front. Cell. Neurosci. 10:135. doi: 10.3389/fncel.2016.00135
Received: 08 February 2016; Accepted: 09 May 2016;
Published: 02 June 2016.
Edited by:
Andrea Nistri, Scuola Internazionale Superiore di Studi Avanzati (SISSA), ItalyReviewed by:
Valerio Magnaghi, Università Degli Studi di Milano, ItalyRashid Giniatullin, University of Eastern Finland, Finland
Copyright © 2016 Barzan, Pfeiffer and Kukley. This is an open-access article distributed under the terms of the Creative Commons Attribution License (CC BY). The use, distribution and reproduction in other forums is permitted, provided the original author(s) or licensor are credited and that the original publication in this journal is cited, in accordance with accepted academic practice. No use, distribution or reproduction is permitted which does not comply with these terms.
*Correspondence: Maria Kukley, maria.kukley@uni-tuebingen.de
†Present address: Ruxandra Barzan, Optical Imaging Group, Institute for Neural Computation, Ruhr University Bochum, Bochum, Germany