Correlations decrease with propagation of spiking activity in the mouse barrel cortex
- Center for Learning and Memory, Section of Neurobiology, The Institute for Neuroscience, The University of Texas at Austin, Austin, TX, USA
Propagation of suprathreshold spiking activity through neuronal populations is important for the function of the central nervous system. Neural correlations have an impact on cortical function particularly on the signaling of information and propagation of spiking activity. Therefore we measured the change in correlations as suprathreshold spiking activity propagated between recurrent neuronal networks of the mammalian cerebral cortex. Using optical methods we recorded spiking activity from large samples of neurons from two neural populations simultaneously. The results indicate that correlations decreased as spiking activity propagated from layer 4 to layer 2/3 in the rodent barrel cortex.
Introduction
Propagation of suprathreshold spiking activity through populations of neurons is important for linking sensory input to behavioral output. For example in the rodent sensorimotor system activity propagates through multiple neuronal populations for motor output (Ahissar and Kleinfeld, 2003). The temporal relationships of spiking activity (correlations) across neurons in the central nervous system have an impact on information signaling and signal propagation. Therefore previous studies have examined the conditions supporting the propagation of correlated and uncorrelated activity (Vogels et al., 2005; Kumar et al., 2010). Many simulation studies using feed-forward networks have shown that correlations tend to increase as spiking activity propagates through populations of neurons (Diesmann et al., 1999; Reyes, 2003; Kumar et al., 2010; Ozer et al., 2010). Empirical studies conducted in locust auditory system also indicated that correlations increased with the propagation of spiking activity (Vogel and Ronacher, 2007). In recurrent networks, however, there are mechanisms that contribute to decorrelation of neuronal spiking activity (de la Rocha et al., 2007; Renart et al., 2010; Wiechert et al., 2010). Here we measured the change in correlations as spiking activity propagated between recurrent networks in a primary sensory cortex, the rodent barrel cortex. To measure the change in correlations as activity propagates requires recording suprathreshold activity from multiple neurons in multiple neuronal populations. We achieved this by recording spiking activity from 40 neurons in two populations simultaneously using optical methods. The results indicate that correlations, quantified as the average cross-covariance and complex coherence, decreased as spiking activity propagated from layer 4 (L4) to layer 2/3 (L2/3) in control conditions but increased in the presence of the GABAA receptor antagonist Bicuculline methiodide.
Materials and Methods
Preparation
C57Bl6 mice (P14–P20) were anesthetized by intraperitoneal injection of ketamine (>100 mg/kg) and xylazine (>20 mg/kg), decapitated, and the brain was quickly removed. All experimental procedures were approved by The Institutional Animal Care and Use Committee of The University of Texas at Austin. Acute thalamocortical brain slices (300–350 μm thick) were prepared in cold slicing solution (containing in mM: 2.5 KCl, 1.25 NaH2PO4, 25 NaHCO3, 1 CaCl2, 7 MgCl2, 7 dextrose, 240 sucrose, 1 ascorbic acid, and 3 sodium pyruvate) as described previously (Agmon and Connors, 1991). Slices were transferred to a chamber with extracellular solution (containing in mM: 125 NaCl, 2.5 KCl, 1.25 NaH2PO4, 25 NaHCO3, 1.7 CaCl2, 1 MgCl2, 10 dextrose, 1 ascorbic acid, and 3 sodium pyruvate). Both solutions were bubbled with 95% O2 and 5% CO2. Slices were incubated at 35°C for 30 min, and stored at room temperature prior to experiments. Neurons in the acute slices were visualized by differential interference contrast microscopy (DIC). After slicing, neurons within 1–2 mm2 of cortex in one acute slice were stained by multiple bolus injections of the cell permeant ester form of a Ca2+ indicator Oregon Green 488 Bapta-1 (OGB-1) AM (50 mg of indicator was dissolved in 5 μL DMSO, diluted with 34 μL extracellular solution containing pluronic (20%), final concentration of OGB-1 AM was 1 mM). The indicator was injected under visual guidance using micropipettes with larger tip openings (>2 μm diameter) using gentle positive air pressure. Pressure was controlled manually with a 5-ml syringe. Neurons were allowed to take up the indicator for at least 1 h. All experiments were carried out at ∼35°C bath temperature.
Dithered Random-Access Functional Calcium Imaging
To detect suprathreshold neuronal activity we used dithered random-access scanning in conjunction with maximum-likelihood detection (Ranganathan and Koester, 2010). Briefly, an upright microscope (BX50WI, Olympus) was coupled with the scanning module consisting of two acousto-optical deflectors (AODs, ATD-655CD2/6510CD2, IntraAction Corp.) with 10 mm apertures, to deflect the laser beam in two dimensions. The Ti:Sapphire laser source (Chameleon Ultra II, Coherent) was operated at 840–880 nm. To record from individual neurons we used a 40× water immersion objective (UMPlanFl, NA 0.8, Olympus). Somatic calcium fluorescence signals were recorded at 651 Hz from neurons at a mean depth of 102 ± 10.5 μm (n = 10 experiments) below the slice surface. In each cycle, fluorescence signals were recorded for 25.6 μs from three locations in the somata of each neuron. No recording was done while switching between neuron somata (access time, 12.8 μs). We recorded exclusively from neuronal somata and avoided astrocytes as distinguished by their distinct morphology and higher resting fluorescence (Stosiek et al., 2003; Hirase et al., 2004). Neurons were further easily distinguished from astrocytes by the calcium dynamics (Gobel and Helmchen, 2007). Fluorescence was collected by detection modules with photomultiplier tubes (PMT; H-9305, R-6357, Hamamatsu). Two detection units were used to detect both epifluorescence and transfluorescence (Koester et al., 1999).
Experimental and Analytical Methods
The locations of the somata of the recorded neurons were inferred from the overlay of fluorescence and DIC images. As an additional marker of spatial location, we placed a pipette at the border between L4 and L2/3. In the fluorescence image, the shadow of this pipette was used as a reference for neuron somata location in terms of layer and column (L4 or L2/3). To evoke cortical suprathreshold activity a theta glass stimulation electrode was placed in the thalamocortical fibers (Figure 1A). Brief electrical stimuli (3–7 at 40–100 Hz, 1 ms duration) were applied using stimulus isolators. Experimental conditions were chosen such that cortical suprathreshold responses were largely restricted to a single column. Spike timings were extracted from fluorescence signals using a maximum-likelihood deconvolution algorithm. As shown in a previous study, spike detection efficiency using these optical methods was high (>97% spike detection; 0.0023 spikes/s false positives, and average spike timing error of ∼ 3 ms; Ranganathan and Koester, 2010).
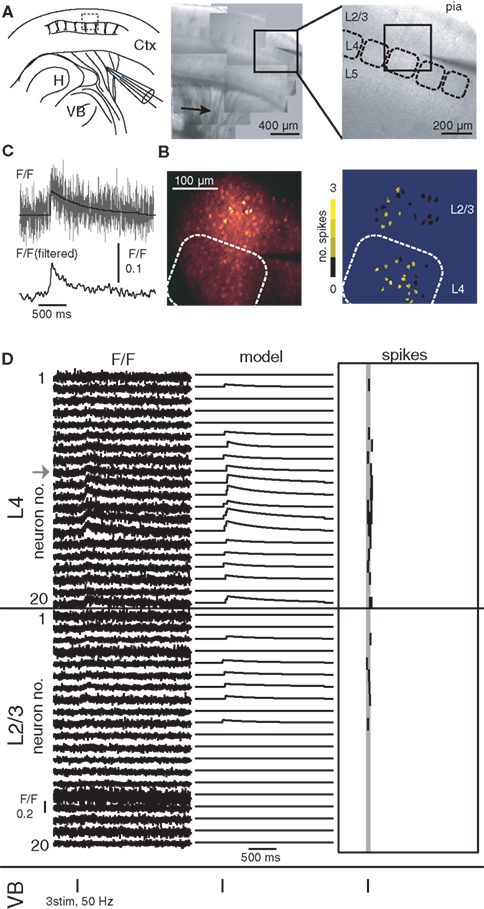
Figure 1. Propagation of spiking activity from L4 to L2/3. (A) Left: Illustration of experimental design. H, hippocampus; VB, ventrobasal nucleus of the thalamus; Ctx, cerebral cortex. Center image shows patchwork of photomicrographs showing striatum and barrel cortex in an acute thalamocortical slice. Arrow indicates position of stimulation pipette. Right image shows photomicrograph of the barrel cortex; dashed boxes illustrate L4 barrels. Image shows region indicated by box in center image. The dark shadow visible on the right is a pipette that was positioned at the border between L4 and L2/3 as a marker. (B) Left image shows fluorescence image of the region indicated by box in right image in (A). Rounded box illustrates barrel borders. Right image illustrates locations of recoded neurons, with their activity in one trial encoded in pseudocolors. (C) Magnification of fluorescence trace of one neuron for illustration. Bottom trace shows fluorescence signal (above) filtered with a 30-ms Hamming filter. (D) Suprathreshold activity recorded from 40 neurons using dithered random-access scanning, 20 neurons in L4 and 20 neurons in L2/3. Left traces show fluorescence signals (arrow marks the example neuron in C), center traces show model with maximum-likelihood, right traces detected spike timings. Gray line indicates the time window of the fiber stimulus provided. Stimulus timings are also illustrated by vertical bars below each set of traces.
Experiments where the amplitude of spiking activity in the adjacent columns was not significantly lower than the column under consideration were discarded. At the end of all experiments glutamate receptor antagonists (10 μM NQBX, 2 μM MK-801, and 50 μM AP-5) were bath applied. Experiments with phasic activity in any neuron following electrical stimulation after blocking glutamatergic synaptic transmission (n = 3) were discarded as they suggested antidromic stimulation of cortical neurons. In 9 out of 25 experiments, the amplitude of spiking activity (spike count) in L2/3 was too low to measure correlations (<0.05 spikes/neuron/trial). Furthermore, there was no neuron that had a significantly distinct spiking probability from any other neuron (Fisher’s exact probability test, α = 0.05). These experiments were also excluded from analysis. Occasionally, we observed responses that manifested as propagating waves of activity, which were not analyzed.
To measure correlations in activity, spike timings were binned into spike trains s(t). As the timescales on which correlations may be important are unknown, we used bin sizes in multiples of 1.536 ms (the temporal resolution of the fluorescence signals) up to a maximal bin size of 99.83 ms. From the binned discrete spike trains s(t) we calculated cross-covariance and complex coherence for pairs of neurons as described previously (Aertsen et al., 1989; Kimpo et al., 2003; Vogel and Ronacher, 2007; Tetzlaff et al., 2008). Cross-covariance (cov(τ)) was calculated as:
where 〈 〉 denotes expected values (average over all trials), and T denotes the length of the spike trains (number of discrete time points). For each neuron pair (i,j) the cross-covariance function was calculated over a time period restricted to 0.5 s before and after the stimulus. The cross-covariance function was normalized by auto-variance of neurons (at τ = 0) to derive the cross-correlation coefficient r (at τ = 0):
Coherence was calculated by normalizing the Fourier transform of the cross-covariance function by the Fourier transforms of the auto-covariance functions to obtain complex coherence γ (at τ = 0; Rosenberg et al., 1989; Kimpo et al., 2003; Vogel and Ronacher, 2007; Tetzlaff et al., 2008):
We obtained the complex coherence (γ (τ)) in the time domain by calculating the inverse Fourier transform of γ(ω). We refer to the normalized γ at τ = 0, as the complex coherence.
Statistical Analysis
Data are expressed as mean ± SD unless stated otherwise. For correlations measured in each experiment, we tested if the average values measured were >2 SD calculated from jackknife resampling (Thomson and Chave, 1991; Kimpo et al., 2003). As calculating variance from resampling was computationally intensive we tested only for the selected bin sizes of 10, 25, and 50 ms. For average correlations measured across experiments and the decrease in correlations both within and across experiments we tested for significance using the Student’s t-test with a significance level α = 0.05.
Results
Propagation of Spiking Activity from L4 to L2/3
To measure the propagation of suprathreshold spiking activity between cortical networks we recorded activity from 20 neurons in L4 and 20 neurons in L2/3 simultaneously in acute slices of rodent barrel cortex. Activity was evoked by focal electrical stimulation using a stimulation electrode placed on the thalamocortical fibers in the striatum (Figure 1). Suprathreshold activity was recorded with single-cell, single-spike, and high temporal resolution using dithered random-access functional calcium imaging (Grewe et al., 2010; Ranganathan and Koester, 2010). The location of recorded neuron somata in terms of cortical layer and column was inferred from the overlay of infrared DIC and fluorescence images (Figures 1A,B). In each trial of 2–3 s of fluorescence imaging, neuronal responses to one set of three to seven electrical stimuli at 40–100 Hz were recorded (Figures 1C,D). We refer to one set of electrical stimuli in one trial as an input stimulus. Laser excitation intensity was adjusted to optimize spike detection efficiency, which is bounded by photon shot noise on the lower end and photodamage on the higher (Ranganathan and Koester, 2010). Simultaneous electrophysiological recordings and optical recordings have shown that under these experimental conditions spike detection efficiency is high (>97% spike detection and low rate of false positives). Following an input stimulus, suprathreshold spiking activity was observed in L4 and L2/3 neurons. To calculate the amplitude of the suprathreshold spiking response for a population, we measured the average spikes per neuron per trial. In most trials the input stimulus elicited only one or a few spikes and response was restricted to <200 ms following the input stimulus (Figures 1B–D). The average response in L4 was 0.92 ± 0.45 spikes/cell/trial and the average response in L2/3 was 0.19 ± 0.09 spikes/cell/trial. The difference of the average timing of the first spikes in L4 and average timing in L2/3 neurons was 0.034 ± 0.08 s (n = 15 experiments, 1188 trials). The spiking response in L2/3 was significantly correlated with that in L4 (r = 0.67 ± 0.16, n = 15 experiments, p = 8.6 × 10⁻¹¹) indicating a dependence of L2/3 responses on activity in L4. We mapped the spiking activity in all three dimensions. The activity was largely restricted to the observed column. The average response in the adjacent columns was 0.039 ± 0.061 spikes/cell/trial compared to 1.02 ± 0.52 spikes/cell/trial for the observed column (n = 15 experiments). This indicated that we sampled from those neuronal populations that participated in propagating the evoked activity. Blocking glutamatergic synaptic transmission reduced responses to an average of 0.0098 ± 0.02 spikes/cell/trial (L4). This strong reduction indicated that evoked activity was not a result of antidromic stimulation of corticofugal axons.
Neural Correlations of Evoked Activity within L4 and L2/3
Suprathreshold responses were binned to measure neural correlations between pairs of neurons. As the timescales on which correlations are important are unknown we used different bin sizes at multiples of the temporal resolution of the fluorescence recordings, ranging from 1.536 to 99.83 ms. One example experiment is shown in Figure 2 with correlations calculated over a sample bin size of 6.14 ms for illustration. In each experiment, we calculated cross-correlation functions (cc(τ)) from the binned responses in a pair-wise manner for each of the 190 pairs of L4 neurons and 190 pairs of L2/3 neurons recorded simultaneously. To account for expected correlations (E[cc(τ)]) that result from co-varying firing rates of neurons we calculated cross-covariance (cov(τ)). We also calculated the complex coherence (coh(τ)) to account for any temporal structure of spiking activity within a neuron. Both the cross-covariance and coherence functions of each neuron pair were normalized by the auto-covariance. Normalization was required to compare correlations between neurons and to average over all pairs. We derived the average cross-correlation coefficient (r) and the complex coherence (γ) from the values of average cov(τ) and coh(τ) at τ = 0, across all neuron pairs.
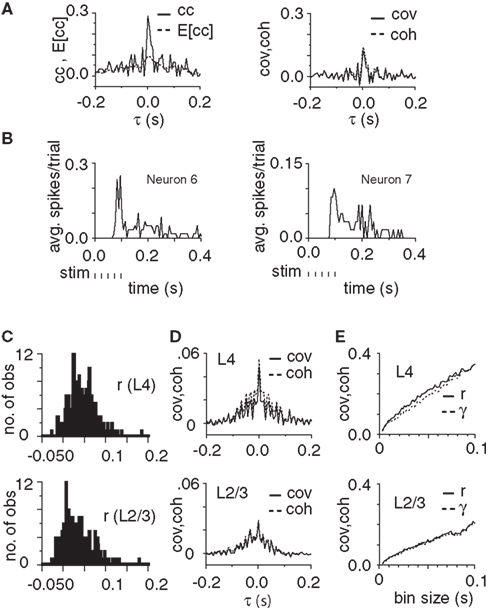
Figure 2. Signal propagation and propagation of correlations from L4 to L2/3. (A) Graphs show the cross-correlation, (cc(τ)) and expected cross-correlation, (E[cc(τ)]) functions (left) and the covariance, (cov(τ)) and coherence, (coh(τ)) functions (right) for an example pair of neurons [cov(τ) and coh(τ) denote normalized cross-covariance and complex coherence, respectively]. In the illustrated example responses were binned with a bin size of 6.14 ms. (B) Peristimulus time histograms of the two neurons. (C) Histogram of cross-correlation coefficient (r) for all 190 neuron pairs in L4 (top) and all 190 pairs in L2/3 (bottom). (D) Average covariance and coherence for all pairs of neurons in L4 (top graph) and all pairs in L2/3 (bottom graph, bin size = 6.14 ms). (E) Cross-correlation coefficient (r) and complex coherence (γ) of L4 (top) and L2/3 (bottom) neurons for bin sizes from 1.536 to 99.83 ms in steps of 1.536 ms.
Even after correcting for expected correlations we found significant temporal interactions between neurons. Figure 2A shows the cross-correlation, expected cross-correlation, cross-covariance, and complex coherence functions for an example pair of neurons. Figures 2C,D show the cross-correlation coefficients (r), cov(τ), and coh(τ) functions for an example experiment. The average covariance across all experiments was 0.092 ± 0.033 for L4 and 0.037 ± 0.019 for L2/3 (bin size of 10.75 ms, n = 2850 pairs). The average coherence was 0.103 ± 0.038 for L4 and 0.036 ± 0.019 for L2/3 (bin size of 10.75 ms, n = 2850 pairs, n = 15 experiments). In all experiments r and γ were statistically significant (>2 SD jackknife estimate, 15 experiments, bin sizes 10, 25, and 50).
Recent studies have reported a dependence of correlations on the rate of neuronal spiking activity (de la Rocha et al., 2007). Although the covariance and response amplitudes in each population, both L4 and L2/3, were weakly correlated (r = 0.367 for L4 and 0.084 for L2/3) the correlation was not statistically significant in both cases (p = 0.089 for L4 and 0.38 for L2/3, n = 15 experiments). In summary, these results indicate the presence of neural correlations within the L4 and L2/3.
Correlations Decrease with Propagation of Spiking Activity
To measure how correlations change as activity propagated from L4 to L2/3 we compared the cross-correlation coefficient (r) and the complex coherence (γ) in L2/3 to that in L4. The average correlations measured in L2/3 were significantly smaller than that measured in L4 both within experiments (10, 25, and 50 ms bin sizes tested using jackknife estimates) as well as across all experiments (for all bin sizes, p < 0.05, Student’s t-test, Figures 3A,B). For example, the average difference in covariance [r(L2/3) − r(L4)] was −0.055 ± 0.032 (bin size of 10.75 ms, p = 4.9 × 10⁻⁶, Student’s t-test) and average difference in coherence [γ(L2/3) − γ(L4)] was −0.067 ± 0.034 (bin size of 10.75 ms, p = 1.5 × 10⁻⁶, Student’s t-test).
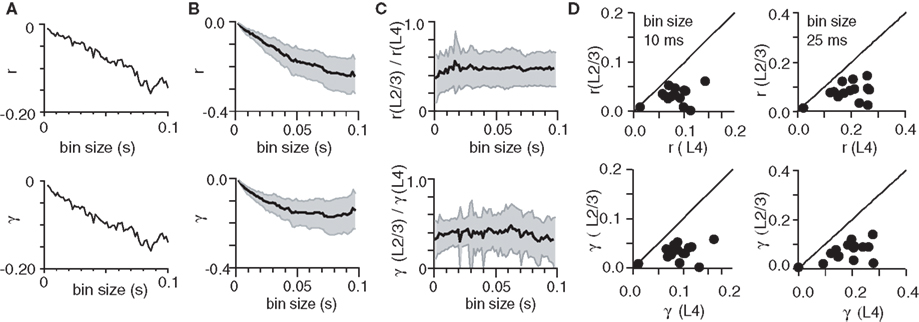
Figure 3. Correlations decrease as spiking activity propagates from L4 to L2/3. (A) Graphs show difference in cross-correlation coefficient (Δr, top) and complex coherence (Δγ, bottom) of L2/3 and L4, as a function of time bin size, in an example experiment. (B) The average difference in (r) and (γ) across all experiments. Shaded area denotes 95% confidence intervals. (C) Graphs shows average ratio of (r) and (γ) measured in L2/3 to that measured in L4 neurons, as a function of time bin size. Shaded area denotes SD. (D) Plot of the cross-correlation coefficient (r, top graph) and complex coherence (γ, bottom graph) measured in L2/3 as a function of (r) and (γ) in L4, at bin sizes of 10 ms (left) and 25 ms (right). Data points represent experiments.
As suprathreshold spiking activity propagated from L4 to L2/3, the change in correlations can also be viewed as a conversion of the correlations in L4 to the correlations in L2/3. We therefore also calculated the ratio of the average correlations in L2/3 and L4. As shown in Figure 3C, the average ratio of the two correlations was significantly below 1, indicating that L2/3 correlations were bounded by the correlations in L4 (for all bin sizes, p < 0.05, Student’s t-test). On average the ratio for cross-correlation coefficient was 0.42 ± 0.19 and the ratio for complex coherence was 0.38 ± 0.16 (bin size of 10.75 ms, n = 15 experiments). To illustrate the relationship between correlations measured in L2/3 and L4 neurons across all experiments we chose two representative bin sizes, 10.75 ms (Figure 3D, left column) and 24.58 ms (Figure 3D, right column). In two experiments we determined the impact of the GABAA receptor antagonist Bicuculline methiodide (5 μM) on the change in correlations with propagation. In these experiments, correlations decreased in control conditions but increased in the presence of Bicuculline as activity propagated from L4 to L2/3. On average, the difference in covariance [r(L2/3) − r(L4)] was −0.024 ± 0.018 under control conditions and 0.036 ± 0.009 in the presence of Bicuculline (bin size of 10.75 ms, n = 2 experiments). These results indicate that under our experimental conditions spike correlations decrease with propagation of activity from L4 to L2/3.
Discussion
In this study we measured the changes in neuronal spike correlations as suprathreshold activity propagated between recurrent networks in the mammalian cerebral cortex. Using functional calcium imaging in acute slices of rodent barrel cortex, we recorded suprathreshold spiking activity from a large sample of neurons in L4 and L2/3 simultaneously. Our results indicate a significant decrease in correlations, measured as covariance and complex coherence, over timescales ranging from 1.5 to 100 ms as activity propagated from L4 to L2/3.
We examined the propagation of evoked spiking activity from L4 to L2/3 because this vertical propagation of activity is an important step in the cortical processing of sensory inputs. In the rodent whisker system, thalamocortical afferents largely terminate in L4 (Koralek et al., 1988; Lu and Lin, 1993) and rarely innervate neurons in L2/3 directly (Bureau et al., 2006). L4 neurons in turn predominantly project to L2/3 neurons of the same cortical column (Feldmeyer et al., 2002; Bureau et al., 2006). The flow of excitation in this system thus follows the cortical architecture (Lübke and Feldmeyer, 2007). In agreement with the propagation of activity from L4 to L2/3 we found that suprathreshold activity in L2/3 was dependent on activity in L4.
Directly measuring the change in correlations with propagation requires simultaneous recordings of activity of multiple neurons from multiple neuronal populations. Until recently (Kimpo et al., 2003) such measurements were technically impracticable. Here we utilized a novel optical approach to detect spikes from many neurons. Dithered random-access functional calcium imaging records suprathreshold spiking activity with single-cell, single-spike, and millisecond temporal resolution (Grewe et al., 2010; Ranganathan and Koester, 2010). In conjunction with maximum-likelihood deconvolution this method has a high spike detection efficiency (>97% of spikes detected with low false positives 0.0023 spikes/s) and temporal precision (Ranganathan and Koester, 2010). The error in spike timing detection may have resulted in an underestimation of correlations measured for small time bins, but presumably did not affect results for time bins >>3 ms. The focal extracellular electrical stimulation used here represents a highly coherent input to L4. In this regard it is noteworthy that the high correlations in thalamic neurons resulting from focal extracellular stimulation are not detrimental to testing propagation of correlations from L4 to L2/3.
Under our experimental conditions spiking activity did not propagate beyond L2/3 of the responding column. Activity presumably failed to propagate beyond L2/3 of the observed column due to the absence of long-distance target neurons in the slice.
We sampled neurons far away from the slice surface to avoid recording from neurons that were severely affected by the slicing procedure. Indeed, when blocking GABAA receptors we found that the evoked activity propagated from L4 to L2/3 and laterally. The effect of the GABAA receptor antagonist indicated that our observations were not a result of a lack of synaptic connections from L4 to L2/3 in the acute slice.
Comparison to Previous Studies of Propagation of Correlations
The decrease in correlations with propagation of activity that we observed here is different from the results of previous empirical studies (Vogel and Ronacher, 2007) and many studies using simulations (Diesmann et al., 1999; van Rossum et al., 2002; Mehring et al., 2003; Reyes, 2003; Vogels and Abbott, 2005; Kumar et al., 2010). The increase in correlations (synchronization of activity) observed in simulations is expected for feed-forward convergent network architectures as these simply pool inputs (Rosenbaum et al., 2010). Some simulation studies have reported stable propagation of uncorrelated (asynchronous) activity through layers of neurons. However, the mechanisms implemented on those simulations to prevent synchronization of activity, for example uncorrelated background activity, sparse convergence or divergence of connections or selectively strengthened feed-forward connections (van Rossum et al., 2002; Vogels and Abbott, 2005), do not apply to the network architecture (Feldmeyer et al., 2002) and recording conditions (low background activity) of this study. The experimental studies conducted in the locust auditory system did not observe a decrease in with propagation of activity through neuronal populations. One reason for the difference to this study may be the different functional architecture compared to the cortical networks studied here. Indeed, recent studies have reported mechanisms that contribute to decorrelation of spiking activity. These include inputs from recurrently connected excitatory and inhibitory neurons (Renart et al., 2010), the non-linearity of spike generation (de la Rocha et al., 2007) and the heterogeneity of intrinsic biophysical properties of neurons (Padmanabhan and Urban, 2010). A combination of these mechanisms may have contributed to the decrease in correlations observed here. One can also speculate that the stimuli presented here to the L4 neurons were naïve, limiting propagation and in turn also affecting how correlations propagate.
Our results show that under our experimental conditions correlations in neuronal spiking activity significantly decreased as activity propagated between the recurrent cortical networks. This indicates that correlations do not necessarily increase with propagation between recurrent networks of mammalian cerebral cortex. Our recording conditions were limited to those found in acute slices. These conditions include absence of spontaneous background activity, absence of top-down inputs, and absence of neuromodulation. The unexpected finding that contrary to simulations and previous empirical studies correlations decrease thus indicate that increase in correlations with propagation is not universal and may depend on the conditions and the systems studied. Thus further studies are required to dissect the impact of synaptic architecture and other factors on signal propagation and correlations in the cerebral cortex.
Conclusion
This study interfaces between simulations, experimental studies in non-mammalian systems, and in vivo conditions. This study thus extends the results from simulations and studies of the locust auditory system to mammalian recurrent cortical networks. In contrast to in vivo conditions we were able to locate and record from those neurons that are part of the signal propagation chain. In contrast to simulations, including those that experimentally determined the input/output functions of neurons (Reyes, 2003; de la Rocha et al., 2007; Shea-Brown et al., 2008) we measured propagation in a biological system and in a cortical network. Measuring signal propagation and correlations under controlled conditions in a biological system is an important step in testing predictions from simulation studies. Indeed we find that our result are different from what most simulation studies predicted for propagation of spiking activity through networks of neurons.
Correlations in spiking activity impact information signaling. Our finding here, that correlations do not increase with propagation, is consistent with a high fidelity of a rate code for propagation of activity through networks of the cerebral cortex. The prediction of a high performance of a rate code in the rodent somatosensory cortex is in agreement with a low contribution of correlations to encoding of stimulus location (Panzeri et al., 2001) as well as a disturbance analysis that also predicted a rate code (London et al., 2010).
Conflict of Interest Statement
The authors declare that the research was conducted in the absence of any commercial or financial relationships that could be construed as a potential conflict of interest.
Acknowledgments
We thank Brett Johnson for assistance in programming the data acquisition software, Dr. Juan Diego Pita-Almenar for help with experimental procedures, and Dr. Richard Gray for help with computer resources. This work was supported by the Alfred P. Sloan Foundation, the Whitehall Foundation, the Albert and Ellen Grass Foundation, and startup funds from The University of Texas at Austin.
References
Aertsen, A. M., Gerstein, G. L., Habib, M. K., and Palm, G. (1989). Dynamics of neuronal firing correlation: modulation of “effective connectivity”. J. Neurophysiol. 61, 900–917.
Agmon, A., and Connors, B. W. (1991). Thalamocortical responses of mouse somatosensory (barrel) cortex in vitro. Neuroscience 41, 365–379.
Ahissar, E., and Kleinfeld, D. (2003). Closed-loop neuronal computations: focus on vibrissa somatosensation in rat. Cereb. Cortex 13, 53–62.
Bureau, I., von Saint Paul, F., and Svoboda, K. (2006). Interdigitated paralemniscal and lemniscal pathways in the mouse barrel cortex. PLoS Biol. 4, e382. doi: 10.1371/journal.pbio.0040382
de la Rocha, J., Doiron, B., Shea-Brown, E., Josic, K., and Reyes, A. (2007). Correlation between neural spike trains increases with firing rate. Nature 448, 802–806.
Diesmann, M., Gewaltig, M. O., and Aertsen, A. (1999). Stable propagation of synchronous spiking in cortical neural networks. Nature 402, 529–533.
Feldmeyer, D., Lubke, J., Silver, R. A., and Sakmann, B. (2002). Synaptic connections between layer 4 spiny neurone-layer 2/3 pyramidal cell pairs in juvenile rat barrel cortex: physiology and anatomy of interlaminar signalling within a cortical column. J. Physiol. 538, 803–822.
Gobel, W., and Helmchen, F. (2007). In vivo calcium imaging of neural network function. Physiology (Bethesda) 22, 358–365.
Grewe, B. F., Langer, D., Kasper, H., Kampa, B. M., and Helmchen, F. (2010). High-speed in vivo calcium imaging reveals neuronal network activity with near-millisecond precision. Nat. Methods 7, 399–405.
Hirase, H., Qian, L., Bartho, P., and Buzsaki, G. (2004). Calcium dynamics of cortical astrocytic networks in vivo. PLoS Biol. 2, e96. 10.1371/ journal.pbio.0020096
Kimpo, R. R., Theunissen, F. E., and Doupe, A. J. (2003). Propagation of correlated activity through multiple stages of a neural circuit. J. Neurosci. 23, 5750–5761.
Koester, H. J., Baur, D., Uhl, R., and Hell, S. W. (1999). Ca2+ fluorescence imaging with pico- and femtosecond two-photon excitation: signal and photodamage. Biophys. J. 77, 2226–2236.
Koralek, K. A., Jensen, K. F., and Killackey, H. P. (1988). Evidence for two complementary patterns of thalamic input to the rat somatosensory cortex. Brain Res. 463, 346–351.
Kumar, A., Rotter, S., and Aertsen, A. (2010). Spiking activity propagation in neuronal networks: reconciling different perspectives on neural coding. Nat. Rev. Neurosci. 11, 615–627.
London, M., Roth, A., Beeren, L., Hausser, M., and Latham, P. E. (2010). Sensitivity to perturbations in vivo implies high noise and suggests rate coding in cortex. Nature 466, 123–127.
Lu, S. M., and Lin, R. C. (1993). Thalamic afferents of the rat barrel cortex: a light- and electron-microscopic study using Phaseolus vulgaris leucoagglutinin as an anterograde tracer. Somatosens. Mot. Res. 10, 1–16.
Lübke, J., and Feldmeyer, D. (2007). Excitatory signal flow and connectivity in a cortical column: focus on barrel cortex. Brain Struct. Funct. 212, 3–17.
Mehring, C., Hehl, U., Kubo, M., Diesmann, M., and Aertsen, A. (2003). Activity dynamics and propagation of synchronous spiking in locally connected random networks. Biol. Cybern. 88, 395–408.
Ozer, M., Perc, M., Uzuntarla, M., and Koklukaya, E. (2010). Weak signal propagation through noisy feedforward neuronal networks. Neuroreport 21, 338–343.
Padmanabhan, K., and Urban, N. N. (2010). Intrinsic biophysical diversity decorrelates neuronal firing while increasing information content. Nat. Neurosci. 13, 1276–1282.
Panzeri, S., Petersen, R. S., Schultz, S. R., Lebedev, M., and Diamond, M. E. (2001). The role of spike timing in the coding of stimulus location in rat somatosensory cortex. Neuron 29, 769–777.
Ranganathan, G. N., and Koester, H. J. (2010). Optical recording of neuronal spiking activity from unbiased populations of neurons with high spike detection efficiency and high temporal precision. J. Neurophysiol. 104, 1812–1824.
Renart, A., de la Rocha, J., Bartho, P., Hollender, L., Parga, N., Reyes, A., and Harris, K. D. (2010). The asynchronous state in cortical circuits. Science 327, 587–590.
Reyes, A. D. (2003). Synchrony-dependent propagation of firing rate in iteratively constructed networks in vitro. Nat. Neurosci. 6, 593–599.
Rosenbaum, R. J., Trousdale, J., and Josic, K. (2010). Pooling and correlated neural activity. Front. Comput. Neurosci. 4:9. doi: 10.3389/fncom.2010.00009
Rosenberg, J. R., Amjad, A. M., Breeze, P., Brillinger, D. R., and Halliday, D. M. (1989). The Fourier approach to the identification of functional coupling between neuronal spike trains. Prog. Biophys. Mol. Biol. 53, 1–31.
Shea-Brown, E., Josi, K., de la Rocha, J., and Doiron, B. (2008). Correlation and synchrony transfer in integrate-and-fire neurons: basic properties and consequences for coding. Phys. Rev. Lett. 100, 108102.
Stosiek, C., Garaschuk, O., Holthoff, K., and Konnerth, A. (2003). In vivo two-photon calcium imaging of neuronal networks. Proc. Natl. Acad. Sci. U.S.A. 100, 7319–7324.
Tetzlaff, T., Rotter, S., Stark, E., Abeles, M., Aertsen, A., and Diesmann, M. (2008). Dependence of neuronal correlations on filter characteristics and marginal spike train statistics. Neural Comput. 20, 2133–2184.
Thomson, D. J., and Chave, A. D. (1991). “Jackknifed error estimates for spectra, coherences, and transfer functions,” in Advances in Spectrum Analysis and Array Processing, ed. S. Haykin (Englewood Cliffs, NJ: Prentice Hall.), 58–113.
van Rossum, M. C., Turrigiano, G. G., and Nelson, S. B. (2002). Fast propagation of firing rates through layered networks of noisy neurons. J. Neurosci. 22, 1956–1966.
Vogel, A., and Ronacher, B. (2007). Neural correlations increase between consecutive processing levels in the auditory system of locusts. J. Neurophysiol. 97, 3376–3385.
Vogels, T. P., and Abbott, L. F. (2005). Signal propagation and logic gating in networks of integrate-and-fire neurons. J. Neurosci. 25, 10786–10795.
Vogels, T. P., Rajan, K., and Abbott, L. F. (2005). Neural network dynamics. Annu. Rev. Neurosci. 28, 357–376.
Keywords: propagation, correlations, acousto-optical deflectors
Citation: Ranganathan GN and Koester HJ (2011) Correlations decrease with propagation of spiking activity in the mouse barrel cortex. Front. Neural Circuits 5:8. doi: 10.3389/fncir.2011.00008
Received: 10 February 2011;
Accepted: 03 May 2011;
Published online: 16 May 2011.
Edited by:
Paul Adams, State University of New York at Stony Brook, USAReviewed by:
Ken K. L. Yung, Hong Kong Baptist University, Hong KongPaul Adams, State University of New York at Stony Brook, USA
Bruno Cauli, Universite Pierre et Marie Curie, France
Copyright: © 2011 Ranganathan and Koester. This is an open-access article subject to a non-exclusive license between the authors and Frontiers Media SA, which permits use, distribution and reproduction in other forums, provided the original authors and source are credited and other Frontiers conditions are complied with.
*Correspondence: Gayathri Nattar Ranganathan, Center for Learning and Memory, Section of Neurobiology, The Institute for Neuroscience, 1 University Station, C7000, Austin, TX 78712, USA. e-mail: gayathri.nattar@mail.utexas.edu