Transcranial magnetic mapping of the short-latency modulations of corticospinal activity from the ipsilateral hemisphere during rest
- Transcranial Magnetic Stimulation Laboratory, Center for Mind/Brain Sciences, University of Trento, Trento, Italy
Skilled hand function relies heavily on the integrity of the primary motor cortex (M1) and on a web of cortico-cortical connections projecting onto it. We used a novel explorative paradigm to map the origin of cortico-M1 pathways assessed by dual transcranial magnetic stimulation (TMS) in three healthy participants. Subthreshold conditioning TMS (cTMS) was delivered over a grid of ≈100 spots. Covering the left hemisphere, and was followed by suprathreshold test (tTMS) delivered over the ipsilateral M1. Grid points were tested eight times, with inter-stimulus intervals between cTMS and tTMS of 4 and 7 ms. Participants were asked to stay relaxed with no particular task. Motor evoked potentials (MEPs) from cTMS + tTMS were normalized to MEPs from tTMS alone and were compared to the value expected from tTMS alone using t-statistics. The t-values from each grid point were then used to plot statistical maps. Several foci of significant cortico-M1 interactions were found in the dorsal–medial frontal cortex, in the ventral frontal cortex, in the superior and inferior parietal lobules and in the parietal operculum. The majority of active foci had inhibitory effects on corticospinal excitability. The spatial location of the network of different subjects overlapped but with some anatomical variation of single foci. TMS statistical mapping during the resting state revealed a complex inhibitory cortical network. The explorative approach to TMS as a brain mapping tool produced results that are self-standing in single subjects overcoming inter-individual variability of cortical active sites.
Introduction
Voluntary hand movements are at the basis of a variety of human behavior ranging from object manipulation to communicative gestures. The hand motor cortex is also known to be subliminally involved in a series of cognitive abilities such as imagery of movement (Jeannerod, 2001; Cattaneo et al., 2009), action understanding (Cattaneo and Rizzolatti, 2009), numerical competences (Andres et al., 2007; Sato et al., 2007), or language (Papathanasiou et al., 2004; Glenberg et al., 2008; Bracco et al., 2009). Cortico-motor projections to the primary motor cortex (M1) represent the neural basis of the hand motor repertoire in this wide range of behavioral settings. Investigating cortico-cortical projections to M1 in humans relies mainly on transcranial magnetic stimulation (TMS) using either single coil paired-pulse paradigms (Cattaneo et al., 2005; Prabhu et al., 2007; Koch et al., 2010b) or, more frequently, dual-coil paired-pulse paradigms (Civardi et al., 2001). The dual-coil technique adopts the simultaneous use of two distinct TMS coils. A test (tTMS) is applied to the motor cortex and its effect is measured as motor evoked potentials (MEPs). A conditioning (cTMS) is applied to a cortical area that is hypothetically linked to the motor cortex. The inter-stimulus interval (ISI) that have been found to be effective are indicative of direct cortico-cortical connections. These latencies range from 4 ms for parieto-motor connections to more than 10 ms for interhemispheric connections. This paradigm has been extensively used to investigate connections between M1 in the two hemispheres (Ferbert et al., 1992), between the posterior parietal lobe and M1 (Koch et al., 2007, 2008a,b, 2009; Koch and Rothwell, 2009), between the ventral or dorsal premotor cortices and M1 (Koch et al., 2006; O’shea et al., 2007; Davare et al., 2009), between the pre-supplementary motor area (pre-SMA) and M1 (Mars et al., 2009) and between the cerebellum and M1 (Daskalakis et al., 2004).
The dual-coil paradigm as most other TMS experimental designs is based on a priori assumptions on where to aim the conditioning magnetic stimuli on the cortical mantle to test effects on a specific behavior. This experimental approach has a main limitation in anatomical variability of the functionally active regions between individuals. TMS is currently considered to be dependent on explorative whole-brain measures of activity such as functional magnetic resonance imaging (fMRI) in order to be maximally reliable in stimulus localization (Sack et al., 2009). In the present study we assessed, without a priori spatial assumptions, the origin of short-latency ipsilateral cortico-motor pathways in the whole left hemisphere convexity. In three participants we repeatedly probed the scalp surface with cTMS while stimulating the M1 with tTMS. The results were analyzed individually as statistical maps of the value of the t parameter.
Materials and Methods
Participants
Three participants were involved in the experiment. They were 27, 30, and 36-years-old. Two of them were male. They were right handed as assessed by the Edinburgh handedness inventory (Oldfield, 1971), with no previous history of neurological or psychiatric disorders. Participants were screened for contraindications to TMS (Rossi et al., 2009) and gave written informed consent to the experimental procedure, which complied with the Helsinki declaration on human experimentation (World Medical Association General Assembly, 2008) and had been previously approved by the Ethical Committee of the University of Trento.
General Experimental Design
The experiment was designed on single participants. In each of them we tested the effects of cTMS pulses on the amplitude of MEPs recorded from intrinsic hand muscles evoked by a tTMS pulse applied over the hand motor cortex. cTMS was applied over a grid overlying the scalp of the left hemisphere. The effects of TMS on the motor cortex can suffer from undesired time-dependent changes. These time-dependent changes can be related to head-movement, slow drifts in excitability of the motor cortex unrelated to the experimental design or build-up effects of repeated magnetic stimulation (though the latter cause should be prevented by applying stimuli more than 5 s apart, this notion applies to single TMS pulses and not to dual-coil stimuli). Therefore, in a mapping experiment as the present one, we aimed at distributing evenly over time the cTMS + tTMS and the tTMS pulses.
As a general rule each point of the grid was tested with cTMS + tTMS for eight times, but two stimulations of the same point were never consecutive (see details of sampling below in the mapping procedure paragraph). Rather, groups of points were stimulated in a fixed sequence that was repeated eight times in every session so that the time interval between stimulations of the same grid point was the same for all grid points. In this way each grid point was probed eight times, scattered along the duration of the experimental session. Since also the tTMS alone condition suffers from time-dependent changes also the tTMS pulses were evenly distributed in the series of stimuli. Every three cTMS + tTMS pulses a single tTMS pulse was delivered to M1 alone. But, more importantly, single cTMS + tTMS MEPs were normalized to a sliding average of tTMS MEPs rather than to a global average of all tTMS MEPs of the whole session (see details in the mapping procedure paragraph).
The whole mapping of the left hemisphere was repeated in two different blocks that corresponded to the two different ISIs between cTMS and tTMS of 4 or 7 ms. Throughout the whole experiment participants were sitting comfortably in a chair with their head on a chinrest. They were instructed not to pay attention to the magnetic stimuli or to the movements of the operator behind them. They kept their eyes freely open and they had to keep both hands completely relaxed. Only the right hand was monitored by the experimenter for muscular contraction with electromyographic (EMG) recordings which provided also audio feedback to the participant.
MRI Neuronavigation and Scalp Grids
Prior to the experiment the three participants underwent a high-resolution T1-weighted magnetization-prepared rapid gradient echo sequence scan of the brain that was used for monitoring the site of TMS. The scans were obtained with 176 axial slices, in-plane resolution 256 × 224, 1-mm isotropic voxels, generalized autocalibrating partially parallel acquisition with acceleration factor = 2, time repetition = 2700 ms, time echo = 4.180 ms, time to inversion = 1020 ms, flip angle = 7° using a MedSpec 4-T head scanner (Bruker BioSpin, Ettlingen, Germany) with an eight-channel array head coil. The BrainVoyager (Brain Innovation BV, The Netherlands) software was used to reconstruct a three-dimensional image of the scalp surface and a three-dimensional image of the brain (gray matter) surface. The grid of points to be targeted with cTMS was marked on the virtual scalp surface only (and not on the real head). This permanent marking of the grid on the virtual head rather than on the real one assured that the grid and the tTMS were placed at identical locations from one session to another for the same participant, provided of course that co-registration was done accurately.
The mean distance between scalp points in all participants was of 1.7 cm, which corresponded to a distance between points on the cortical surface of 1.3 cm, assuming a mean scalp-pia distance of 16 mm (Okamoto et al., 2004). Such distance between grid points on the pial surface allowed uniform coverage of the cortical convexity. For the purpose of data analysis (see below) we constructed a flat map of the brain surface (by means of the MesH morphing tool of the Brainvoyager software) on which we overlapped the orthogonal projection of the scalp points. Figure 1 shows the flat maps of the three participants with an outline of the major sulci. Figure 2 shows the distribution of the grid points on the flat maps. Each point is represented with an 8-mm diameter spot, corresponding on average to the area of the induced electrical field with the stimulation apparatus and parameters used for cTMS assuming a spherical cortex model and the scalp-pial distance constant (Wagner et al., 2009). During the actual experiment we used the Neuronavigation module of the Brainvoyager software, interfaced with the ultrasound tracker CMS20S (Zebris Medical, Isny, Germany) to coregister the participant’s head and the TMS coil that delivered the cTMS pulses, thus allowing to move the coil over the scalp grid while updating online the coil position.
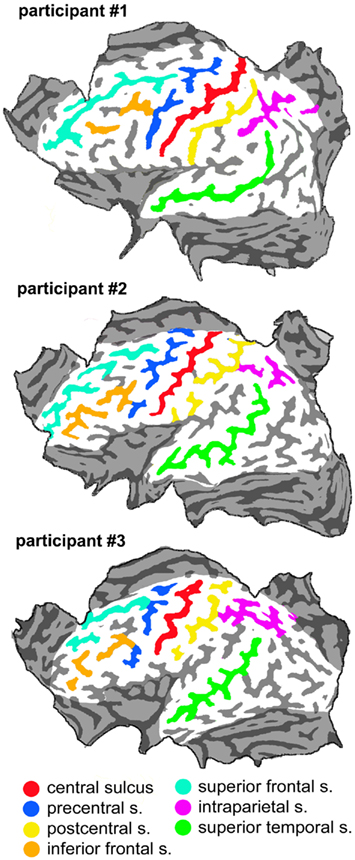
Figure 1. Flat maps of the three participants’ left hemispheres showing the main sulci.
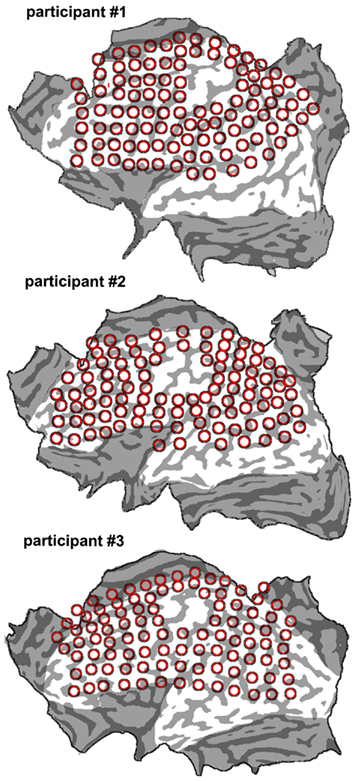
Figure 2. Flat maps of the three participants’ cortical surface superimposed onto the individual grids that were used to deliver cTMS. The number of grid points was of 102 for participant 1; 99 for participant 2; and 100 for participant 3.
EMG Recordings
The first dorsal interosseus (1DI) and the opponens pollicis (OP) muscles of the right hand were recorded simultaneously via Ag/AgCl electrodes in a bipolar belly tendon montage. The analog signal was band-pass filtered between 5 Hz and 5 kHz and amplified 1000× by means of a 1902 two-channel amplifier (Cambridge Electronic Design, Cambridge, UK). The analog EMG signal was then digitalized (sampling frequency of 4000 Hz) by means of a 1401 micro Mk-II unit (Cambridge Electronic Design). The digitalized signal was acquired in epochs of 500 ms, triggered by the tTMS pulse. The signal from 200 ms before the pulse to 300 ms after the pulse was acquired via the Signal software (Cambridge Electronic Design) and stored on a Computer for offline analysis. The rationale for recording the OP and 1DI muscles is that their action is that of flexing the thumb and the index finger. They are therefore synergistic in most primate prehensile behaviors (Brochier et al., 2004). The two muscles were considered as a functional unit in further analysis and the MEPs recorded from them were averaged (see below, Data Analysis). Albeit the two muscles may have different hot spots, it is common in literature to record MEPs in two distinct intrinsic hand muscles simultaneously such as 1DI and abductor digiti minimi (Davare et al., 2009). Also it should be considered that the motor representation of the thumb and index finger are closer to each other than those of the thumb and other digits (Beisteiner et al., 2001).
Transcranial Magnetic Stimulation
Two magnetic stimulators were used in this experiment. The one delivering tTMS over M1 was a Magstim 200 monophasic single-pulse stimulator (The Magstim Company, Whitland, UK), connected to a custom made figure-of-eight coil with 25 mm windings. The one delivering the cTMS pulses was a Magpro unit (Magventure, Skovlunde, Denmark) connected to an MC-B35 figure-of-eight coil with windings of 35 mm diameter. As a first step, the resting motor threshold (rMTh) was assessed with standard methods (Rossini et al., 1994) separately for each coil, using the 1DI as the target muscle. Even when using different stimulator types, adjusting intensities to the individual stimulator motor threshold allows to compare the effects of the two stimulators (Rothkegel et al., 2010).
The tTMS coil was placed over the hand motor hot spot with coil current flowing posteriorly and laterally. tTMS stimuli were monophasic and their intensity was set at 120% of rMTh. The cTMS coil was positioned tangentially to the scalp with orientations that were varied according to the mechanical interaction between the two coils. It delivered single biphasic stimuli with intensity of 90% of rMTh. Paired stimulation was achieved by means of the Signal software and the 1401 unit that ensured sub-millisecond accuracy in the timing of triggers.
Mapping Procedure
In the three participants two main conditions were tested: 4 and 7 ms ISI. The tTMS coil was kept in place over M1 by means of a mechanical arm. The position of the cTMS coil was changed manually. The hemispheric grid was broken down into 5 grids of approximately 20 spots each. This subdivision was arbitrary and was made in order to facilitate the operator’s task. These subgrids were stimulated in several different sessions in different days, each session lasting for about 1 h. Consecutive sessions belonged to different ISIs (4 or 7 ms) in a random order.
Every grid spot was stimulated once with cTMS, in a sequential order. When all grid spots had been stimulated, the sequence was restarted until it was repeated eight times. In this way eight different data points were sampled for each spot. Every three cTMS + tTMS pulses a single tTMS pulse was delivered. In these occasions the cTMS coil was not withdrawn from the scalp in order to avoid changes of the head position associated with the tTMS stimuli only. Trigger of stimuli was done manually by the experimenter at his discretion, however the delay between single stimuli was set to be no shorter than 5 s. In this way the stimulus onset was not predictable by the participant. The room was refrigerated with a target temperature of 17°C to delay coil heating.
Data Analysis
The EMG recordings were inspected to remove trials with significant artifacts or trials with significant (>50 μV) pre-stimulus EMG activity. No additional digital filtering was added to the analog filters applied at the source. The peak to peak amplitude of MEPs was extracted by an automatic algorithm looking for maximum and minimum values in the time window between 18 and 40 ms after the tTMS stimulus. MEPs from cTMS + tTMS trials were normalized to the amplitude of MEPs from trials with tTMS alone. Considering the long duration of sessions, the interruptions due to coil heating and the spontaneous fluctuations of MEPs, the conditioned responses were normalized to the mean of three nearest test MEPs, in a sliding window along the sequence of trials. The result of the normalization process was a series of eight values per each point of the grid per each of the two recorded muscles. Such values ranged from 0 to +∞ and contained information on both the effect of the cTMS–tTMS pulses (the numerator of the normalization ratio) and the effects of tTMS. In a following step the normalized values were averaged between the two muscles, so that a single series of eight samplings was obtained for each point for each condition. A further manipulation of data was done by applying a base 10 logarithmic transformation of each value. In this way data were symmetrically distributed around 0, between −∞ and +∞. In other words, if (cTMS + tTMS MEPs < tTMS MEPs), the ratio is in the unit interval (0,1), whereas if (cTMS + tTMS MEPs > tTMS MEPs), the ratio is in the half-line (1,∞), where the ratio of 1 corresponds to equality. Negative values indicated amplitude of cTMS + tTMS MEPs smaller than the instantaneous value of MEPs from tTMS alone. On the contrary positive values indicated amplitude of cTMS + tTMS MEPs larger than the instantaneous value of MEPs from tTMS alone. The log transformation of the ratio produces a symmetrical distribution that is more appropriate for t-statistics. Interestingly, the base of the logarithm is not relevant for the further t-statistics, because logarithmic transformation has the property that if cTMS + tTMS MEPs is K times greater than tTMS MEPs, the log-ratio is the equidistant from zero as in the situation where tTMS MEPs is K times greater than cTMS + tTMS MEPs. Therefore the choice of a base 10 logarithm is purely arbitrary, since the same t-values would have been obtained with any other base, provided that, as is the case here, t-statistics are computed against a null hypothesis of  .
.
At this point the groups of eight values from each grid point were processed in a single-sample t-test against the null hypothesis of the sample having a mean value of zero (corresponding to no significant difference between conditioned MEPs and test MEPs). The values of t were obtained and mapped onto the flattened projection of the cortical gyri described in the Neuronavigation paragraph. A significance level of p = 0.05 was adopted corresponding (with 7° of freedom) to a t value outside ± 2.36; no corrections for multiple comparisons were applied. The STATISTICA 6.0 (StatSoft inc.) software package was used to compute statistics. Finally the results were mapped onto the flattened grids. Stimulated spots with significant effects, i.e., with t-values exceeding +2.36/−2.36, will be referred to as “active foci.” They have been numbered univocally within each participant with an alphabetical label corresponding to the cortical region (for example spots located in the ventral frontal cortex are labeled with “vf”) followed by a sequential number. Labels have been attributed starting from the 7-ms ISI maps and then in the 4-ms ISI maps. Note that since labeling has been made on individual basis, the same label corresponds to the same spot within each participant, but there is no strict correspondence between different participants. For such descriptive purposes the cortex of the left hemisphere has been arbitrarily subdivided in six main regions: (1) the caudal part of the dorsal and medial frontal cortex; (2) the rostral part of the dorsal–medial frontal cortex; (3) the ventral frontal cortex; (4) the parietal opercular region; (5) The inferior parietal cortex; (6) The superior parietal cortex.
The location is described analytically in the results (a) making reference to sulcal anatomy and (b) on Talairach coordinates produced by transforming the three individual brains in Talairach space (Talairach and Tournoux, 1988). Therefore consistency or discrepancy between participants, between the two ISIs and with the previous findings in literature were determined on the basis of the two parameters of (a) sulcal landmarks, and (b) Talairach coordinates.
Control Measures
Two different controls were performed. In order to validate the procedure of averaging the two signal from the 1DI and OP muscles, we conducted a separate analysis of the t-values derived from each muscle individually and tested their correlation. Second, as a measure of repeatability of the mapping procedure, the spots with significant t-values were checked for consistency of the results re-testing them in a subsequent separate session with the same experimental procedure and analytical process described in the data analysis section.
Smoothed Maps
Purely for illustrative purposes we extrapolated smoothed maps of the t-values from the single data points. The map was 125 pixels wide and was superimposed on the flattened cortical surfaces. The values of t were plotted with a color coding. The values in points that were not stimulated were extrapolated from those of stimulated points according to their distance from them, with a decay that followed a cumulative distribution function with SD = 1.8. These parameters were purely arbitrary as, like stated before, these interpolated smoothed maps had no analytical function but had the only purpose of illustrating the clusters of active spots as single active regions. These smoothed maps have been made in order to obtain a display of the effects of cTMS that takes account of all values of t, not only of the significant ones.
Results
Participant #1 was tested for a total of 12 h in 10 different days; participant #2 was tested for 10 h in 9 different days; and participant #3 was tested for a total of 10 h in 10 different days. None of them reported any discomfort from stimulation or head and neck fixation. With the Magstim 25 mm coil the mean rMTh calculated through all sessions was for participant #1 of 62% (SD 6%), for participant #2 of 67% (SD 3%), and for participant #3 of 58% (SD 2%). With the Medtronic MC-B35 figure-of-eight coil the mean rMTh calculated through all sessions was for participant #1 of 51% (SD 3%), for participant #2 of 52% (SD 3%), and for participant #3 of 49% (SD 2%). In the 7-ms ISI the spots that produced significant values of t were 12 in participant #1, 12 in participant #2, and 10 in participant #3. In the 4-ms ISI the spots that produced significant values of t were 10 in Participant #1, 7 in Participant #2, and 8 in participant #3. The active foci were progressively and univocally labeled within each participant. Their individual Talairach coordinates, together with uncorrected values of t are presented in Tables 1 and 2 and their maps superimposed on individual brain anatomies are shown in Figures 3 and 4.
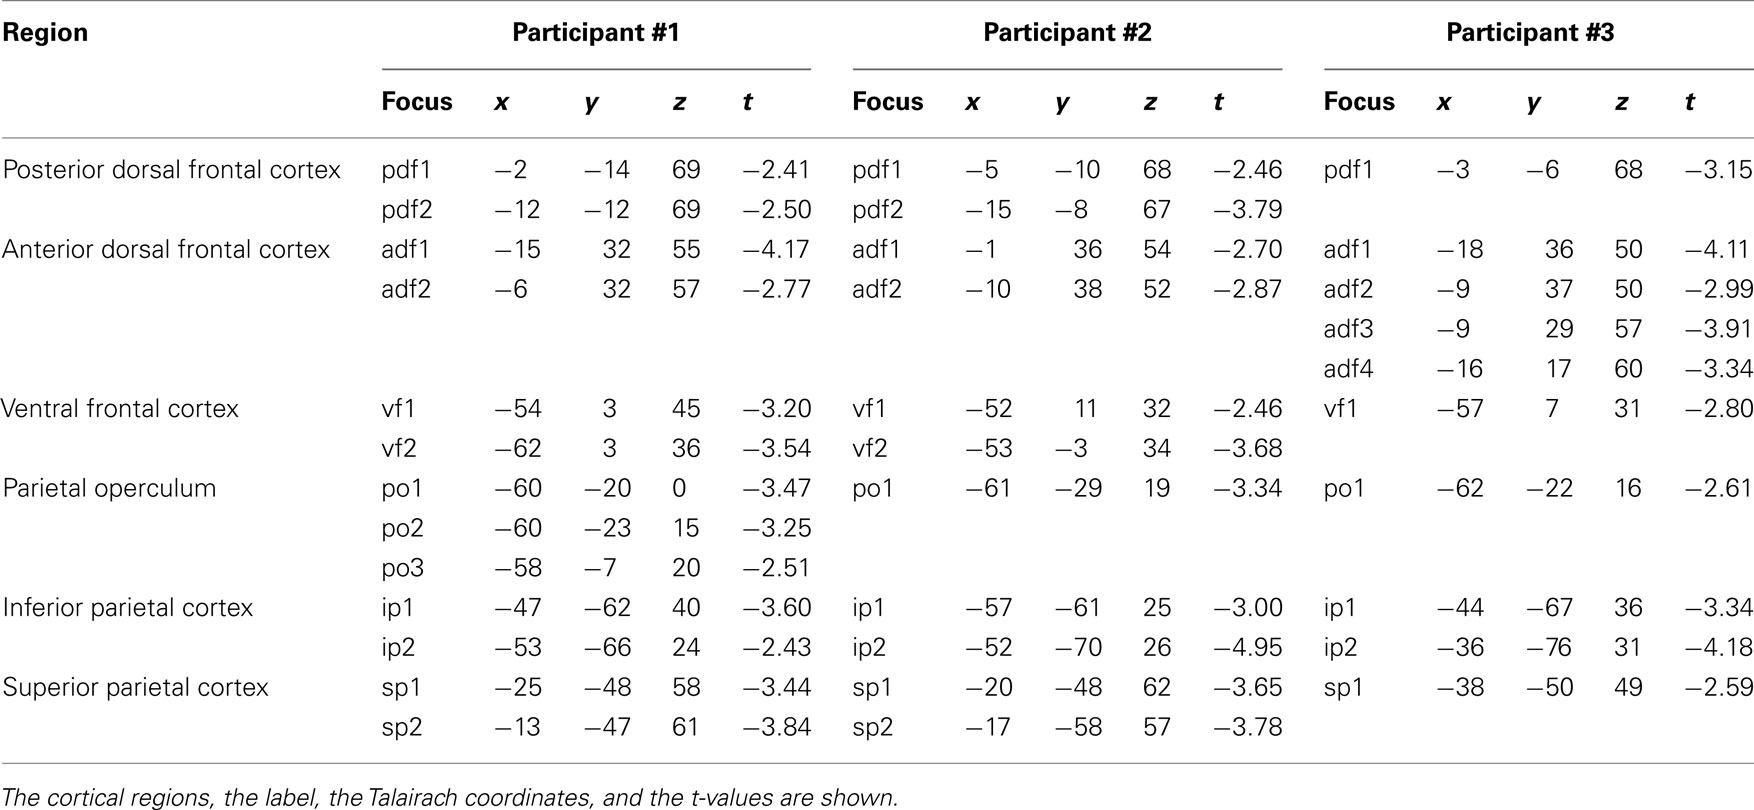
Table 1. Active foci found with the ISI of 7 ms.
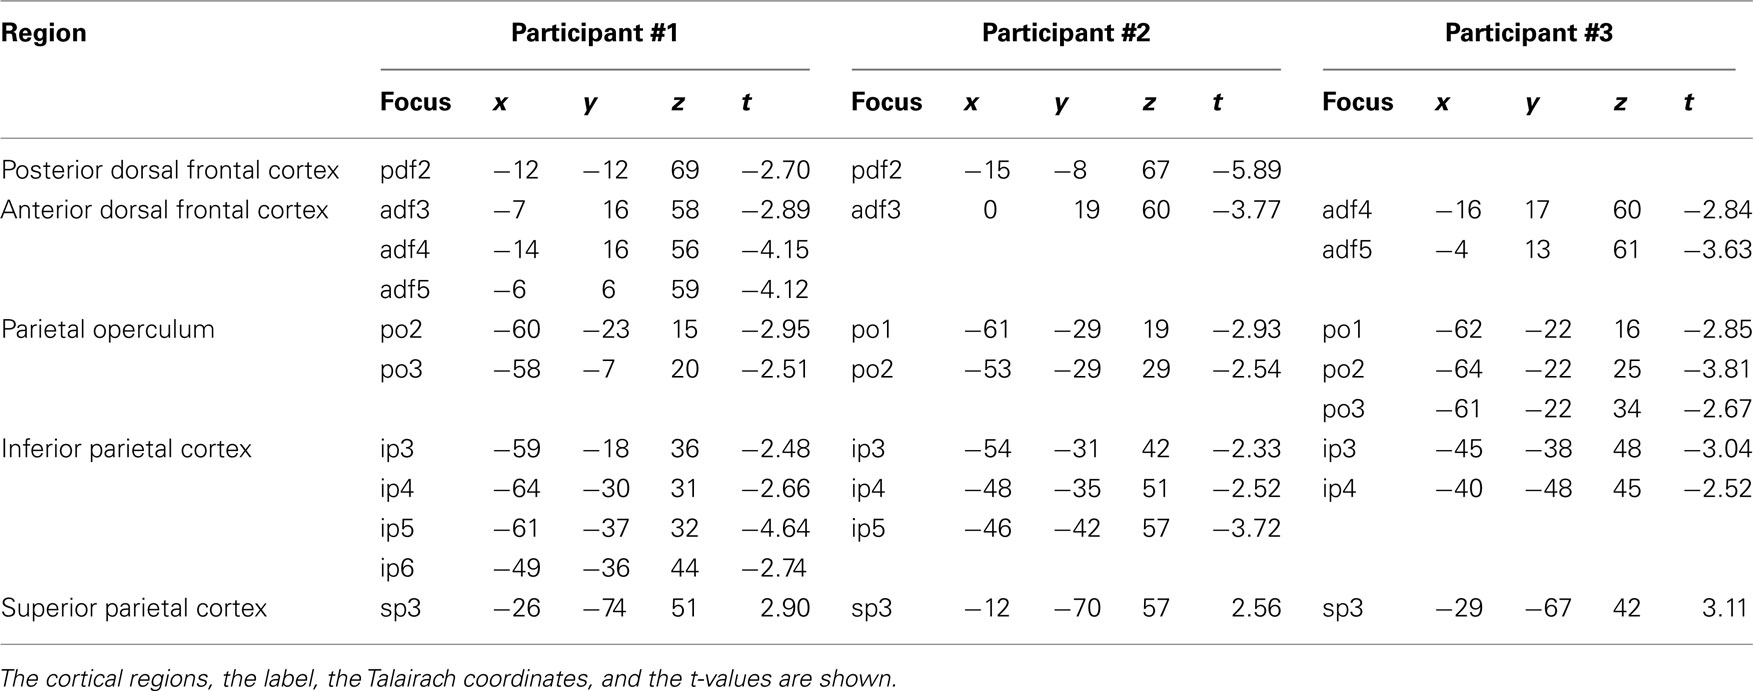
Table 2. Active foci found with the ISI of 4 ms.
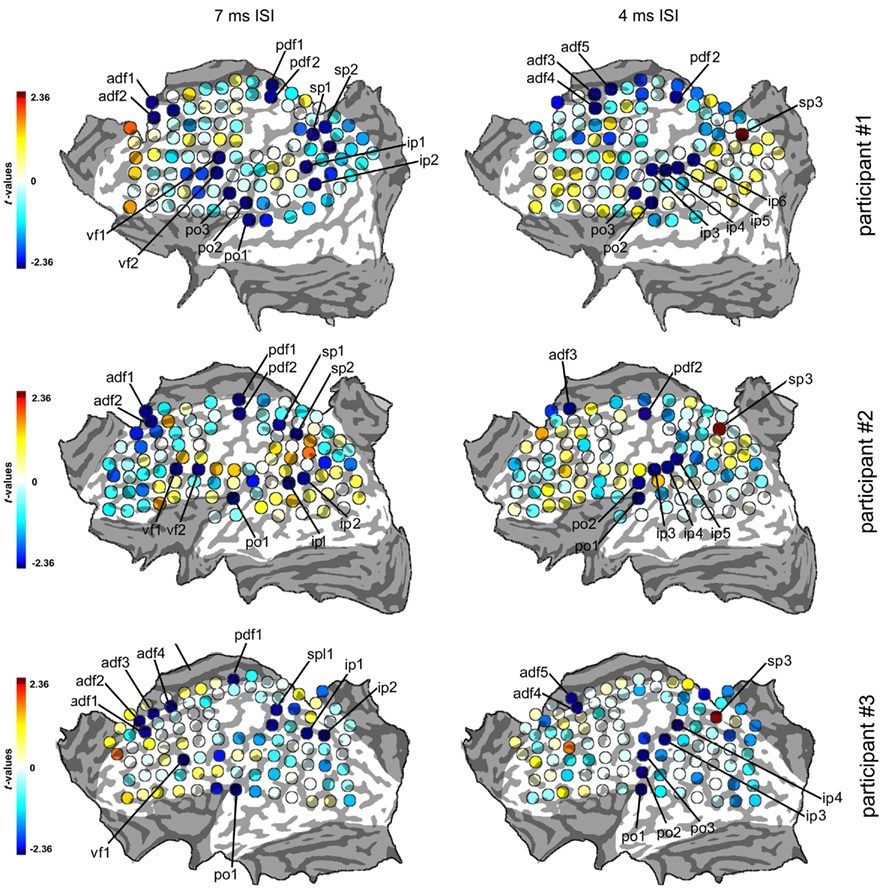
Figure 3. Statistical maps of the three participants in the 7 and 4 ms ISIs. The color scale of the spots indicates the values of the statistical parameter t obtained with single-sample t-tests comparing the normalized, log-transformed cTMS + tTMS MEPs to the average value of 0. Negative (blue) values indicate inhibitory effects of cTMS on tTMS while positive (red) values indicate facilitatory effects. Statistical threshold is set at p = 0.05, corresponding to values of t outside the ±2.36 interval. Spots with significant t-values are highlighted in dark red or blue as shown in the scale and are labeled with an alphabetical code indicating the cortical region and a serial number. The values of t and the coordinates of the spots are presented in Tables 1 and 2.
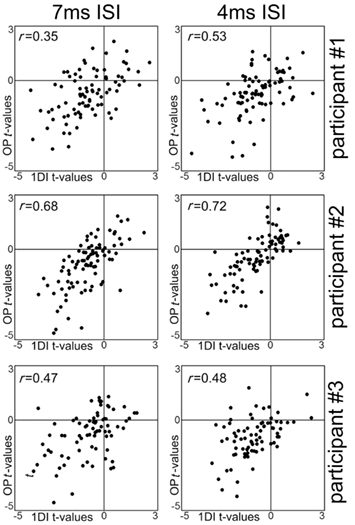
Figure 4. Scatterplots of the t-values obtained for each spot with the samplings of the 1DI muscle alone plotted against the t-values obtained with the samplings of the OP muscle alone. Each dot represent data from a single spot of the scalp grid. The r-values refer to Pearson’s correlation test. All p-values are <0.0001.
Seven Ms ISI
The results are shown in the left panel of Figure 3.
Posterior Dorsal Frontal Cortex
In all participants a distinct inhibitory region was found over the medial portion of the precentral sulcus. Averaged Talairach coordinates between the three participants were −7, −9, 68. In all three participants the active focus was labeled as Brodmann Area (BA) 6 according to the Talairach atlas. The inhibitory effect was present in two adjacent spots in participants #1 and #2 while it was found over one single focus in participant #3.
Anterior Dorsal Frontal Cortex
In all participants a cluster of active foci with inhibitory effects was found along the superior frontal gyrus, located around 4 cm rostral to the precentral sulcus. Two adjacent foci showed the effect in participants #1 and #2 while four adjacent foci were active in participant #3. The averaged Talairach coordinates of all foci between all three participants were −11, 32, 54. Corresponding to the superior frontal gyrus and the rostral border of BA6 with BA8 according to the Talairach atlas.
Ventral Frontal Cortex
In all participants a cluster of active foci was found over the region corresponding to the junction of the precentral sulcus with the inferior frontal suclus. Two adjacent foci were present in participants #1 and #2 and one focus was found in participant #3. The averaged coordinates were of −56, 4, 36, which corresponded according to the Talairach atlas to the precentral gyrus, anterior border of BA6 with BA9 and BA44.
Parietal Operculum
A clear cluster of inhibitory active foci was found in all three participants in the parietal opercular region, over the ventral portion of the postcentral gyrus and sulcus. Three adjacent foci were present in participant #1 and only one focus in the other two participants. The mean Talairach coordinates were of −60, −21, 14, corresponding to the postcentral gyrus at the border between BA40 and BA43 according to the Talairach atlas.
Inferior Parietal Cortex
A cluster of inhibitory active foci was found in all three participants in the inferior parietal lobule, in correspondence with the angular gyrus in all three participants but was in a considerably more ventral position in participant #2 than in the other two participants. In all participants we found two adjacent foci. The mean coordinates were: −48, −67, 30 corresponding to the angular gyrus, BA39 according to the Talairach atlas.
Superior Parietal Cortex
A cluster of inhibitory active foci was found in all three participants, composed of two adjacent foci in the first two participants, and of one focus only in participant #3. Its location was in all three participants over the ventral anterior part of the superior parietal lobule, at its border with the intraparietal sulcus. The mean Talairach coordinates were −23, −50, 57, corresponding to the superior parietal lobule, at the border between BA7 and BA5.
Four Ms ISI
The results are shown in the right panel of Figure 3.
Posterior Dorsal Frontal Cortex
In participants #1 and #2 a single active focus with inhibitory effects was found in the same locations as in the 7-ms ISI condition. No active focus was found in participant #3. Mean Talairach coordinates were of −13, −10, 68, corresponding to BA 6 according to the Talairach atlas.
Anterior Dorsal Frontal Cortex
In all three participants an anterior cluster of inhibitory foci was found, composed of three adjacent foci in participant #1, one focus in participant #2, and of two adjacent foci in participant #3. This was located systematically 1–2 cm caudal to the one found in the 7-ms ISI condition along the superior frontal sulcus. Mean Talairach coordinates were −8, 14, 59, corresponding to the superior frontal gyrus, BA6 according to the Talairach atlas.
Ventral Frontal Cortex
In no subject did we find active foci in the ventral frontal cortex at this ISI.
Parietal Operculum
We found in all three participants a cluster of inhibitory active foci (two adjacent foci in participants #1 and #2 and three adjacent foci in participant #3). These partially overlapped with the ones found in the 7-ms ISI but the clusters were systematically more dorsal than in the 7-ms ISI condition in all three participants. The mean Talairach coordinates were of −60, −22, 23, corresponding to the inferior parietal lobule, at the border between BA40, BA43, and BA2.
Inferior Parietal Cortex
A cluster of inhibitory active foci was found in all three participants (four adjacent foci in participant #1, three adjacent foci in participant #2, and two adjacent foci in participant #3) distributed along the postcentral sulcus. The averaged Talairach coordinates were of −52, −35, 43, corresponding to the postcentral sulcus and the border between BA40 and BA2.
Superior Parietal Cortex
A single excitatory active focus was found in all three participants in the superior parietal lobule in its posterior half. The averaged Talairach coordinates were −22, −70, 50, corresponding to the superior parietal lobule, BA7 according to the Talairach atlas.
Control Measures
In all three participants the t-values from the 1DI and OP muscles showed strong correlations at both the 7 and 4-ms ISIs. The results are shown in Figure 4. The correlations validated the assumption that the data from the two muscles could be averaged in a single value.
Re-tests over selected scalp positions corresponding to active foci confirmed the findings of the mapping. One active spot for each cluster was re-tested and specifically the one with the highest value of t was chosen. Table 3 shows the t-values from the map and from the re-test for each active focus.
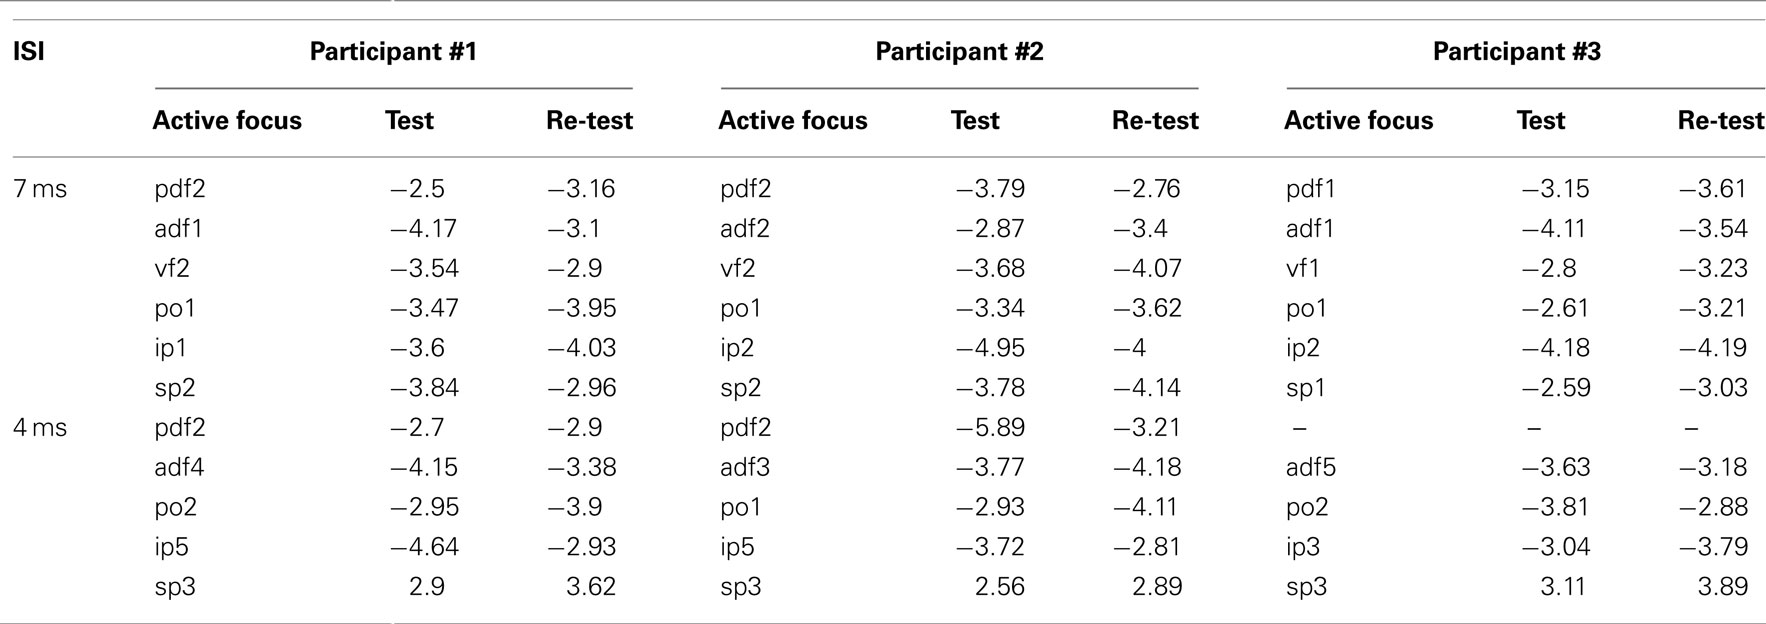
Table 3. Side-by-side comparison of the values of t obtained in the mapping session and in the re-test session for representative active foci in the three participants and for the two ISIs.
Smoothed Maps
The smoothed flat maps that were constructed are shown in Figure 5.
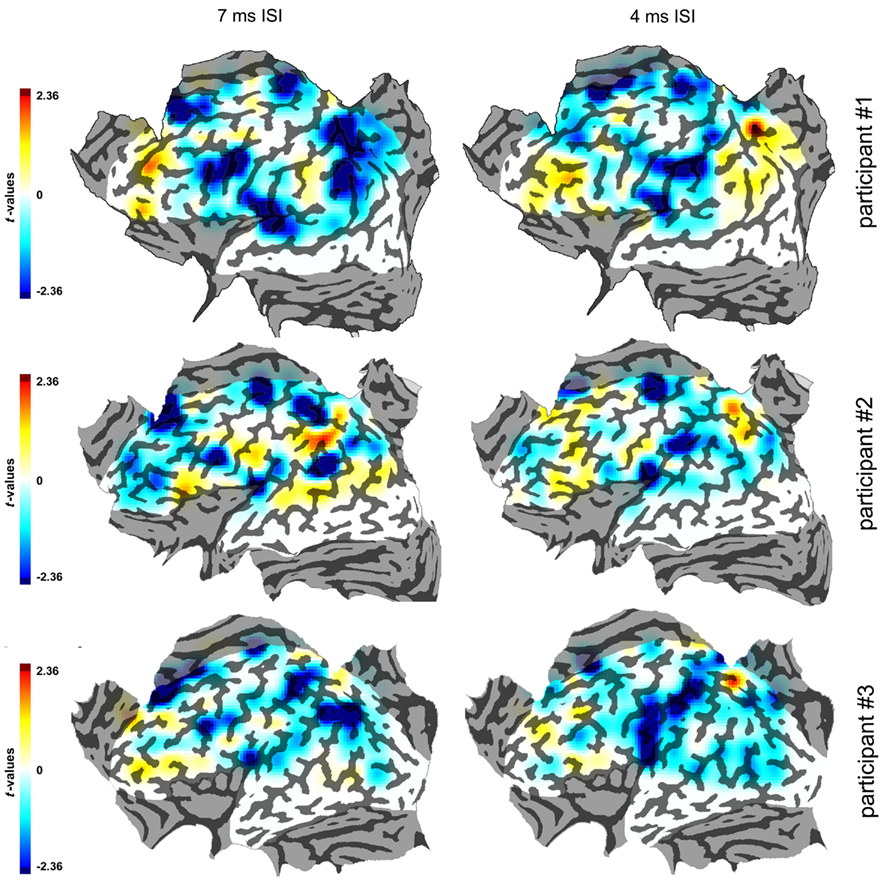
Figure 5. Smoothed maps of the three participants in the 7 and 4 ms ISIs. The color scale indicates the values of the statistical parameter t. Conventions as in Figure 3.
Discussion
The present experiment provides a whole-hemisphere functional measure of the source of cortical sites interacting at short-latency (4–7 ms) with the ipsilateral hand-related corticospinal pathway. The two ISIs of 4 and 7 ms were chosen on the basis of the observation that all previous studies testing cortico-cortical interactions with double coil TMS identify narrow peaks of ISIs at which an effect is present, with no effect at all of cTMS at shorter or longer ISIs. Such active ISIs obviously vary according to the site of cTMS, likely as a consequence of different fiber length and size. In particular, parietal cTMS effects peak at 4 ms with a 2-ms temporal resolution (range 3–5 ms ISIs; Koch and Rothwell, 2009); ventral premotor cTMS peaks at 6 and 8 ms on a time scale resolving 2 ms (effective range at 5–9 ms; Davare et al., 2009); mesial premotor/prefrontal cTMS peaks is effective at 6 ms with a temporal resolution of 3 ms (effective range 4.5–7.5 ms; Mars et al., 2009); and superior parietal lobule cTMS is effective at 6 ms ISIs with a 2-ms resolution (range < 7 ms – no ISIs below 6 ms were tested; Ziluk et al., 2010). We chose therefore to use the 4 and 7-ms intervals because they cover most of the effective ranges already known in literature.
Posterior Dorsal Frontal Cortex
We found active foci located around the medial part of the precentral sulcus on the convexity of the frontal hemispheres. The Talairach y coordinates ranging from −6 to −12 of the active foci in our three participants are compatible with the known location of the supplementary motor area (SMA)-proper found in imaging studies, as summarized in (Picard and Strick, 1996). We find significant effects of cTMS predominant in the 7-ms ISI, but that are present in two participants also at the 4-ms ISI. The inhibitory effects are not surprising considering that spontaneous (Shibasaki and Hallett, 2005) or evoked (Rubboli et al., 2006) electrical activity in the human SMA-proper is known to produce negative myoclonus.
Several reports have demonstrated in the non-human primate the presence of direct connections between the SMA and the ipsilateral M1 (Luppino et al., 1993; Tokuno and Tanji, 1993; Dum and Strick, 2005) but no direct evidence in humans has been provided up to now using the dual-coil technique. The SMA-proper however gives rise to a considerable contingent of corticospinal fibers (Lemon, 2008). It is therefore not clear whether the inhibitory effects that we observe are due to corticospinal or cortico-cortical pathways, considering also that SMA corticospinal axons are slower than those arising from M1 (Maier et al., 2002), which could account for the delay of 4–7 ms between cTMS and tTMS observed here. The fact that in non-human primates the corticospinal projections from the SMA-proper are excitatory (Maier et al., 2002) probably suggests that the inhibitory effects are mediated by cortico-cortical projections.
It has been stated that at present, examination of PMd–M1 connectivity within the same hemisphere is not feasible with dual-coil TMS. This is because the physical size of figure-of-eight coils precludes one to target PMd or SMA with one coil and M1 with the other coil (Chouinard and Paus, 2011). In our experiment the use of smaller coils allowed us to stimulate the scalp sites overlying M1 and SMA-proper. Even with the small sized coils we could not include the putative location of the ipsilateral PMd within the scalp grid. The distal limb representation in the human PMd is located, according to TMS studies, 2 cm anterior to the hand “hot spot” (Schluter et al., 1998; Johansen-Berg et al., 2002), over the precentral sulcus (O’shea et al., 2007). Such position could be marginally reached only in participant #3 but not in participants #1 and #2 (Figure 2). Indeed, all other works that targeted this area with cTMS with the twin-coil technique applied cTMS on the contralateral M1, for obvious volumetric overlap of the two coils (for a review see Chouinard and Paus, 2011).
Anterior Dorsal Frontal Cortex
We found a clear active focus in the anterior dorsal/medial frontal cortex in the 7 and 4-ms ISIs. A similar active focus was found in other three investigations from two independent groups, with ISIs of 6 ms but not at 4 ms (Civardi et al., 2001; Mars et al., 2009; Neubert et al., 2010). In our data we do find a significant effect at the 4-ms ISI, and this discrepancy with the literature could be due to the fact that active focus (a) at 4 ms ISI was located around 1.5 cm posterior than its counterpart at 7 ms ISI and therefore that it has not been stimulated in previous investigations. The anatomical location of such focus has been attributed in previous papers (Mars et al., 2009; Neubert et al., 2010) to the human pre-SMA. Another possibility however is that this active focus could reflect instead the stimulation of the anterior cingulate motor area (CMA).
Several arguments can be proposed in favor or against both hypotheses. The pre-SMA is a likely candidate because its location is superficial and accessible to the TMS-induced electrical field. However there is no evidence in the non-human primates of direct projections of pre-SMA to M1 or even to the PMv and PMd. Anatomical data in primates found few, if any, labeled neurons in pre-SMA after tracer injections into the digit representations of PMd, PMv, or M1 (Matelli et al., 1986; Kurata, 1991; Tokuno and Tanji, 1993; Ghosh and Gattera, 1995; Picard and Strick, 1996; Hatanaka et al., 2001; Dum and Strick, 2002; Luppino et al., 2003). It has been indeed argued that pre-SMA should be assimilated (Picard and Strick, 2001) or at least closely linked (Rizzolatti and Luppino, 2001) to the prefrontal cortex than to other parcellations of BA6. Additionally, in the present data the spot found at 7 ms is at an average y value of Talairach coordinates of 32, which is far too anterior to be overlying the rostral portion of area 6 in the mesial wall, supposedly included between the y = 0 and y = 25/30 in Talairach coordinates (Picard and Strick, 1996). In the two previous MRI-documented findings (Mars et al., 2009; Neubert et al., 2010), the active focus was located at average Talairach y values of 22 (converted from y = 18 in MNI coordinates as shown in Lacadie et al., 2008), and y = 29 (converted from y = 25 in MNI coordinates).
On the contrary the CMA is another possible candidate because it is known to have direct connections to the upper limb-associated agranular frontal cortex (Dum and Strick, 2005). Another argument in favor of the CMA is that its rostro-caudal location is correspondent with the y coordinate of the focus described here (Picard and Strick, 1996). However, the CMA could be too deep to be stimulated because its depth can be estimated at around 25 mm from the pial surface of the convexity. However one TMS study showed the possibility to evoke MEPs from TMS of the CME (Sohn et al., 2004) and studies on TMS over the interhemispheric fissure show that the TMS-induced current can reach very deep structures in the medial wall of the hemispheres compared to the hemispheres’ convexity (Marg and Rudiak, 1994; Terao et al., 1998). Also, it should be noted that the scalp–brain distance along the midline reaches its minimum when moving toward the frontal pole (see Figure 7 of Okamoto et al., 2004).
Ventral Frontal Cortex
We found a clear active focus only with the 7-ms ISI in the lateral portion of the premotor cortex, overlying the precentral sulcus, in correspondence and ventral to the conjunction with the inferior frontal sulcus. This spot is unequivocally attributable to the ventral premotor cortex representation of hand movements and confirms the well-known anatomical data in monkeys of direct PMv–M1 connections (Tokuno and Tanji, 1993; Ghosh and Gattera, 1995; Dum and Strick, 2005) as well as physiological evidence of such connections (Cerri et al., 2003; Shimazu et al., 2004). In humans functional connectivity between PMv and M1 has been clearly demonstrated with dual-coil procedures (Davare et al., 2009; Koch et al., 2010b) at ISIs comparable with the present finding at 7 ms only and with clear inhibitory effects at rest, as the ones showed here.
Parietal Operculum
Perhaps the most interesting and novel finding of this work is the identification at both the 4 and 7-ms ISI of an inhibitory active focus in the parietal opercular region. The most obvious candidate for this focus is the secondary somatosensory area (SII), that has been reported to be connected directly to the hand representation of M1 in the non-human primate (Tokuno and Tanji, 1993). In humans, diffusion tensor imaging data show that the OP4 subdivision of the opercular region (Eickhoff et al., 2006) is preferentially connected to the frontal motor areas, among which, M1 (Eickhoff et al., 2010). The coordinates of the focus described by us indeed match very closely those of the OP4 region, corresponding roughly to BA43 (Eickhoff et al., 2006). To our knowledge the present data are the first evidence in humans of a functional link connecting directly SII and M1.
Inferior Parietal Cortex
The inferior parietal cortex showed two different active foci according to the different ISI. In the 7-ms ISI we found inhibitory effects of cTMS from a focus located in the dorsal portion of the angular gyrus. Its anatomical bases are puzzling, since in humans no clear hand representation is evident in the dorsal angular gyrus from imaging studies investigating the production of hand movements (Culham and Valyear, 2006).Recent works however provide a different explanation, as part of a parietal–premotor–motor network, trough white matter pathways of the superior longitudinal fasciculus (Koch et al., 2010a) Indeed these authors found a spot of short-latency (4 ms) effects of subthreshold cTMS from a spot with average Talairach coordinates of −38, −68, 46 (converted from MNI coordinates as shown in Lacadie et al., 2008) which are comparable with the average coordinates of the active focus described here (−48, −67, 30). However in the present data a clear inhibitory effect was found in contrast with the facilitatory effects of cTMS reported by Koch et al. (2010a). Differences in cTMS pulse waveform and in the task could account for this discrepancy, as explained below.
In the 4-ms ISI we found a much more anterior focus, distributed along the postcentral sulcus and corresponding to the border between BA40 and BA2. Again, a similar finding is described in (Koch et al., 2010a) where cTMS applied to a spot located in −50, −39, 52 (Talairach coordinates converted from MNI) exerted significant excitatory effects at 4 ms ISI on tTMS applied over M1. The effects of cTMS over this site in our experiment can be interpreted as the activation of the well-documented direct reciprocal projections between M1 and the primary SII (Ghosh et al., 1987; Tokuno and Tanji, 1993) or as the effects of supramarginal cortex stimulation (BA40).
Superior Parietal Cortex
Also the superior parietal cortex showed markedly different effects according to the ISI employed. With the 7-ms ISI an inhibitory focus was found above or at the intersection with the intraparietal sulcus. In the upper parietal cortex the postcentral sulcus in humans contains BA1 on its anterior bank, BA2 on the bottom, and BA5 on the posterior bank (Geyer et al., 1999). In non-human primate brains a rich direct parieto-frontal circuit has been described between parietal area PEa (according to the definition of Pandya and Seltzer, 1982) and M1 (Petrides and Pandya, 1984). In humans one recent report using dual-coil TMS has investigated the connectivity between BA5 and M1, showing short-latency effects of cTMS with an ISI of 6 ms (Ziluk et al., 2010). The authors found no effects at rest but a clear facilitation when vibration was applied to the contralateral hand, however, the spot that was considered as the putative BA5 is considerably posterior with respect to the one the active focus that we describe in the present work.
In the 4-ms ISI condition one excitatory focus was found in the caudal part of the superior parietal lobule. Also this focus is likely to be part of a parietal–premotor–motor network, trough white matter pathways of the superior longitudinal fasciculus (Koch et al., 2010a).
General Considerations
The present data show that a complex web of cortical areas are involved in the control of the upper limb corticospinal pathway. In the present experimental conditions we found a strong predominance of inhibitory modulations of corticospinal excitability by cTMS with respect to the data found in literature. Indeed only in one focus in the superior parietal lobule and with only one ISI did we find a facilitatory effect. The reasons for this predominance are probably two, one methodological, and the other dependent on the task employed here. From a methodological point of view the use of parametric statistics to analyze data that are distributed from y = 0 to y = +∞ compared to an equilibrium point of y = 1 produces a bias toward excitatory effects. More interestingly, from a physiological point of view, it should be clear that what we tested here is the cortical connectivity during hand relaxation, while participants were assigned no specific task, i.e., during the resting state. In a previous experiment (Davare et al., 2008) it was clearly shown that the polarity of short-latency modulation of corticospinal activity is task-dependent. Specifically the authors showed that the effects of cTMS over the ipsilateral ventral premotor cortex are inhibitory at rest and become facilitatory during grasp. Our data show that, on a whole-hemisphere scale, the ipsilateral hemisphere has a strongly inhibitory effect on corticospinal function during the resting state.
We also think that the present data are of interest because we describe a novel method consisting in statistical mapping over the two-dimensional space of the scalp surface of the effects of TMS. This method has two main advantages, compared to the canonical a priori localization of coil position. It is explorative in nature and therefore does not suffer from inter-participant variability of cortical areas and it produces results that are self-standing in single individuals. Obviously the concept of TMS statistical mapping does not necessarily need to be applied on the whole-hemisphere as we did here, but is a promising tool for the mapping of limited regions of interest such as for example the premotor cortex. The repeatability of the general pattern of the spatial distribution of active foci between the three participants is striking (see Figures 3 and 5). However considerable local variability is present in most active foci, confirming the possible pitfalls of a priori localization of coil position and the advantages of the single-subject approach proposed here in avoiding false negative data.
Limitations of the Present Study
A main limitation of the current study is that cTMS was applied with a fixed intensity and with a biphasic stimulator. Several dual-coil investigations constantly reported that (a) the intensity of stimulation and (b) direction and modality of the induced current can be a critical parameter that may allow to detect the existence of a certain physiological pathway. Most dual-coil studies used subthreshold cTMS (Davare et al., 2009; Koch et al., 2010a) but some employed suprathreshold cTMS (Mars et al., 2009). Also the fact that we used a biphasic cTMS is critical for comparison with the literature since most other studies employed monophasic stimuli. In our case the choice of biphasic stimulation was done in order to minimize the effects of changing coil orientation for cTMS. Ideally all coil orientations, stimulation intensities and pulse modalities should have been tested since the detection of an effect can depend strongly on these parameters, in the present study we decided because of time limitations and availability of participants to use one condition only. Another limitation of the present study is that we did not check for indexes of direct corticospinal effects. Most of the areas that we tested have both reciprocal connections with the ipsilateral M1 but also give rise to considerable corticospinal projections. The presence of a conditioning effect of cTMS on tTMS at such short latencies therefore can be interpreted as either the presence of an underlying direct or quasi-direct cortico-cortical pathway between the active focus and M1 or the convergence of two parallel descending pathways on a subcortical structure (Lemon, 2008).
Conflict of Interest Statement
The authors declare that the research was conducted in the absence of any commercial or financial relationships that could be construed as a potential conflict of interest.
Acknowledgments
This work has been realized also thanks to the financial support from the Provincia autonoma di Trento and the Fondazione Cassa di Risparmio di Trento e Rovereto.
References
Andres, M., Seron, X., and Olivier, E. (2007). Contribution of hand motor circuits to counting. J. Cogn. Neurosci. 19, 563–576.
Beisteiner, R., Windischberger, C., Lanzenberger, R., Edward, V., Cunnington, R., Erdler, M., Gartus, A., Streibl, B., Moser, E., and Deecke, L. (2001). Finger somatotopy in human motor cortex. Neuroimage 13, 1016–1026.
Bracco, L., Giovannelli, F., Bessi, V., Borgheresi, A., Di Tullio, A., Sorbi, S., Zaccara, G., and Cincotta, M. (2009). Mild cognitive impairment: loss of linguistic task-induced changes in motor cortex excitability. Neurology 72, 928–934.
Brochier, T., Spinks, R. L., Umilta, M. A., and Lemon, R. N. (2004). Patterns of muscle activity underlying object-specific grasp by the macaque monkey. J. Neurophysiol. 92, 1770–1782.
Cattaneo, L., Caruana, F., Jezzini, A., and Rizzolatti, G. (2009). Representation of goal and movements without overt motor behavior in the human motor cortex: a transcranial magnetic stimulation study. J. Neurosci. 29, 11134–11138.
Cattaneo, L., Voss, M., Brochier, T., Prabhu, G., Wolpert, D. M., and Lemon, R. N. (2005). A cortico-cortical mechanism mediating object-driven grasp in humans. Proc. Natl. Acad. Sci. U.S.A. 102, 898–903.
Cerri, G., Shimazu, H., Maier, M. A., and Lemon, R. N. (2003). Facilitation from ventral premotor cortex of primary motor cortex outputs to macaque hand muscles. J. Neurophysiol. 90, 832–842.
Chouinard, P. A., and Paus, T. (2011). What have we learned from “perturbing” the human cortical motor system with transcranial magnetic stimulation? Front. Hum. Neurosci. 4, 173. doi: 10.3389/fnhum.2010.00173
Civardi, C., Cantello, R., Asselman, P., and Rothwell, J. C. (2001). Transcranial magnetic stimulation can be used to test connections to primary motor areas from frontal and medial cortex in humans. Neuroimage 14, 1444–1453.
Culham, J. C., and Valyear, K. F. (2006). Human parietal cortex in action. Curr. Opin. Neurobiol. 16, 205–212.
Daskalakis, Z. J., Paradiso, G. O., Christensen, B. K., Fitzgerald, P. B., Gunraj, C., and Chen, R. (2004). Exploring the connectivity between the cerebellum and motor cortex in humans. J. Physiol. (Lond.) 557, 689–700.
Davare, M., Lemon, R., and Olivier, E. (2008). Selective modulation of interactions between ventral premotor cortex and primary motor cortex during precision grasping in humans. J. Physiol. (Lond.) 586, 2735–2742.
Davare, M., Montague, K., Olivier, E., Rothwell, J. C., and Lemon, R. N. (2009). Ventral premotor to primary motor cortical interactions during object-driven grasp in humans. Cortex 45, 1050–1057.
Dum, R. P., and Strick, P. L. (2002). Motor areas in the frontal lobe of the primate. Physiol. Behav. 77, 677–682.
Dum, R. P., and Strick, P. L. (2005). Frontal lobe inputs to the digit representations of the motor areas on the lateral surface of the hemisphere. J. Neurosci. 25, 1375–1386.
Eickhoff, S. B., Jbabdi, S., Caspers, S., Laird, A. R., Fox, P. T., Zilles, K., and Behrens, T. E. (2010). Anatomical and functional connectivity of cytoarchitectonic areas within the human parietal operculum. J. Neurosci. 30, 6409–6421.
Eickhoff, S. B., Schleicher, A., Zilles, K., and Amunts, K. (2006). The human parietal operculum. I. Cytoarchitectonic mapping of subdivisions. Cereb. Cortex 16, 254–267.
Ferbert, A., Priori, A., Rothwell, J. C., Day, B. L., Colebatch, J. G., and Marsden, C. D. (1992). Interhemispheric inhibition of the human motor cortex. J. Physiol. (Lond.) 453, 525–546.
Geyer, S., Schleicher, A., and Zilles, K. (1999). Areas 3a, 3b, and 1 of human primary somatosensory cortex. Neuroimage 10, 63–83.
Ghosh, S., Brinkman, C., and Porter, R. (1987). A quantitative study of the distribution of neurons projecting to the precentral motor cortex in the monkey (M. fascicularis). J. Comp. Neurol. 259, 424–444.
Ghosh, S., and Gattera, R. (1995). A comparison of the ipsilateral cortical projections to the dorsal and ventral subdivisions of the macaque premotor cortex. Somatosens. Mot. Res. 12, 359–378.
Glenberg, A. M., Sato, M., Cattaneo, L., Riggio, L., Palumbo, D., and Buccino, G. (2008). Processing abstract language modulates motor system activity. Q. J. Exp. Psychol. (Colchester) 61, 905–919.
Hatanaka, N., Nambu, A., Yamashita, A., Takada, M., and Tokuno, H. (2001). Somatotopic arrangement and corticocortical inputs of the hindlimb region of the primary motor cortex in the macaque monkey. Neurosci. Res. 40, 9–22.
Jeannerod, M. (2001). Neural simulation of action: a unifying mechanism for motor cognition. Neuroimage 14, S103–S109.
Johansen-Berg, H., Rushworth, M. F., Bogdanovic, M. D., Kischka, U., Wimalaratna, S., and Matthews, P. M. (2002). The role of ipsilateral premotor cortex in hand movement after stroke. Proc. Natl. Acad. Sci. U.S.A. 99, 14518–14523.
Koch, G., Cercignani, M., Pecchioli, C., Versace, V., Oliveri, M., Caltagirone, C., Rothwell, J., and Bozzali, M. (2010a). In vivo definition of parieto-motor connections involved in planning of grasping movements. Neuroimage 51, 300–312.
Koch, G., Versace, V., Bonni, S., Lupo, F., Gerfo, E. L., Oliveri, M., and Caltagirone, C. (2010b). Resonance of cortico-cortical connections of the motor system with the observation of goal directed grasping movements. Neuropsychologia 48, 3513–320.
Koch, G., Fernandez Del Olmo, M., Cheeran, B., Ruge, D., Schippling, S., Caltagirone, C., and Rothwell, J. C. (2007). Focal stimulation of the posterior parietal cortex increases the excitability of the ipsilateral motor cortex. J. Neurosci. 27, 6815–6822.
Koch, G., Fernandez Del Olmo, M., Cheeran, B., Schippling, S., Caltagirone, C., Driver, J., and Rothwell, J. C. (2008a). Functional interplay between posterior parietal and ipsilateral motor cortex revealed by twin-coil transcranial magnetic stimulation during reach planning toward contralateral space. J. Neurosci. 28, 5944–5953.
Koch, G., Ribolsi, M., Mori, F., Sacchetti, L., Codeca, C., Rubino, I. A., Siracusano, A., Bernardi, G., and Centonze, D. (2008b). Connectivity between posterior parietal cortex and ipsilateral motor cortex is altered in schizophrenia. Biol. Psychiatry 64, 815–819.
Koch, G., Franca, M., Del Olmo, M. F., Cheeran, B., Milton, R., Alvarez Sauco, M., and Rothwell, J. C. (2006). Time course of functional connectivity between dorsal premotor and contralateral motor cortex during movement selection. J. Neurosci. 26, 7452–7459.
Koch, G., and Rothwell, J. C. (2009). TMS investigations into the task-dependent functional interplay between human posterior parietal and motor cortex. Behav. Brain Res. 202, 147–152.
Koch, G., Ruge, D., Cheeran, B., Fernandez Del Olmo, M., Pecchioli, C., Marconi, B., Versace, V., Lo Gerfo, E., Torriero, S., Oliveri, M., Caltagirone, C., and Rothwell, J. C. (2009). TMS activation of interhemispheric pathways between the posterior parietal cortex and the contralateral motor cortex. J. Physiol. (Lond.) 587, 4281–4292.
Kurata, K. (1991). Corticocortical inputs to the dorsal and ventral aspects of the premotor cortex of macaque monkeys. Neurosci. Res. 12, 263–280.
Lacadie, C. M., Fulbright, R. K., Rajeevan, N., Constable, R. T., and Papademetris, X. (2008). More accurate Talairach coordinates for neuroimaging using non-linear registration. Neuroimage 42, 717–725.
Luppino, G., Matelli, M., Camarda, R., and Rizzolatti, G. (1993). Corticocortical connections of area F3 (SMA-proper) and area F6 (pre-SMA) in the macaque monkey. J. Comp. Neurol. 338, 114–140.
Luppino, G., Rozzi, S., Calzavara, R., and Matelli, M. (2003). Prefrontal and agranular cingulate projections to the dorsal premotor areas F2 and F7 in the macaque monkey. Eur. J. Neurosci. 17, 559–578.
Maier, M. A., Armand, J., Kirkwood, P. A., Yang, H. W., Davis, J. N., and Lemon, R. N. (2002). Differences in the corticospinal projection from primary motor cortex and supplementary motor area to macaque upper limb motoneurons: an anatomical and electrophysiological study. Cereb. Cortex 12, 281–296.
Marg, E., and Rudiak, D. (1994). Phosphenes induced by magnetic stimulation over the occipital brain: description and probable site of stimulation. Optom. Vis. Sci. 71, 301–311.
Mars, R. B., Klein, M. C., Neubert, F. X., Olivier, E., Buch, E. R., Boorman, E. D., and Rushworth, M. F. (2009). Short-latency influence of medial frontal cortex on primary motor cortex during action selection under conflict. J. Neurosci. 29, 6926–6931.
Matelli, M., Camarda, R., Glickstein, M., and Rizzolatti, G. (1986). Afferent and efferent projections of the inferior area 6 in the macaque monkey. J. Comp. Neurol. 251, 281–298.
Neubert, F. X., Mars, R. B., Buch, E. R., Olivier, E., and Rushworth, M. F. (2010). Cortical and subcortical interactions during action reprogramming and their related white matter pathways. Proc. Natl. Acad. Sci. U.S.A. 107, 13240–13245.
Okamoto, M., Dan, H., Sakamoto, K., Takeo, K., Shimizu, K., Kohno, S., Oda, I., Isobe, S., Suzuki, T., Kohyama, K., and Dan, I. (2004). Three-dimensional probabilistic anatomical cranio-cerebral correlation via the international 10-20 system oriented for transcranial functional brain mapping. Neuroimage 21, 99–111.
Oldfield, R. C. (1971). The assessment and analysis of handedness: the Edinburgh inventory. Neuropsychologia 9, 97–113.
O’shea, J., Sebastian, C., Boorman, E. D., Johansen-Berg, H., and Rushworth, M. F. (2007). Functional specificity of human premotor-motor cortical interactions during action selection. Eur. J. Neurosci. 26, 2085–2095.
Pandya, D. N., and Seltzer, B. (1982). Intrinsic connections and architectonics of posterior parietal cortex in the rhesus monkey. J. Comp. Neurol. 204, 196–210.
Papathanasiou, I., Filipovic, S. R., Whurr, R., Rothwell, J. C., and Jahanshahi, M. (2004). Changes in corticospinal motor excitability induced by non-motor linguistic tasks. Exp. Brain Res. 154, 218–225.
Petrides, M., and Pandya, D. N. (1984). Projections to the frontal cortex from the posterior parietal region in the rhesus monkey. J. Comp. Neurol. 228, 105–116.
Picard, N., and Strick, P. L. (1996). Motor areas of the medial wall: a review of their location and functional activation. Cereb. Cortex 6, 342–353.
Picard, N., and Strick, P. L. (2001). Imaging the premotor areas. Curr. Opin. Neurobiol. 11, 663–672.
Prabhu, G., Voss, M., Brochier, T., Cattaneo, L., Haggard, P., and Lemon, R. (2007). Excitability of human motor cortex inputs prior to grasp. J. Physiol. (Lond.) 581, 189–201.
Rossi, S., Hallett, M., Rossini, P. M., and Pascual-Leone, A. (2009). Safety, ethical considerations, and application guidelines for the use of transcranial magnetic stimulation in clinical practice and research. Clin. Neurophysiol. 120, 2008–2039.
Rossini, P. M., Barker, A. T., Berardelli, A., Caramia, M. D., Caruso, G., Cracco, R. Q., Dimitrijevic, M. R., Hallett, M., Katayama, Y., Lucking, C. H., Maertens-de Noordhout, A. L., Marsden, C. D., Murray, N. M. F., Rothwell, J. C., Swash, M., and Tomberg, C. (1994). Non-invasive electrical and magnetic stimulation of the brain, spinal cord and roots: basic principles and procedures for routine clinical application. Report of an IFCN committee. Electroencephalogr. Clin. Neurophysiol. 91, 79–92.
Rothkegel, H., Sommer, M., Paulus, W., and Lang, N. (2010). Impact of pulse duration in single pulse TMS. Clin. Neurophysiol. 121, 1915–1921.
Rubboli, G., Mai, R., Meletti, S., Francione, S., Cardinale, F., Tassi, L., Lo Russo, G., Stanzani-Maserati, M., Cantalupo, G., and Tassinari, C. A. (2006). Negative myoclonus induced by cortical electrical stimulation in epileptic patients. Brain 129, 65–81.
Sack, A. T., Cohen Kadosh, R., Schuhmann, T., Moerel, M., Walsh, V., and Goebel, R. (2009). Optimizing functional accuracy of TMS in cognitive studies: a comparison of methods. J. Cogn. Neurosci. 21, 207–221.
Sato, M., Cattaneo, L., Rizzolatti, G., and Gallese, V. (2007). Numbers within our hands: modulation of corticospinal excitability of hand muscles during numerical judgment. J. Cogn. Neurosci. 19, 684–693.
Schluter, N. D., Rushworth, M. F., Passingham, R. E., and Mills, K. R. (1998). Temporary interference in human lateral premotor cortex suggests dominance for the selection of movements. A study using transcranial magnetic stimulation. Brain 121(Pt 5), 785–799.
Shibasaki, H., and Hallett, M. (2005). Electrophysiological studies of myoclonus. Muscle Nerve 31, 157–174.
Shimazu, H., Maier, M. A., Cerri, G., Kirkwood, P. A., and Lemon, R. N. (2004). Macaque ventral premotor cortex exerts powerful facilitation of motor cortex outputs to upper limb motoneurons. J. Neurosci. 24, 1200–1211.
Sohn, Y. H., Voller, B., Dimyan, M., St Clair Gibson, A., Hanakawa, T., Leon-Sarmiento, F. E., Jung, H. Y., and Hallett, M. (2004). Cortical control of voluntary blinking: a transcranial magnetic stimulation study. Clin. Neurophysiol. 115, 341–347.
Talairach, J., and Tournoux, P. (1988). Co-Planar Stereotaxic Atlas of the Human Brain: 3-D Proportional System: An Approach to Cerebral Imaging. New York, NY: Thieme.
Terao, Y., Ugawa, Y., Sakai, K., Miyauchi, S., Fukuda, H., Sasaki, Y., Takino, R., Hanajima, R., Furubayashi, T., Putz, B., and Kanazawa, I. (1998). Localizing the site of magnetic brain stimulation by functional MRI. Exp. Brain Res. 121, 145–152.
Tokuno, H., and Tanji, J. (1993). Input organization of distal and proximal forelimb areas in the monkey primary motor cortex: a retrograde double labeling study. J. Comp. Neurol. 333, 199–209.
Wagner, T., Rushmore, J., Eden, U., and Valero-Cabre, A. (2009). Biophysical foundations underlying TMS: setting the stage for an effective use of neurostimulation in the cognitive neurosciences. Cortex 45, 1025–1034.
World Medical Association General Assembly. (2008). Declaration of Helsinki. Ethical principles for medical research involving human subjects. World Med. J. 54, 122–125.
Keywords: hand movements, agnetic stimulation, premotor cortex, parietal cortex, secondary somatosensory cortex, TMS, operculum, cortico-cortical
Citation: Cattaneo L and Barchiesi G (2011) Transcranial magnetic mapping of the short-latency modulations of corticospinal activity from the ipsilateral hemisphere during rest. Front. Neural Circuits 5:14. doi: 10.3389/fncir.2011.00014
Received: 31 May 2011; Paper pending published: 31 July 2011;
Accepted: 01 October 2011; Published online: 18 October 2011.
Edited by:
Giacomo Koch, Fondazione Santa Lucia IRCCS, ItalyReviewed by:
Ken K. L. Yung, Hong Kong Baptist University, Hong KongMiguel Fernandez-Del-Olmo, Universidade da Coruña, Spain
Copyright: © 2011 Cattaneo and Barchiesi. This is an open-access article subject to a non-exclusive license between the authors and Frontiers Media SA, which permits use, distribution and reproduction in other forums, provided the original authors and source are credited and other Frontiers conditions are complied with.
*Correspondence: Luigi Cattaneo, Center for Mind/Brain Sciences, University of Trento, Via delle Regole, 101, I – 38123 Mattarello, Trento, Italy. e-mail: luigi.cattaneo@unitn.it