Cortical nNOS neurons co-express the NK1 receptor and are depolarized by Substance P in multiple mammalian species
- 1Biosciences Division, Center for Neuroscience, SRI International, Menlo Park, CA, USA
- 2Policy Division, Center for Health Sciences, SRI International, Menlo Park, CA, USA
We have previously demonstrated that Type I neuronal nitric oxide synthase (nNOS)-expressing neurons are sleep-active in the cortex of mice, rats, and hamsters. These neurons are known to be GABAergic, to express Neuropeptide Y (NPY) and, in rats, to co-express the Substance P (SP) receptor NK1, suggesting a possible role for SP in sleep/wake regulation. To evaluate the degree of co-expression of nNOS and NK1 in the cortex among mammals, we used double immunofluorescence for nNOS and NK1 and determined the anatomical distribution in mouse, rat, and squirrel monkey cortex. Type I nNOS neurons co-expressed NK1 in all three species although the anatomical distribution within the cortex was species-specific. We then performed in vitro patch clamp recordings in cortical neurons in mouse and rat slices using the SP conjugate tetramethylrhodamine-SP (TMR-SP) to identify NK1-expressing cells and evaluated the effects of SP on these neurons. Bath application of SP (0.03–1 μM) resulted in a sustained increase in firing rate of these neurons; depolarization persisted in the presence of tetrodotoxin. These results suggest a conserved role for SP in the regulation of cortical sleep-active neurons in mammals.
Introduction
Sleep is homeostatically regulated, such that increasing time awake causes elevation in sleep pressure. The neurobiological substrates of this homeostasis remain unclear (Kilduff et al., 2011). Using Fos immunoreactivity as a neural activity marker, we recently found that GABAergic cortical interneurons expressing neuronal nitric oxide synthase (nNOS) are selectively activated during sleep in three rodent species (Gerashchenko et al., 2008). Since the proportion of nNOS neurons expressing Fos was correlated with slow wave energy, an electroencephalographic (EEG) indicator of sleep pressure, we have proposed that these neurons are involved in the regulation or mediation of the homeostatic recovery process that occurs during sleep (Kilduff et al., 2011).
Two morphological types of cortical nNOS neurons have been identified in primates (Aoki et al., 1993; Lüth et al., 1994). Type I nNOS neurons have larger somata and show intense labeling with antisera to nNOS, as well as with histochemical staining of nicotinamide adenine dinucleotide phosphate diaphorase (NADPH-d), whereas type II neurons have smaller somata and show weaker labeling. More recently, both types of nNOS neurons were confirmed in rodents using NADPH-d staining (Pereira et al., 2000; Freire et al., 2004, 2005) and immunohistochemistry to nNOS (Yousef et al., 2004; Lee and Jeon, 2005; Cho et al., 2010). The sleep-active cortical nNOS neurons are intensely labeled for nNOS and thus correspond to type I cells (Gerashchenko et al., 2008).
In a detailed classification study of rat cortical interneurons (Kubota et al., 2011), type I nNOS neurons were found to be one of the smallest classes of interneurons and a subgroup of the cells immunoreactive for both neuropeptide Y (NPY) and somatostatin (SST). This study also confirmed an earlier finding (Vruwink et al., 2001) that type I nNOS neurons co-express the Substance P (SP) receptor NK1. These reports imply that cortical SP may act as a modulator of cortical sleep-active neurons. To date, no data are available about co-expression of nNOS and NK1 in the cortex of other mammals.
SP is one of the most abundant peptides in the central nervous system and has been implicated in a variety of physiological and pathophysiological processes. Most of the early research focused on its role in nociception, particularly in the spinal cord (reviewed by Hill, 2000). More recent research has established a role for SP in other nervous system functions, such as stress and addiction (reviews in Ebner and Singewald, 2006; Commons, 2010). However, evidence for a role of SP in sleep/wake regulation is sparse and inconclusive (see Nishino and Fujiki, 2007). While activation of the NK1 receptor on neurons usually causes depolarization (Dreifuss and Raggenbass, 1986; Maubach et al., 1998; Zaninetti and Raggenbass, 2000; Ito et al., 2002; Bailey et al., 2004; Blomeley and Bracci, 2008; Morozova et al., 2008; Paul and Cox, 2010), NK1 activation can also have hyperpolarizing effects (Jafri and Weinreich, 1996). The effects of NK1 agonists in most cortical areas and on nNOS neurons in particular are unexplored to this point.
The aims of this study were to identify whether the presence of the NK1 receptor in type I nNOS neurons generalizes to other mammals and to determine the effects of SP on cortical NK1/nNOS neurons. To address these questions, we performed double immunofluorescence for nNOS and NK1 in mouse, rat, and squirrel monkey cortical tissue and conducted in vitro patch clamp recordings of NK1 neurons in cortical slices from mice and rats.
Materials and Methods
Animals
Five male C57BL/six mice (4–5 weeks of age), five male Sprague–Dawley rats (5–6 months of age), and three squirrel monkeys (Saimiri sciureus two female, 687 g and 740 g; one male, 908 g; approximately five-years old) were used for immunofluorescence. Nine male Sprague–Dawley rats (3–6 weeks of age) and 29 NPY-hrGFP mice [B6.FVB-Tg(Npy-hrGFP)1Lowl/J, JAX® Mice, Sacramento, CA; 3–6 weeks of age] of both sexes were used for in vitro recordings. NPY-hrGFP mice express humanized Renilla green fluorescent protein under control of the mouse NPY promoter (van den Pol et al., 2009). An additional NPY-hrGFP mouse was used for nNOS immunofluorescence. Mice and rats were housed with ad libitum access to food and water under a 12 h light/dark cycle for at least seven days before use in an experiment. Squirrel monkeys were purchased from Worldwide Primates (Miami, FL) and quarantined for one month according to California state regulations. All studies were performed according to guidelines approved by the SRI International Institutional Animal Care and Use Committee in conformance with the United States Public Health Service Guidelines on Care and Use of Animals in Research. Every effort was made to minimize the number of animals utilized in this study and to eliminate suffering.
Immunofluorescence
Tissue preparation
Mice and rats were anesthetized with an overdose of euthanasia solution (0.1 ml and 1 ml, respectively, 390 mg/ml sodium pentobarbital and 50 mg/ml phenytoin sodium, Beuthanasia-D, Intervet, Summit, NJ) i.p. and intracardially perfused with heparinized phosphate buffered saline (PBS, 0.01 M, pH 7.2–7.4) followed by 4% paraformaldehyde in PBS. Brains were postfixed in the fixative overnight at 4°C. Monkeys were injected with 1.5 ml euthanasia solution (390 mg/ml sodium pentobarbital and 50 mg/ml phenytoin sodium, Euthasol, Henry Schein, Melville, NY) i.p., followed by 1.5 ml/kg of the same solution administered intravenously. The brains were rapidly removed, rinsed in cold PBS, placed in a squirrel monkey brain mold, and cut into 2 mm-thick blocks using stainless steel blades. For each animal, two blocks were immersion fixed in 4% paraformaldehyde in PBS overnight at 4°C. The remaining blocks were used for unrelated studies. All tissue was cryoprotected in 30% sucrose in PBS at 4°C. Coronal 40 μm sections were cut on a freezing microtome and stored at –20°C in 30% ethylene glycol and 20% glycerol in PBS until use.
Labeling and visualization
All incubations were performed on free-floating sections at room temperature (RT). From each brain, one anterior and one posterior section were selected. The anterior-posterior levels were +1.1 and −2.3 mm from bregma for mice (Paxinos and Franklin, 2001) and +2.04 and −4.44 for rats (Paxinos and Watson, 2007). For monkeys, the frontal section was anterior of the striatum (frontal of A15 according to Emmers and Akert (1963) and about section 180 of the squirrel monkey brain atlas at http://brainmuseum.org) and P0.5 (Emmers and Akert, 1963). For monkeys, only about half of the anterior section was available for this study. For two monkeys, this was mainly the superior frontal gyrus; for the other monkey, it was mainly the inferior frontal gyrus.
Endogenous peroxidase activity was quenched by 15 min incubation in 1% H2O2 in PBS. Sections were preincubated for 1 h in 5% normal donkey serum with 0.3% Triton and 0.1% sodium azide in PBS. Endogenous biotin was blocked by 15 min incubation in avidin solution followed by 15 min incubation in biotin solution (Vector Laboratories, Burlingame, CA). Incubation in primary antibody was performed overnight with a cocktail of mouse anti-nNOS antibody (N2280, Sigma-Aldrich, Milwaukee, WI) and rabbit anti-NK1 antibody (gift from Prof. R. Shigemoto, National Institute for Physiological Sciences, Okazaki, Japan). For immunofluorescence of one NPY-hrGFP mouse, the NK1 antibody was omitted. The concentrations utilized were determined by titration for optimal labeling for each species and were 0.25 μg/ml anti-NK1 and 180 μg/ml anti-nNOS for mouse, 0.1 μg/ml anti-NK1 and 180 μg/ml anti-nNOS for rat, and 0.5 μg/ml anti-NK1 and 450 μg/ml anti-nNOS for monkey tissue. As a negative control, the primary antibodies were omitted on additional sections of each species. nNOS was visualized with a donkey anti-mouse secondary antibody conjugated to Alexa Fluor 546 (Invitrogen, Chicago, IL, 1:500, 2 h). NK1 was visualized using a Tyramide Signal Amplification Fluorescein system (Perkin-Elmer, Los Angeles, CA), preceded by a 2 h incubation with biotinylated secondary antibody (Jackson ImmunoResearch, West Grove, PA, 2.6 μg/ml for rodents, 1.3 μg/ml for monkeys) and a 2 h incubation with an avidin-biotinylated peroxidase complex (Vector Laboratories, 1:200). Sections were mounted on glass slides, dehydrated in a graded series of alcohol, cleared with xylenes, and cover slipped in Depex (Electron Microscopy Sciences, Hatfield, PA) for permanent mounting (Espada et al., 2005). Labeled cell profiles in the neocortex and underlying white matter in one hemisphere of each section were counted at 400× magnification using Stereoinvestigator software (MBF Bioscience, Willoston, VT).
In vitro Electrophysiology
Slice preparation
Rodents were deeply anesthetized with isofluorane and then decapitated. Brains were isolated in ice-cold oxygenated high sucrose solution containing (mM): sucrose 234, KCl 2.5, CaCl2 0.5, NaH2PO4 1.25, MgSO4 10, glucose 11, bubbled with 95% O2–5% CO2. Coronal brain slices (250 μm thickness) of the region containing the rostral-most 2 mm of the striatum were cut with a microtome (VT-1000S, Leica, Germany). Slices were then transferred to an incubation chamber where they were superfused with physiological bicarbonate solution containing (mM): NaCl 123, KCl 3, CaCl2 2, NaHCO3 26, glucose 11, NaH2PO4 1.25, MgCl2 1, bubbled with 95% O2–5% CO2 at RT (22–24°C) for at least 1 h before recordings. The osmolarity of these external solutions was checked by a vapor pressure osmometer (Advanced Instruments, Norwood, MA) and ranged between 295 and 305 mOsmol l−1.
Whole-cell patch clamp recordings
Patch pipettes were prepared from borosilicate capillary glass (G150F-4, Warner Instruments LLC, Hamden, CT) with a micropipette puller (P-97, Sutter Instruments, Novato, CA). The pipettes were routinely filled with a KGlu-internal solution containing (mM): KGluconate 125, KCl 10, MgCl2 1, EGTA 5, Hepes 10, MgATP 1, NaGTP 0.5, adjusted to pH 7.25 with KOH. For some experiments, 8 mM biocytin was added to the internal solution for post-hoc characterization of the recorded neurons. The osmolarity of these internal solutions was between 290 and 305 mOsmol l−1. Pipette resistance measured in the external solution was 4–8 MΩ. The series resistance during recording was 12–48 MΩ and was compensated while recording in current-clamp mode. The reference electrode was an Ag–AgCl pellet immersed in the bath solution. The liquid junction potential was estimated to be 15 mV and was subtracted from the recorded membrane potential.
For electrophysiological recordings, a single slice was transferred to a recording chamber (RC-26G, Warner Instruments LLC, Hamden, CT) and superfused with the physiological bicarbonate solution at RT at a flow rate of 2 ml/min. For in vitro identification of live neurons expressing the NK1 receptor, 50–80 nM of tetramethylrhodamine conjugated to Substance P (TMR-SP) from Enzo Life Sciences, NY (Labrakakis and MacDermott, 2003; Pagliardini et al., 2005; Torsney and MacDermott, 2006) was added to the bath for 3 min (from a 56 μM stock solution in H2O stored at −20°C) and slices were washed for at least 30 min before identification of labeled neurons. Cortical cells were visualized under an upright microscope (Leica DM LFSA, Leica Microsystems, Germany) using both infrared-differential interference contrast (IR-DIC) microscopy and fluorescence microscopy. Infrared images were acquired via a charge-coupled device (CCD) camera optimized for infrared wavelengths (DAGE-MITI, Michigan City, IN); fluorescence images were acquired using a digital microscope camera (ProgRes® MF, JENOPTIK Optical Systems GmbH, Germany). Recording pipettes were advanced toward individual NPY and/or TMR-SP fluorescent labeled cells in the slice under positive pressure and, on contact, tight seals between the pipette and the cell membrane on the order of 1–4 GΩ were made by negative pressure. The membrane patch was then ruptured by suction and membrane potential was monitored in current-clamp mode using a Multiclamp 700A amplifier (Molecular Devices, Sunnyvale, CA). Only cells in which the resting membrane potential (Er) was below −50 mV were included in this study. The output voltage signal was low-pass filtered at 3 kHz and digitized at 10 kHz. Data were recorded on a computer through a Digidata 1320A A/D converter using pCLAMP software version 9.2 (Molecular Devices, Sunnyvale, CA). Recorded data were processed and plotted using Matlab R2010b (Mathworks, Natick, MA). For statistical comparisons, values were compared using analysis of variance (ANOVA) and the two samples, unpaired t-test with the program GNU Octave (http://www.gnu.org/software/octave/).
Characterization of recorded neurons at rest and after application of SP
At the initiation of whole-cell recordings, three different negative pulses of 1 s were delivered every 2 s in order to obtain three levels of hyperpolarization. The cell capacitance was determined by fitting the initial 300 ms of the hyperpolarizing pulse to a single exponential and averaging the three values obtained. The input resistance (Rin) at each hyperpolarization level was calculated as the maximal change in voltage obtained within these 300 ms divided by the injected current. Rin in absence of injected current was calculated by linear regression. Er of the cells was calculated by averaging 100 ms of membrane potential at rest. 1 mM stock solutions of SP in H2O (Sigma Aldrich, St. Louis, MO) were stored at −20°C in 0.2 ml aliquots. After verifying that the whole-cell recording was stable, SP was further diluted in bubbling artificial cerebrospinal fluid (ACSF) to obtain a final concentration of 0.03–1 μM and was applied in the bath for 30–120 s. In a similar fashion, tetrodotoxin (TTX; Abcam, Cambridge, MA) was also added to an additional container of oxygenated ACSF with or without SP at a final concentration of 1 μM prior to bath application. With SP in the bath, hyperpolarizing pulses (40–50 pA, 200 ms duration) were applied to cells at 10 s intervals to monitor Rin over time. SP-induced changes in firing rate were calculated by averaging the firing rate every 10 s. In order to detect spikes, traces were high-pass filtered over 100 Hz using a zero-phase forward and reverse digital Butterworth filter of sixth order. For every filtered trace, an amplitude threshold was manually determined and the onset of the spike was determined as the crossing of the threshold in the positive direction.
Results
Cortical nNOS Neurons Co-Express NK1
In all three species, almost all cortical nNOS neurons were found to co-express NK1: 90.8% (466 of 513) of nNOS neurons in mice, 98.7% (912 of 914) of nNOS neurons in rats, and 90.9% (1320 of 1452) of nNOS neurons in monkeys were co-labeled for NK1. In contrast, the proportion of single-labeled NK1 neurons differed greatly between species. While they were virtually absent in mice (3.5%, 17 of 483), single-labeled NK1 neurons constituted a significant population in rats (30.7%, 403 of 1315). In monkeys, single-labeled NK1 neurons outnumbered those co-labeled for nNOS (58.2%, 1834 of 3154).
The distribution of labeled neurons also differed between species. In mice, nNOS neurons were located mainly in the deep gray matter (Figures 1A,A'). In rats, nNOS neurons were scattered throughout all cortical layers (Figures 1B,B'). In monkeys, nNOS neurons were concentrated on both sides of the white matter-gray matter border (Figures 1C,C'). Single-labeled NK1 neurons were concentrated in the superficial gray matter in rats (Figures 1B,B') and deep gray matter in monkeys (Figures 1C,C'). In monkeys, both cell types were more abundant in gyri than in sulci (Figure 1C').
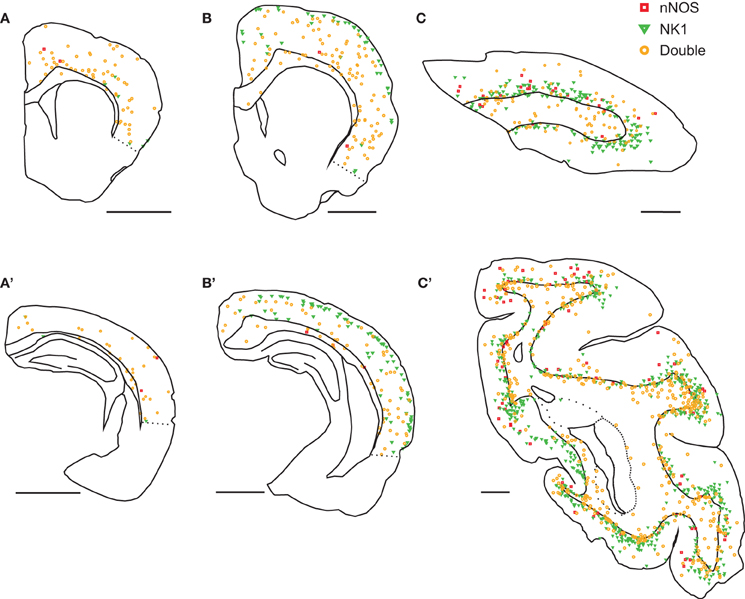
Figure 1. Distribution of nNOS and NK1 cells in the neocortex of three mammalian species. In mice (A,A'), virtually all cells were double-labeled for nNOS and NK1 (orange) and were most abundant in deep gray matter. Neurons single-labeled for nNOS (red) or NK1 (green) were virtually absent. In rats (B,B'), double-labeled neurons were scattered throughout the cortex and underlying white matter; single-labeled nNOS neurons were virtually absent. Neurons single-labeled for NK1 were concentrated in superficial layers. In monkeys (C,C'), double-labeled neurons were most abundant in the deep gray matter and the underlying white matter and single-labeled nNOS neurons were rare. Neurons single-labeled for NK1 were concentrated in deep gray matter. Labeled neurons were more abundant in gyri than in sulci. A, B, and C are anterior sections, A', B', and C' are posterior sections. Scale bars denote 2 mm.
In all species, nNOS neurons showed a variable dendritic morphology with two or more primary dendrites (Figure 2). We observed some variability in cell size, with some neurons exhibiting exceptionally large somata. In rats and monkeys, single-labeled NK1 neurons were found to have a different morphology than those co-labeled for nNOS. In rats, single-labeled neurons were noticeably less intensely labeled and mostly smaller than double-labeled cells (Figure 2B). In monkeys, neurogliaform-like morphology with a round or oval soma and highly arborized short dendrites were the most distinctive characteristics of single-labeled NK1 neurons (Figure 2D). These cells were also often less intensely labeled and smaller than the double-labeled neurons (Figure 2C). In contrast, single-labeled nNOS neurons did not show apparent morphological differences from double-labeled neurons in any of the three species.
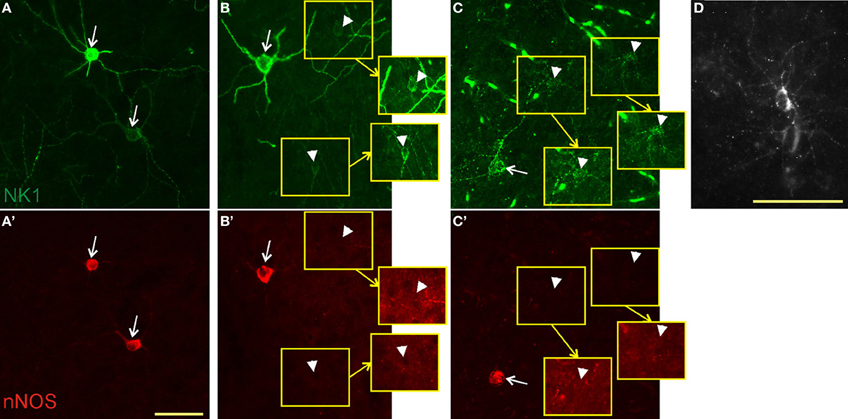
Figure 2. Colocalization of NK1 and nNOS. In mice (A,A'), virtually all neurons were double-labeled (arrows) for NK1 (green, top panels) and nNOS (red, bottom panels). In rats (B,B'), we found both double-labeled neurons and neurons labeled for NK1 only (arrowheads). Neurons staining for NK1 alone had smaller somata and less intense labeling. Portions of the micrographs containing the weakly labeled NK1 neurons are displayed in the insets (yellow squares) with enhanced brightness to enable visibility. Note the absence of nNOS labeling in these neurons in B'. In monkeys (C,C'), double-labeled neurons had a dendritic arborization pattern similar to that of the other species, whereas neurons single-labeled for NK1 had round somata surrounded by short, thin, highly arborized dendrites. Fluorescent blood vessels are visible because monkeys were not perfused before fixation. The punctate pattern of NK1 labeling in C and the bottom cell in A is typical for NK1 endocytosis upon ligand binding. (D) A single-labeled NK1 neuron of monkey cortex at higher magnification for better visibility of the morphology. Note the highly arborized, short dendrites. Scale bars denote 50 μm. Micrographs were taken as monochrome pictures and pseudocolored for representation.
Identification of SP-Responsive Neurons In vitro
Since strongly immunoreactive cortical nNOS cells are a subgroup of NPY neurons in rats and mice (Tomioka et al., 2005; Gerashchenko et al., 2008; Kubota et al., 2011) and are concentrated in infragranular layers in mice, we initially targeted NPY neurons in infragranular layers of NPY-hrGFP mice in search of nNOS/NK1 neurons. However, only 16% (6 of 38) of neurons recorded in this manner were affected by application of 0.3–1 μM of SP in the bath. The low proportion of GFP-expressing neurons immunoreactive for nNOS in NPY-hrGFP mice is illustrated in Figure 3. Given the high degree of co-expression of nNOS and NK1 across species demonstrated above, we therefore used the NK1 ligand TMR-SP to increase the yield of nNOS neurons among NPY cells recorded in vitro in NPY-hrGFP mice and to identify these neurons also in rats. A 3-min bath application of TMR-SP (56 nM) was sufficient to label neurons for more than 2 h. Since TMR-SP might produce effects in NK1 neurons comparable to SP itself, at least 30 min elapsed between TMR-SP application and initiation of a search for labeled cells for subsequent patching. Figure 3C shows a healthy NPY neuron visualized in vitro. After confirming the viability of the neuron by visualizing it under IR-DIC, the blue excitation was replaced by green illumination, thereby enabling visualization of TMR-SP-labeled neurons (Figure 3D). TMR-SP fluorescence was dim and could only be detected at 400× magnification. GFP fluorescence from NPY neurons could be detected at 50× magnification and was, therefore, used to aid identification of TMR-SP-labeled neurons in mice. No significant differences in Er, Rin, capacitance, or time constant (τ) were observed when cells identified by TMR-SP (N = 8) were compared to SP-responsive NPY-hrGFP neurons that had not been exposed to TMR-SP (N = 6). Consequently, all SP-responsive neurons were considered as a single group for statistical analysis.
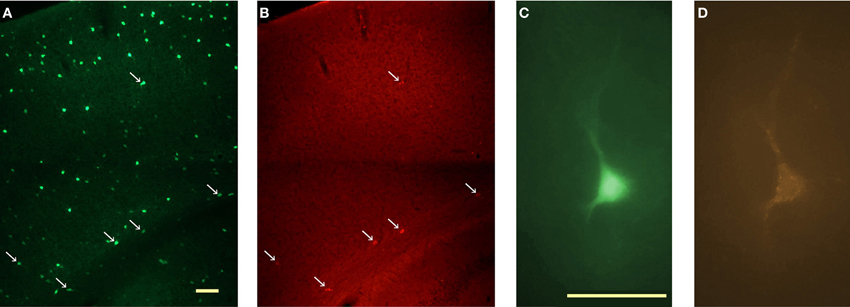
Figure 3. In vitro identification of NK1+ neurons in the cortex of NPY-hrGFP transgenic mice. (A) Visualization of NPY neurons in the cortex of NPY-hrGFP transgenic mice. This 40 μm section was processed for nNOS immunofluorescence. (B) nNOS-immunoreactive cells in the same section illustrated in A. nNOS neurons are located mainly in layer 6, adjacent to the white matter. Arrows in A and B denote neurons that show both green (GFP) and red (nNOS) fluorescence. Note the small proportion of NPY neurons co-expressing nNOS. (C)In vitro visualization of an NPY neuron for targeted patching. (D) Same cell as C illuminated with green light after a 3-min bath application of 56 nM TMR-SP followed by a 30 min wash. Micrographs in C and D are pseudocolored to resemble the original colors. Scale bar denotes 200 μm in A; 50 μm in C.
SP Directly Depolarizes SP-Responsive Neurons in Mice and Rats
To evaluate the effect of SP on neuronal firing rate, mouse cortical neurons were initially hyperpolarized with 0–10 pA to reduce spontaneous firing. Application of 0.03–1 μM SP induced on average (all values correspond to mean ± standard deviation) an increase in firing rate of 10.2 ± 4.9 spikes/s (N = 11). Blockade of voltage-dependent sodium channels by >5 min of bath application of 1 μM TTX was tested in seven cells. Addition of 0.03–0.3 μM SP induced a depolarization of 11.9 ± 4.6 mV (N = 7). SP-induced depolarization in the presence of TTX was found in all cells tested, indicating that the action of SP is most likely direct. Figure 4A shows an example of SP-induced depolarization of a neuron in mouse cortex. Figure 4B shows the membrane potential of a different neuron under TTX and its response to two successive applications of SP. The large variability observed in both the amplitude and the duration of the SP-induced depolarization for a given SP concentration precludes the elaboration of a dose response curve at the present time. Similar results were obtained for TMR-SP fluorescent neurons selected for recording in rat cortical slices, where bath application of 0.1–0.3 μM SP induced an increase of 5 ± 2 spikes/s (N = 9) in firing rate and, under 1 μM TTX, a depolarization of 8.1 ± 3.6 mV (N = 5 out of 5 neurons tested). Figure 4C shows an example of an SP-induced increase in firing rate of a TMR-SP-responsive cell in a rat cortical slice. Figure 4D shows a different neuron exhibiting a prolonged depolarization after 1 min application of SP.
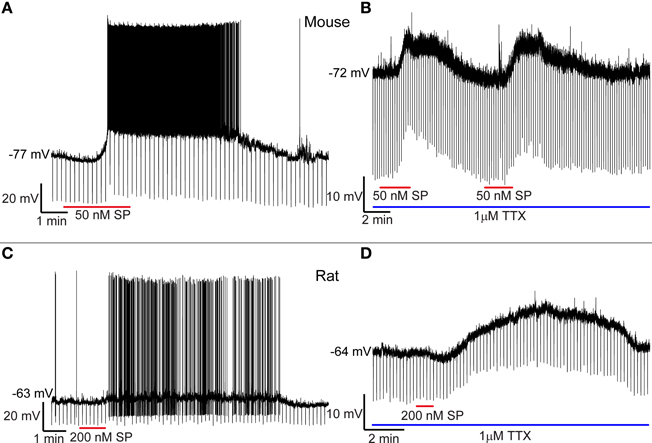
Figure 4. SP depolarizes cortical NK1+ neurons. (A) Application of 50 nM SP to the bath depolarizes an NK1+ neuron in the mouse cortex and generates an increase in firing rate that persists for about 10 min. (B) Successive applications of 50 nM SP elicit similar responses during blockade of voltage-dependent Na+ channels with TTX. (C) SP increases the firing rate of cortical NK1+ neurons in the rat. (D) Under TTX blockade, rat NK1+ cortical neurons can be depolarized for a prolonged period despite the short duration of SP bath application.
SP-Responsive Neurons have Different Electrical Properties than Non-SP-Responsive Cells
By visual inspection of NPY neurons in mice, we did not observe a clear morphological difference that allowed distinction between SP-responsive (NK1+) NPY cells and NPY neurons that did not respond to SP (NK1−). However, during whole-cell recordings, striking differences were found in Er, Rin, and τ of these cells. Figure 5A shows an example of the membrane potential of an NK1+ neuron (orange trace) and an NK1− cell (black trace) during 1 s current pulses of −25, −50, and −75 pA. Although both cells were injected with the same three levels of current, the larger Rin of the NK1+ cell resulted in a greater change in membrane potential for a given amount of current injected and a longer τ (40 ms for the highest current injected, compared to τ = 14 ms for the NK1− cell). One-way ANOVAs revealed that Er, Rin, and τ were significantly different between mouse NK1+, mouse NK1−, and rat NK1+ neurons [F(2, 51) = 35.98, p < 2 × 10⁻¹⁰, F(2, 51) = 12.58, p < 4 × 10⁻⁵; F(2, 33) = 31.21, p < 3 × 10⁻⁸, respectively]. Post-hoc comparisons were performed using t-tests with Bonferroni-adjusted alpha levels of 0.017 (0.05/3). Figure 5B illustrates that mouse NK1+ cells (Er = −66.9 ± 5.9 mV, N = 14) were more depolarized at rest than NK1− cells (Er = −77 ± 4.4 mV, N = 31), t(43) = 6.53, p < 6 × 10⁻⁸. Figure 5C illustrates that Rin also differed between mouse NK1+ cells (476 ± 192 MΩ, N = 14) and NK1− cells (241 ± 101 MΩ, N = 31), t(43) = 5.42, p < 3 × 10⁻⁶; and Figure 5D illustrates that τ was longer for mouse NK1+ cells (35.2 ± 7.4 ms, N = 13) than for NK1− cells (13 ± 4.9 ms, N = 14), t(23) = 9.24, p < 2 × 10⁻⁹. The electrical parameters of rat NK1+ neurons (Er = −63.1 ± 6.3 mV, Rin = 332 ± 195 MΩ, and τ = 31 ± 11 ms) were not statistically different from mouse NK1+ neurons [t(21) = 1.45, p = 0.16; t(21) = 1.74, p = 0.10; t(20) = 1.12, p = 0.28, respectively]. However, Er and τ of rat NK1+ neurons differed from that of mouse mouse NK1− neurons [t(38) = 7.60, p < 4 × 10⁻⁹; t(21) = 5.35, p < 3 × 10⁻⁵, respectively].
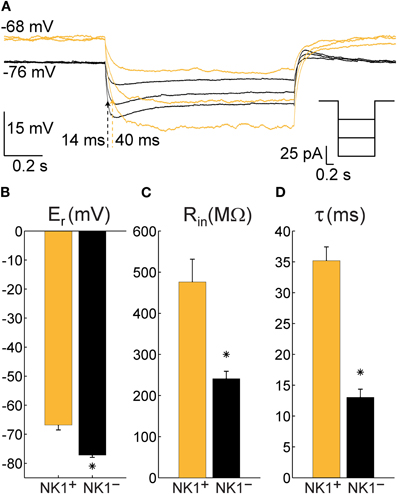
Figure 5. Electrophysiological characteristics of NPY neurons recorded in cortical slices from NPY-hrGFP transgenic mice that are either NK1+ (N = 14) or NK1− (N = 31). (A) Typical single trials of the membrane potential of an NK1+ neuron (orange) and an NK1− neuron (black) in response to hyperpolarizing current injections showing a large difference in time constant (indicated by dotted arrows) and resting potential. Right inset depicts the injected currents for both neurons. (B) Mean and standard error of the membrane potential at rest (Er) for all recorded NK1+ and NK1− cells. (C) Mean and standard error of the input resistance at rest (Rin) for all recorded NK1+ and NK1− neurons. (D) Mean and standard error of the time constant (τ, calculated as the product between input resistance and capacitance) for all cells where at least three steps of current were injected. The differences between NK1+ and NK1− were highly significant in all three cases (p < 3 × 10⁻⁶).
Discussion
In the three species investigated here, virtually all cortical nNOS neurons were co-labeled for NK1 while the proportion of single-labeled NK1 neurons varied among species. In vitro patch clamp recordings showed that 0.03–1 μM SP elicited persistent depolarization and a robust increase in firing rate of putative nNOS neurons in mice and rats. These results suggest that SP can activate cortical nNOS neurons across species. Combined with our previous findings that cortical nNOS neurons are sleep-active, these results suggest a possible role for SP in sleep regulation.
Type I and Type II nNOS Neurons
We assume that all nNOS neurons we detected were type I because their morphology and distribution matches that of previous reports for the species investigated here (e.g., Wiencken and Casagrande, 2000; Freire et al., 2004, 2005). Our nNOS antibody failed to detect the weakly labeled type II nNOS neurons that have previously been reported in mice (Freire et al., 2005; Lee and Jeon, 2005), rats (Freire et al., 2004; Yousef et al., 2004; Cho et al., 2010; Kubota et al., 2011), and squirrel monkeys (Franca et al., 1997; Wiencken and Casagrande, 2000). Our antibody is raised against an N-terminal fragment of rat nNOS and, therefore, likely detects only the most abundant alpha splice variant (Mardsen et al., 2011). Using a different N-terminal-directed antibody, Vruwink et al. (2001) also failed to report type II nNOS neurons in rats. Thus, it is possible that type II nNOS neurons mainly express an alternative splice variant, resulting in our inability to detect such cells in the present study. In support of that notion, Eliasson et al. (1997) report immunolabeling of nNOS in absence of nNOS-alpha in the cortex to be restricted to soma and proximal dendrites, which is typical for type II neurons.
Single-Labeled NK1 Neurons
The proportion of neurons immunoreactive for NK1 but not for nNOS that we found in rats (30.7%, 403 of 1315) was similar to that reported by Vruwink et al. (26.4%, 174 of 659). However, Kaneko et al. (1994) reported a much higher number of weakly labeled NK1 neurons (84.1%, 328 of 390), with the number of intensely labeled NK1 neurons per section being comparable to NK1/nNOS neurons in the present study. Since the immunofluorescence protocols in our study were optimized for detection of intense NK1 neurons, it is possible that some weakly labeled NK1 neurons in rats were below our detection limit. However, Kaneko et al. reported a very similar distribution of weakly labeled NK1 neurons in the cortex as we do, suggesting that they likely observed the same cell type.
Weakly labeled NK1 neurons share several characteristics with type II nNOS neurons. For example, both are concentrated in superficial layers (Freire et al., 2004; Cho et al., 2010) and co-express parvalbumin but not SST in rats (Vruwink et al., 2001; Kubota et al., 2011). Like the single-labeled NK1 neurons in our study, type II nNOS neurons have a neurogliaform-like morphology in primates (Smiley et al., 2000). However, squirrel monkey type II nNOS neurons are distributed throughout all cortical laminae with highest abundance in layers II/III (Franca et al., 1997; Wiencken and Casagrande, 2000). In contrast, we found the single-labeled NK1 neurons to be concentrated in deep gray matter. Kubota et al. (2011) found a small number of supragranular NK1 neurons in rats that did not co-label for SST, and thus probably correspond to the same cell type. However, Kubota et al. did not report whether these cells were nNOS positive. Taken together, these results suggest that the weakly labeled NK1 neurons and type II nNOS neurons could be overlapping populations in rats and monkeys. More work will be needed to test this possibility.
Rats and primates used for histology in this study were young adults (sexual maturity develops around six weeks and three years, respectively), whereas mice were around onset of sexual maturity. Although maturation of type I nNOS neurons appears to precede sexual maturity in rodents (Chung et al., 2004; Eto et al., 2010), no such data are available for weakly labeled cortical NK1 neurons. Ontogenetic studies will be needed to evaluate if differences in cortical maturation contributed to the differences in distribution of weakly labeled NK1 neurons reported here.
In vitro Recordings
In both species investigated, bath application of SP elicited TTX-insensitive depolarization of SP-responsive neurons. These observations are in agreement with the finding that NK1 agonists elicit action potentials in putative interneurons and increase the frequency of inhibitory postsynaptic currents in principal neurons in the rat entorhinal cortex (Stacey et al., 2002). The depolarization in response to SP that we observed lasted several minutes, similar to findings in other electrophysiological studies using NK1 agonists (Dreifuss and Raggenbass, 1986; Maubach et al., 1998; Zaninetti and Raggenbass, 2000; Ito et al., 2002; Bailey et al., 2004; Blomeley and Bracci, 2008; Morozova et al., 2008; Paul and Cox, 2010). Determination of the type of channels involved in the reported neuronal activation was beyond the scope of the present study.
Our findings that SP-responsive neurons have a higher resting membrane potential, a higher input resistance, and a longer time constant than other NPY neurons suggest the possibility of a specialized function of this population. This difference is underlined by the finding that electrical properties of mouse NK1+ neurons were more similar to rat NK1+ neurons than to mouse NK1− neurons. A detailed comparison of morphology and membrane protein composition might shed light on the source of this significant difference.
The virtually complete overlap of nNOS and NK1 expression in mice implies that the neurons recorded in vitro were type I nNOS neurons. Labeling with TMR-SP in live tissue was reliable but faint, requiring exposure times of several seconds in order to obtain a clear picture with our fluorescent camera; this probably caused a detection bias toward more intensely labeled cells. In the rat, the characteristic weak immunolabeling for NK1 in the single-labeled NK1 neurons suggests that these cells express less receptor and likely show even fainter labeling with TMR-SP, making them unlikely to be detected. For the same reasons we do not expect to have detected binding to the low-affinity SP receptors NK2 and NK3, which are also present in the cortex (Mileusnic et al., 1999; Saffroy et al., 2003; Duarte et al., 2006). Therefore, we assume that most, if not all, cells that we recorded in rats were of the type that showed intense NK1 immunolabeling and thus were likely type I nNOS neurons.
The large variation in the response to SP that hindered the elaboration of a dose response curve likely reflects variability within the population of intense NK1 neurons rather than between intense ones and weak ones. This conclusion is consistent with the previously described heterogeneity of expression of calcium binding proteins among type I nNOS neurons (Pasumarthi et al., 2010, and references therein). It is currently unclear whether this heterogeneity reflects a further functional subdivision of type I nNOS neurons or rather differences in neuronal states. A larger number of recordings are needed to address this question and will be the subject of a subsequent study.
Source of Cortical SP
Despite the direct effects of SP on NK1 neurons described here, there is a spatial mismatch between the NK1 receptor and SPergic axon terminals in the cortex (Liu et al., 1994; Vruwink et al., 2001; Wolansky et al., 2007). Cortical SPergic neurons are GABAergic and about 70% of this population co-express Parvalbumin in the rat (Kaneko et al., 1998; Vruwink et al., 2001). These neurons also co-express the NO receptor soluble guanylyl cyclase (Vruwink et al., 2001). Therefore, it was suggested that SPergic neurons release SP as a volume transmitter and are, in turn, modulated by NO released from the NK1/nNOS neurons, forming a non-synaptic cortical feedback loop (Vruwink et al., 2001). However, SPergic afferents to the cortex have also been found to originate from the laterodorsal tegmental nucleus (Vincent et al., 1983) and it cannot be excluded that other subcortical sources exist (see Wolansky et al., 2007). Furthermore, NK1 is the preferred receptor not only for SP, but also for the more recently discovered tachykinins hemokinin-1 and endokinin A and B (Page, 2004). The ligands neurokinin A and B can also activate the NK1 receptor, although with lower affinity (Ingi et al., 1991). Clearly, more work is needed to identify the source of NK1 activation of cortical nNOS neurons in vivo.
Physiological Function
Type I nNOS neurons are sleep-active in mice, rats, and hamsters (Gerashchenko et al., 2008; Pasumarthi et al., 2010). This unusual activation pattern has not yet been tested in primates. However, the similar dendritic and axonal morphology of these neurons in rodents (Tomioka et al., 2005), cats (Higo et al., 2007, 2009), and primates (Tomioka and Rockland, 2007) and the conserved co-expression of NPY and SST (Smiley et al., 2000; Kubota et al., 2011), as well as NK1 receptors (shown in this study), suggest that this neuronal population has a conserved function in mammals. The similar electrophysiological properties we found in mice and rats support this notion.
The potential involvement of SP in sleep regulation has been little studied to date. Local injection of SP into the ventrolateral preoptic area (VLPO) facilitated sleep in mice (Zhang et al., 2004). In contrast, intracerebroventricular SP injections disturbed sleep in mice (Andersen et al., 2006) and intravenous injection disturbed sleep in humans (Lieb et al., 2002). These results indicate that wake-promoting neurons in one or more subcortical areas expressing NK1 (Nakaya et al., 1994) such as the locus coeruleus, the dorsal raphe nucleus, or the cholinergic basal forebrain (Hahn and Bannon, 1999; Chen et al., 2001; Lacoste et al., 2006) override activation of sleep-promoting neurons in the VLPO (and possibly cortex) after systemic injection. SP depolarizes noradrenergic neurons of the locus coeruleus in vitro (Cheeseman et al., 1983) and increased SP levels in this nucleus have been linked to increased release of noradrenaline in the prefrontal cortex of rats (Ebner and Singewald, 2007). SP has been reported to excite (Liu et al., 2002) or inhibit (Valentino et al., 2003) dorsal raphe neurons, and to increase (Gradin et al., 1992) or decrease (Guiard et al., 2007) serotonin release. This was suggested to reflect region dependence of SP effects within the nucleus (Valentino et al., 2003; Guiard et al., 2007). A sleep-disturbing effect of systemic applications of SP is also in agreement with reports that such application induces stress and fear responses (reviewed in Ebner and Singewald, 2006).
NK1 desensitizes upon prolonged stimulation with SP and resensitization takes about 30 min in neurons (McConalogue et al., 1998). Given the long timescale of NK1 desensitization and our finding that the activating effects of a brief exposure to SP can persist for several minutes, the cortical SP/NK1 system would be suitable to regulate slow aspects of sleep/wake regulation, such as the buildup or decay of sleep need. This idea is supported by the finding that cortical mRNA levels of the gene encoding SP are upregulated by sleep deprivation in mice (Martinowich et al., 2011).
Potential Relevance for Pathologies
Given the presumed ability of nNOS/NK1 neurons to elicit widespread cortical inhibition by long range axons and release of the volume transmitter NO (Kilduff et al., 2011; also see Shlosberg et al., 2012), it is conceivable that an imbalance in their regulation could lead to imbalance in overall cortical excitability. In agreement with that view, NK1 agonists exerted a powerful antiepileptic effect in a slice preparation of the entorhinal cortex (Maubach et al., 1998). Alterations in the gene coding for NK1 have been linked to attention deficit hyperactivity disorder in humans (Yan et al., 2010). Pharmacological or genetic disruption of NK1 also induces hyperactivity in mice (Herpfer et al., 2005; Yan et al., 2010); reduced activation of cortical nNOS neurons could contribute to that phenotype. Depressed patients, on the other hand, show increased levels of SP in the cerebrospinal fluid (Geracioti et al., 2006). NK1 levels in the orbitofrontal cortex of depressed patients are decreased (Stockmeier et al., 2002), which might be a compensatory response to increased levels of SP. Similarly, frontal cortical SP levels are increased in different animal models of depression (Husum et al., 2001; Roche et al., 2012). Abnormally high cortical SP levels might be linked to a depressive phenotype by excitation of inhibitory cortical nNOS neurons.
Conclusion
Cortical type I nNOS neurons in all three species investigated showed an almost complete co-expression of the NK1 receptor. SP application elicited a direct and persistent activation of putative nNOS neurons in vitro. Cortical release of SP may be involved in aspects of sleep/wake regulation mediated by sleep-active type I nNOS neurons. Type I nNOS neurons might also be involved in mediating psychopathologies of SP/NK1 imbalances, such as attention deficit hyperactivity disorder or depression.
Conflict of Interest Statement
The authors declare that the research was conducted in the absence of any commercial or financial relationships that could be construed as a potential conflict of interest.
Acknowledgments
The project described was supported by Award Number R01HL059658 from the National Heart, Lung, and Blood Institute and R01NS59910 from the National Institute of Neurological Disorders and Stroke. The content is solely the responsibility of the authors and does not necessarily represent the official views of the National Heart, Lung, and Blood Institute, the National Institute of Neurological Disorders and Stroke, or the National Institutes of Health. This research was supported by funds provided by The Regents of the University of California, Tobacco-related Disease Research Program, Grant Number 17RT-0119A. The opinions, findings, and conclusion herein are those of the author and not necessarily represent The Regents of the University of California, or any of its programs. This research was also supported by Deutsche Forschungsgemeinschaft fellowship DI 1718/1-1 to Lars Dittrich. We thank Prof. R. Shigemoto for the generous gift of NK1 antibody and Dr. Michael Schwartz for helpful comments on the manuscript.
References
Andersen, M. L., Nascimento, D. C., Machado, R. B., Roizenblatt, S., Moldofsky, H., and Tufik, S. (2006). Sleep disturbance induced by substance P in mice. Behav. Brain Res. 167, 212–218.
Aoki, C., Fenstemaker, S., Lubin, M., and Go, C. G. (1993). Nitric oxide synthase in the visual cortex of monocular monkeys as revealed by light and electron microscopic immunocytochemistry. Brain Res. 620, 97–113.
Bailey, C. P., Maubach, K. A., and Jones, R. S. (2004). Neurokinin-1 receptors in the rat nucleus tractus solitarius: pre- and postsynaptic modulation of glutamate and GABA release. Neuroscience 127, 467–479.
Blomeley, C., and Bracci, E. (2008). Substance P depolarizes striatal projection neurons and facilitates their glutamatergic inputs. J. Physiol. 586, 2143–2155.
Cheeseman, H. J., Pinnock, R. D., and Henderson, G. (1983). Substance P excitation of rat locus coeruleus neurones. Eur. J. Pharmacol. 94, 93–99.
Chen, L. W., Wei, L. C., Liu, H. L., Qiu, Y., and Chan, Y. S. (2001). Cholinergic neurons expressing substance P receptor (NK1) in the basal forebrain of the rat: a double immunocytochemical study. Brain Res. 904, 161–166.
Cho, K. H., Jang, J. H., Jang, H. J., Kim, M. J., Yoon, S. H., Fukuda, T., Tennigkeit, F., Singer, W., and Rhie, D. J. (2010). Subtype-specific dendritic Ca(2+) dynamics of inhibitory interneurons in the rat visual cortex. J. Neurophysiol. 104, 840–853.
Chung, Y. H., Joo, K. M., Lee, Y. J., Shin, D. H., and Cha, C. I. (2004). Postnatal development and age-related changes in the distribution of nitric oxide synthase-immunoreactive neurons in the visual system of rats. Neurosci. Lett. 360, 1–4.
Commons, K. G. (2010). Neuronal pathways linking substance P to drug addiction and stress. Brain Res. 1314, 175–182.
Dreifuss, J. J., and Raggenbass, M. (1986). Tachykinins and bombesin excite non-pyramidal neurones in rat hippocampus. J. Physiol. 379, 417–428.
Duarte, C. R., Schutz, B., and Zimmer, A. (2006). Incongruent pattern of neurokinin B expression in rat and mouse brains. Cell Tissue Res. 323, 43–51.
Ebner, K., and Singewald, N. (2006). The role of substance P in stress and anxiety responses. Amino Acids 31, 251–272.
Ebner, K., and Singewald, N. (2007). Stress-induced release of substance P in the locus coeruleus modulates cortical noradrenaline release. Naunyn Schmiedebergs Arch. Pharmacol. 376, 73–82.
Eliasson, M. J., Blackshaw, S., Schell, M. J., and Snyder, S. H. (1997). Neuronal nitric oxide synthase alternatively spliced forms: prominent functional localizations in the brain. Proc. Natl. Acad. Sci. U.S.A. 94, 3396–3401.
Emmers, R., and Akert, K. (1963). A Stereotaxic Atlas of the Brain of the Squirrel Monkey (Saimiri Sciureus). Madison, WI: University of Wisconsin Press.
Espada, J., Juarranz, A., Galaz, S., Canete, M., Villanueva, A., Pacheco, M., and Stockert, J. C. (2005). Non-aqueous permanent mounting for immunofluorescence microscopy. Histochem. Cell Biol. 123, 329–334.
Eto, R., Abe, M., Kimoto, H., Imaoka, E., Kato, H., Kasahara, J., and Araki, T. (2010). Alterations of interneurons in the striatum and frontal cortex of mice during postnatal development. Int. J. Dev. Neurosci. 28, 359–370.
Franca, J. G., Do-Nascimento, J. L., Picanco-Diniz, C. W., Quaresma, J. A., and Silva, A. L. (1997). NADPH-diaphorase activity in area 17 of the squirrel monkey visual cortex: neuropil pattern, cell morphology and laminar distribution. Braz. J. Med. Biol. Res. 30, 1093–1105.
Freire, M. A., Franca, J. G., Picanco-Diniz, C. W., and Pereira, A. Jr. (2005). Neuropil reactivity, distribution and morphology of NADPH diaphorase type I neurons in the barrel cortex of the adult mouse. J. Chem. Neuroanat. 30, 71–81.
Freire, M. A., Gomes-Leal, W., Carvalho, W. A., Guimaraes, J. S., Franca, J. G., Picanco-Diniz, C. W., and Pereira, A. Jr. (2004). A morphometric study of the progressive changes on NADPH diaphorase activity in the developing rat's barrel field. Neurosci. Res. 50, 55–66.
Geracioti, T. D. Jr. Carpenter, L. L., Owens, M. J., Baker, D. G., Ekhator, N. N., Horn, P. S., Strawn, J. R., Sanacora, G., Kinkead, B., Price, L. H., and Nemeroff, C. B. (2006). Elevated cerebrospinal fluid substance p concentrations in posttraumatic stress disorder and major depression. Am. J. Psychiatry 163, 637–643.
Gerashchenko, D., Wisor, J. P., Burns, D., Reh, R. K., Shiromani, P. J., Sakurai, T., de la Iglesia, H. O., and Kilduff, T. S. (2008). Identification of a population of sleep-active cerebral cortex neurons. Proc. Natl. Acad. Sci. U.S.A. 105, 10227–10232.
Gradin, K., Qadri, F., Nomikos, G. G., Hillegaart, V., and Svensson, T. H. (1992). Substance P injection into the dorsal raphe increases blood pressure and serotonin release in hippocampus of conscious rats. Eur. J. Pharmacol. 218, 363–367.
Guiard, B. P., Guilloux, J. P., Reperant, C., Hunt, S. P., Toth, M., and Gardier, A. M. (2007). Substance P neurokinin 1 receptor activation within the dorsal raphe nucleus controls serotonin release in the mouse frontal cortex. Mol. Pharmacol. 72, 1411–1418.
Hahn, M. K., and Bannon, M. J. (1999). Stress-induced C-fos expression in the rat locus coeruleus is dependent on neurokinin 1 receptor activation. Neuroscience 94, 1183–1188.
Herpfer, I., Hunt, S. P., and Stanford, S. C. (2005). A comparison of neurokinin 1 receptor knock-out (NK1−/−) and wildtype mice: exploratory behaviour and extracellular noradrenaline concentration in the cerebral cortex of anaesthetised subjects. Neuropharmacology 48, 706–719.
Higo, S., Akashi, K., Sakimura, K., and Tamamaki, N. (2009). Subtypes of GABAergic neurons project axons in the neocortex. Front. Neuroanat. 3:25. doi: 10.3389/neuro.05.025.2009
Higo, S., Udaka, N., and Tamamaki, N. (2007). Long-range GABAergic projection neurons in the cat neocortex. J. Comp. Neurol. 503, 421–431.
Hill, R. (2000). NK1 (substance P) receptor antagonists–why are they not analgesic in humans? Trends Pharmacol. Sci. 21, 244–246.
Husum, H., Vasquez, P. A., and Mathe, A. A. (2001). Changed concentrations of tachykinins and neuropeptide Y in brain of a rat model of depression: lithium treatment normalizes tachykinins. Neuropsychopharmacology 24, 183–191.
Ingi, T., Kitajima, Y., Minamitake, Y., and Nakanishi, S. (1991). Characterization of ligand-binding properties and selectivities of three rat tachykinin receptors by transfection and functional expression of their cloned cDNAs in mammalian cells. J. Pharmacol. Exp. Ther. 259, 968–975.
Ito, K., Rome, C., Bouleau, Y., and Dulon, D. (2002). Substance P mobilizes intracellular calcium and activates a nonselective cation conductance in rat spiral ganglion neurons. Eur. J. Neurosci. 16, 2095–2102.
Jafri, M. S., and Weinreich, D. (1996). Substance P hyperpolarizes vagal sensory neurones of the ferret. J. Physiol. 493(Pt 1), 157–166.
Kaneko, T., Murashima, M., Lee, T., and Mizuno, N. (1998). Characterization of neocortical non-pyramidal neurons expressing preprotachykinins A and B: a double immunofluorescence study in the rat. Neuroscience 86, 765–781.
Kaneko, T., Shigemoto, R., Nakanishi, S., and Mizuno, N. (1994). Morphological and chemical characteristics of substance P receptor-immunoreactive neurons in the rat neocortex. Neuroscience 60, 199–211.
Kilduff, T. S., Cauli, B., and Gerashchenko, D. (2011). Activation of cortical interneurons during sleep: an anatomical link to homeostatic sleep regulation? Trends Neurosci. 34, 10–19.
Kubota, Y., Shigematsu, N., Karube, F., Sekigawa, A., Kato, S., Yamaguchi, N., Hirai, Y., Morishima, M., and Kawaguchi, Y. (2011). Selective coexpression of multiple chemical markers defines discrete populations of neocortical GABAergic neurons. Cereb. Cortex 21, 1803–1817.
Labrakakis, C., and MacDermott, A. B. (2003). Neurokinin receptor 1-expressing spinal cord neurons in lamina I and III/IV of postnatal rats receive inputs from capsaicin sensitive fibers. Neurosci. Lett. 352, 121–124.
Lacoste, B., Riad, M., and Descarries, L. (2006). Immunocytochemical evidence for the existence of substance P receptor (NK1) in serotonin neurons of rat and mouse dorsal raphe nucleus. Eur. J. Neurosci. 23, 2947–2958.
Lee, J. E., and Jeon, C. J. (2005). Immunocytochemical localization of nitric oxide synthase-containing neurons in mouse and rabbit visual cortex and co-localization with calcium-binding proteins. Mol. Cells 19, 408–417.
Lieb, K., Ahlvers, K., Dancker, K., Strohbusch, S., Reincke, M., Feige, B., Berger, M., Riemann, D., and Voderholzer, U. (2002). Effects of the neuropeptide substance P on sleep, mood, and neuroendocrine measures in healthy young men. Neuropsychopharmacology 27, 1041–1049.
Liu, H., Brown, J. L., Jasmin, L., Maggio, J. E., Vigna, S. R., Mantyh, P. W., and Basbaum, A. I. (1994). Synaptic relationship between substance P and the substance P receptor: light and electron microscopic characterization of the mismatch between neuropeptides and their receptors. Proc. Natl. Acad. Sci. U.S.A. 91, 1009–1013.
Liu, R., Ding, Y., and Aghajanian, G. K. (2002). Neurokinins activate local glutamatergic inputs to serotonergic neurons of the dorsal raphe nucleus. Neuropsychopharmacology 27, 329–340.
Lüth, H. J., Hedlich, A., Hilbig, H., Winkelmann, E., and Mayer, B. (1994). Morphological analyses of NADPH-diaphorase/nitric oxide synthase positive structures in human visual cortex. J. Neurocytol. 23, 770–782.
Mardsen, P., Newton, D., and Tsui, A. (2011). Alternative processing: neuronal nitric oxide synthase. eLS [Online]. Available: http://www.els.net/WileyCDA/ElsArticle/refId-a0005040.html
Martinowich, K., Schloesser, R. J., Jimenez, D. V., Weinberger, D. R., and Lu, B. (2011). Activity-dependent brain-derived neurotrophic factor expression regulates cortistatin-interneurons and sleep behavior. Mol. Brain 4, 11.
Maubach, K. A., Cody, C., and Jones, R. S. (1998). Tachykinins may modify spontaneous epileptiform activity in the rat entorhinal cortex in vitro by activating GABAergic inhibition. Neuroscience 83, 1047–1062.
McConalogue, K., Corvera, C. U., Gamp, P. D., Grady, E. F., and Bunnett, N. W. (1998). Desensitization of the neurokinin-1 receptor (NK1-R) in neurons: effects of substance P on the distribution of NK1-R, Galphaq/11, G-protein receptor kinase-2/3, and beta-arrestin-1/2. Mol. Biol. Cell 9, 2305–2324.
Mileusnic, D., Lee, J. M., Magnuson, D. J., Hejna, M. J., Krause, J. E., Lorens, J. B., and Lorens, S. A. (1999). Neurokinin-3 receptor distribution in rat and human brain: an immunohistochemical study. Neuroscience 89, 1269–1290.
Morozova, E., Wu, M., Dumalska, I., and Alreja, M. (2008). Neurokinins robustly activate the majority of septohippocampal cholinergic neurons. Eur. J. Neurosci. 27, 114–122.
Nakaya, Y., Kaneko, T., Shigemoto, R., Nakanishi, S., and Mizuno, N. (1994). Immunohistochemical localization of substance P receptor in the central nervous system of the adult rat. J. Comp. Neurol. 347, 249–274.
Nishino, S., and Fujiki, N. (2007). Neuropeptides as possible targets in sleep disorders. Expert Opin. Ther. Targets 11, 37–59.
Pagliardini, S., Adachi, T., Ren, J., Funk, G. D., and Greer, J. J. (2005). Fluorescent tagging of rhythmically active respiratory neurons within the pre-Botzinger complex of rat medullary slice preparations. J. Neurosci. 25, 2591–2596.
Pasumarthi, R. K., Gerashchenko, D., and Kilduff, T. S. (2010). Further characterization of sleep-active neuronal nitric oxide synthase neurons in the mouse brain. Neuroscience 169, 149–157.
Paul, K., and Cox, C. L. (2010). Excitatory actions of substance P in the rat lateral posterior nucleus. Eur. J. Neurosci. 31, 1–13.
Paxinos, G., and Franklin, K. (2001). The Mouse Brain in Stereotaxic Coordinates. San Diego, CA: Academic Press.
Paxinos, G., and Watson, C. (2007). The Rat Brain in Stereotaxic Coordinates. Amsterdam: Elsevier Academic Press.
Pereira, A. Jr. Freire, M. A., Bahia, C. P., Franca, J. G., and Picanco-Diniz, C. W. (2000). The barrel field of the adult mouse SmI cortex as revealed by NADPH-diaphorase histochemistry. Neuroreport 11, 1889–1892.
Roche, M., Kerr, D. M., Hunt, S. P., and Kelly, J. P. (2012). Neurokinin-1 receptor deletion modulates behavioural and neurochemical alterations in an animal model of depression. Behav. Brain Res. 228, 91–98.
Saffroy, M., Torrens, Y., Glowinski, J., and Beaujouan, J. C. (2003). Autoradiographic distribution of tachykinin NK2 binding sites in the rat brain: comparison with NK1 and NK3 binding sites. Neuroscience 116, 761–773.
Shlosberg, D., Buskila, Y., Abu-Ghanem, Y., and Amitai, Y. (2012). Spatiotemporal alterations of cortical network activity by selective loss of NOS-expressing interneurons. Front. Neural Circuits 6:3. doi: 10.3389/fncir.2012.00003
Smiley, J. F., Mcginnis, J. P., and Javitt, D. C. (2000). Nitric oxide synthase interneurons in the monkey cerebral cortex are subsets of the somatostatin, neuropeptide Y, and calbindin cells. Brain Res. 863, 205–212.
Stacey, A. E., Woodhall, G. L., and Jones, R. S. (2002). Activation of neurokinin-1 receptors promotes GABA release at synapses in the rat entorhinal cortex. Neuroscience 115, 575–586.
Stockmeier, C. A., Shi, X., Konick, L., Overholser, J. C., Jurjus, G., Meltzer, H. Y., Friedman, L., Blier, P., and Rajkowska, G. (2002). Neurokinin-1 receptors are decreased in major depressive disorder. Neuroreport 13, 1223–1227.
Tomioka, R., Okamoto, K., Furuta, T., Fujiyama, F., Iwasato, T., Yanagawa, Y., Obata, K., Kaneko, T., and Tamamaki, N. (2005). Demonstration of long-range GABAergic connections distributed throughout the mouse neocortex. Eur. J. Neurosci. 21, 1587–1600.
Tomioka, R., and Rockland, K. S. (2007). Long-distance corticocortical GABAergic neurons in the adult monkey white and gray matter. J. Comp. Neurol. 505, 526–538.
Torsney, C., and MacDermott, A. B. (2006). Disinhibition opens the gate to pathological pain signaling in superficial neurokinin 1 receptor-expressing neurons in rat spinal cord. J. Neurosci. 26, 1833–1843.
Valentino, R. J., Bey, V., Pernar, L., and Commons, K. G. (2003). Substance P Acts through local circuits within the rat dorsal raphe nucleus to alter serotonergic neuronal activity. J. Neurosci. 23, 7155–7159.
van den Pol, A. N., Yao, Y., Fu, L. Y., Foo, K., Huang, H., Coppari, R., Lowell, B. B., and Broberger, C. (2009). Neuromedin B and gastrin-releasing peptide excite arcuate nucleus neuropeptide Y neurons in a novel transgenic mouse expressing strong Renilla green fluorescent protein in NPY neurons. J. Neurosci. 29, 4622–4639.
Vincent, S. R., Satoh, K., Armstrong, D. M., and Fibiger, H. C. (1983). Substance P in the ascending cholinergic reticular system. Nature 306, 688–691.
Vruwink, M., Schmidt, H. H., Weinberg, R. J., and Burette, A. (2001). Substance P and nitric oxide signaling in cerebral cortex: anatomical evidence for reciprocal signaling between two classes of interneurons. J. Comp. Neurol. 441, 288–301.
Wiencken, A. E., and Casagrande, V. A. (2000). The distribution of NADPH diaphorase and nitric oxide synthetase (NOS) in relation to the functional compartments of areas V1 and V2 of primate visual cortex. Cereb. Cortex 10, 499–511.
Wolansky, T., Pagliardini, S., Greer, J. J., and Dickson, C. T. (2007). Immunohistochemical characterization of substance P receptor (NK1R)-expressing interneurons in the entorhinal cortex. J. Comp. Neurol. 502, 427–441.
Yan, T. C., McQuillin, A., Thapar, A., Asherson, P., Hunt, S. P., Stanford, S. C., and Gurling, H. (2010). NK1 (TACR1) receptor gene ‘knockout’ mouse phenotype predicts genetic association with ADHD. J. Psychopharmacol. 24, 27–38.
Yousef, T., Neubacher, U., Eysel, U. T., and Volgushev, M. (2004). Nitric oxide synthase in rat visual cortex: an immunohistochemical study. Brain Res. Brain Res. Protoc. 13, 57–67.
Zaninetti, M., and Raggenbass, M. (2000). Oxytocin receptor agonists enhance inhibitory synaptic transmission in the rat hippocampus by activating interneurons in stratum pyramidale. Eur. J. Neurosci. 12, 3975–3984.
Keywords: nitric oxide, NOS-1, bNOS, sleep homeostasis, cerebral cortex, neurogliaform, tac1, tac1r
Citation: Dittrich L, Heiss JE, Warrier DR, Perez XA, Quik M and Kilduff TS (2012) Cortical nNOS neurons co-express the NK1 receptor and are depolarized by Substance P in multiple mammalian species. Front. Neural Circuits 6:31. doi: 10.3389/fncir.2012.00031
Received: 28 March 2012; Paper pending published: 10 April 2012;
Accepted: 06 May 2012; Published online: 05 June 2012.
Edited by:
Bruno Cauli, Université Pierre et Marie Curie, FranceReviewed by:
Yoshiyuki Kubota, National Institute for Physiological Sciences, JapanThierry Gallopin, Ecole Supérieur de Physique et de Chimie Industrielle, France
Copyright: © 2012 Dittrich, Heiss, Warrier, Perez, Quik and Kilduff. This is an open-access article distributed under the terms of the Creative Commons Attribution Non Commercial License, which permits non-commercial use, distribution, and reproduction in other forums, provided the original authors and source are credited.
*Correspondence: Lars Dittrich, Biosciences Division, Center for Neuroscience, SRI International, 333 Ravenswood Avenue, LA 229, Menlo Park, CA 94025, USA. e-mail: lars.dittrich@sri.com
† These authors contributed equally to this work.