Center-surround vs. distance-independent lateral connectivity in the olfactory bulb
- Department of Neurobiology, Yale University School of Medicine, New Haven, CT, USA
Lateral neuronal interactions are known to play important roles in sensory information processing. A center-on surround-off local circuit arrangement has been shown to play a role in mediating contrast enhancement in the visual, auditory, and somatosensory systems. The lateral connectivity and the influence of those connections have been less clear for the olfactory system. A critical question is whether the synaptic connections between the primary projection neurons, mitral and tufted (M/T) cells, and their main inhibitory interneurons, the granule cells (GCs), can support a center-surround motif. Here, we study this question by injecting a “center” in the glomerular layer of the olfactory bulb (OB) with a marker of synaptic connectivity, the pseudorabies virus (PRV), then examines the distribution of labeling in the “surround” of GCs. We use a novel method to score the degree to which the data fits a center-surround model vs. distance-independent connectivity. Data from 22 injections show that M/T cells generally form lateral connections with GCs in patterns that lie between the two extremes.
Introduction
Lateral neuronal interactions are known to play important roles in sensory information processing. In vision, audition, and somatosensation, lateral interactions have been found to form a common circuit motif, the center-surround (Kuffler, 1953; Sur, 1980; DeVries and Baylor, 1993; Ma and Suga, 2004). In this motif, an activated projection neuron—the “center”—activates “surround” of inhibitory neighboring interneurons, which reduces the probability that other local projection neurons will produce action potentials. This center-on surround-off architecture is thought to mediate contrast enhancement or edge detection of sensory input.
In the olfactory system, olfactory receptor neurons (ORNs) are activated when volatile ligands bind to their receptors. The ORNs expressing a single OR sub-type converge onto single glomeruli, one in the medial and one in the lateral half of the olfactory bulb (OB) (Ressler et al., 1993; Vassar et al., 1993; Mombaerts et al., 1996). The segregation of ORN input to a single spatial location for each receptor creates a lamina of about 1000 glomerular units (in the rodent) in the medial and lateral glomerular layer (GL). The OB projection neurons, mitral and tufted (M/T) cells, normally innervate only a single glomerulus with an apical dendrite, where they receive the only known excitatory input from the ORNs. Inhibition of M/T cells occurs in the GL from periglomerular (PG) cells, and on the soma or lateral dendrites in the external plexiform layer (EPL) mediated by granule cells (GCs) (Shepherd et al., 2004). The M/T lateral dendrites can extend at least 1.5 mm in the EPL (Mori et al., 1983; Orona et al., 1984).
Mori and colleagues first found physiological evidence for center-surround processing, which they interpreted to arise from M/T interactions with GCs (Yokoi et al., 1995). Evidence from the Shipley group indicated that center-surround also can occur in the GL mediated by a short-axon cell type which sends axons 5–7 glomeruli laterally to synapse on PG cells (Aungst et al., 2003). Using trans synaptic tracing, we previously demonstrated that lateral connections of the M/T cells with GCs are sparse and distributed (Willhite et al., 2006; Kim et al., 2011). We proposed a model suggesting that lateral interactions in the OB are distance-independent as opposed to the center-surround model.
Here, we use pseudorabies, a retrograde specific virus which infects neurons and passes trans-synaptically in a retrograde specific manner, as a marker to map lateral connectivity in the medial aspect of the rat OB. Flat map reconstructions were made to view the distribution of connections as determined by fluorescence intensity in the GC layer. To quantify the extent to which the labeling fits a center-surround as opposed to distance-independent (or association network) circuit motif, we constructed a model for each data-set of an ideal center-surround and ideal distance independence. This model allows quantification of the degree to which the observed labeling fits a center-surround. Results show heterogeneous patterns that do not thoroughly fit either extreme.
Materials and Methods
Surgery
All of the animal use procedures in this study conformed to the Guide for the Care and Use of Laboratory Animals (1996, National Academy of Sciences) and were approved by the Yale Institutional Animal Care and Use Committee.
Pseudorabies virus (PRV) strains (Bartha) which express enhanced green fluorescent protein or mRFP1, PRV-152, and PRV-614 respectively, were obtained from Lynn Enquist and amplified using standard techniques. Twenty-two Sprague–Dawley rats age 6–8 weeks were used in this study. For a detailed protocol, please see Card and Enquist (1999). Briefly, rats were anaesthetized with 75 mg/kg ketamine and 5 mg/kg xylazine by intraperitoneal injection. PRV was injected at a titer of 1 × 10⁸ PFU/mL in phosphate buffered saline (PBS) along with red or green fluorescent microspheres to mark the injection site (Molecular Probes, Eugene, OR, USA). The injections were not stereotyped. 100 nL of PRV was injected using a Hamilton syringe (Fisher Scientific, Pittsburgh, PA, USA) with a 33-gauge needle into the indicated areas using a stereotaxic instrument (Stoelting, Wood Dale, IL, USA) at a rate of 20 nL/min, controlled by a Nano-Injector system (Stoelting, Wood Dale, IL, USA). After 15 min the syringe was removed.
Three days post-injection (70–74 h), the animals were anaesthetized using urethane overdose and then perfused transcardially with PBS followed by a 4% paraformaldehyde (PFA) solution in PBS. The brain was extracted and post-fixed in PFA overnight.
Tissue Preparation and Imaging
Free-floating sections (100 μm) were prepared on a Leica VT1200S vibrating microtome. Sections were wet mounted in Vecta-Shield mounting medium containing DAPI (Vector Laboratories, Burlingame, CA, USA), and imaged using a Leica DM5500 fluorescent. Images were manipulated for brightness and contrast, and cropped using Adobe Photoshop version 6.0.1 or Photoshop Elements version 2.0.2. Distance measures and volumes were not adjusted for shrinkage of samples due to tissue processing.
Map Constuction
Labeling intensity maps were constructed with OdorMap Builder (Liu et al., 2004). Each resulting pixel in the map represented roughly 100 × 100 × 25 μm of bulb tissue—each coronal section ~100 μm, with a segmented line 25 μm thick and discretized to ~100 μm steps along the segmented line.
Measure of Center-Surround
Data analysis was performed with custom Python scripts using the SAGE mathematics software system version 4.4.2. To compare across bulbs and provide a consistent measure of bulb connectivity, we performed the following techniques. First, we obtained the binary image mask of each 2D odor map, setting pixels as valid if they were within the outline of the odor map and not damaged by the injection. (Pixels that are invalid are not displayed, revealing the white background in our images.) We then centered maps by aligning the centroid of each mask. With each valid mask pixel set to one and invalid pixels set to zero, we summed the centered masks as another image. A mask template was made by choosing pixels of the summed image that were greater than the number of maps/2. This mask template, therefore, represented the average mask. We then scaled the image data of all odor maps to the dimensions of this mask template using “nearest neighbor” interpolation. This interpolation scheme repeats some values when stretching and ignores others when shrinking. The advantage of this interpolation scheme over other types that blend is that the original data sample values are unaltered with the tradeoff that some pixels are uniformly over- or under-represented. We had at most 12 rows and six columns to adjust with a mask template of 91 × 53 pixels, an alteration of up to 13% of the pixels.
We performed distance measures on these adjusted maps. We first defined an “optimal” center-surround from the pixel values obtained from each individual data-set. In this case, the observed pixel values should map such that the strongest connections are proximal to the injection site and progressively get weaker with distance. Therefore, we made an “optimal map” of each odor map by taking the pixel values in the observed map and sorting them by Euclidean distance to the injection site. This distance measure accounted for the conical properties of the bulb by replicating and adjoining each column of the image with itself. With this columnar wrapping, distance was calculated in 2D Cartesian space. We then defined the no center-surround case as a uniform distribution of connectivity such that the pixel values observed would have no relation to the injection site. To determine the proportion, β, of where the data fell between these two extremes, we set up the optimization problem as:
where E(Observed_map), is the expected value of the uniform distribution, the mean pixel value. Rewriting with E(Observed_map) = μ,
This linear regression was solved with the polyfit function in the Python numpy library.
Results
The patterns of M/T cell lateral connections to GCs were inferred using the PRV as a reporter. For all data presented, 100 nL PRV bearing genes coding for constitutive red or green fluorescent protein expression was injected into the medial OB GL. The animal was recovered, and then sacrificed approximately 72 h after injection. Coronal sections were prepared after fixation and dissection, and then imaged on a fluorescent microscope. The labeling patterns showed distributed columns evident in the GC layer, as reported previously.
A line was traced just deep to the internal plexiform layer using custom software which measures the pixel intensity along the traced line. Pixel intensity was color coded and each line stacked to produce a flat map of fluorescence intensity in the GC layer (Figure 1). Data was collected from 22 injections, positions are shown in Figure 2.
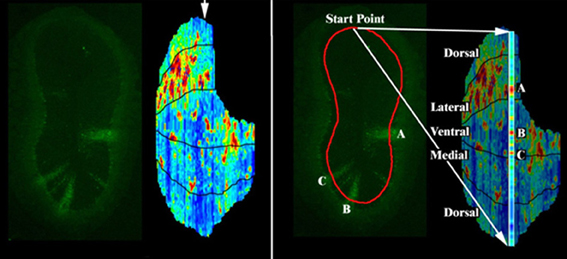
Figure 1. Fluorescence intensity reconstruction method. To create a map of the position of labeled areas, the equivalent of a Mercator projection is constructed by stacking the coronal sections (Liu et al., 2004). Left: a sample coronal section from a PRV labeled OB, and full reconstruction of the fluorescence intensity in the GC layer just deep to the internal plexiform layer (IPL). Arrow indicates the position of the displayed section. Right: to make the full reconstruction, a line is drawn through the GC layer deep to the IPL for each coronal section. Pixel intensities along this line are captured. Each of these colored sections is then computationally scaled and arranged according to their anatomical positions to map the pixel locations onto a 2D surface. The displayed section is expanded at right showing columns A, B, and C respectively.
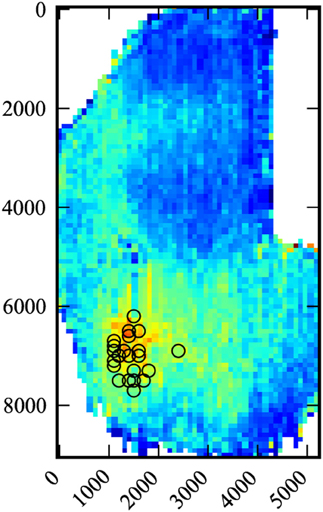
Figure 2. Composite data. Data for all 22 medial injections were compiled and scaled. Black circles indicate injection sites. Number scale is in microns.
We then created a method to determine the degree to which the labeling patterns fit a center-surround vs. a random model. The existing labeling intensities for a given data set were organized around the injection site in a pattern which would represent an “optimal” center-surround for that data (Figure 3). The data was then plotted with distance (in pixels) as the abscissa, and pixel intensity on the ordinate. A straight line at the mean pixel intensity therefore represents no relationship of pixel intensity to distance. The data is fit to a curve by regression analysis. No relationship is arbitrarily defined as 0, and the optimal center-surround defined as 1. This method yields a number which provides a quantification of the extent to which the data fits a center-surround model.
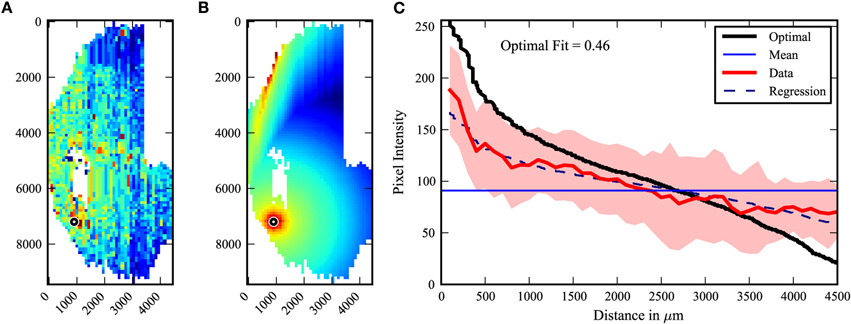
Figure 3. Center-surround quantification model. The degree to which the observed labeling pattern (A) fits a center-surround model was quantified by organizing the observed pixel values into an “optimal” center surround as shown in (B). (C) The pixel intensities of A and B are then plotted by distance from the injected site, with the mean and standard deviations of the observed data (A) indicated in red, and the optimal fit data (B) indicated in black. No relationship to distance is represented as the mean pixel intensity of the observed data (purple line). The regression (dotted line) of the experimental data allows comparison (for equations see Materials and Methods).
The center-surround quantification method was applied to the PRV tracing data-set. The extreme cases from the data are shown in Figure 4. The maximal fit to a center-surround was 0.71, while the minimal fit was 0.1. The injection site in the uncorrelated minimal fit data-set appears to be offset from the center of labeling. However, three researchers independently verified the raw data, confirming the result. It is an outlier, with the next lowest fit at 0.15, but there was no viable rationale to exclude the data. The pooled data (Figure 5) shows that on average, the center-surround fit is 0.35 with a standard deviation of 0.15.
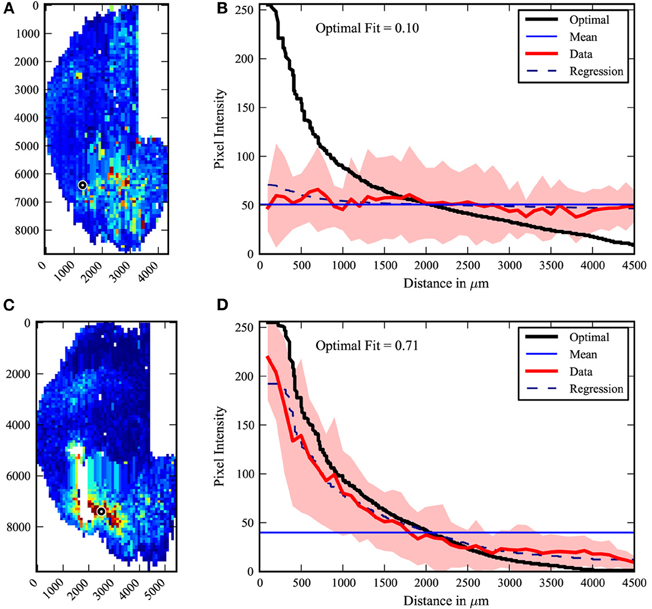
Figure 4. Center-surround extremes. The least (top A,B) and best (bottom C,D) fit of the 22 data maps to a center-surround model. Left (A,C): raw maps, right (B,D): graphic data. While the least fit is an outlier, it was independently confirmed by several researchers that the injection site (black circle) and labeling patterns are clear in the fixed sections. White areas indicate damaged tissue.
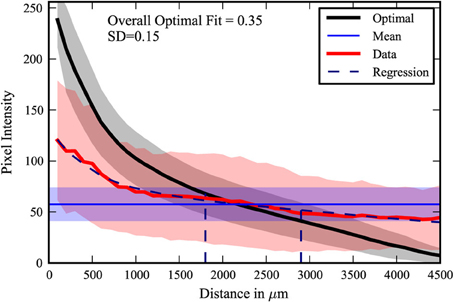
Figure 5. Composite plot. The 22 data-sets were compiled. The shading represents one standard deviation of pixel intensity from the average of the data (red), optimal (black), and mean (purple). The distances at which one standard deviation (68.2%) and two standard deviations (95.4%) of the data are contained are indicated by the dashed vertical lines.
Discussion
This study examines the synaptic connections of M/T cells in the medial GL from an injected “center” M/T population to GCs in a lateral “surround.” The marker used to infer synaptic connection is the PRV. While it is possible that cells distal to the injection site can be infected in the first-order population, previous work has shown that such uptake is not prevalent in the OB, and therefore cannot account for a significant amount of the labeling (Willhite et al., 2006; Kim et al., 2011). Further, PRV has been shown to be highly retrograde specific. Because the GCs have no axons, the only viable route to infect them is through the dendrodendritic synapse with the soma or lateral dendrites of the M/T cells. Because dendrodendritic connections are the only known synapses on M/T lateral dendrites (Price and Powell, 1970a,b; Hinds and Hinds, 1976a,b), this strongly suggests that PRV labeling is a reasonable indicator of lateral M/T connections.
The majority of labeling, found within one standard deviation (68.2%) is contained on average within 1800 microns. This figure is consistent with previous estimates of the length of lateral dendrites (Mori et al., 1983; Orona et al., 1984). However, significant labeling is found in the range of 1800–2900 microns from the injected site, or two standard deviations (95.4%). This suggests that lateral dendrites may extend further than previously estimated. A small fraction of the labeling is observed at even greater distances. While another cell type that spans large distances may be involved, we found no evidence of novel neuron labeling. The discrepancy may be a simple matter of the signal-to-noise limitations of the HRP staining used in previous studies, but further investigation and confirmation by functional or physiological studies is warranted.
GL PRV injections consistently produce patterns in the GrCL which are columnar and discontinuously distributed. These patterns predict that an analysis of synapse distributions along lateral dendrites will also reveal discontinuities. Lowe found no such discontinuities along the first 150 microns of lateral dendrites as indicated by serial GABA uncaging (Lowe, 2002). This short distance, however, only explores the area in which the most robust labeling is observed in our data.
We previously proposed a model in which lateral connections were made independently of distance (Willhite et al., 2006). This analysis of a larger data-set indicates that this model is only partly correct. There is a general tendency to form connections locally, but this tendency is not robust. This may reflect the domain organization of OB ligand class recognition, but also is consistent with recent evidence that such organization is weak. On average, our data indicate that the lateral connections in the OB fall on the center-surround side of a continuum, the other side of which may be thought of as an association network. In a system that senses spatially organized stimuli, such as the retina, center-on surround-off architecture can be used to perform contrast enhancement. In response to a fundamentally non-spatial stimulus, glomerular activation occurs at specific spatial locations in the OB. The partially distributed nature of lateral M/T cell connectivity identified in this study may enable a similar contrast enhancement to occur among co-active glomerular pairs which sometimes must act over long distances.
Conflict of Interest Statement
The authors declare that the research was conducted in the absence of any commercial or financial relationships that could be construed as a potential conflict of interest.
Acknowledgments
PRV strains were provided by Lynn Enquist, Princeton University as a service of the National Center for Experimental Neuroanatomy with Neurotropic Viruses: NCRR P40, RRO118604, and the National Science Foundation under agreement No. stocktickerIBN-9876754. This work was supported by NIH/NIDCD grants DC000086 and DC008874.
References
Aungst, J. L., Heyward, P. M., Puche, A. C., Karnup, S. V., Hayar, A., Szabo, G., and Shipley, M. T. (2003). Centre-surround inhibition among olfactory bulb glomeruli. Nature 426, 623–629.
Card, J. P., and Enquist, L. W. (1999). “Transneuronal circuit analysis with pseudorabies virus,” in Current Protocols in Neuroscience, ed J. N. Crawley (New York, NY: Wiley), 1.5.1–1.5.28.
DeVries, S. H., and Baylor, D. A. (1993). Synaptic circuitry of the retina and olfactory bulb. Cell 72(Suppl.), 139–149.
Hinds, J. W., and Hinds, P. L. (1976a). Synapse formation in the mouse olfactory bulb. I., quantitative studies. J. Comp. Neurol. 169, 15–40.
Hinds, J. W., and Hinds, P. L. (1976b). Synapse formation in the mouse olfactory bulb. II., morphogenesis. J. Comp. Neurol. 169, 41–61.
Kim, D. H., Phillips, M. E., Chang, A. Y., Patel, H. K., Nguyen, K. T., and Willhite, D. C. (2011). Lateral connectivity in the olfactory bulb is sparse and segregated. Front. Neural Circuits 5:5. doi: 10.3389/fncir.2011.00005
Kuffler, S. W. (1953). Discharge patterns and functional organization of mammalian retina. J. Neurophysiol. 16, 37–68.
Liu, N., Xu, F., Marenco, L., Hyder, F., Miller, P., and Shepherd, G. M. (2004). Informatics approaches to functional MRI odor mapping of the rodent olfactory bulb: OdorMapBuilder and OdorMapDB. Neuroinformatics 2, 3–18.
Lowe, G. (2002). Inhibition of backpropagating action potentials in mitral cell secondary dendrites. J. Neurophysiol. 88, 64–85.
Ma, X., and Suga, N. (2004). Lateral inhibition for center-surround reorganization of the frequency map of bat auditory cortex. J. Neurophysiol. 92, 3192–3199.
Mombaerts, P., Wang, F., Dulac, C., Chao, S. K., Nemes, A., Mendelsohn, M., Edmondson, J., and Axel, R. (1996). Visualizing an olfactory sensory map. Cell 87, 675–686.
Mori, K., Kishi, K., and Ojima, H. (1983). Distribution of dendrites of mitral, displaced mitral, tufted, and granule cells in the rabbit olfactory bulb. J. Comp. Neurol. 219, 339–355.
Orona, E., Rainer, E. C., and Scott, J. W. (1984). Dendritic and axonal organization of mitral and tufted cells in the rat olfactory bulb. J. Comp. Neurol. 226, 346–356.
Price, J. L., and Powell, T. P. (1970a). The mitral and short axon cells of the olfactory bulb. J. Cell Sci. 7, 631–651.
Price, J. L., and Powell, T. P. (1970b). The synaptology of the granule cells of the olfactory bulb. J. Cell Sci. 7, 125–155.
Ressler, K. J., Sullivan, S. L., and Buck, L. B. (1993). A zonal organization of odorant receptor gene expression in the olfactory epithelium. Cell 73, 597–609.
Shepherd, G. M., Chen, W. R., and Greer, C. A. (2004). “Olfactory bulb,” in The Synaptic Organization of the Brain, ed G. M. Shepherd (New York, NY: Oxford University Press), xiv, 719.
Sur, M. (1980). Receptive fields of neurons in areas 3b and 1 of somatosensory cortex in monkeys. Brain Res. 198, 465–471.
Vassar, R., Ngai, J., and Axel, R. (1993). Spatial segregation of odorant receptor expression in the mammalian olfactory epithelium. Cell 74, 309–318.
Willhite, D. C., Nguyen, K. T., Masurkar, A. V., Greer, C. A., Shepherd, G. M., and Chen, W. R. (2006). Viral tracing identifies distributed columnar organization in the olfactory bulb. Proc. Natl. Acad. Sci. U.S.A. 103, 12592–12597.
Keywords: lateral inhibition, center-surround, olfaction, olfactory bulb, connectivity
Citation: Kim DH, Chang AY, McTavish TS, Patel HK and Willhite DC (2012) Center-surround vs. distance-independent lateral connectivity in the olfactory bulb. Front. Neural Circuits 6:34. doi: 10.3389/fncir.2012.00034
Received: 03 February 2012; Accepted: 16 May 2012;
Published online: 31 May 2012.
Edited by:
Charles F. Stevens, The Salk Institute for Biological Studies, USAReviewed by:
Yuanquan Song, University of California, San Francisco, USARafael Yuste, Columbia University, USA
Copyright: © 2012 Kim, Chang, McTavish, Patel and Willhite. This is an open-access article distributed under the terms of the Creative Commons Attribution Non Commercial License, which permits non-commercial use, distribution, and reproduction in other forums, provided the original authors and source are credited.
*Correspondence: David C. Willhite, Department of Neurobiology, Yale University School of Medicine, P. O. Box 208001, New Haven, CT 06520-8001, USA. e-mail: dcwillhite@yahoo.com
† These authors contributed equally to this work.