Mechanisms and benefits of granule cell latency coding in the mouse olfactory bulb
- 1Center for Neuroscience, University of Pittsburgh, Pittsburgh, PA, USA
- 2Center for the Neural Basis of Cognition, Pittsburgh, PA, USA
- 3Department of Biology, Carnegie Mellon University, Pittsburgh, PA, USA
Inhibitory circuits are critical for shaping odor representations in the olfactory bulb. There, individual granule cells can respond to brief stimulation with extremely long (up to 1000 ms), input-specific latencies that are highly reliable. However, the mechanism and function of this long timescale activity remain unknown. We sought to elucidate the mechanism responsible for long-latency activity, and to understand the impact of widely distributed interneuron latencies on olfactory coding. We used a combination of electrophysiological, optical, and pharmacological techniques to show that long-latency inhibition is driven by late onset synaptic excitation to granule cells. This late excitation originates from tufted cells, which have intrinsic properties that favor longer latency spiking than mitral cells. Using computational modeling, we show that widely distributed interneuron latency increases the discriminability of similar stimuli. Thus, long-latency inhibition in the olfactory bulb requires a combination of circuit- and cellular-level mechanisms that function to improve stimulus representations.
Introduction
Temporal coding strategies are those in which the timing of action potentials (instead of, or in addition to mean firing rate) encodes information (Wellis et al., 1989; Laurent et al., 1996). The importance of temporal codes is a topic of intense interest and debate, yet only a few mechanisms for generating such codes have been proposed (Buonomano, 2000), and fewer have been identified physiologically (Margrie and Schaefer, 2003). Latency coding is a temporal coding scheme in which the delay (latency) between stimulus onset and first action potential encodes information. Evidence for latency coding has been obtained in many primary sensory areas including visual (Gawne et al., 1996; Gollisch and Meister, 2008), auditory (Heil and Irvine, 1996; Furukawa and Middlebrooks, 2002; Chechik et al., 2006), somatosensory (Panzeri et al., 2001; Petersen et al., 2002; Johansson and Birznieks, 2004), and olfactory areas (Brody and Hopfield, 2003; Balu et al., 2004; Kapoor and Urban, 2006; Spors et al., 2006; Schaefer and Margrie, 2007; Chen et al., 2009; Shusterman et al., 2011). Latency coding is computationally effective, enabling rapid stimulus identification (Thorpe and Gautrais, 1997), intensity invariance (Margrie and Schaefer, 2003), and processing of complex stimuli (Van Rullen et al., 1998).
Typical examples of latency coding involve small (<50 ms) latency differences across cells. A notable exception is the olfactory bulb, where odors evoke distinct spatiotemporal activity patterns (including long-latency spiking) that persist for many seconds (Luo and Katz, 2001; Chen et al., 2009; Junek et al., 2010). In this circuit, sensory neuron axons converge onto functionally segregated spheres of neuropil called glomeruli (Mombaerts et al., 1996), where they synapse onto dendrites of mitral and tufted cells. Each mitral and tufted cell receives input from a single glomerulus, and forms reciprocal synapses with inhibitory granule cells before projecting to higher-order cortical areas (Shepherd, 2004). Multiple cell types contribute to long timescale activity in the olfactory bulb including peripheral sensory inputs (Spors and Grinvald, 2002; Lin et al., 2006; Spors et al., 2006) as well as local circuits. Inhibitory granule cells respond to brief glomerular stimulation with widely distributed (0–1000 ms) yet reliable first spike latencies (Kapoor and Urban, 2006). This long-latency inhibition is mechanistically and functionally intriguing because the representations of olfactory stimuli change on long timescales (hundreds to thousands of milliseconds) (Friedrich and Laurent, 2001; Uchida and Mainen, 2003; Abraham et al., 2004, 2010; Rinberg et al., 2006) and inhibitory circuits (Stopfer et al., 1997; Nusser et al., 2001; Abraham et al., 2010) can be behaviorally important for certain olfactory tasks.
But how does long-latency inhibition arise and contribute to olfactory coding? Our results indicate that tufted cells play a pivotal role in controlling granule cell latency. Tufted cells' ability to fire at highly variable latencies (owing to intrinsic membrane properties) enables them to drive granule cell activity in a temporally precise, stimulus-specific manner. We show that the resultant distributed-latency inhibition decorrelates mitral cell firing patterns across stimuli. These results describe a straightforward mechanism that can generate long timescale activity and improve encoding, suggesting that long-latency inhibition may provide a computational advantage to olfactory physiology.
Materials and Methods
Slice Preparation
All procedures were done in accordance with the guidelines for the care and use of animals at Carnegie Mellon University and as previously described (Galan et al., 2006; Castro et al., 2007; Arevian et al., 2008). Male and female C57BL/6 mice (age P11–P18) were anesthetized using isofluorane. Anesthesia was monitored by responsiveness to tail pinch and animals were decapitated. Dissection and slicing were both performed in ice-cold Ringer's Solution (in mM: 125 NaCl, 25 glucose, 2.5 KCl, 25 NaHCO3, 1.25 NaH2PO4, 1 MgCl2, and 2.5 CaCl2.) Coronal slices (300–350 μm) were obtained from the olfactory bulb using a vibratome (VT1200S; Leica). Slices were placed in oxygenated Ringer solution at 37°C for 15 min and then allowed to recover for 30 min before being used for electrophysiology or imaging.
Glomerular Stimulation
A coiled formvar-insulated nichrome microwire or monopolar glass stimulating electrode was inserted into a glomerulus (identified as a spherical structure of neuropil surrounded by small cell bodies, located near the edge of the slice. A brief pulse (0.3–3 ms) was applied by connecting the stimulating electrode to an SIU (stimulus isolation unit) controlled by TTL (transistor-transistor logic) pulses from an ITC-18 data acquisition board. Stimulation amplitude was selected phenomenologically as the minimum amplitude that elicited low probability spiking or LLDs in granule cells.
Electrophysiology
Data were recorded using software written in Igor Pro (WaveMetrics) with a 700B amplifier (Molecular Devices) and ITC-18 data acquisition board (InstruTech). Whole-cell patch pipettes (1–3 MΩ) with internal solution (in mM: 130 potassium gluconate, 10 HEPES, 2 MgCl2, 2 MgATP, 2 Na2ATP, 0.3 GTP, and 4 NaCl) were used to make whole-cell recordings (as well as cell-attached recordings, when only spiking data was collected). All data was collected in the Ringer's Solution described above at 37°C. For Figure 4, tufted cells were recorded in the presence of 25 μM APV, 10 μM CNQX, 10 μM bicuculline, and (where noted) 20 μM 4-AP. Whole-cell current-clamp and voltage-clamp recordings were performed, as well as cell attached recordings. For experiments shown in Figure 3, 50 μl of the fluorescent tracer AlexaFluor 594 hydrazide (Invitrogen) was added to the internal solution to allow visualization of cell morphology and apical tuft location.
Fura-2 Loading
Olfactory bulb slices were transferred to a chamber containing 500 μl of Ringer's solution with 3 μl of 0.01% pluronic (Invitrogen) and 5 μl of a 1 mM solution of fura-2 AM (Invitrogen) in 100% DMSO solution. Slices were incubated in this solution at 37°C for 90 min while humidified air was passed above the liquid in the chamber to keep the solution oxygenated.
Imaging
After fura-2 loading, slices were placed in a submersion recording chamber under an upright microscope using 40 or 60× water immersion objectives. Images and movies were recorded at 75 ms per frame using a cooled back-illuminated frame transfer CCD camera (Cascade 512B; Princeton Instruments). Images were acquired and stored using software written in Igor Pro (WaveMetrics and SIDX, Bruxton Scientific). We recorded 1500 ms long movies of the granule cell layer during glomerular stimulation ± somatic stimulation of a single tufted cell.
Data Analysis
The rise time of prolonged depolarizations (Figure 1B) was calculated as the time at which the depolarization reached 50% of its maximum value. Decay time was identified as the time point at which the depolarization decayed to within 5% of baseline. For the spike latency data, trials were excluded if they had spikes preceding glomerular stimulation or latencies longer than 1000 ms, as these are likely spontaneous and not stimulus-evoked events. EPSCs times were identified using threshold crossings. We first subtracted the mean current trace averaged across trials to eliminate inward currents that did not have the shape or decay of EPSCs. Such currents were typical in the first several hundred milliseconds following stimulation (see Figure 2C) but do not represent the type of synaptic inputs that we are looking for. We quantified threshold crossings for both the voltage clamp data and the derivative of the current traces to ensure that events were of appropriate amplitude and time course to represent synaptic excitation. Since noisy fluctuations occurring in the first 100 ms following glomerular stimulation were insufficient to drive spiking, we selected conservative thresholds so that very noisy or very small events were excluded. EPSC onset was defined as the mean of the first two identifiable EPSC times in order to reduce the impact of errantly identified early noisy events. For comparisons of means, significance was determined using a t-test (Figure 4B). For comparisons of distributions, a Kolmogorov–Smirnov test was used (Figures 1E, 2D, 3A, 4B). A 0.05 significance level was used for all.
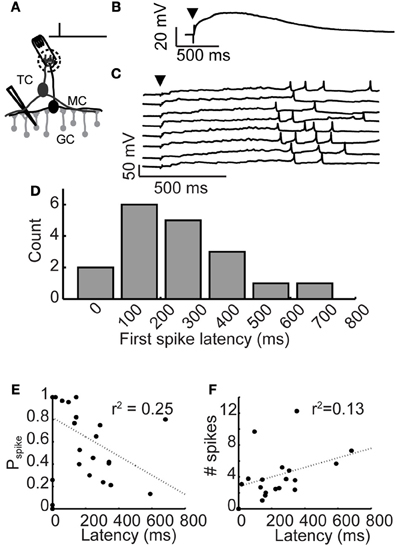
Figure 1. Long-latency granule cell activity. (A) Experimental setup: A brief, 300 μs stimulation pulse was applied via an extracellular stimulating electrode impaled into a glomerulus. Responses of inhibitory granule cells were recorded using patch clamp. (B) Average depolarization following glomerular stimulation. Arrowhead denotes stimulation time. (C) Example voltage traces from a granule cell following glomerular stimulation (arrowhead), eight trials shown. (D) Distribution of mean first spike latencies across granule cell population. (E) Relationship between granule cell first spike latency and spike probability. (F) Relationship between granule cell first spike latency and evoked rate.
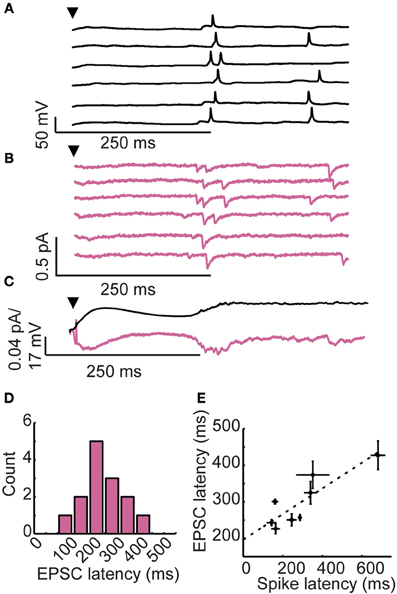
Figure 2. Long-latency granule cell activity is driven by late onset excitatory inputs. (A) Membrane voltage and (B) membrane currents of a single granule cell following brief glomerular stimulation (arrowhead). Six trials shown. (C) Membrane potential (upper) and somatic currents (lower) averaged across trials. (D) Distribution of EPSC onset across cells. (E) Correlation between first spike latency and EPSC latency across cells.
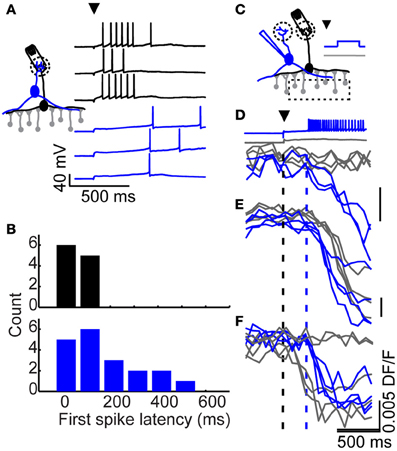
Figure 3. Long-latency excitation comes from tufted, but not mitral cells. (A) Example of a mitral cell (black) and tufted cell (blue) response to glomerular stimulation (arrowhead). (B) Distribution of first spike latencies following glomerular stimulation in mitral (black) and tufted cells (blue). (C) Optical imaging setup. A stimulating electrode was impaled into a glomerulus and a nearby (but not connected) tufted cell was patched. The glomerulus was stimulated on every trial, while the tufted cell was made to fire on every other trial. Responses from three granule cells (D–F) to glomerular stimulation with (blue) and without (gray) additional tufted cell input were monitored optically. Black dash denotes timing of glomerular stimulation, blue dash denotes onset of tufted cell activity for tufted stimulation trials (blue).
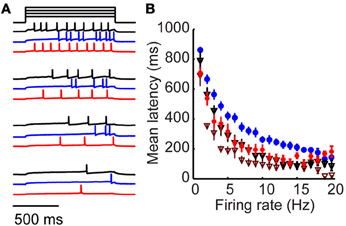
Figure 4. Long-latency activation is an intrinsic property specific to tufted cells. (A) Example mitral (black), tufted (blue) and tufted cell + 4-AP responses to four amplitudes of injected current. (B) Firing rate/latency relationship in response to somatic current injection across the population of mitral cells (black triangles) and tufted cells (blue). Red circles denote tufted cells in the presence of 20 μM 4-AP; maroon triangles denote mitral cells in the presence of 20 μM 4-AP. Bars indicate s.e.m.
Computational Model
All simulations were performed in Matlab using mex files to interface with C. The model consisted of 100 leaky integrate-and-fire (LIFs) neurons (simulated mitral cells) described by the following equation:
where τm is the membrane time constant (τm = 9.5 ± 0.5 ms). For all simulations, the time step Δt = 0.01 ms and a standard Euler integration scheme was used. The excitation delivered to model mitral cells (Istim) was set at a constant for each cell (Istim = 17 ± 1) on each trial. Noise currents (Inoise) were uncorrelated across cells and were generated as the sum of two 100 Hz Poisson trains convolved with a decay constant (τnoise = 3 ms). One train was made excitatory and the other one inhibitory by scaling them by 1 and −1, respectively. A direct current offset between 0 and 1 was then added to this noise. Leak current (Ileak) = gL (Vi(t)−VL), where (gL = 1) is the unitary leak current and (VL = 0) is the reversal potential of the leak term. When an excitatory cell was depolarized to threshold (Vthresh = −44.5 ± 0.5), a spike was identified and the membrane potential was reset to Vreset = −53.5 ± 0.5 for a refractory period of 6 ms.
Inhibitory synaptic currents (Iinhib) were generated by a population of 1000 interneurons (simulated granule cells). We generated a template of population spiking using a 2 Hz Poisson rate for each interneuron. We then used this template to generate interneuron spikes based on the specified range of interneuron latencies. We assigned each cell a stimulus-specific latency ranging from 0 to 200 ms (in the most narrowly distributed model) from 0 to 1000 ms (in the most widely distributed model). Assigned minimum first spike latencies were uniformly distributed across the population between 0 and the maximum allowed first spike latency. Each cell was prohibited from spiking prior to its assigned latency, but was free to spike anytime thereafter. To generate spike times for all model variants, we counted the number of spikes (k) occurring at each millisecond (i) in the template data (ki). Then, for each time bin, we randomly selected ki cells that were available to spike [i.e., time had exceeded cell's assigned latency and cell was not in a refractory period (40 ms)] and assigned spikes to those cells for time bin i. Drawing from the template spiking data in this way ensured that the number of interneuron spikes per millisecond was identical in all model variants. Each excitatory cell received input from 5% of the 1000 interneurons. The same connectivity matrix was used for all model variants.
For the stimulus discrimination analyses, we used spike count data occurring during the first 500 ms of stimulus presentation for analysis. This time frame was selected because it represents a behaviorally relevant timescale for olfactory discriminations (Abraham et al., 2004, 2010; Rinberg et al., 2006). Importantly, the relevant timescales for these behavioral decisions vary across studies, with some examples of discrimination occurring more rapidly (Uchida and Mainen, 2003). Thus, while the longest granule cell latencies reported here are perhaps the most mechanistically intriguing, shorter latency granule cell activity may also be important for certain behavioral tasks, such as simple odor discrimination. Given this variability in latency and in behavioral timescales, we also analyzed spike count data measured at time points ranging from 100 to 1000 ms. Classification accuracy was calculated by training a linear classifier on data from 50% of trials and using the other 50% of trials as a test set. Accuracy was defined as the portion of correct classifications for each stimulus.
Results
Granule Cells can Respond to Brief Stimulation with Long-Latency Spiking
Olfactory bulb inhibition is characterized by long-lasting barrages of GABAA receptor-mediated inhibitory postsynaptic currents (Isaacson and Strowbridge, 1998; Schoppa et al., 1998; Urban and Sakmann, 2002). Previously, we showed that the long duration of olfactory bulb inhibition is caused by widely distributed first spike latencies across the granule cell population (Kapoor and Urban, 2006). To investigate the mechanism controlling long-latency firing in granule cells, we used patch clamp techniques to characterize spiking activity and membrane potential preceding spiking activity (Figure 1A). To activate granule cells, we applied a brief current pulse to stimulate single glomeruli, activating the resident mitral and tufted cells while recording membrane potential responses in nearby granule cells.
Activated granule cells responded to glomerular stimulation with an initial depolarization that occurred immediately and decayed slowly (Figure 1B; stimulation time denoted by arrowhead; τrise = 48 ± 39 ms, ΔVm,peak = 19.2 ± 7.4 mV, τdecay = 2, 130 ± 163 ms; n = 11 cells). While the amplitude and time course of this depolarization were similar across cells, granule cell first spike latencies were widely variable across cells (ranging from 18 to 681 ms), yet reliable from trial-to-trial (average standard deviation across trials was 118.6 ± 88 ms). Eight trials from an example granule cell are shown in Figure 1C. As was the case in all our granule cell recordings, a large yet subthreshold depolarization occurred immediately following glomerular stimulation and temporally precise spiking occurred tens to hundreds of milliseconds later.
Latency of spiking activity in granule cells was similar to previous reports (Kapoor and Urban, 2006), even though the data we report here were collected from slices bathed in higher and more physiologically realistic concentrations of magnesium (1.0 mM vs. 0.2 mM). Spiking probability varied widely across activated cells, ranging from 3 to 88% (mean probability = 48%; n = 18 cells). Latency to first spike was reliable across trials and mean spike latencies ranged from 0 to 1000 ms (Figure 1D; mean first spike latency = 252 ± 171 ms, n = 18 cells). We observed only very weak correlations between first spike latency and spike probability (Figure 1E) or evoked firing rate (Figure 1F). Thus, granule cell recruitment following glomerular stimulation was characterized by a short latency, subthreshold depolarization, followed by temporally precise long-latency spiking.
Long-Latency Granule Cell Spiking is Driven by Long-Latency Excitation
We considered two possible mechanisms for long-latency spiking in granule cells. First, long-latency excitatory inputs could drive long-latency spiking. Late onset excitation could explain the temporal precision of long-latency activity, but no such source of long-latency excitation is known. Alternatively, long-latency spiking could result from an interaction between synaptic input and intrinsic cellular properties of granule cells (such as voltage-gated ion channels), allowing these cells to integrate their inputs at very long timescales (Storm, 1988; Molineux et al., 2005). To distinguish between these two possibilities, we recorded in current clamp during glomerular stimulation (to characterize spiking activity; Figure 2A) and in voltage clamp (to characterize synaptic currents; Figure 2B). As is shown for a single cell in Figures 2A,B, we observed a remarkable correspondence between granule cell first spike latency (spiking onset = 287 ± 89 ms) and the onset of long-latency fast excitatory post-synaptic currents (EPSCs; onset = 254 ± 88 ms).
In our voltage clamp recordings such as those shown in Figure 2B, we typically did not observe obvious fast EPSCs in the 0–200 ms time window, raising questions about the source of the early depolarization characteristic of granule cell recordings. However, when the voltage clamp traces are averaged (Figure 2C; lower), clear inward currents were observed immediately following glomerular stimulation in a pattern that closely matches the average time course of membrane potential depolarization (Figure 2C; upper). Thus, the initial slow depolarization may be due to a large pool of asynchronous and relatively weak excitatory inputs, making individual EPSCs difficult to identify. Alternatively, the prolonged subthreshold depolarization may be facilitated by slow calcium buffering in granule cells that promotes long-timescale depolarization. Prolonged subthreshold depolarizations have been observed in both granule cells (Egger, 2008) as well as mitral cells (Carlson et al., 2000) of the olfactory bulb. While a variety of mechanisms could account for this prolonged depolarization, we focused instead on the source and mechanism of late depolarizations because we wanted to understand the forces shaping spike timing in granule cells.
Across cells, EPSC onsets were widely distributed (mean EPSC onset = 282 ± 90 ms, n = 14 granule cells with identifiable EPSCs; Figure 2D) and correlated to first spike latency (r = 0.81, Spearman-rho test, n = 8 cells with identifiable EPSCs and spikes; Figure 2E). These findings provide support for the hypothesis that reliable, long-latency EPSCs cause precisely-timed long-latency spikes in granule cells.
Tufted Cells Drive Long-Latency Activity in Granule Cells
What is the source of long-latency synaptic excitation to granule cells? Two types of excitatory neurons have been described in the mouse olfactory bulb: mitral and tufted cells, with tufted cells coming in several subtypes (Shepherd, 2004). We began by recording from mitral cells that were activated by stimulation of a single glomerulus (Figure 3A; black). Consistent with our previous work (Kapoor and Urban, 2006), mitral cell spikes were observed at short latency following glomerular stimulation, making these cells an unlikely source of late excitation to granule cells (mean first spike latency = 68 ± 53 ms, n = 14 cells; Figure 3B; black).
Next, we looked for late onset spiking in tufted cells, focusing on middle tufted cells whose somata are located in the plexiform layer. In contrast to mitral cells, some tufted cells exhibited long first spike latencies following brief glomerular stimulation (Figure 3A; blue). The first spike latencies observed in the tufted cell population were widely distributed and ranged from 15 to 600 ms, with an average latency of 181 ± 146 ms and average standard deviation of 81 ± 78 ms (Figure 3B; blue n = 19 cells). The distribution of first spike latencies observed in tufted cells closely matched the observed distribution in granule cells (Kolmogorov–Smirnov test, p = 0.15). Thus, following glomerular stimulation, tufted cells are activated at widely distributed latencies. As such, they could provide distributed-latency excitation to granule cells, while mitral cells are restricted to providing relatively short-latency excitation.
We next sought to probe the relationship between tufted and granule cell firing more directly. We began by stimulating a single tufted cell via somatic current injection and searching for activated granule cells in a slice bulk-loaded with the calcium indicator dye Fura-2 AM. However, as might be expected from previous work (Isaacson and Strowbridge, 1998; Schoppa et al., 1998; Christie et al., 2001) we never observed granule cell activity following stimulation of single tufted cells (9 tufted cells, monitored 55 granule cells, 20–25 trials each). Since activity in a single tufted cell was insufficient to drive granule cell spiking, we hypothesized that granule cell activation may require convergent synaptic input from multiple sources: for example, one input that depolarizes granule cells to a subthreshold level (as seen in Figure 1B) and a long-latency source of suprathreshold excitation which determines spike timing (as seen in tufted cells; Figure 3B).
To look for examples of tufted cell activity driving granule cell spiking, we instead examined granule cell recruitment by single tufted cells following glomerular stimulation (Figure 3C). We placed an extracellular stimulation electrode into a glomerulus, and patched a nearby tufted cell that did not receive input from the stimulated glomerulus. We positioned the microscope over the granule cell layer and recorded fluorescence triggered to glomerular stimulation. On half of the trials, late onset action potentials were initiated in the tufted cell via strong somatic current injection 200 ms after glomerular stimulation, and on the other half of trials the tufted cell was kept at its resting potential, preventing firing. Because tufted cells only respond to glomerular stimulation with spiking on a subset of trials, this approach allowed us to closely control when tufted cells were active versus silent. In this way, we were able to observe how the timing of granule cell activity depended on the activity of a single tufted cell.
Using calcium imaging, we compared granule cell activity when the patched tufted cell was held at rest versus driven to spike. We searched for granule cells whose firing onset coincided with tufted cell stimulation and found several examples. In some granule cells (such as the granule cell shown in Figure 3D; gray traces), glomerular stimulation alone was insufficient to drive spiking, but reached threshold with the additional input from a single tufted cell (Figure 3D; blue traces). In other cases, granule cells exhibited reliable long-latency firing in response to glomerular stimulation alone. In these cells (like the one plotted in Figure 3E), adding tufted cell input prior to the glomerulus-specific latency shifted latency earlier to coincide with tufted cell stimulation. Lastly, in some granule cells, glomerular stimulation elicited short latency firing (like the granule cell shown in Figure 3F; gray traces). Thus, with glomerular stimulation alone, the activity of these granule cells was characterized as either short latency firing, or failure to fire. In these cells, the addition of late onset tufted cell input converted some of the trials (which would have been “failure” trials with no spiking) into long-latency trials (Figure 3F; blue traces). These examples demonstrate that the activity of a single tufted cell can determine first spike latency in granule cells.
In our data, we observed the three examples shown in Figure 3 out of 48 well-imaged granule cells. However, this is likely a significant underestimate of the prevalence of this effect because several factors limit our ability to identify these connections in slice. First, these interactions are only identified during post-hoc analysis. Given the low response probabilities of individual granule cells, it was not feasible to identify putative pairs from a few test trials and then ensure that these cells were in focus. Thus, we were limited to identifying pairs that happen to be in the selected plane of view. The low response probability also poses a problem because we cannot confidently identify a connected pair if a granule cell only responds on 1 trial. We restricted our analysis to cells that responded on at least three trials to avoid identifying spontaneous or unrelated activity as connections. Third, the number of identified pairs is reduced by our slice preparation, which severs dendrites and thus connections between tufted and granule cells. Lastly, our identification of connected tufted-granule pairs requires that the connected granule cell be sufficiently loaded with fura-2. Bulk loading only fills a random subset of neurons, which also limits the number of identified connections. Given these serious limitations in identifying tufted-granule pairs, we were quite pleased that we were able to identify the few connections that we did.
Intrinsic Biophysical Properties of Tufted Cells Drive Long-Latency Action Potential Generation
Our results support a model in which long-latency firing of granule cells is driven by the timing of synaptic excitation primarily from tufted (rather than mitral) cells. We wondered whether the observed differences in mitral and tufted cell latencies arose from cellular or circuit-level differences. We began by observing mitral cell responses to somatic step current injection rather than glomerular stimulation (Figure 4A, black). Spike latency varied as a function of firing rate with longer latencies for low firing rates and shorter latencies for higher firing rates (Figure 4B; black, n = 10 cells). We compared this relationship to the responses of tufted cells (Figures 4A,B blue, n = 12 cells) and observed that tufted cells had significantly longer latencies for matched firing rates (p < 0.05, K–S test). Mitral cell latencies were on average 36.7 ± 15% shorter than tufted cell latencies (p < 0.05 for firing rates between 1 and 18 Hz, t-test). Since latency differences between mitral and tufted cells persist without synaptic input, these results suggest that mitral and tufted cells differ in their intrinsic cellular properties, enabling long-latency firing in tufted but not mitral cells.
Numerous studies have implicated inactivation of voltage-gated potassium channels in regulating first spike latency using the potassium channel blocker 4-aminopyridine (4-AP). We wondered whether the latency differences between mitral and tufted cells could be altered with this drug, which blocks a number of potassium channels, mostly of the Kv1 family, at concentrations <100 μM (Storm, 1988; Schoppa and Westbrook, 1999; Balu et al., 2004). We found that when we repeated our experiment in the presence of 20 μM 4-AP (Figures 4A,B; red), tufted cell latencies were reduced to mitral cell levels (p = 0.5; K–S test). First spike latency reduction was frequency dependent, with maximum 4-AP-induced latency reductions occurring between 5 and 10 Hz (43 ± 3% reduction in latency, p < 0.05, t-test, n = 12 cells). Thus, a 20 μM concentration of 4-AP was sufficient to rectify the latency differences between mitral and tufted cells. We also observed a reduction in first spike latency when we applied 4-AP to mitral cells (Figure 4B; maroon triangles). This suggests that both mitral and tufted cells express potassium channels sensitive to micromolar concentrations of 4-AP, but that their expression or sensitivity is higher in tufted cells.
These findings suggest that long-latency activation is at least in part an intrinsic property of tufted cells that relies on inactivation of a 4-AP-sensitive current. This is consistent with previously reported results that application of 4-AP significantly reduces granule cell latencies (Kapoor and Urban, 2006). Our data suggest that 4-AP application might reduce granule cell latencies by shortening the temporal distribution of tufted cell inputs to granule cells. However, additional mechanisms may also participate. For example, application of 4-AP might promote long-latency spiking in a previously silent cell. Alternatively, 4-AP may act in part by reducing the intrinsic latencies of mitral and tufted cells. In either case, our results provide support that reductions in tufted cell latency also participate in this phenomenon. Intrinsic long-latency responses distinguish the responses of tufted cells from mitral cells and provide a mechanistic substrate for promoting long-latency spiking in the olfactory bulb.
Long-Latency Inhibition Improves Stimulus Discrimination
Thus far, we have described how long-latency inhibition is generated in the olfactory bulb network. We next sought to ask how long-latency inhibition might confer advantages for ethologically relevant behaviors like olfactory discrimination. To address this question, we built a computational model that allowed us to investigate how population coding is affected by altering the distribution of interneuron latency. Our model consisted of 100 leaky integrate-and-fire neurons (LIFs; simulated mitral cells) and 1000 inhibitory interneurons. Each model mitral cell was connected to inhibitory neurons with 5% probability.
To mimic granule cell responses for many different stimuli (Kapoor and Urban, 2006), each interneuron was randomly assigned a stimulus-specific response latency for 100 stimuli. Thus, a given interneuron responded with one stereotyped latency for stimulus A, and a different latency for stimulus B, etc. In this way, each stimulus generated a pattern of inhibition that was equal in magnitude, but unique in the temporal patterning of interneuron latency.
The range of granule cell latencies that we observed here were consistent with previous reports of granule cell latencies ranging between 0 and 1000 ms (Kapoor and Urban, 2006). These data were collected in a slice preparation, where excitability and the number of intact connections is less than might be observed in vivo. Because the range of granule cell latencies might differ in the intact animal, we wished to investigate other latency ranges as well. To probe the effects of latency distribution, we generated these stimulus-specific interneuron responses for a variety of latency ranges (spike rasters of interneuron population for a single stimulus plotted in Figure 5A). The model with the narrowest distribution restricted interneuron latencies to between 0 and 200 ms (Figure 5A; black bar) while in the most widely distributed model (based on granule cell physiology) latencies ranged from 0 to 1000 ms (Figure 5A; red bar). Importantly, the firing rate of each interneuron was identical across models (i.e., if a model granule cell emits three spikes in the narrowly distributed case, it also emits three spikes in the widely distributed case). Further, the population activity across time was kept identical (i.e., all model variants generate the same total number of interneuron spikes/ms). All model variants had equal granule cell inter-spike interval distributions. This setup allowed us to investigate very specifically how the distribution of interneuron latency affects mitral cell firing while keeping the total amount of inhibition and connectivity identical.
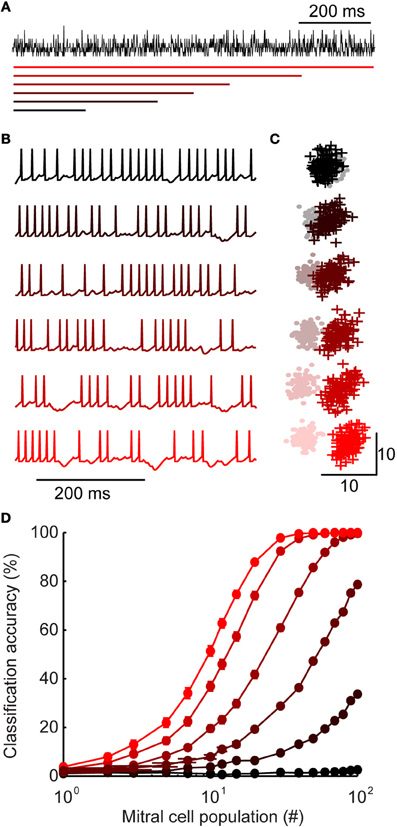
Figure 5. Inhibition with widely distributed latency improves stimulus discrimination. (A) Generating inhibition. For each stimulus, a population spiking template is generated (shown here in black). Model granule cell spike times are assigned such that the sum of all spikes is equal to the peri-stimulus time histogram template. While the total spiking is equal across model variants, they differ in the range of first spike latencies (shown with colored bars, below). First spike latencies ranged between 0 and (from bottom to top) 200, 400, 500, 600, 800, or 1000 ms. (B) Example of mitral cell spike trains receiving inhibition from each model variant shown in A. (C) First two principal components of mitral cell population firing for one pair of stimuli. Stimulus 1 = +; stimulus 2 = •. For each model variant, 100 trials are plotted per stimulus. (D) Classification accuracy of 100 stimuli as a function of population size. Colors correspond to model variants plotted in A–C. Bars denote s.e.m.
Mitral cells receiving narrowly distributed inhibition (Figure 5A; upper) tended to fire more regularly (Figure 5B; upper), while widely distributed inhibition caused gaps in firing at various points throughout stimulus presentation (Figure 5B; lower). Notably, this type of firing—with epochs of high and low firing—is typical of odor-evoked responses (Margrie et al., 2001; Wilson and Laurent, 2005). In our widely distributed models, temporal variability in spiking arose because some mitral cells received inhibition primarily during one portion of a trial (for example, if by chance most inputs are early onset granule cells). Despite these differences in temporal variability, each mitral cell received the same total amount of inhibition in each model and mean mitral cell firing rates were equal in all model variants.
Given this transfer of temporal variability, we were interested in how it may impact population coding (Kunsting and Spors, 2009). To investigate population-level encoding, we first visualized stimulus-evoked activity patterns using principal component analysis of model mitral cell firing. This gave us a low-dimensional representation of population responses (example of two stimuli shown in Figure 5C). Each point denotes the population response to stimulus 1 (+) or stimulus 2 (•) on a single trial. Since there is some variability in population responses from trial-to-trail, each stimulus occupies a “cloud” of space. When two clouds are overlapping (as can be seen in the most narrowly distributed network, Figure 5C; upper), the population responses are ambiguous and discrimination is difficult. As the range of interneuron latencies was increased to olfactory bulb levels (Figure 5C; lower), the same pair of stimuli become readily separable. Together, these results illustrate that widely-distributed latency is a simple and intuitive mechanism for increasing temporal variability and improving discriminability.
We used a linear discriminant analysis on the unprocessed data (spike count vectors without reducing dimensionality) to quantify the encoding performance. We examined the classification accuracy as a function of mitral cell population size for each model (Figure 5D). While the classifier reached near perfect accuracy with as few as 30 cells in the most widely distributed latency condition (red), it performed at chance levels in the narrowest latency network, even when all of the mitral cell data was available.
We wanted to verify that the advantage of latency coding does not depend critically on the specific timescales of inhibition or behavior that we chose to model olfactory bulb physiology. The analyses shown in Figure 5 were calculated using spike count vectors over a 500 ms time window. We selected this time frame based on certain behavioral studies indicating that difficult discriminations can require these long time frames to be accomplished (Abraham et al., 2004; Rinberg et al., 2006). However, the relevant timescales for olfactory discrimination remain debated, with evidence that in some cases, difficult binary discriminations may not in fact require these extended time frames, but are instead accomplished within the duration of a single sniff (150–200 ms) (Uchida and Mainen, 2003; Uchida et al., 2006). Since the timescales of perceptual decisions appear to range widely in different conditions, we wanted to understand how latency distribution would affect classification accuracy across short, medium, and long timescales. To this end, we measured classification on the spike count vectors after a wide range of time points (Figure 6A). While classification accuracy varies as a function of time intervals in the behaviorally relevant range, accuracy improves when longer latencies are available (lighter colors toward top of plot). Thus, widely-distributed inhibition may be advantageous across a wide range of behaviorally relevant timescales.
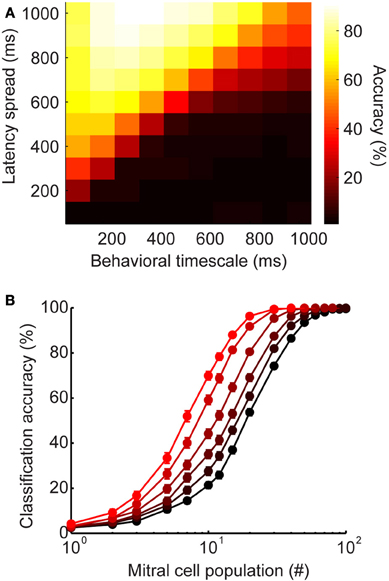
Figure 6. Latency-induced improvements are robust to changes in parameters and stimulus generation. (A) Heatmap of classification accuracy for varying ranges of latency spread at different behavioral time points. (B) Alternate stimulus generation. Each stimulus has a stimulus-specific latency pattern (as seen in Figure 5), as well as a stimulus-specific subset of active interneurons. Here, each stimulus recruits only 50% of model granule cells. Classification accuracy as a function of mitral cell population size. Colors correspond to latency ranges in Figure 5 (200, 400, 500, 600, 800, 1000 ms).
Our model was designed to mimic the stimulus-specific interneuron latency patterns observed in the olfactory bulb (Kapoor and Urban, 2006). That is, each stimulus evokes a distinct temporal sequence on interneuron recruitment. We selected this method of stimulus generation because it allowed us to directly probe the influence of latency distribution on stimulus discrimination. However, olfactory stimuli evoke stimulus-specific subsets of interneurons in addition to stimulus-specific latency patterns. To verify that our results were robust to different methods of stimulus generation, we modified our model so that only 50% of the 1000 model granule cells were active for each stimulus. As before, each interneuron was assigned a stimulus-specific latency for each stimulus, and we tested latency ranges from 0 to 200, 400, 500, 600, 800, and 1000 ms. Additionally, a stimulus-specific subset of 500 interneurons was designated to be silent for each stimulus. In this way, we were able to mimic both stimulus-specific latency and stimulus-specific subsets of active interneurons. All of the models showed better classification accuracy when both latency and the activated subset of interneurons were stimulus-specific (Figure 6B, compared to Figure 5D). However, the advantage of widely distributed inhibition is still clear—while all latency ranges reach near perfect accuracy when the full population is available, accuracy still varies as a function of latency range for smaller population sizes. These results suggest that stimulus-specificity with respect to interneuron recruitment and interneuron latency both act to improve encoding.
Discussion
Long-latency inhibition in the olfactory bulb arises from a simple circuit mechanism whereby glomerular stimulation drives two types of output: short latency spiking in mitral cells, and variable onset spiking from tufted cells. These two types of excitation provide a mechanistic substrate for long-latency spiking in granule cells, which is driven by early onset subthreshold depolarization followed by late onset excitatory inputs that drive precise spiking. The results reported here make an important advance over our previous work by highlighting the role of middle tufted cells as a source of long-latency excitation in the olfactory bulb. Interestingly, the mechanism driving long-latency activity is intrinsic for tufted cells, and synaptic for granule cells. This mechanism accounts for the distribution of first spike latencies observed in granule cells, as well as their striking glomerular specificity (Kapoor and Urban, 2006). Here, we focus on the impact of widely distributed interneuron latencies from the perspective of mitral cells receiving this type of inhibition. However, tufted cells also project to cortex (Ekstrand et al., 2001; Shin Nagayama et al., 2010), adding additional complexity to the temporal properties of odor-evoked activity.
Although physiological differences between mitral and tufted cells have been reported previously (Nagayama et al., 2004; Griff et al., 2008), to our knowledge our results are the first to suggest a specialized role of tufted cell in the recruitment of inhibitory circuits. The reliance of this mechanism on the intrinsic properties of tufted cells raises additional possibilities for temporal patterning via network state, neuromodulatory inputs, or simply by residual changes in the resting potential from prior activity. The differences in first spike latency that we observe between mitral and tufted cells are somewhat surprising, given the fact that tufted cell activity has been observed to precede mitral cell activity in a number of studies (De Saint Jan et al., 2009; Gire et al., 2012). Importantly, these studies typically report the activity of external tufted cells, whereas we recorded from middle tufted cells. Our examination of the intrinsic properties of middle tufted cells suggests that they can scale their latency more linearly with firing rate (Figure 4B), independent of inputs. Whether the strength or timing of peripheral inputs differs between mitral and tufted cells would be a very interesting issue for future study.
While our results suggest that granule cell recruitment often involves a combination of mitral and tufted cell-mediated inputs, they do not exclude the possibility that other combinations of inputs could drive granule cell activity. For example, our previous work demonstrated that stimulation of a single mitral cell (in the presence of low magnesium solution) was sufficient to elicit long-latency firing in granule cells (Kapoor and Urban, 2006). One possibility is that stimulation of a single mitral cell causes dendritic glutamate release within the glomerulus, which may cause slow depolarization and long-latency spiking of tufted cells terminating within the same glomerulus to drive late spiking in granule cells. Alternatively, given sufficient mitral cell inputs and a low firing threshold (perhaps facilitated by the low magnesium condition used in our previous study), a granule's latency might be determined by mitral cell firing alone. By the same token, having many tufted cell inputs to a granule cell could provide both early, subthreshold excitation, as well as late, suprathreshold excitation.
Long timescale activity in granule cells may also be influenced by their slow calcium-dependent depolarization mechanisms (Stroh et al., 2012). Calcium influx is a critical step in action potential generation, and these calcium transients typically decay rapidly following spiking activity. However, granule cell calcium signals decay slowly due to slow calcium extrusion (Egger and Stroh, 2009) and TRPC channels (Stroh et al., 2012). The long lasting calcium transients in granule cell dendrites and individual spines may foster long timescale activation of granule cells. This may be important for granule cell physiology by giving rise to asynchronous recruitment of large populations of granule cells or even asynchronous release from individual spines within a granule cell. Unfortunately, the role of these additional mechanisms is difficult to estimate because paired recordings between granule cells and mitral or tufted cells have not been feasible. In the future, a more detailed knowledge of the connectivity and synaptic strengths between granule cells and mitral cells as well as between granule cells and tufted cells would help clarify these issues. However, the striking correspondence of first spike latency distributions between granule cells and tufted cells suggests that for a wide range of timescales, tufted cell input can account for granule cell first spike latency.
Our computational model demonstrates that latency coding in inhibitory interneurons can improve stimulus discriminability. Here, we have based simulations on a highly simplified representation of the olfactory circuit. While this model lacks detailed features of olfactory bulb physiology, it has the advantage of allowing us to evaluate the benefits of latency coding in isolation from other potential effects on inhibition. Several aspects of interneuron latency patterns, such as the width and shape of granule cell latency distributions, may be different in awake, behaving animals. Importantly, the classification improvements mediated by widely distributed interneuron latencies do not depend critically on these details. As shown in Figure 6A, this strategy is effective at improving classification accuracy across a wide variety of behavioral timescales, as well as across diverse latency ranges. These same effects can be accomplished by much smaller populations of model granule cells. Thus, interneuron latency patterns are a simple and flexible mechanism that can be used to improve classification accuracy across a wide range of conditions.
The observed improvements in stimulus encoding are a surprising consequence of long-latency inhibition. Inhibition is believed to improve olfactory encoding by a variety of mechanisms including tuning curve sharpening, lateral inhibition, and shaping pattern correlations (Laurent, 2002; Wiechert et al., 2010). One might anticipate that a network would benefit from enacting any of these mechanisms immediately following stimulus presentation. Our results suggest that inhibitory latency coding can work in concert with these known mechanisms to further decorrelate stimulus representations and that distributed latency inhibition actually increases the magnitude of decorrelation. Just as a symphony orchestra can play a more complex piece of music when different sections of the orchestra are cued at different times, the olfactory bulb can encode more complex stimuli when granule cells vary in their first spike latency.
The results described here are based on data collected from olfactory bulb slices. This preparation is extremely useful in that the activity of single cells can be closely controlled and monitored, yielding useful insight into the physiological properties governing olfactory bulb responses. However, the limitations of this preparation are worth noting, as slicing olfactory bulb tissue alters and omits several aspects of olfactory processing. First, slicing alters cell morphology by severing neuronal processes. Severing of dendrites might be particularly common in the olfactory bulb preparation because the lateral dendrites of mitral and tufted cells can span very long distances (up to 1000 μm) from the cell body. Secondly, this preparation does not take into account the temporal patterning established by primary sensory inputs (from respiration-coupled oscillations and olfactory receptor neuron latency patterns) or centrifugal inputs from cortex. In the present study, we have focused elucidating the mechanisms responsible for the distributed-latency phenomenon previously described in an in vitro preparation. To this end, we have studied responses to isolated, rather than rhythmic stimulation of the olfactory bulb. However, these inputs could shape temporal patterning in additional—and perhaps stimulus-specific—ways.
In particular, the respiratory cycle may act as an important influence on further shaping the granule cell latency patterns observed in slice. The timescales of depolarization in mitral, tufted, and granule cells are quite long, taking many hundreds to thousands of milliseconds to return to baseline. This timescale is significantly longer than the sampling periods dictated by the respiratory cycle, even during passive breathing (Wesson et al., 2008). The potential utility of this phenomenon is that each sniff may not be a repeat of the previous sniff, but rather a relatively new sample. The ability of the olfactory bulb to generate long-lasting activity patterns following brief stimulation might also facilitate the generation of temporally rich responses following limited sampling of odors (Karpov, 1980; Laing, 1986; Uchida and Mainen, 2003; Abraham et al., 2004).
Importantly, the improvement in encoding reported in our model is likely an underestimate of the improvement in vivo because there, latency is subject to additional forms of modulation. For example, latency differences have been reported at the level of olfactory receptor neuron inputs to the olfactory bulb (Spors et al., 2006). These two forms of latency could work together to drive even more complex and dynamic activity patterns. Further, the activity-dependent recruitment of inhibitory circuits can likely magnify latency differences (Arevian et al., 2008). Together, these multiple stages of temporal patterning could work together to generate temporal patterning at a behaviorally relevant timescale.
Conflict of Interest Statement
The authors declare that the research was conducted in the absence of any commercial or financial relationships that could be construed as a potential conflict of interest.
Acknowledgments
This work was supported by grants from the National Institute of Deafness and Other Communication Disorders R01 DC0005798 (Nathaniel N. Urban), the National Institute on Drug Abuse T90DA022762 (Sonya Giridhar) and an Andrew Mellon Predoctoral Fellowship (Sonya Giridhar).
References
Abraham, N. M., Egger, V., Shimshek, D. R., Renden, R., Fukunaga, I., Sprengel, R., Seeburg, P. H., Klugmann, M., Margrie, T. W., Schaefer, A. T., and Kuner, T. (2010). Synaptic inhibition in the olfactory bulb accelerates odor discrimination in mice. Neuron 65, 399–411.
Abraham, N. M., Spors, H., Carleton, A., Margrie, T. W., Kuner, T., and Schaefer, A. T. (2004). Maintaining accuracy at the expense of speed: stimulus similarity defines odor discrimination time in mice. Neuron 44, 865–876.
Arevian, A. C., Kapoor, V., and Urban, N. N. (2008). Activity-dependent gating of lateral inhibition in the mouse olfactory bulb. Nat. Neurosci. 11, 80–87.
Balu, R., Larimer, P., and Strowbridge, B. W. (2004). Phasic stimuli evoke precisely timed spikes in intermittently discharging mitral cells. J. Neurophysiol. 92, 743.
Brody, C. D., and Hopfield, J. J. (2003). Simple networks for spike-timing-based computation, with application to olfactory processing. Neuron 37, 843–852.
Buonomano, D. V. (2000). Decoding temporal information: a model based on short-term synaptic plasticity. J. Neurosci. 20, 1129.
Carlson, G. C., Shipley, M. T., and Keller, A. (2000). Long-lasting depolarizations in mitral cells of the rat olfactory bulb. J. Neurosci. 20, 2011–2021.
Castro, J. B., Hovis, K. R., and Urban, N. N. (2007). Recurrent dendrodendritic inhibition of accessory olfactory bulb mitral cells requires activation of group I metabotropic glutamate receptors. J. Neurosci. 27, 5664–5671.
Chechik, G., Anderson, M. J., Bar-Yosef, O., Young, E. D., Tishby, N., and Nelken, I. (2006). Reduction of information redundancy in the ascending auditory pathway. Neuron 51, 359–368.
Chen, T. W., Lin, B. J., and Schild, D. (2009). Odor coding by modules of coherent mitral/tufted cells in the vertebrate olfactory bulb. Proc. Natl. Acad. Sci. U.S.A. 106, 2401.
Christie, J. M., Schoppa, N. E., and Westbrook, G. L. (2001). Tufted cell dendrodendritic inhibition in the olfactory bulb is dependent on NMDA receptor activity. J. Neurophysiol. 85, 169.
De Saint Jan, D., Hirnet, D., Westbrook, G. L., and Charpak, S. (2009). External tufted cells drive the output of olfactory bulb glomeruli. J. Neurosci. 29, 2043–2052.
Egger, V. (2008). Synaptic sodium spikes trigger long lasting depolarizations and slow calcium entry in rat olfactory bulb granule cells. Eur. J. Neurosci. 27, 2066–2075.
Egger, V., and Stroh, O. (2009). Calcium buffering in rodent olfactory bulb granule cells and mitral cells. J. Physiol. 587, 4467–4479.
Ekstrand, J. J., Domroese, M. E., Johnson, D. M. G., Feig, S. L., Knodel, S. M., Behan, M., and Haberly, L. B. (2001). A new subdivision of anterior piriform cortex and associated deep nucleus with novel features of interest for olfaction and epilepsy. J. Comp. Neurol. 434, 289–307.
Friedrich, R. W., and Laurent, G. (2001). Dynamic optimization of odor representations by slow temporal patterning of mitral cell activity. Science 291, 889–894.
Furukawa, S., and Middlebrooks, J. C. (2002). Cortical representation of auditory space: information-bearing features of spike patterns. J. Neurophysiol. 87, 1749.
Galan, R. F., Fourcaud-Trocme, N., Ermentrout, G. B., and Urban, N. N. (2006). Correlation-induced synchronization of oscillations in olfactory bulb neurons. J. Neurosci. 26, 3646–3655.
Gawne, T. J., Kjaer, T. W., and Richmond, B. J. (1996). Latency: another potential code for feature binding in striate cortex. J. Neurophysiol. 76, 1356.
Gire, D. H., Franks, K. M., Zak, J. D., Tanaka, K. F., Whitesell, J. D., Mulligan, A. A., Hen, R., and Schoppa, N. E. (2012). Mitral cells in the olfactory bulb are mainly excited through a multistep signaling path. J. Neurosci. 32, 2964–2975.
Gollisch, T., and Meister, M. (2008). Rapid neural coding in the retina with relative spike latencies. Science 319, 1108.
Griff, E. R., Mafhouz, M., and Chaput, M. A. (2008). Comparison of identified mitral and tufted cells in freely breathing rats: II. Odor-evoked responses. Chem. Senses 33, 793.
Heil, P., and Irvine, D. R. F. (1996). On determinants of first-spike latency in auditory cortex. Neuroreport 7, 3073.
Isaacson, J. S., and Strowbridge, B. W. (1998). Olfactory reciprocal synapses: dendritic signaling in the CNS. Neuron 20, 749–761.
Johansson, R. S., and Birznieks, I. (2004). First spikes in ensembles of human tactile afferents code complex spatial fingertip events. Nat. Neurosci. 7, 170–177.
Junek, S., Kludt, E., Wolf, F., and Schild, D. (2010). Olfactory coding with patterns of response latencies. Neuron 67, 872–884.
Kapoor, V., and Urban, N. N. (2006). Glomerulus-specific, long-latency activity in the olfactory bulb granule cell network. J. Neurosci. 26, 11709–11719.
Karpov, A. P. (1980). “Analysis of neuron activity in the rabbitæs olfactory bulb during food-acquisition behavior,” in Neural Mechanisms of Goal-Directed Behavior, eds R. Thompson, L. Hicks, and S. VB (New York, NY: Academic Press), 273–282.
Kunsting, T., and Spors, H. (2009). Dynamics of input patterns modulate the behavior of a model of olfactory bulb function. J. Neurophysiol. 102, 100–109.
Laing, D. G. (1986). Identification of single dissimilar odors is achieved by humans with a single sniff. Physiol. Behav. 37, 163–170.
Laurent, G. (2002). Olfactory network dynamics and the coding of multidimensional signals. Nat. Rev. Neurosci. 3, 884–895.
Laurent, G., Wehr, M., and Davidowitz, H. (1996). Temporal representations of odors in an olfactory network. J. Neurosci. 16, 3837–3847.
Lin, D. Y., Shea, S. D., and Katz, L. C. (2006). Representation of natural stimuli in the rodent main olfactory bulb. Neuron 50, 937–949.
Luo, M., and Katz, L. C. (2001). Response correlation maps of neurons in the mammalian olfactory bulb. Neuron 32, 1165–1179.
Margrie, T. W., Sakmann, B., and Urban, N. N. (2001). Action potential propagation in mitral cell lateral dendrites is decremental and controls recurrent and lateral inhibition in the mammalian olfactory bulb. Proc. Natl. Acad. Sci. U.S.A. 98, 319.
Margrie, T. W., and Schaefer, A. T. (2003). Theta oscillation coupled spike latencies yield computational vigour in a mammalian sensory system. J. Physiol. 546, 363.
Molineux, M. L., Fernandez, F. R., Mehaffey, W. H., and Turner, R. W. (2005). A-type and T-type currents interact to produce a novel spike latency-voltage relationship in cerebellar stellate cells. J. Neurosci. 25, 10863.
Mombaerts, P., Wang, F., Dulac, C., Chao, S. K., Nemes, A., Mendelsohn, M., Edmondson, J., and Axel, R. (1996). Visualizing an olfactory sensory map. Cell 87, 675–686.
Nagayama, S., Takahashi, Y. K., Yoshihara, Y., and Mori, K. (2004). Mitral and tufted cells differ in the decoding manner of odor maps in the rat olfactory bulb. J. Neurophysiol. 91, 2532.
Nusser, Z., Kay, L. M., Laurent, G., Homanics, G. E., and Mody, I. (2001). Disruption of GABA(A) receptors on GABAergic interneurons leads to increased oscillatory power in the olfactory bulb network. J. Neurophysiol. 86, 2823–2833.
Panzeri, S., Petersen, R. S., Schultz, S. R., Lebedev, M., and Diamond, M. E. (2001). The role of spike timing in the coding of stimulus location in rat somatosensory cortex. Neuron 29, 769–777.
Petersen, R. S., Panzeri, S., and Diamond, M. E. (2002). Population coding in somatosensory cortex. Curr. Opin. Neurobiol. 12, 441–447.
Rinberg, D., Koulakov, A., and Gelperin, A. (2006). Speed-accuracy tradeoff in olfaction. Neuron 51, 351–358.
Schaefer, A. T., and Margrie, T. W. (2007). Spatiotemporal representations in the olfactory system. Trends Neurosci. 30, 92–100.
Schoppa, N. E., Kinzie, J. M., Sahara, Y., Segerson, T. P., and Westbrook, G. L. (1998). Dendrodendritic inhibition in the olfactory bulb is driven by NMDA receptors. J. Neurosci. 18, 6790.
Schoppa, N. E., and Westbrook, G. L. (1999). Regulation of synaptic timing in the olfactory bulb by an A-type potassium current. Nat. Neurosci. 2, 1106–1113.
Shepherd, G. M. (2004). The Synaptic Organization of the Brain. New York, NY: Oxford University Press.
Shin Nagayama, A. E., Fletcher, M. L., Masurkar, A. V., Igarashi, K. M., Mori, K., and Chen, W. R. (2010). Differential axonal projection of mitral and tufted cells in the mouse main olfactory system. Front. Neural Circuits 4:120. doi: 10.3389/fncir.2010.00120
Shusterman, R., Smear, M. C., Koulakov, A. A., and Rinberg, D. (2011). Precise olfactory responses tile the sniff cycle. Nat. Neurosci. 14, 1039–1044.
Spors, H., and Grinvald, A. (2002). Spatio-temporal dynamics of odor representations in the mammalian olfactory bulb. Neuron 34, 301–315.
Spors, H., Wachowiak, M., Cohen, L. B., and Friedrich, R. W. (2006). Temporal dynamics and latency patterns of receptor neuron input to the olfactory bulb. J. Neurosci. 26, 1247.
Stopfer, M., Bhagavan, S., Smith, B. H., and Laurent, G. (1997). Impaired odour discrimination on desynchronization of odour-encoding neural assemblies. Nature 390, 70–74.
Storm, J. F. (1988). Temporal integration by a slowly inactivating K+ current in hippocampal neurons. Nature 336, 379–381.
Stroh, O., Freichel, M., Kretz, O., Birnbaumer, L., Hartmann, J., and Egger, V. (2012). NMDA Receptor-dependent synaptic activation of TRPC channels in olfactory bulb granule cells. J. Neurosci. 32, 5737–5746.
Thorpe, S. J., and Gautrais, J. (1997). “Rapid visual processing using spike asynchrony,” in Advances in Neural Information Processing Systems, Vol. 9, eds M. C. Mozer, M. Jordan, and T. Petsche (Cambridge, MA: MIT Press), 901–907.
Uchida, N., Kepecs, A., and Mainen, Z. F. (2006). Seeing at a glance, smelling in a whiff: rapid forms of perceptual decision making. Nat. Rev. Neurosci. 7, 485–491.
Uchida, N., and Mainen, Z. F. (2003). Speed and accuracy of olfactory discrimination in the rat. Nat. Neurosci. 6, 1224–1229.
Urban, N. N., and Sakmann, B. (2002). Reciprocal intraglomerular excitation and intra-and interglomerular lateral inhibition between mouse olfactory bulb mitral cells. J. Physiol. 542, 355.
Van Rullen, R., Gautrais, J., Delorme, A., and Thorpe, S. (1998). Face processing using one spike per neurone. Biosystems 48, 229–239.
Wellis, D. P., Scott, J. W., and Harrison, T. A. (1989). Discrimination among odorants by single neurons of the rat olfactory bulb. J. Neurophysiol. 61, 1161–1177.
Wesson, D. W., Donahou, T. N., Johnson, M. O., and Wachowiak, M. (2008). Sniffing behavior of mice during performance in odor-guided tasks. Chem. Senses 33, 581–596.
Wiechert, M. T., Judkewitz, B., Riecke, H., and Friedrich, R. W. (2010). Mechanisms of pattern decorrelation by recurrent neuronal circuits. Nat. Neurosci. 13, 1003–1010.
Keywords: olfactory bulb, inhibition, latency, coding
Citation: Giridhar S and Urban NN (2012) Mechanisms and benefits of granule cell latency coding in the mouse olfactory bulb. Front. Neural Circuits 6:40. doi: 10.3389/fncir.2012.00040
Received: 09 March 2012; Accepted: 10 June 2012;
Published online: 27 June 2012.
Edited by:
Rainer Friedrich, Friedrich Miescher Institute for Biomedical Research, SwitzerlandReviewed by:
Hartwig Spors, Max Planck Institute of Biophysics, GermanyDinu F. Albeanu, Cold Spring Harbor Laboratory, USA
Andreas Schaefer, Max Planck Institute for Medical Research, Germany
Copyright: © 2012 Giridhar and Urban. This is an open-access article distributed under the terms of the Creative Commons Attribution Non Commercial License, which permits non-commercial use, distribution, and reproduction in other forums, provided the original authors and source are credited.
*Correspondence: Nathaniel N. Urban, Center for the Neural Basis of Cognition, 173 Mellon Institute, Carnegie Mellon University, 4400 5th Avenue, Pittsburgh, PA 15213, USA. e-mail: nurban@cmu.edu